
Abstract
Objective
To evaluate the relationship between alanine transaminase (ALT) level and biphasic insulin secretion (BPIS) in healthy elderly Han Chinese individuals.
Methods
This cross-sectional study enrolled healthy elderly participants aged ≥60 years that were part of a health examination programme. In order to explore the correlation and severity of the clinical condition, those with any possible confounding factors known to affect insulin secretion or liver function were excluded from the study. BPIS was calculated using an equation developed previously by this research team.
Results
This study enrolled 39 845 healthy elderly individuals (19 058 males and 20 787 females). Participants were stratified into four quartile groups according to their ALT level. In both males and females, the increasing ALT quartiles (ordinal variable) were associated with greater values of log-transformed first-phase insulin secretion (FPIS) and second-phase insulin secretion (SPIS). The correlation and the linear regression model showed that increasing ALT level was significantly correlated with higher log-transformed FPIS and SPIS.
Conclusions
ALT was positively correlated with BPIS in a healthy elderly population in both men and women. Elevated ALT may serve as an indicating factor for developing metabolic syndrome and type 2 diabetes mellitus in healthy elderly individuals.
Keywords
Introduction
Type 2 diabetes mellitus (T2DM) is characterized by hyperglycaemia resulting from defects in insulin secretion and insulin sensitivity. 1 Over the past few decades, the prevalence of ‘diabesity’ (i.e. diabetes-related to obesity) has increased considerably because of the global obesity epidemic. 2 Among the population of elderly people, it increases the risk for atherosclerotic cardiovascular disease, the leading cause of morbidity and mortality in T2DM. 3 Thus, to understand the underlying pathophysiology of T2DM is of major concern to healthcare providers and governments.
It should be noted that under intravenous glucose administration, there are two phases of insulin secretion. 4 The first-phase insulin secretion (FPIS) is the initial burst of insulin, released in the first 5 to 10 min in response to a rapid increase in glucose level. 4 The second-phase insulin secretion (SPIS) comes later, which elevates gradually and becomes a sustained component of blood insulin level. 4 The FPIS response is beneficial not only because it ensures a prompt supply of insulin in response to glucose, but also because it inhibits hepatic glucose production. 5 A previous study validated the different roles of the two phases of insulin secretion. 6 By using a sophisticated method, the pancreatic clamp, the study induced a ‘selective deficiency of SPIS’ in dogs. 6 The authors concluded that, although the FPIS was important, diminished SPIS resulted in a continuous and dramatic increase of blood glucose. 6 In the early stages of T2DM, it is commonly noted that FPIS is impaired despite an increasing SPIS.7,8 The loss of FPIS results in a prolonged postprandial hyperglycaemia, which is associated with increased all-cause and cardiovascular mortality. 9 In contrast, restoration of the FPIS may improve blood glucose stability. For example, studies have shown that insulinotropic agents, such as repaglinide and pioglitazone, enhance FPIS and achieve better blood glucose control.10,11
Abnormal liver function, commonly seen in clinical practice, is estimated to have a prevalence of approximately 10–21% worldwide. 12 The leading cause is nonalcoholic fatty liver disease (NAFLD), which accounts for 50–90% of all abnormal liver function. 13 NAFLD can either be simple steatosis without inflammation, nonalcoholic steatohepatitis and/or advanced fibrosis. 14 Research published in early 1946 demonstrated a positive relationship between higher liver enzymes and the occurrence of diabetes mellitus. 15 After this first publication, many other studies confirmed the earlier results.16,17 NAFLD is now generally considered to be the hepatic manifestation of metabolic syndrome (MetS), a condition that includes insulin resistance, obesity and dyslipidaemia. 18 In addition, elevated liver enzymes are a risk factor for T2DM, which suggests a potential role of increased hepatic gluconeogenesis and/or inflammation in the pathogenesis of T2DM. 17 Among all of the liver enzymes, alanine aminotransferase (ALT) is the most indicative of hepatocellular damage.19,20
Although the strong association between NAFLD and all components of MetS and cardiovascular diseases in the general population is well known,18,21 there are few studies focusing on the relationship between liver function and biphasic insulin secretion (BPIS; FPIS and SPIS). The aim of this current study was to investigate the relationship between liver enzymes and BPIS in a population of healthy elderly individuals without any cardiovascular disease that were not receiving medications known to affect insulin secretion or liver function. The reason for not including individuals that were receiving drug treatments for underlying diseases was that the laboratory data might be affected by the medications and the findings would then not reflect the true severity of the clinical condition. Furthermore, as the prevalence of T2DM increases with age and global populations are increasing in age, 22 it was considered important to investigate an elderly target population in the current study.
Patients and methods
Study participants
This cross-sectional study enrolled consecutive healthy adult participants from the Han Chinese population aged ≥60 years from a standard health examination programme at the Tri-Service General Hospital (TSGH) and Cardinal Tien Hospital (CTH) between January 1999 and December 2019. TSGH is a north Taiwan medical centre and CTH is a north Taiwan district hospital. Participants were identified via their medical records. The process of selection was under meticulous criteria to exclude any potential confounders. The inclusion criteria were as follows: (i) aged ≥60 years; (ii) Han Chinese population. The exclusion criteria were as follows: (i) a history of significant major medical diseases, including hypertension and diabetes mellitus; (ii) hepatitis B or C virus carrier; (iii) participants that were receiving medications for major diseases; (iv) participants with an acute illness, such as fever, cholecystitis, recent hepatitis A virus infection; (v) abnormal hydration status; (vi) participants with a history of current or past excessive alcohol consumption (>20 g/day for men and >10 g/day for women on average); (vii) participants with incomplete information (either questionnaire, anthropometric measurements or laboratory data). The categories of medications considered to potentially alter insulin concentration included corticosteroids, diuretics, β-blockers, second-generation antipsychotics, anticonvulsants and hormone replacement therapy. Medications that might potentially cause liver damage were statins, antifungal agents, herbal medicines and antibiotics.
The study protocol was approved by the institutional review boards of TSGH (no. TSGHIRB-100-05-246) and CTH (no. CTH-100-2-5-036). Written informed consent was obtained from all participants. Data were recorded in an anonymous form and information related to the identification of individuals was removed. The reporting of this study conforms to STROBE guidelines. 23
Anthropometric measurements and laboratory data
Participants visited the clinic at 08.00 h after at least a 10-h overnight fast. Information about medical history, lifestyle, alcohol intake, smoking and physical exercise were obtained through an interview by a well-trained senior nursing staff member and were recorded in a questionnaire. Complete physical examinations were conducted. All participants were measured wearing light clothing and no shoes. Body mass index (BMI) was calculated as weight (kg) divided by the square of the height (m) (kg/m2). Waist circumference (WC) (cm) was measured in a horizontal plane at a level midway between the inferior margin of the last rib and the crest of the ilium. Systolic blood pressure (SBP) and diastolic blood pressure (DBP) were measured by the nursing staff using mercury sphygmomanometers with appropriately sized cuffs on the right arms of the participants after they had rested for at least 5 min in a sitting position. Two measurements were taken more than 1 min apart and the mean value was recorded. Blood pressure measurements conformed to the recommendations of the American Heart Association.24,25
Venous blood samples were drawn from the antecubital vein for biochemical analyses. Biochemical blood tubes and ethylenediaminetetra-acetic acid blood tubes were used. Plasma and serum were separated from whole blood within 1 h of collection and stored at –70°C until used for analyses. Fasting plasma glucose (FPG) was determined using the glucose oxidase method (YSI 2300 STAT Plus Glucose and Lactate Analyzer; YSI Life Sciences, YSI Incorporated, Yellow Springs, OH, USA). Both total cholesterol and triglyceride (TG) levels were measured using the dry, multi-layer analytical slide method (Fujifilm DRI-CHEM SLIDE; FUJIFILM Corporation, Tokyo, Japan). Serum high-density lipoprotein cholesterol (HDL-C) and low-density lipoprotein cholesterol (LDL-C) concentrations were determined using an enzymatic assay following dextran sulphate precipitation (Model 7150; Hitachi Corporation, Tokyo, Japan). The LDL-C levels were directly measured instead of using the traditional Friedewald equation.
Calculation of biphasic insulin secretion
To quantify the BPIS, the equations developed and published by our research groups were used (International Units).26,27 When performing these studies, approximately 75% of the participants were used to build the equation and the remaining 25% were used for external validation.26,27 Thus, the accuracy of the equations could be examined. In addition to validation, the correlations between measured and calculated BPIS were shown to have statistical significance. These two equations have been used in other studies that have investigated the relationship between BPIS and clinical characteristics and blood tests.28–30 Accordingly, the equations for calculating FPIS and SPIS listed below are reliable:26,27


Statistical analyses
All statistical analyses were performed using the SAS statistical package, version 9.4 (SAS Institute Inc., Cary, NC, USA). First, the participants were equally divided into four quartile groups according to their ALT level. Data were tested for normal distribution with the Kolmogorov–Smirnov test and for homogeneity of variance with the Levene's test. Continuous variables are expressed as mean ± SD. The linear trend of the continuous variables and categorical variable (regular exercise) across ALT quartiles (an ordinal variable) was assessed using linear contrast in general linear model and Cochran–Armitage test, respectively. The distribution of FPIS and SPIS was highly variable (SD was almost near to the mean value); therefore, these two diabetic factors were natural log-transformed. The linear trend of FPIS and SPIS across ALT quartiles was tested using the Jonckheere-Terpstra test. Secondly, the relationship between continuous ALT level and BPIS was further analysed. The correlations were evaluated using Pearson correlation coefficient. The association between ALT level and BPIS was evaluated using a linear regression model with adjustments made for age, exercise, C-reactive protein (as a marker of inflammation) and mean arterial pressure (calculated as one-third of SBP plus two-thirds of DBP). The regression model was not adjusted for FPG, BMI and HDL-C because they were components of BPIS. A two-sided P-value <0.05 was considered statistically significant.
Results
This cross-sectional study initially obtained a total of 111 826 records of potential participants (Figure 1). Those (n = 69 159) with a history of significant major medical diseases, including hypertension, diabetes mellitus, hepatitis B or C virus carrier or those that were receiving medications for these diseases were excluded. Potential participants (n = 1503) on medications known to affect insulin secretion or liver function were also excluded. Potential participants (n = 12) with acute illness, such as fever, cholecystitis, recent hepatitis A virus infection or abnormal hydration status, were excluded. Potential participants with a history of current or past excessive alcohol consumption were also excluded (n = 1275). Potential participants (n = 32) with incomplete information were excluded. A total of 39 845 participants (19 058 men and 20 787 women) were eligible for analysis.

Flow chart showing the progress through enrolment, exclusion and analysis of the healthy elderly participants without any cardiovascular disease that were enrolled in a study to investigate the relationship between liver enzymes and biphasic insulin secretion (BPIS). ALT, alanine aminotransferase; FPIS, first-phase insulin secretion; SPIS, second-phase insulin secretion.
The clinical characteristics of the study population are shown in Table 1. In both the male and female populations, the results demonstrated that an increasing ALT level was correlated with a younger age, higher BMI and WC, higher blood pressure, higher FPG level, higher total cholesterol level, lower HDL-C level, higher triglyceride level and higher γ-glutamyl transpeptidase level. In terms of the BPIS, the results showed that an increasing ALT level was correlated with greater values of log-transformed FPIS and log-transformed SPIS, in both sexes (Table 1 and Figure 2).
Demographic characteristics, laboratory data and diabetes mellitus factors of the healthy elderly participants (n = 39 845) without any cardiovascular disease that were enrolled in a study to investigate the relationship between liver enzymes and biphasic insulin secretion (BPIS) stratified according to the alanine aminotransferase (ALT) level quartiles.

Data are expressed as mean ± SD, median (interquartile range) or n of participants (%).
aThe linear trend of the continuous variables and categorical variable (regular exercise) across ALT quartiles (an ordinal variable) was assessed using linear contrast in general linear model and Cochran–Armitage test, respectively. The distribution of FPIS and SPIS was highly variable so these two factors were natural log-transformed. The linear trend of FPIS and SPIS across ALT quartiles was tested using the linear contrast in general linear model; NS, no significant association (P ≥ 0.05).
bTaking exercise >3 h per week.
HDL-C, high-density lipoprotein cholesterol; LDL-C, low-density lipoprotein cholesterol; FPIS, first-phase insulin secretion; SPIS, second-phase insulin secretion.

The distribution of first-phase insulin secretion (FPIS) (a) and second-phase insulin secretion (SPIS) (b) in the male and female participants according to the alanine aminotransferase (ALT) quartile levels. The linear trend of the continuous data across the ALT quartiles was assessed using linear contrast in general linear model and Cochran–Armitage test. The heavy central black horizontal lines indicate the median. The lower and upper extremities of the boxes indicate the 25th and 75th percentiles, respectively. The error bars indicate the limit of outliers.
Regarding the continuous ALT level and BPIS, the correlations between ALT and log-transformed FPIS and log-transformed SPIS all reached statistical significance in both male and female participants (P < 0.001). In the linear regression model, the results showed that the ALT level was significantly associated with higher log-transformed FPIS and log-transformed SPIS, in both male and female participants (Table 2).
The linear relationship between the alanine aminotransferase (ALT) level and biphasic insulin secretion.
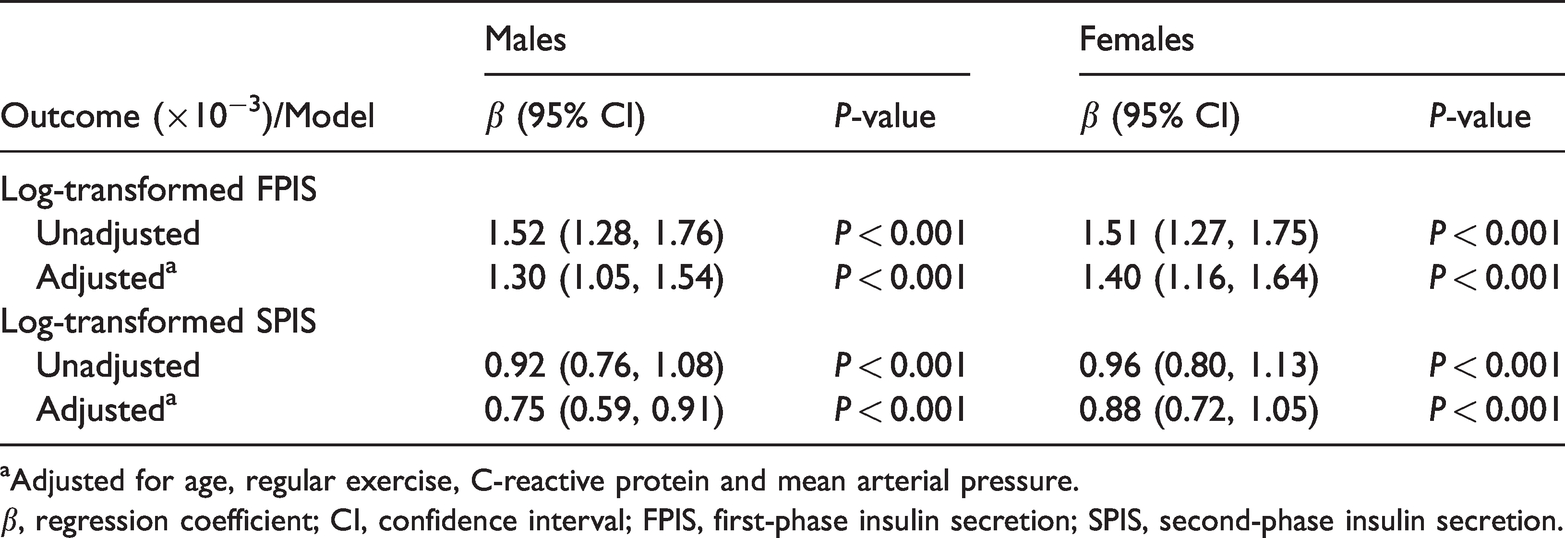
aAdjusted for age, regular exercise, C-reactive protein and mean arterial pressure.
β, regression coefficient; CI, confidence interval; FPIS, first-phase insulin secretion; SPIS, second-phase insulin secretion.
Discussion
Nonalcoholic fatty liver disease and T2DM are of high clinical relevance and the link between them is complex and worth investigating. The liver plays a key role in the pathophysiology of T2DM and research has shown that NAFLD is associated with an approximate two-fold higher risk of developing T2DM.31,32 The current study explored the correlation between liver function and BPIS. Participants with any possible confounding factors known to affect insulin secretion or liver function, including underlying medical problems or personal history, were excluded. The laboratory data shown were thereby not corrected and reflected the true severity of their clinical condition. To the best of our knowledge, a literature search was not able to find any similar studies that used criteria as strict as those used in the present study for selecting healthy elderly participants. Hence, the results in the current study are accurate and representative of clinical practice.
As described in the introduction, it is well-known that there are two phases of insulin secretion under rapid glucose stimulus.5,33 A biphasic response of insulin secretion is observed that is composed of a sharp increase with a peak, followed by an interpeak nadir and then a slower increasing phase. A previous study showed that the roles of the FPIS and SPIS are different. 6 By using the pancreatic clamp, the previous study found that FPIS is crucial to ensure an insulin burst and suppress the rise of glucose. 6 In a subsequent study, the same authors showed that FPIS curbs hepatic glucose production through reducing gluconeogenesis. 34 Although both phases of insulin release are crucial to regulating serum glucose, their presenting factors and biological pathways are distinctive. Another study demonstrated that an impairment in the early insulin response leads to hyperglycaemia, causing longer β-cell stimulation and compensatory second phase hyperinsulinaemia. 35 It has been suggested that the cascade involved in the FPIS is different from the SPIS. 36 As mentioned above, the loss of FPIS and increase of SPIS are common in patients with early diabetes mellitus. Even though FPIS and SPIS are important, there is a limited number of publications related to this area. This might be due to the complexity involved in quantifying FPIS and SPIS. The hyperglycaemic glucose clamp is the gold standard method, but it requires long-term training of research staff, which makes its implementation difficult in a large cohort study.
It is well established that a high BPIS is associated with obesity. For example, in 1967, it was first reported that obese subjects had higher insulin secretion. 37 Another study further corroborated this relationship. 38 The same authors also found that after a glucose challenge, a higher acute insulin rise could be noted in obese subjects compared with normal weight subjects. 39 Since the study subjects had no impairment of insulin clearance, the authors concluded that this increase in the insulin response must be due to higher insulin secretion. 39 Many studies thereafter have demonstrated the same findings.40–43 Research has suggested that obese subjects have a more prominent β-cell response because they possess greater cell mass than lean subjects.40–42 It has also been suggested that long-term high insulin secretion may lead to insulin resistance, which is possibly more noticeable in obese subjects and in those with MetS. 43 These previous findings suggest that there may be a positive correlation between BPIS, obesity, insulin resistance and MetS.
Abnormal liver function may be the final piece to complete the link between BPIS and obesity. NAFLD is one of the leading causes of abnormal liver function worldwide. 44 It is strongly associated with obesity and has been regarded as a manifestation of MetS and diabesity.2,13,14,18 The presentations of NAFLD range from simple steatosis, nonalcoholic steatohepatitis, to cirrhosis. 44 It is reported that around 80% of obese subjects and 70% of patients with T2DM have NAFLD, respectively.45,46 Obese individuals experience more inflammatory processes than lean individuals, including liver inflammation. 47 In summary, the association among elevated liver enzymes, obesity, MetS and T2DM can be established.
The major merit of the current study was the stringent design with a high quality of statistical analysis. The exclusion criteria comprised many aspects of the potential confounding factors, including medical disease, medications and excessive alcohol consumption (one of the lifestyle factors potentially influencing liver function). The large number of study participants also strengthened the current results. However, there were several limitations. First, the enrolled study cohort was only from a single ethnic group. Therefore, generalizing or extrapolation of the results to other ethnic groups should be done with caution. Verifying the analyses in different populations and age groups may be considered in future studies. Secondly, this was a cross-sectional study, which has a lower evidence level than longitudinal studies. Further research design for the association between long-term level of BPIS and ALT in a longitudinal study may be suggested. Thirdly, the BPIS in the present study was calculated by the equation developed from our previous research. Even if the accuracy of the equation was less than the hyperglycaemic clamp test, the correlations between measured and calculated BPIS were proved to be of statistical significance. In addition, this method has been validated and published. Verifying analysis in the validation group provided additional evidence for the generalization of the results, which were obtained from the training group. Moreover, the hyperglycaemic glucose clamp would have been very difficult to use in this current study due to the large number of participants. Thus, these current results are considered to be reliable in such a large cohort. Finally, several potential confounders were not available in the current data, such as smoking and socioeconomic factors. The observed associations in this study may be attenuated when considering the unavailable confounders. Therefore, the findings derived from the results of this current study should be taken more conservatively.
In conclusion, ALT was positively correlated with BPIS in a healthy elderly population in both men and women. NAFLD, accounting for up to 90% of all cases demonstrating raised liver function test, should play a vital role in the pathophysiological mechanisms.44,47 Elevated ALT may implicate high FPIS and SPIS, and may serve as an indicating factor for developing MetS and T2DM in the healthy elderly Han Chinese population.
Supplemental Material
sj-pdf-1-imr-10.1177_03000605221115161 - Supplemental material for Elevated alanine aminotransferase is associated with biphasic insulin secretion in the healthy elderly Han Chinese population
Supplemental material, sj-pdf-1-imr-10.1177_03000605221115161 for Elevated alanine aminotransferase is associated with biphasic insulin secretion in the healthy elderly Han Chinese population by Tzong-Yow Wu, En-Chih Liao, Yen-Lin Chen, Yung-Feng Lin, Shu-Hsiang Liu, Hua-Ching Lin, Yi-Chou Chiu, Chung-Ze Wu, Jiunn-Diann Lin, Dee Pei and Chun-Hsien Hsu in Journal of International Medical Research
Footnotes
Acknowledgements
The authors sincerely thank all the participants and the study team that took part in the current research.
Declaration of conflicting interest
The authors declare that there are no conflicts of interest.
Funding
The authors disclosed receipt of the following financial support for the research, authorship, and/or publication of this article: This study was sponsored by the Shin Kong Wu Ho-Su Memorial Hospital (no. 2019SKHCDR001 and no. 2020SKHCDR002), the Health Promotion Administration, Ministry of Health and Welfare (no. HPA108-ACDC1-508), the Department of Health, Taipei City Government (no. 11101-62-022) and the National Science and Technology Council (no. MOST 111-2314-B-532-001-), Taiwan.
References
Supplementary Material
Please find the following supplemental material available below.
For Open Access articles published under a Creative Commons License, all supplemental material carries the same license as the article it is associated with.
For non-Open Access articles published, all supplemental material carries a non-exclusive license, and permission requests for re-use of supplemental material or any part of supplemental material shall be sent directly to the copyright owner as specified in the copyright notice associated with the article.