
Abstract
Objective:
We examined the relationship between serum fetuin-A, insulin resistance (IR), metabolic syndrome (MS) and vascular complications including cardiac autonomic neuropathy (CAN) in patients with type 2 diabetes mellitus (T2DM).
Methods:
A total of 172 T2DM patients were recruited and evaluated for diabetic microangiopathies (nephropathy, retinopathy and peripheral neuropathy) including CAN. Serum fetuin-A levels were measured by enzyme-linked immunosorbent assay (ELISA), and the IR was assessed by the index of homeostasis model [homeostasis model assessment–insulin resistance (HOMA-IR)]. Atherosclerotic burden was assessed by ankle-brachial index (ABI) and brachial-ankle pulse wave velocity (baPWV).
Results:
Serum fetuin-A levels showed significant positive correlations with HOMA-IR (r = 0.196, p = 0.022), and the mean levels of HOMA-IR were significantly increased progressively across fetuin-A tertiles (p for trend = 0.044). Serum fetuin-A showed significant positive correlations with baPWV, systolic blood pressure (BP), total cholesterol, triglycerides, serum fasting c-peptide and negative correlations with ABI. Serum fetuin-A levels were also negatively correlated with serum adiponectin and positively correlated with serum tumour necrosis factor-α (TNF-α). The mean levels of serum fetuin-A were not significantly different according to the presence of each microangiopathies including CAN. Also, the mean levels of serum fetuin-A were not different between patients with MS and without MS.
Conclusions:
This present study showed that levels of serum fetuin-A are significantly associated with IR and arterial stiffness assessed by baPWV, while there are no associations with each microangiopathies in patients with T2DM.
Introduction
There have been ongoing efforts to identify a candidate involved in the pathophysiology of vascular complications in type 2 diabetes mellitus (T2DM). Although the reasons for accelerated vascular disease in T2DM are not yet fully clear, insulin resistance (IR) or adipocytokines may contribute to the pathogenesis of diabetic microangiopathies and macroangiopathies by modulating vascular function and affecting inflammatory processes. 1
Fetuin-A is a 60 kDa glycoprotein produced exclusively by the liver and secreted into serum in relatively high concentrations in humans. 2 Fetuin-A is known to inhibit ectopic calcium deposition and protect from vascular calcification. 3 Also, fetuin-A is shown to act as an endogeneous inhibitor of the insulin receptor tyrosine kinase in liver and skeletal muscle, resulting in IR in these target tissues. 4 In several epidemiological studies, higher serum fetuin-A levels are associated with IR, metabolic syndrome (MS) and T2DM.5–7 And also, it is strongly associated with the risk of myocardial infarction and ischaemic stroke in general population. 8
Whereas studies in end-stage renal disease (ESRD) have consistently shown that lower fetuin-A levels are associated with cardiovascular disease (CVD) events and mortality, some studies showed that high levels of fetuin-A are associated with atherosclerosis and CVD in non-renal patients.8–10 Yet, contradictory results have been reported regarding the role of novel biomarker fetuin-A in macroangiopathies in T2DM. Two studies regarding fetuin-A levels in patients with T2DM and peripheral arterial disease (PAD) in comparison with T2DM without PAD showed contradictory results.11,12
Moreover, there is very less data available for associations of fetuin-A with microangiopathies in T2DM. To our knowledge, none of the previously published studies investigated the associations of fetuin-A and vascular complications including cardiac autonomic neuropathy (CAN) in T2DM. Roos et al. 13 reported that lower fetuin-A levels are associated with macrovascular late complications in patients with T2DM and early diabetic nephropathy, while there are no associations of fetuin-A with metabolic status or microvascular complications.
Therefore, in the present study, we examined the relationship between fasting serum fetuin-A levels and IR, MS and vascular complications including CAN in patients with T2DM.
Methods
Patients
We recruited 185 diabetic patients who were evaluated microangiopathies at diabetes clinic of Soonchunhyang University Bucheon Hospital, from January 2010 to August 2011. Among the total of 185 patients, those with type 1 diabetes and were not available of fasting serum samples and clinical data from appropriate medical records were excluded. Finally, this study was performed on 172 T2DM patients (119 males and 53 females; mean age = 52.8 years). We reviewed detailed demographic data, biochemical data, clinical and treatment history using medical records. The alcohol consumption of the subjects was classified as ‘yes’ or ‘no’ simply. The smoking status of the subjects was classified as being a non-smoker or smoker (former or current). All patients were informed of the purpose of the study, and their consent was obtained. The study was approved by the Institutional Review Board of Soonchunhyang University School of Medicine, Bucheon Hospital.
Measurement of serum fetuin-A and adipokines
Blood samples were taken after overnight fasting. The serum was separated and stored at −80°C until analysed. Serum fetuin-A, adiponectin and tumour necrosis factor-α (TNF-α) levels were measured using a commercially available enzyme-linked immunosorbent assay (ELISA; R&D Systems, Minneapolis, MN, USA). Serum leptin levels were measured using radioimmunoassay (Millipore, Billerica, MA, USA). Serum c-peptide levels were measured by radioimmunoassay (Immunotech, Prague, Czech Republic).
Diabetic microvascular complications and MS
Diabetic nephropathy was defined using albuminuria, which was measured by radioimmunoassay (Immunotech). Albumin excretion rate (AER) of <20 µg/min or urine albumin of <30 mg/g creatinine was categorised as normoalbuminuria, AER in the range of 20–200 µg/min or urine albumin of 30–300 mg/g creatinine was categorised as microalbuminuria and AER of >200 µg/min or urine albumin of ≥300 mg/g creatinine was categorised as overt proteinuria. Patients were considered to have nephropathy if they show microalbuminuria or overt proteinuria. Estimated glomerular filtration rate (eGFR) was calculated by the Modification of Diet in Renal Disease (MDRD) Study equation.
Diabetic retinopathy (DR) was evaluated by experienced ophthalmologists, while the patients’ pupils were dilated. If needed, fluorescein angiography was performed. DR was classified as normal, nonproliferative and proliferative retinopathy. Patients were considered to have retinopathy if they show nonproliferative or proliferative stage.
Diabetic peripheral neuropathy was diagnosed in subjects displaying two or more of the following features: typical subjective neuropathic symptoms of symmetrical distal neuropathy, insensitivity to a 10 g monofilament, abnormal pinprick sensation and abnormal current perception threshold (CPT), or nerve conduction study. Neuropathic symptoms were assessed by a total symptom score, and CPT was performed with a Neurometer CPT/C (Neurotron, Inc., Baltimore, MD, USA).
CAN was assessed by autonomic function test (AFT). CAN was assessed by the five standard cardiovascular (CV) reflex tests according to Ewing et al.’s 14 protocol. Three of these measurements mainly assess parasympathetic function; heart rate responses to deep breathing (beat-to-beat variation), to standing (30:15 ratio) and to the Valsalva manoeuver. The other two tests mainly assess sympathetic function; blood pressure (BP) responses to standing and a sustained handgrip. The heart rate response to deep breathing, standing and the Valsalva manoeuver was assessed automatically from electrocardiogram (ECG) recordings using the DICAN evaluation system (Medicore Co. Ltd, Seoul, Korea). The results of each of the above five tests for the detection of CAN were classified into three categories based on the severity of abnormality detected, and each of them was given a definite point as described by Bellavere et al. 15 The severity of CAN was quantitated by summation of points obtained from each of the five tests, where each test was given a point of 0, 0.5 or 1, if it yielded normal, borderline or abnormal values, respectively. Consequently, the minimum and maximum autonomic neuropathy points were 0 and 5, respectively. CAN was defined as the presence of at least two abnormal tests or an autonomic neuropathy points of ≥2. 16
An automated device (VP-1000; Colin Co., Komaki, Japan) was used to measure arterial pulse wave velocity (PWV) and ankle-brachial index (ABI). The IR status was evaluated by the homeostasis model assessment–insulin resistance (HOMA-IR) index. The HOMA-IR was calculated by the following formula: [fasting insulin (uIU/mL) × fasting blood glucose (mmol/L)]/22.5. The HOMA-IR score was available only in 154 patients not receiving exogeneous insulin.
The presence of MS was defined using a modified version of the Adult Treatment Panel III (ATP III) criteria. Briefly, four of the five MS components were defined using the following ATP III categorisations: (1) high BP: ≥130/85 mmHg or the patients using anti-hypertensive agents, (2) hypertriglyceridaemia: ≥150 mg/dL, (3) low high-density lipoprotein cholesterol (HDL-C): <40 mg/dL in men and <50 mg/dL in women and (4) fasting blood glucose ≥ 100 or the patients using hypoglycaemic agents. We consider all patients satisfy the fourth component because they were all T2DM patients. The fifth component was defined based on the body mass index (BMI) because waist circumference measurements were not available for all the subjects. We classified the subjects with a BMI ≥ 25 (kg/m2) as having high central obesity. The subjects with three or more of the above-mentioned criteria were defined as having MS. 17
Statistical analysis
Statistical analysis was performed using SPSS 14.0 (SPSS Inc, Chicago, IL, USA). Data are reported as mean ± standard deviation (SD) for variables that are normally distributed or as median (minimum–maximum) for variables that are not normally distributed or as number of participants (percentages). Non-normally distributed variables, that is, fetuin-A, TNF-α, triglyceride, hsCRP and HOMA-IR were transformed as natural logarithm before the analysis. The categorical variables of the groups were compared by chi-square test. The significance of the mean differences including fetuin-A levels between patients with each microangiopathies and those without microangiopathies was evaluated with independent t-test. Correlation between plasma fetuin-A and other clinical parameters was analysed by Spearman’s correlation analysis. Patients were divided into three groups by the tertiles of fetuin-A levels. One-way analysis of variance (ANOVA) was used to evaluate differences of means among tertiles of fetuin-A groups. The significance of the mean differences including fetuin-A levels between patients with MS and those without MS was evaluated with Student’s t-test.
Results
Clinical characteristics of the participants
The general characteristics of the study participants are presented in Table 1. The age of the participants was 52.8 years, and the mean duration of diabetes was 7.1 years. The mean BMI was 24.7 kg/m2. The mean levels of serum fetuin-A were 525 ± 162 µg/mL and not different between males and females. A total of 46 (32.1%) patients were treated for hypertension. A total of 41 patients were treated with angiotensin-converting enzyme inhibitor (ACEI) or/and angiotensin receptor blocker (ARB). In all, 78 patients (45.3%) were treated with statin. Of the 172 patients, 92 (54%) were defined as having diabetic peripheral neuropathy and 56 (32.6%) having CAN. The incidence of diabetic nephropathy was 30 (17.4%), and the incidence of retinopathy was 27 (15.7%). The prevalence of MS was 50.5% (46.4% in men and 58.2% in women).
General characteristics of the participants.
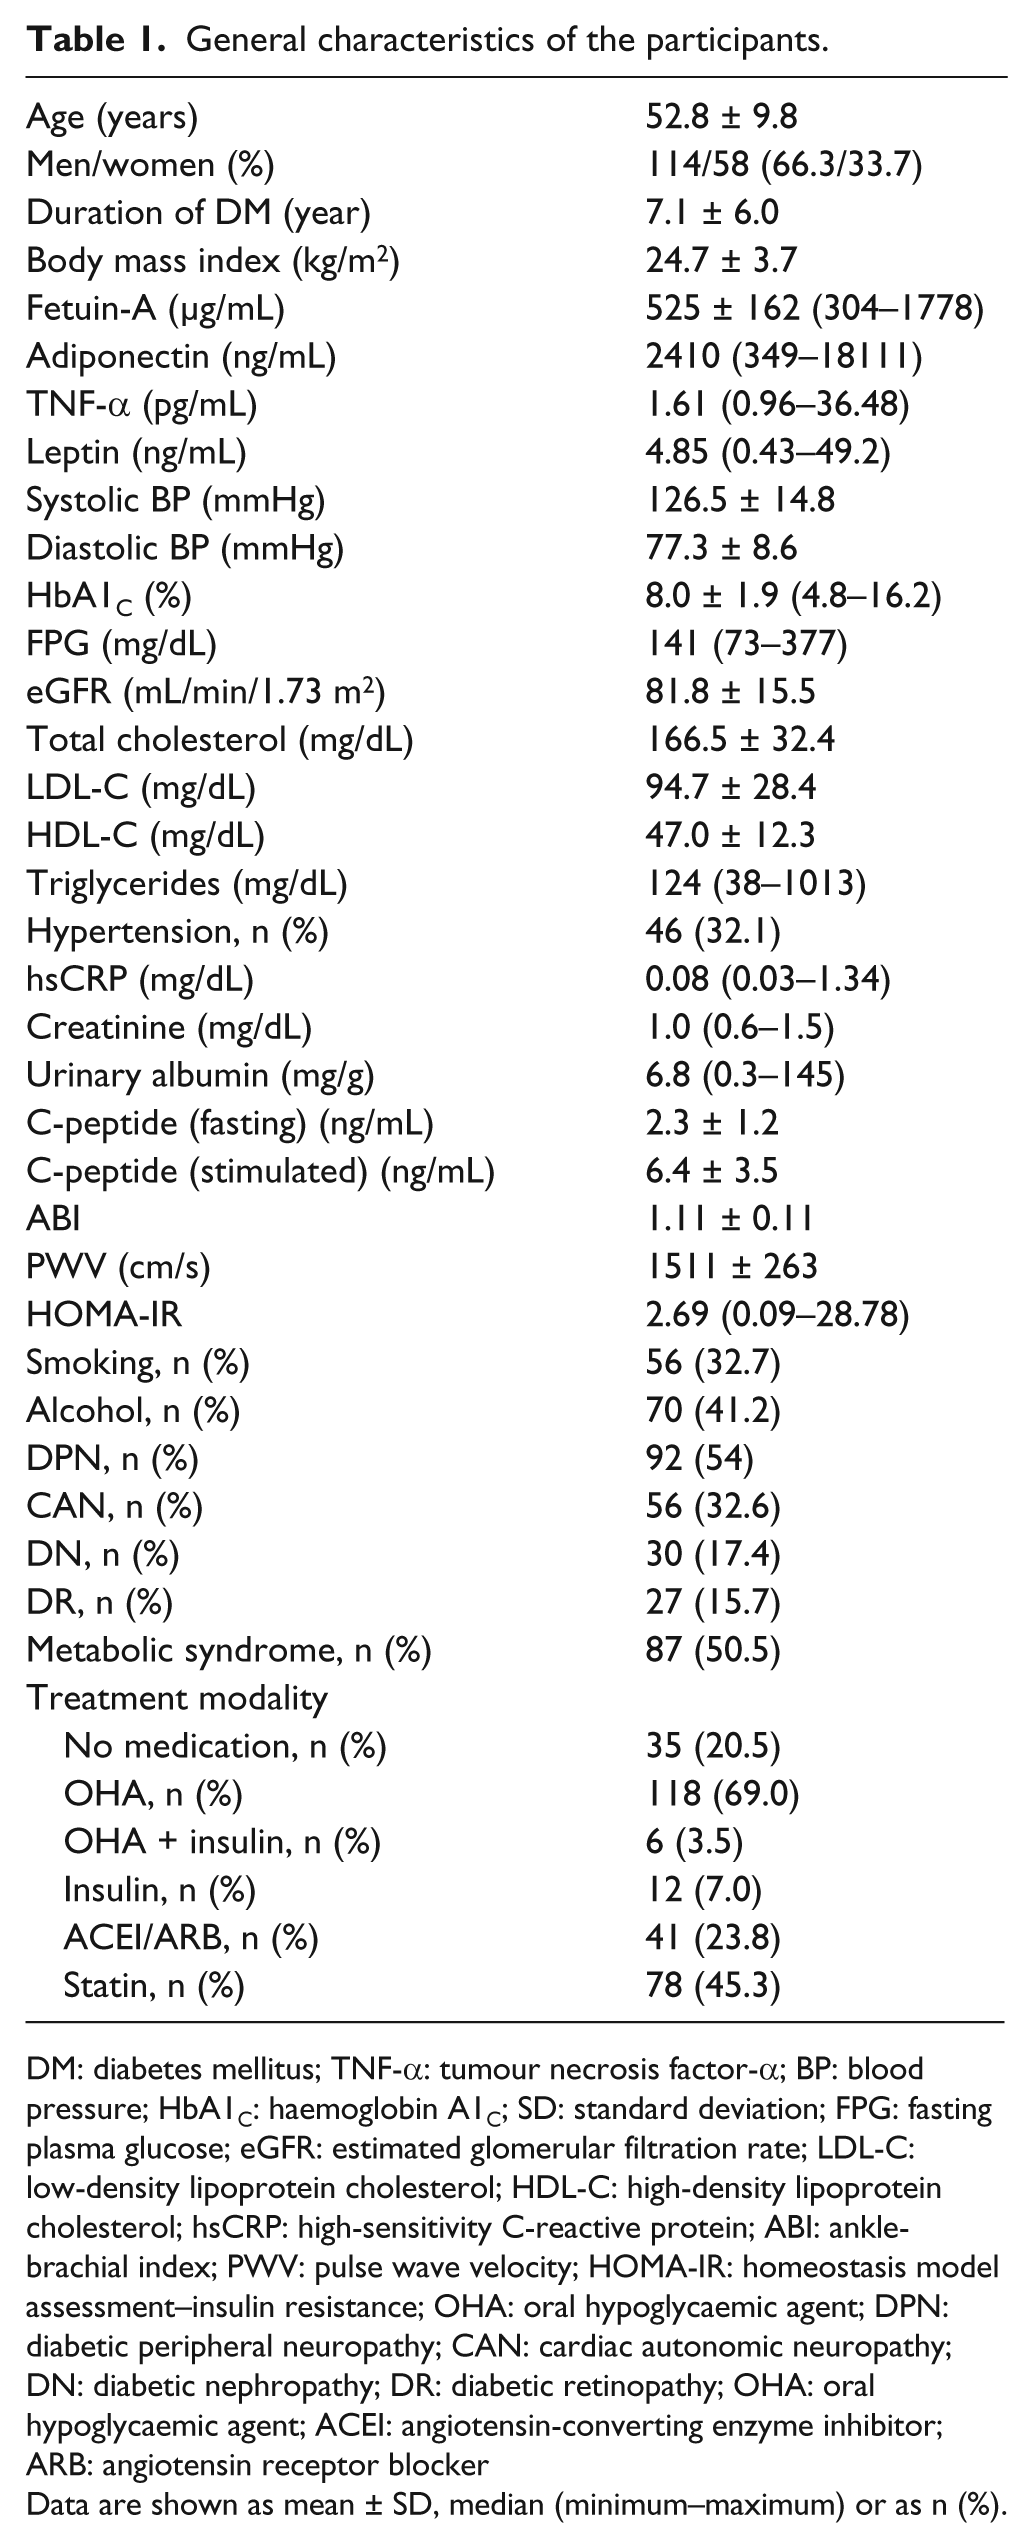
DM: diabetes mellitus; TNF-α: tumour necrosis factor-α; BP: blood pressure; HbA1C: haemoglobin A1C; SD: standard deviation; FPG: fasting plasma glucose; eGFR: estimated glomerular filtration rate; LDL-C: low-density lipoprotein cholesterol; HDL-C: high-density lipoprotein cholesterol; hsCRP: high-sensitivity C-reactive protein; ABI: ankle-brachial index; PWV: pulse wave velocity; HOMA-IR: homeostasis model assessment–insulin resistance; OHA: oral hypoglycaemic agent; DPN: diabetic peripheral neuropathy; CAN: cardiac autonomic neuropathy; DN: diabetic nephropathy; DR: diabetic retinopathy; OHA: oral hypoglycaemic agent; ACEI: angiotensin-converting enzyme inhibitor; ARB: angiotensin receptor blocker
Data are shown as mean ± SD, median (minimum–maximum) or as n (%).
Bivariate correlation between fetuin-A and clinical parameters including adipokines
Bivariate correlation analyses between serum fetuin-A, adipokines and various clinical parameters are shown in Table 2. Serum fetuin-A levels showed significant positive correlations with HOMA-IR (r = 0.196, p = 0.022), baPWV (r = 0.165, p = 0.036), systolic BP (r = 0.164, p = 0.032), total cholesterol (r = 0.215, p = 0.006), low-density lipoprotein cholesterol (LDL-C) (r = 0.164, p = 0.036), triglycerides (r = 0.181, p = 0.019), fasting plasma c-peptide (r = 0.158, p = 0.04) and significant negative correlations with ABI (r = −0.183, p = 0.019). Serum fetuin-A levels were also negatively correlated with serum adiponectin (r = −0.187, p = 0.027) and positively correlated with serum TNF-α (r = 0.204, p = 0.016). Serum fetuin-A levels were not correlated with leptin (r = 0.054, p = 0.528). Serum fetuin-A levels were borderline significantly correlated with score of CAN (r = 0.16, p = 0.057). Neither eGFR nor hsCRP was associated with fetuin-A levels. Only total cholesterol remained independent from other contributing factors for the fetuin-A levels in stepwise multivariate regression analysis (β = 0.185, p = 0.019) (data not shown).
Correlation of serum fetuin-A with other clinical variables including adipokines.
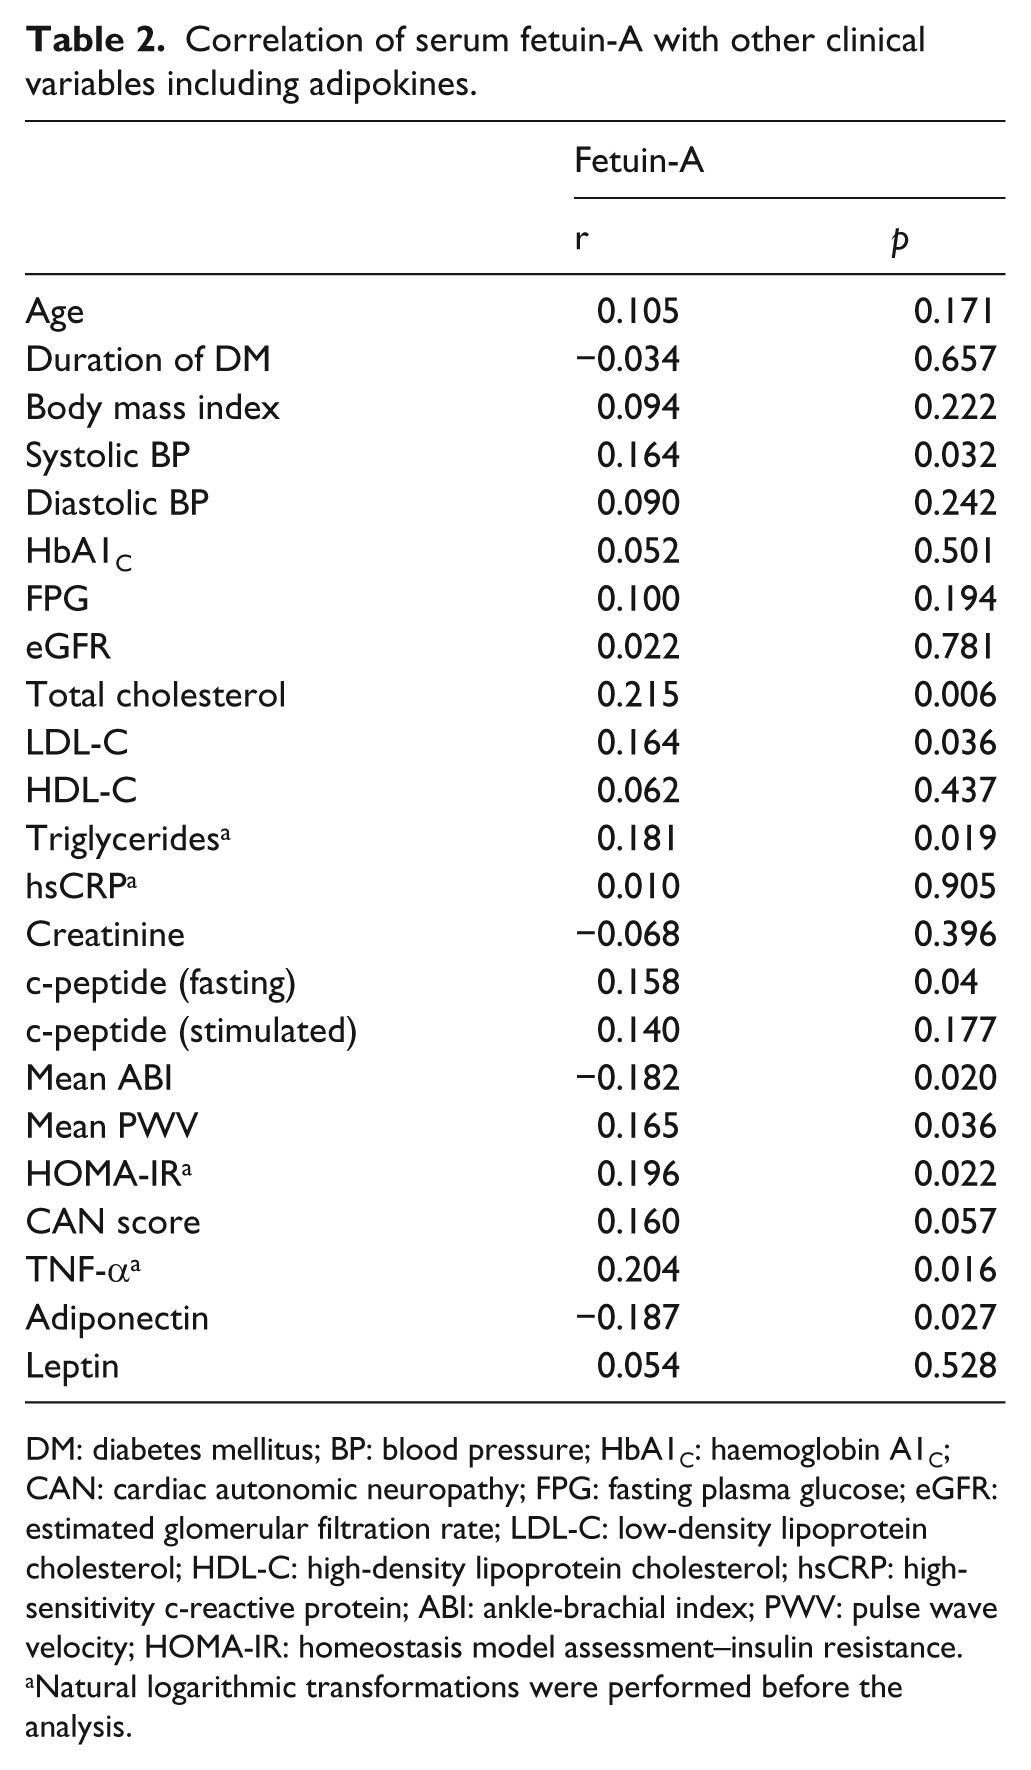
DM: diabetes mellitus; BP: blood pressure; HbA1C: haemoglobin A1C; CAN: cardiac autonomic neuropathy; FPG: fasting plasma glucose; eGFR: estimated glomerular filtration rate; LDL-C: low-density lipoprotein cholesterol; HDL-C: high-density lipoprotein cholesterol; hsCRP: high-sensitivity c-reactive protein; ABI: ankle-brachial index; PWV: pulse wave velocity; HOMA-IR: homeostasis model assessment–insulin resistance.
Natural logarithmic transformations were performed before the analysis.
Comparison of mean levels of fetuin-A and clinical variables according to the presence of microangiopathies
The mean levels of serum fetuin-A were not significantly different according to the absence or the presence of diabetic microangiopathies (absence vs presence of each microangiopathies: regarding CAN: 533 ± 173 vs 534 ± 157 µg/mL, p = 0.957; regarding nephropathy: 520 ± 173 vs 519 ± 125 µg/mL, p = 0.992; regarding retinopathy: 534 ± 182 vs 478 ± 853 µg/mL, p = 0.121; regarding peripheral neuropathy: 549 ± 210 vs 506 ± 105 µg/mL, p = 0.092, respectively) (Figure 1). Also, we divided into two groups according to the taking or not taking ACEI or ARB for diabetic nephropathy and compared mean levels of fetuin-A between two groups. Serum fetuin-A levels did not show significant differences between the groups (diabetic nephropathy not taking ACEI/ARB vs taking ACEI/ARB: 526 ± 121 vs 499 ± 140 µg/mL, p = 0.736) (data not shown).
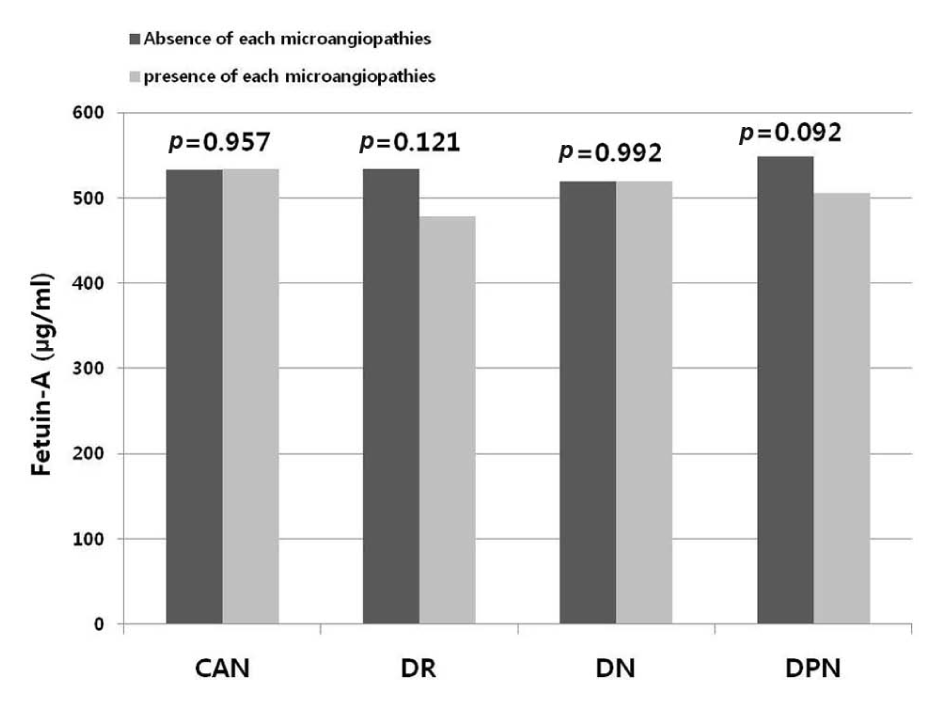
Serum fetuin-A levels and microvascular complications.
HOMA-IR levels and other clinical parameters according to the tertiles of serum fetuin-A levels
The participants were divided into three groups according to the levels of serum fetuin-A. The characteristics of clinical parameters according to the fetuin-A tertile are shown in Table 3. The levels of HOMA-IR demonstrate an increasing trend as the levels of fetuin-A increased (3.03 vs 3.11 vs 4.47, p for trend = 0.044) (Figure 2). The levels of ABI and baPWV did not show significant differences according to the fetuin-A tertiles.
Comparisons of clinical variables according to the tertile of fetuin-A levels.
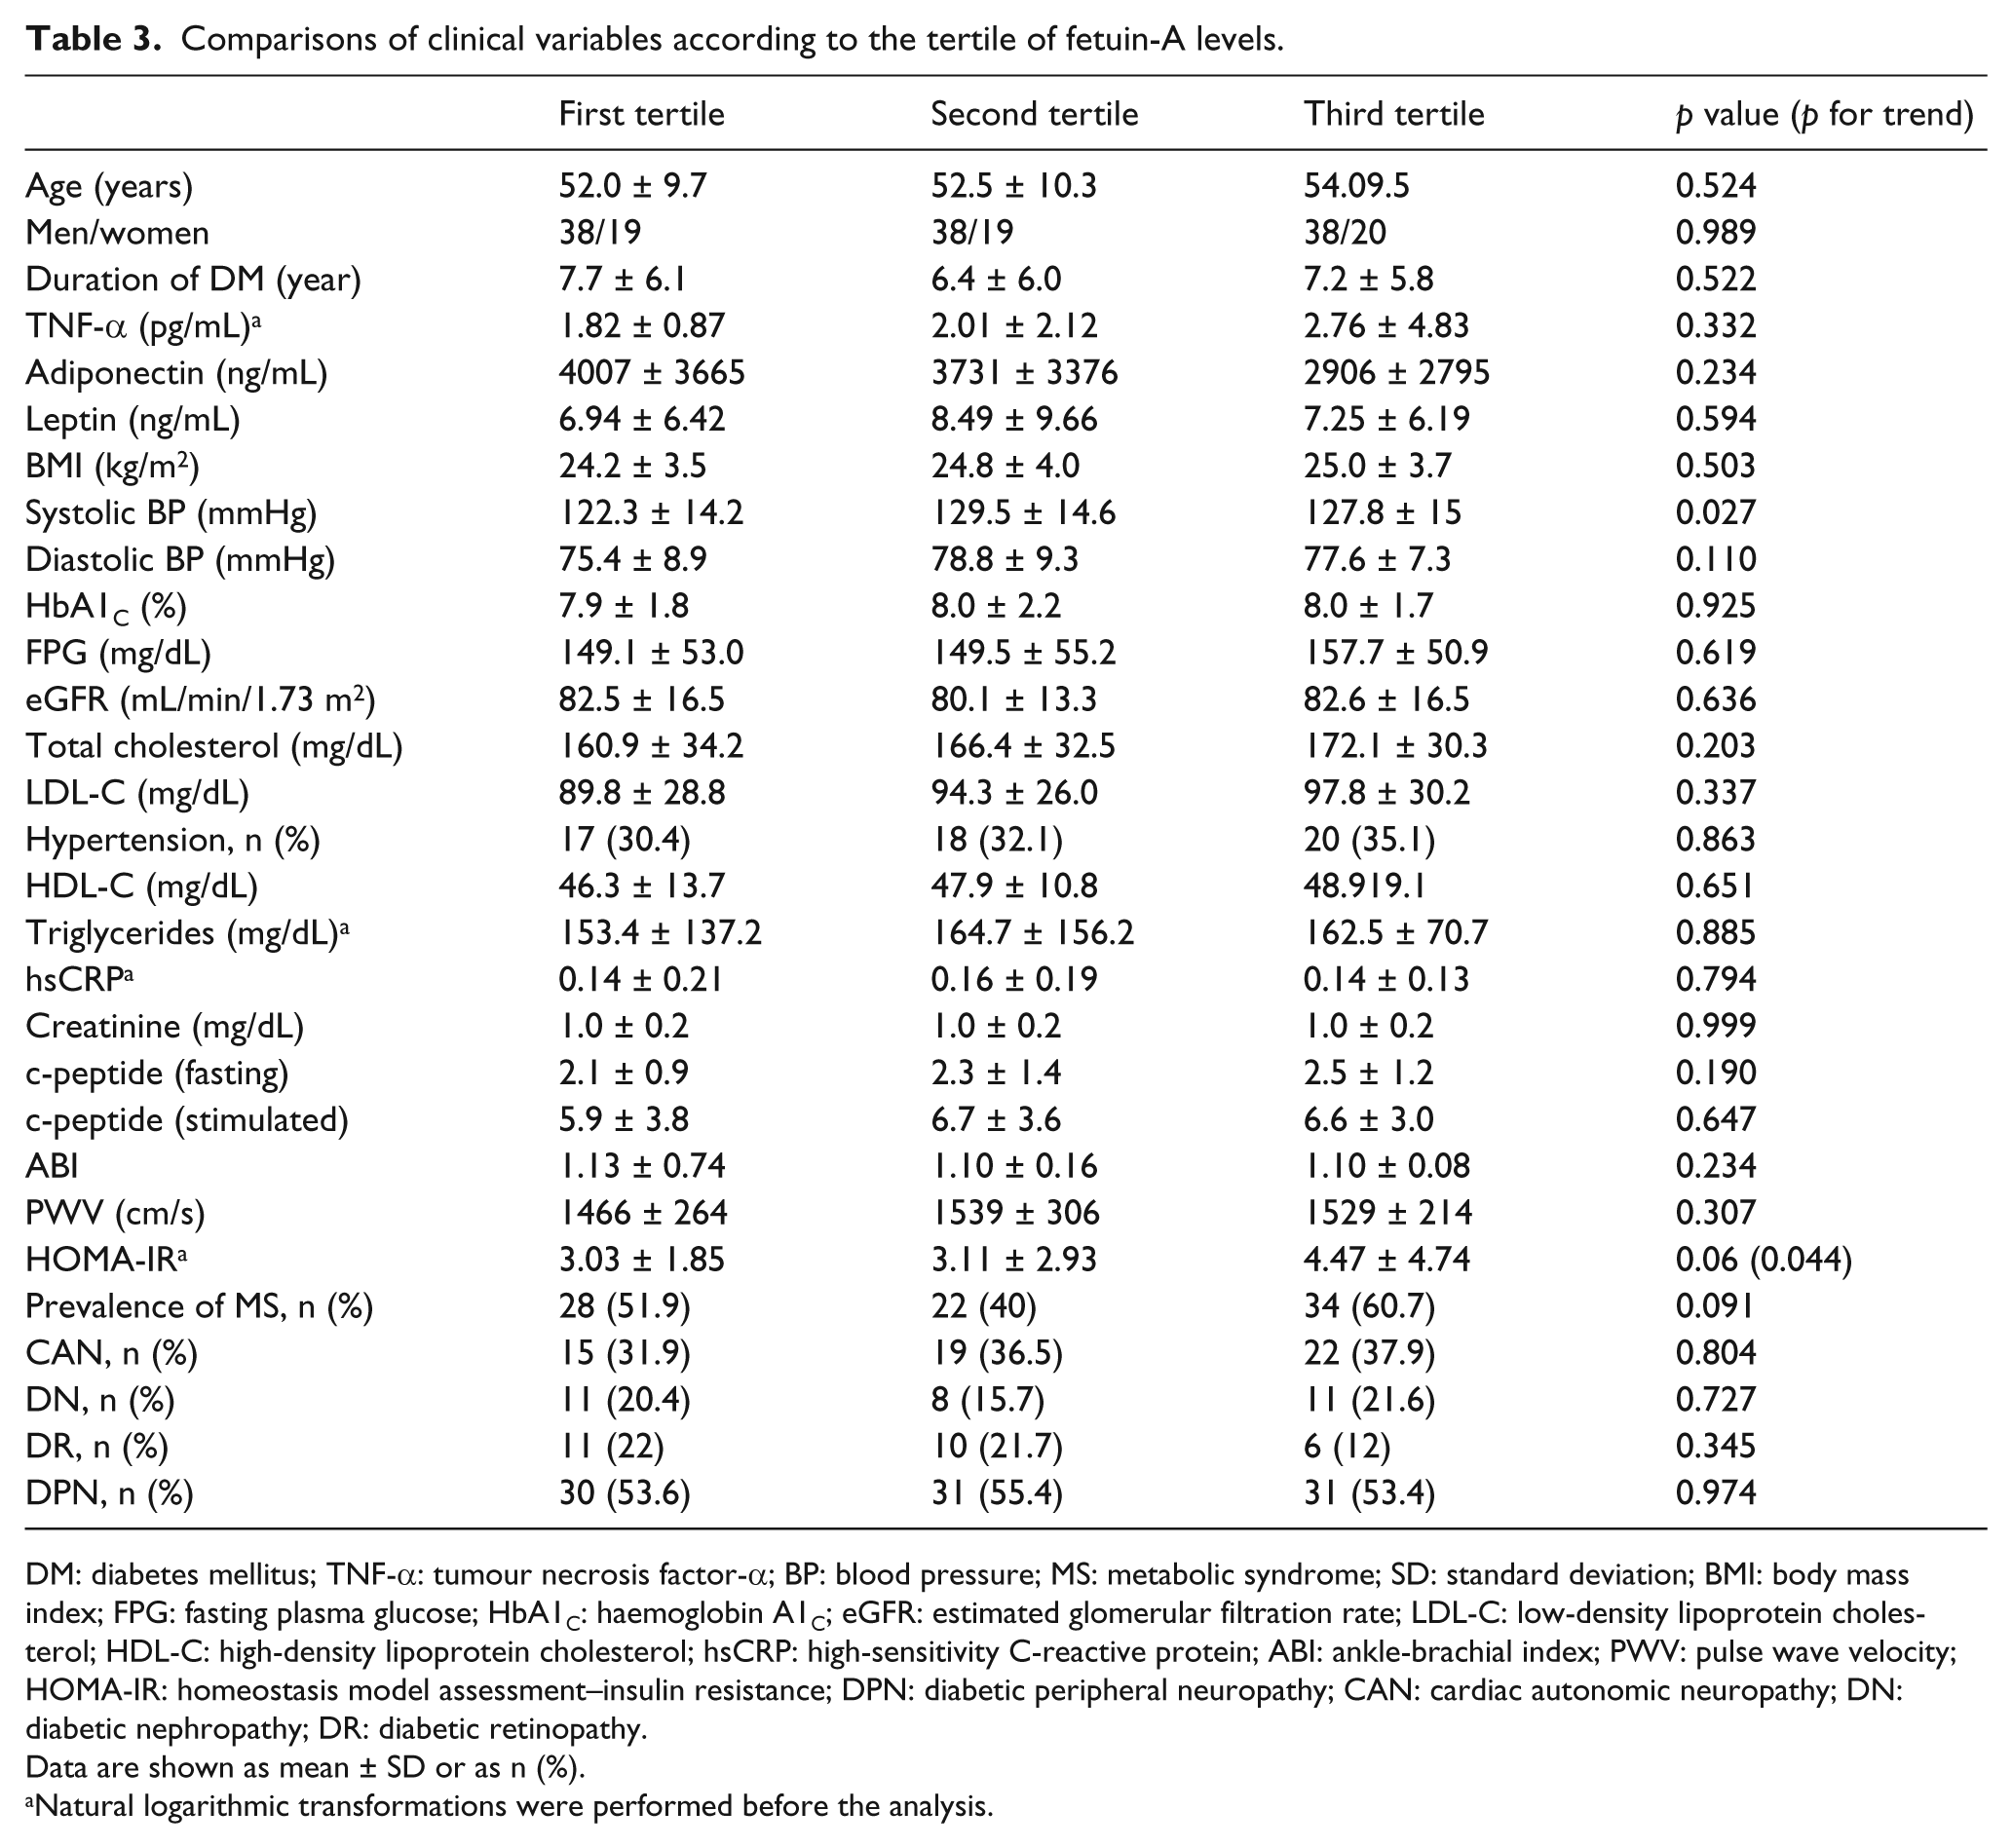
DM: diabetes mellitus; TNF-α: tumour necrosis factor-α; BP: blood pressure; MS: metabolic syndrome; SD: standard deviation; BMI: body mass index; FPG: fasting plasma glucose; HbA1C: haemoglobin A1C; eGFR: estimated glomerular filtration rate; LDL-C: low-density lipoprotein cholesterol; HDL-C: high-density lipoprotein cholesterol; hsCRP: high-sensitivity C-reactive protein; ABI: ankle-brachial index; PWV: pulse wave velocity; HOMA-IR: homeostasis model assessment–insulin resistance; DPN: diabetic peripheral neuropathy; CAN: cardiac autonomic neuropathy; DN: diabetic nephropathy; DR: diabetic retinopathy.
Data are shown as mean ± SD or as n (%).
Natural logarithmic transformations were performed before the analysis.
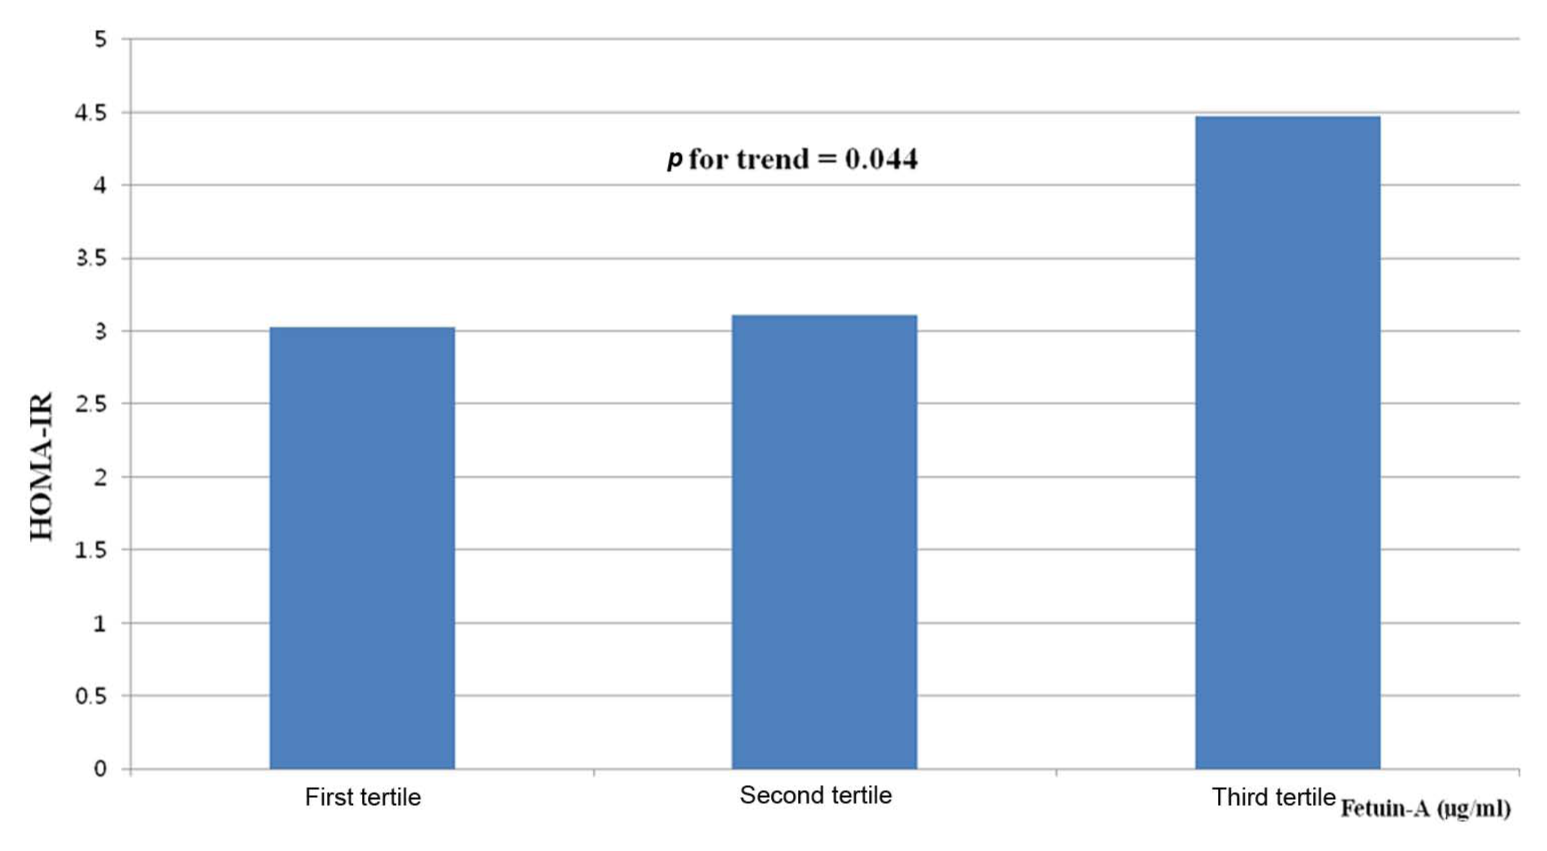
Mean HOMA levels according to the tertile of fetuin-A levels.
The prevalence of diabetic microangiopathies according to the fetuin-A tertiles was not different between groups. The prevalence of MS was not different across fetuin-A tertiles (p = 0.09).
Comparison of mean levels of fetuin-A and adipokines according to the presence of MS
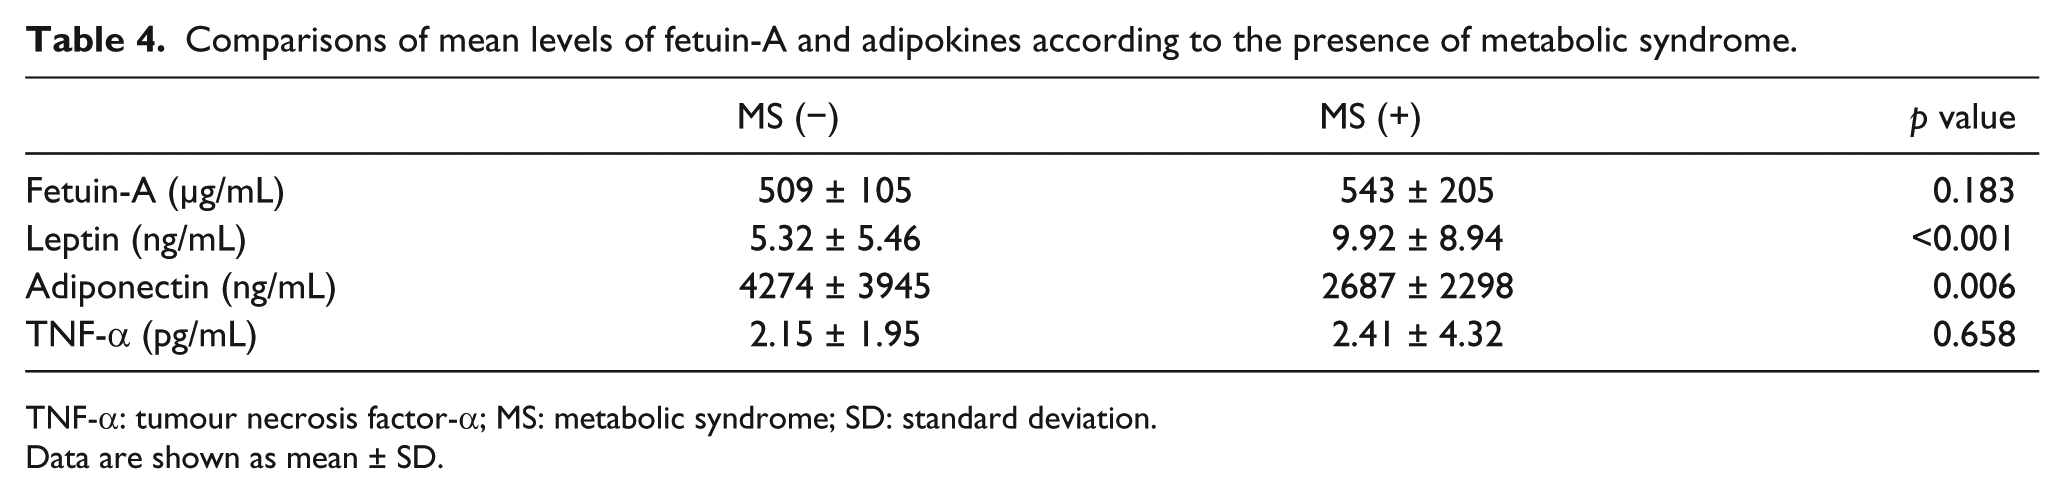
We also examined whether the serum fetuin-A levels were associated with MS in this population. The mean levels of fetuin-A including other adipokines according to the presence of MS are presented in Table 4.
Comparisons of mean levels of fetuin-A and adipokines according to the presence of metabolic syndrome.
TNF-α: tumour necrosis factor-α; MS: metabolic syndrome; SD: standard deviation.
Data are shown as mean ± SD.
The mean levels of serum fetuin-A and TNF-α were not significantly different between the groups with and without MS (p = 0.183, p = 0.658). The mean levels of adiponectin were significantly lower in patients with MS compared to patients without MS (2687 ± 2298 vs 4274 ± 3945 ng/mL, p=0.006). The mean levels of leptin were significantly higher in patients with MS than those without MS (p < 0.001). Mean A1C and LDL-C levels were significantly higher in groups without MS compared to patients with MS (8.3% vs 7.7% and 98.1 vs 89.4 mg/dL, p = 0.045 and p = 0.047, respectively). Compared to the patients without MS, patients with MS showed higher both fasting and stimulated plasma c-peptide levels and HOMA-IR (1.99 vs 2.54 ng/mL, 5.56 vs 7.34 ng/mL and 2.79 vs 4.29 ng/mL, p = 0.004, p = 0.013 and p = 0.012, respectively) (data not shown).
However, there were no significant differences in age, duration of diabetes, eGFR, ABI, PWV and hsCRP between the two groups (data not shown).
Discussion
To the best of our knowledge, this is the first report on serum fetuin-A and all microvascular complications including CAN in patients with T2DM. In the present study, the elevated serum fetuin-A levels seem to be associated with IR, as assessed by the HOMA-IR in patients with T2DM. This result is in line with previous studies showed a pathogenic link between fetuin-A and IR, while there are no associations of fetuin-A with each microangiopathies including CAN.
Previous epidemiological studies showed an independent association between fetuin-A and IR and future development of diabetes mellitus in general population.7,18–20 In consistent with our study result, Song et al. 5 reported that HOMA-IR increased across fetuin-A quartiles in Chinese T2DM patients.
We found that fetuin-A is negatively correlated with adiponectin levels. A negative correlation between fetuin-A and adiponectin has been shown in general population studies. 19 Hennige et al. 21 reported that fetuin-A repressed adiponectin mRNA expression of human in vitro differentiated adipocytes and induced inflammatory cytokine expression. In addition, in agreement with our study, Roos et al. 13 reported inverse correlation with serum adiponectin and fetuin-A in 153 T2DM patients with early diabetic nephropathy. Also, our study demonstrated a positive correlation between the fetuin-A and TNF-α levels. There is no previous study to investigate the relationship between fetuin-A and TNF-α in patients with T2DM. This result suggests that the TNF-α promoting inflammatory reaction may be associated with fetuin-A in T2DM patients.
Epidemiological studies have demonstrated a significant positive relation between serum fetuin-A and MS in different populations. Data from the study by Xu et al. 22 revealed that serum fetuin-A levels were strongly and independently associated with MS and its components in community-dwelling Chinese adults. An independent impact of serum fetuin-A on MS was mainly demonstrated in nondiabetic subjects. Therefore, the association of fetuin-A and MS in patients with T2DM needs to be explored. However, in our present study, a significant association with MS was not detected, and serum fetuin-A was not associated with adiposity per se, as assessed by BMI. Consistent with our study, Ishibashi et al. 19 reported that a significant association fetuin-A with MS was not detected in Japanese men. Also, Roos et al. 23 could not demonstrate an association of fetuin-A with MS in patients with manifesting coronary heart disease (CHD) in a 6-year follow study. It is not clear why contradictory results have been reported regarding the association of serum fetuin-A levels with the presence of MS. One of the possible explanations is that the patients with T2DM may already control the components of MS via lifestyle modification, anti-diabetic, anti-hypertensive or anti-lipidaemic medications such as statin medication more strictly than general population. We think that such factors may act confounding factors. Also, the definitions of MS are different between the studies. We used a modified National Cholesterol Education Program (NCEP) definition with BMI instead of waist circumference because waist circumference was not available in the majority of the subjects. The MS prevalence in our study was 50.5%. According to the study by Kim et al., 24 the prevalence of MS for total of 4240 diabetic patients from endocrine clinics of 13 university hospitals using the criteria of the American Heart Association (AHA)/National Heart, Lung, and Blood Institute (NHLBI) and the criteria of waist circumference from the Korean Society for the Study of Obesity (≥90 cm in men and ≥85 cm in women) was 77.9%. They analysed abdominal obesity using waist circumference, and prevalence of having abdominal obesity was 56.8%. In our study, prevalence of abdominal obesity using BMI was 41.3%. In our thought, various diagnostic criteria of MS may cause considerable differences of prevalence of MS. BMI as the indicator for obesity might have caused misclassification and underestimation of MS status.
So far, there is few data available for the associations of fetuin-A with diabetic microangiopathies. This present study examined the relationship between fetuin-A and microangiopathies including CAN. Our study showed no associations of fetuin-A with microvascular complications (nephropathy, retinopathy and peripheral neuropathy). Although serum fetuin-A levels were borderline significantly correlated with score of CAN, fetuin-A did not differ between patients with and without CAN. In addition, we included the evaluation of the relationship of heart rate variability (HRV) parameters with the serum fetuin-A levels. As a result, there were no associations of serum fetuin-A levels with HRV parameters (data not shown). Regarding diabetic nephropathy, we observed that neither eGFR nor albuminuria was associated with serum fetuin-A levels. Also, we could not identify significant differences of serum fetuin-A levels between those taking ACEI/ARB and not taking them in patients with diabetic nephropathy. Roos et al. 13 studied the associations of serum fetuin-A levels with diabetic nephropathy–based albuminuria and prevalent polyneuropathy. In agreement with our study, they reported serum fetuin-A levels did not differ among patients with versus without polyneuropathy. Also, fetuin-A levels were not associated with the degree of albumin excretion. On the contrary, the study by Ramadan et al. 25 demonstrated that fetuin-A levels seem to be associated with the development and progression of nephropathy. Regarding DR, serum fetuin-A levels did not differ among patients with versus without retinopathy. To our knowledge, no study has evaluated the association of fetuin-A with DR or CAN.
In this study, we examined the relationship between fetuin-A and baPWV and ABI as parameters of macrovascular disease. Previously, several studies have presented that fetuin-A could play a role in the development of macrovascular disease in T2DM. Ix et al. and Roos et al. explained the role of fetuin-A on CVD as a U-shaped or biphasic relationship. Ix et al. 26 considered that high levels by association with MS and atherogenic lipids result in CVD; low levels by associations with vascular complication also result in CVD. Roos et al. 13 considered that relatively healthy patients without pre-existing vascular disease show associations of higher fetuin-A with metabolic and vascular risks, while patients with prevalent vascular disease have decreased fetuin-A levels.
Our study showed serum fetuin-A levels positively correlated with mean baPWV. Whereas serum fetuin-A levels showed a negative correlation with the aortic PWV in patients on dialysis and in relatively healthy subjects with normal renal function, little is known of the role of fetuin-A as an independent predictor for the development of arterial stiffness in non-dialysis T2DM.27–29
In this present study, serum fetuin-A showed negative correlation with mean ABI. In agreement with our study, Lorant et al. 11 showed that serum fetuin-A levels in a non-dialysis condition are higher in T2DM-PAD patients than in patients with diabetes alone. As fetuin-A is a potent circulating inhibitor of the precipitation of calcium and phosphorus and vascular calcification, non-compressible arteries at ABI measures may relate to more arterial calcification and arteriosclerosis and so lower fetuin-A may occur. In contrast to the study by Lorant et al., Eraso et al. 12 reported that lower fetuin-A is associated with T2DM-PAD, and Roos et al. 13 reported positive association. Study in community-dwelling persons showed that no association of fetuin-A was observed with PAD as defined by ABI of <0.9. 30 Also, serum fetuin-A levels were significantly positively correlated with traditional CV risk factors such as systolic BP, total cholesterol and triglyceride in our study. Regarding the CV risk factors, inconsistent results have been reported. Our results are in agreement with findings in several cross-sectional studies, which showed an association of high fetuin-A levels with lipid profile such as high triglyceride.8,26,31 Our observation of associations between serum fetuin-A and triglyceride, BP and cholesterol are consistent with a possible pathogenetic role for fetuin-A in the associations with the IR. However, in contrast to our study, Roos et al. 13 reported that fetuin-A showed positive association with ABI and no significant correlations with metabolic parameters. In addition, Ramadan et al. 25 reported that fetuin-A levels do not correlate with some clinical and metabolic parameters as BMI, BP, total cholesterol, HDL and triglyceride in T2DM patients with early diabetic nephropathy.
The reason why results between published studies have been inconsistent concerning the effects of fetuin-A on macroangiopathies and microangiopathies is not clear. Some possible explanations can be suggested. First, the discrepancy may be due to differences of study populations, that is, T2DM or non-diabetes. Second, different distributions of severity of microangiopathies in the study participants may be another reason. The proportions of patients with advanced stage of microangiopathies differed among the published studies. As an example, in our study, mean eGFR was 82 (mL/min), and the number of participants with advanced nephropathy may have been too small.
Recent study demonstrated that insulin-sensitising therapy, pioglitazone, reduced serum fetuin-A levels in patients with T2DM. 32 Therefore, we divide them into pioglitazone-treated group (n = 28) and non-treated group (n = 144) for adjustment of medication that may be affecting fetuin-A levels. There were no significant differences in serum fetuin-A levels between two groups (pioglitazone-treated group vs non-treated group, 522 vs 537 µg/mL, p = 0.648) (data not shown).
Several limitations of our study should be addressed. First, due to the cross-sectional design, we cannot determine the causative relationship between fetuin-A and IR and diabetic complications. Prospective studies are required to address this important question. Second, because our study population included individuals who received the several diabetic complication studies, some characteristics of the present study population may be substantially different from other populations that did not perform complication study. Therefore, the generalisability of our study may be limited. Third, the present study included a small numbers of subjects. A larger number of patients should be analysed for the confirmation of our results. Fourth, we used HOMA-IR as index of IR. HOMA-IR is less useful in insulin-deficient conditions such as diabetes and may not give appropriate results in subjects with severely impaired or absent beta-cell function. However, HOMA-IR is likely to be the most simple repeatable index in diabetic clinics, and log (HOMA-IR) may be useful for evaluation of IR in individuals with mild-to-moderate diabetes. 33 We performed logarithmic transformations before the analysis. Fifth, we could not adjust properly for dietary habits, such as caloric restriction, that may be affecting fetuin-A levels, because of incomplete data. However, our study is meaningful in that this is the first study in patients with T2DM for the evaluation of associations between fetuin-A with all diabetic microangiopathies.
In conclusion, the higher serum fetuin-A levels are associated with IR assessed by HOMA-IR but not with microangiopathies in Korean T2DM patients. Future prospective studies with larger numbers of patients are required to establish a direct relationship between serum fetuin-A levels and the development or severity of diabetic vascular complications.
Footnotes
Conflict of interest
None declared.
Funding
This research received no specific grant from any funding agency in the public, commercial or not-for-profit sectors.