
Abstract
Objective:
Low testosterone has been associated with increased cardiovascular risk and glucose abnormalities. This study explored the prevalence of low testosterone, dynamics over time and prognostic implications in acute myocardial infarction patients with or without glucose abnormalities.
Methods:
Male acute myocardial infarction patients (n = 123) and healthy controls (n = 124) were categorised as having normal or abnormal glucose tolerance (impaired glucose tolerance or diabetes) by oral glucose tolerance testing. Testosterone was measured at hospital admission, discharge, 3 and 12 months thereafter in patients. Patients and controls were followed for 11 years for major cardiovascular events (cardiovascular death/acute myocardial infarction/stroke/severe heart failure).
Results:
At hospital admission, more patients had low testosterone (⩽300 ng/dl) and lower median levels than controls (64 vs 28%; p < 0.001 and 243 vs 380 ng/dl; p < 0.01). At the subsequent time points, testosterone had increased to 311, 345 and 357 ng/dl. Patients with abnormal glucose tolerance had the highest prevalence (75%) of low levels. In adjusted Cox regression models, neither total nor free testosterone predicted major cardiovascular events.
Conclusion:
Low testosterone levels were common in male acute myocardial infarction patients in the acute phase, especially in the presence of abnormal glucose tolerance, but increased over time indicating that testosterone measured in close proximity to acute myocardial infarction should be interpreted with caution.
Keywords
Introduction
Male sex is associated with increased cardiovascular (CV) risk, and the male sex-hormone testosterone has attracted attention in this context.1,2 Several epidemiologic papers and meta-analyses of observational studies suggest an association between low testosterone levels and CV and all-cause mortality.1,3–5 However, while some studies have failed to demonstrate such relation, 6 others have shown a more consistent association between free rather than total testosterone and prognosis.7,8 A caveat when assessing the relationship between testosterone and cardiovascular disease (CVD) is that testosterone levels are affected by sampling conditions including medical and psychological stress. Several guidelines discourage the measurement of testosterone during acute illness but lack a definition of an appropriate time after which to assess testosterone.9,10 Previous studies indicate a transient reduction of testosterone in patients hospitalised for acute myocardial infarction (AMI) but little is known about the dynamics of testosterone in patients during the immediate and recovery phase after an AMI.11,12 In addition, total as well as free testosterone levels in both acute and stable coronary artery disease (CAD) need further investigation. Higher levels of testosterone have also been associated with a reduced risk of type 2 diabetes mellitus (T2DM) in elderly men. 13 A meta-analysis comprised of prospective and cross-sectional studies suggested an independent relationship between T2DM, a well-known CV risk factor 14 and testosterone deficiency. 15 Thus, a hypothesis is that testosterone could explain part of the link between glucose abnormalities and CVD.
The prospective observational glucose in acute myocardial infarction (GAMI) study 16 categorised patients with AMI and healthy controls by means of an oral glucose tolerance test (OGTT) as having normal (NGT) or abnormal glucose tolerance (AGT), comprising impaired glucose tolerance and diabetes mellitus according to definitions established by the World Health Organization. The aim of this report was to explore the prevalence of low testosterone, its dynamics over time and the prognostic implications of testosterone on CV events in AMI patients and controls with or without glucose perturbations.
Methods
Study population and design
The design and main results of the GAMI study have been published elsewhere.16,17 In brief, GAMI included 181 patients (males = 68%) with AMI without known diabetes and with a blood glucose <11.1 mmol/L. Age- and gender-matched healthy controls (n = 185; males = 68%) without diabetes or any CVD apart from well-controlled hypertension were recruited from the general population. They visited the research clinic once for clinical assessment, blood sampling and an OGTT. This study comprises all male GAMI participants, 123 patients and 124 controls, with blood samples available for testosterone analyses. In patients, testosterone was analysed in fasting samples taken the day after hospital admission (n = 123), at hospital discharge (n = 115), 3 (n = 101) and 12 months (n = 87) later. In controls, testosterone was analysed in samples taken at the baseline visit. Glucose categorisation based on OGTT was available in 118 patients (NGT = 43, AGT = 75) and in all controls (NGT = 77, AGT = 47).
Definitions and outcome measures
Low levels of total testosterone were defined as ⩽300 ng/dl. 18
Free testosterone was determined based on Vermeulen formula with albumin set at 43 g/L and an association constant of testosterone binding to albumin of 3.6 × 10⁴ L/mol. 19
Testosterone (total and free) was studied in relation to three endpoints. The primary endpoint was a composite of major CV events defined as the first occurrence of CV death (death from myocardial infarction, stroke, aortic dissection or sudden death without obvious reasons), nonfatal AMI, nonfatal stroke or nonfatal severe heart failure necessitating hospital admission and intensified treatment. The two secondary endpoints were CV and total mortality. The number and nature of the CV events are presented in detail elsewhere. 17 Information on CV events in patients and controls was collected from hospital records reviewed for diagnosis and medical interventions. Information on mortality was obtained from the Swedish National Death Registry. Death certificates were validated against available hospital records by the study investigators. Only one patient and one control were lost to follow-up and data on outcomes are complete in all other patients and controls.
Laboratory analyses
Testosterone, luteinizing hormone (LH) and sex hormone–binding globulin (SHBG) were analysed in fasting blood samples drawn in the morning on the day after hospital admission, at hospital discharge, at 3 and 12 months post-discharge for patients and from the baseline visit for controls. Testosterone was extracted from serum using solid phase extraction, thereafter eluted by high-performance liquid chromatography and determined by mass spectrometry. The linear range was 1.0–1000 ng/dl (r ⩾ 0.9995) with lower limit of sensitivity at 1 ng/dl and inter-assay coefficient of variation <7%. The analyses were performed at Brigham Research Assay Core at Brigham and Women’s Hospital in Boston, USA.
LH and SHBG were determined using solid phase sandwich enzyme-linked immunosorbent assays (ELISA), Human LH ELISA (BQ Kits, San Diego, CA, USA) and Human SHBG Quantikine ELISA (R&D system, Abingdon, UK). The LH assay had a sensitivity of 1 mIU/ml with intra- and inter-assay coefficient of variation at 5.0% and 8.4%, respectively. The SHBG assay had a sensitivity of 0.5 nmol/l with intra- and inter-assay coefficient of variation at 4.9% and 9.9%, respectively.
Statistical analyses
Continuous variables are presented as medians and interquartile ranges and categorical data as numbers and percentages. The prevalence of total testosterone deficiency (⩽300 ng/dl) at different time points is described as numbers of individuals (n) and proportions (%). The testosterone and LH ratio at the different time points was calculated as testosterone (total or free) in ng/dl divided by LH in mIU/ml. Differences between patients and controls and the subgroups NGT versus AGT were evaluated by means of the Wilcoxon two-sample test for continuous variables (e.g. testosterone levels) and chi-square test for dichotomous variables (e.g. prevalence of low testosterone).
The relationship between an increase of one standard deviation (SD) of testosterone and the three endpoints were assessed with Cox’s proportional hazard regression to be presented as hazard ratio (HR) and 95% confidence interval (CI). Adjustments were made for smoking, body mass index (BMI), SHBG and glucose levels 120 min post-OGTT separately and combined. Baseline samples were those at the day after hospital admission for patients and at the baseline visit for controls. The SD was calculated separately for patients and controls. A two-sided p-value <0.05 was considered as significant. All statistical analyses were carried out by use of the SAS 9.4 system.
Ethical considerations
The GAMI study was approved by the local ethics committee at Karolinska Institutet, Stockholm, Sweden and complies with the Declaration of Helsinki. All patients provided written informed consent.
Results
Clinical characteristics
Clinical and biochemical characteristics for the study cohort are outlined in Table 1. Patients had a more frequent history of previous AMI, hypertension and hyperlipidaemia. Patients were more often smokers and more frequently prescribed β-blockers and statins. Capillary blood glucose, HbA1c and creatinine were higher in patients than controls. Glucose categorisation at discharge disclosed AGT in 75 patients (64%) compared to 47 (38%) in the control group.
Baseline characteristics for patients and controls. Data from the first day after hospital admission or baseline presented as n (%) or median and interquartile range. P-values denote significance between groups.
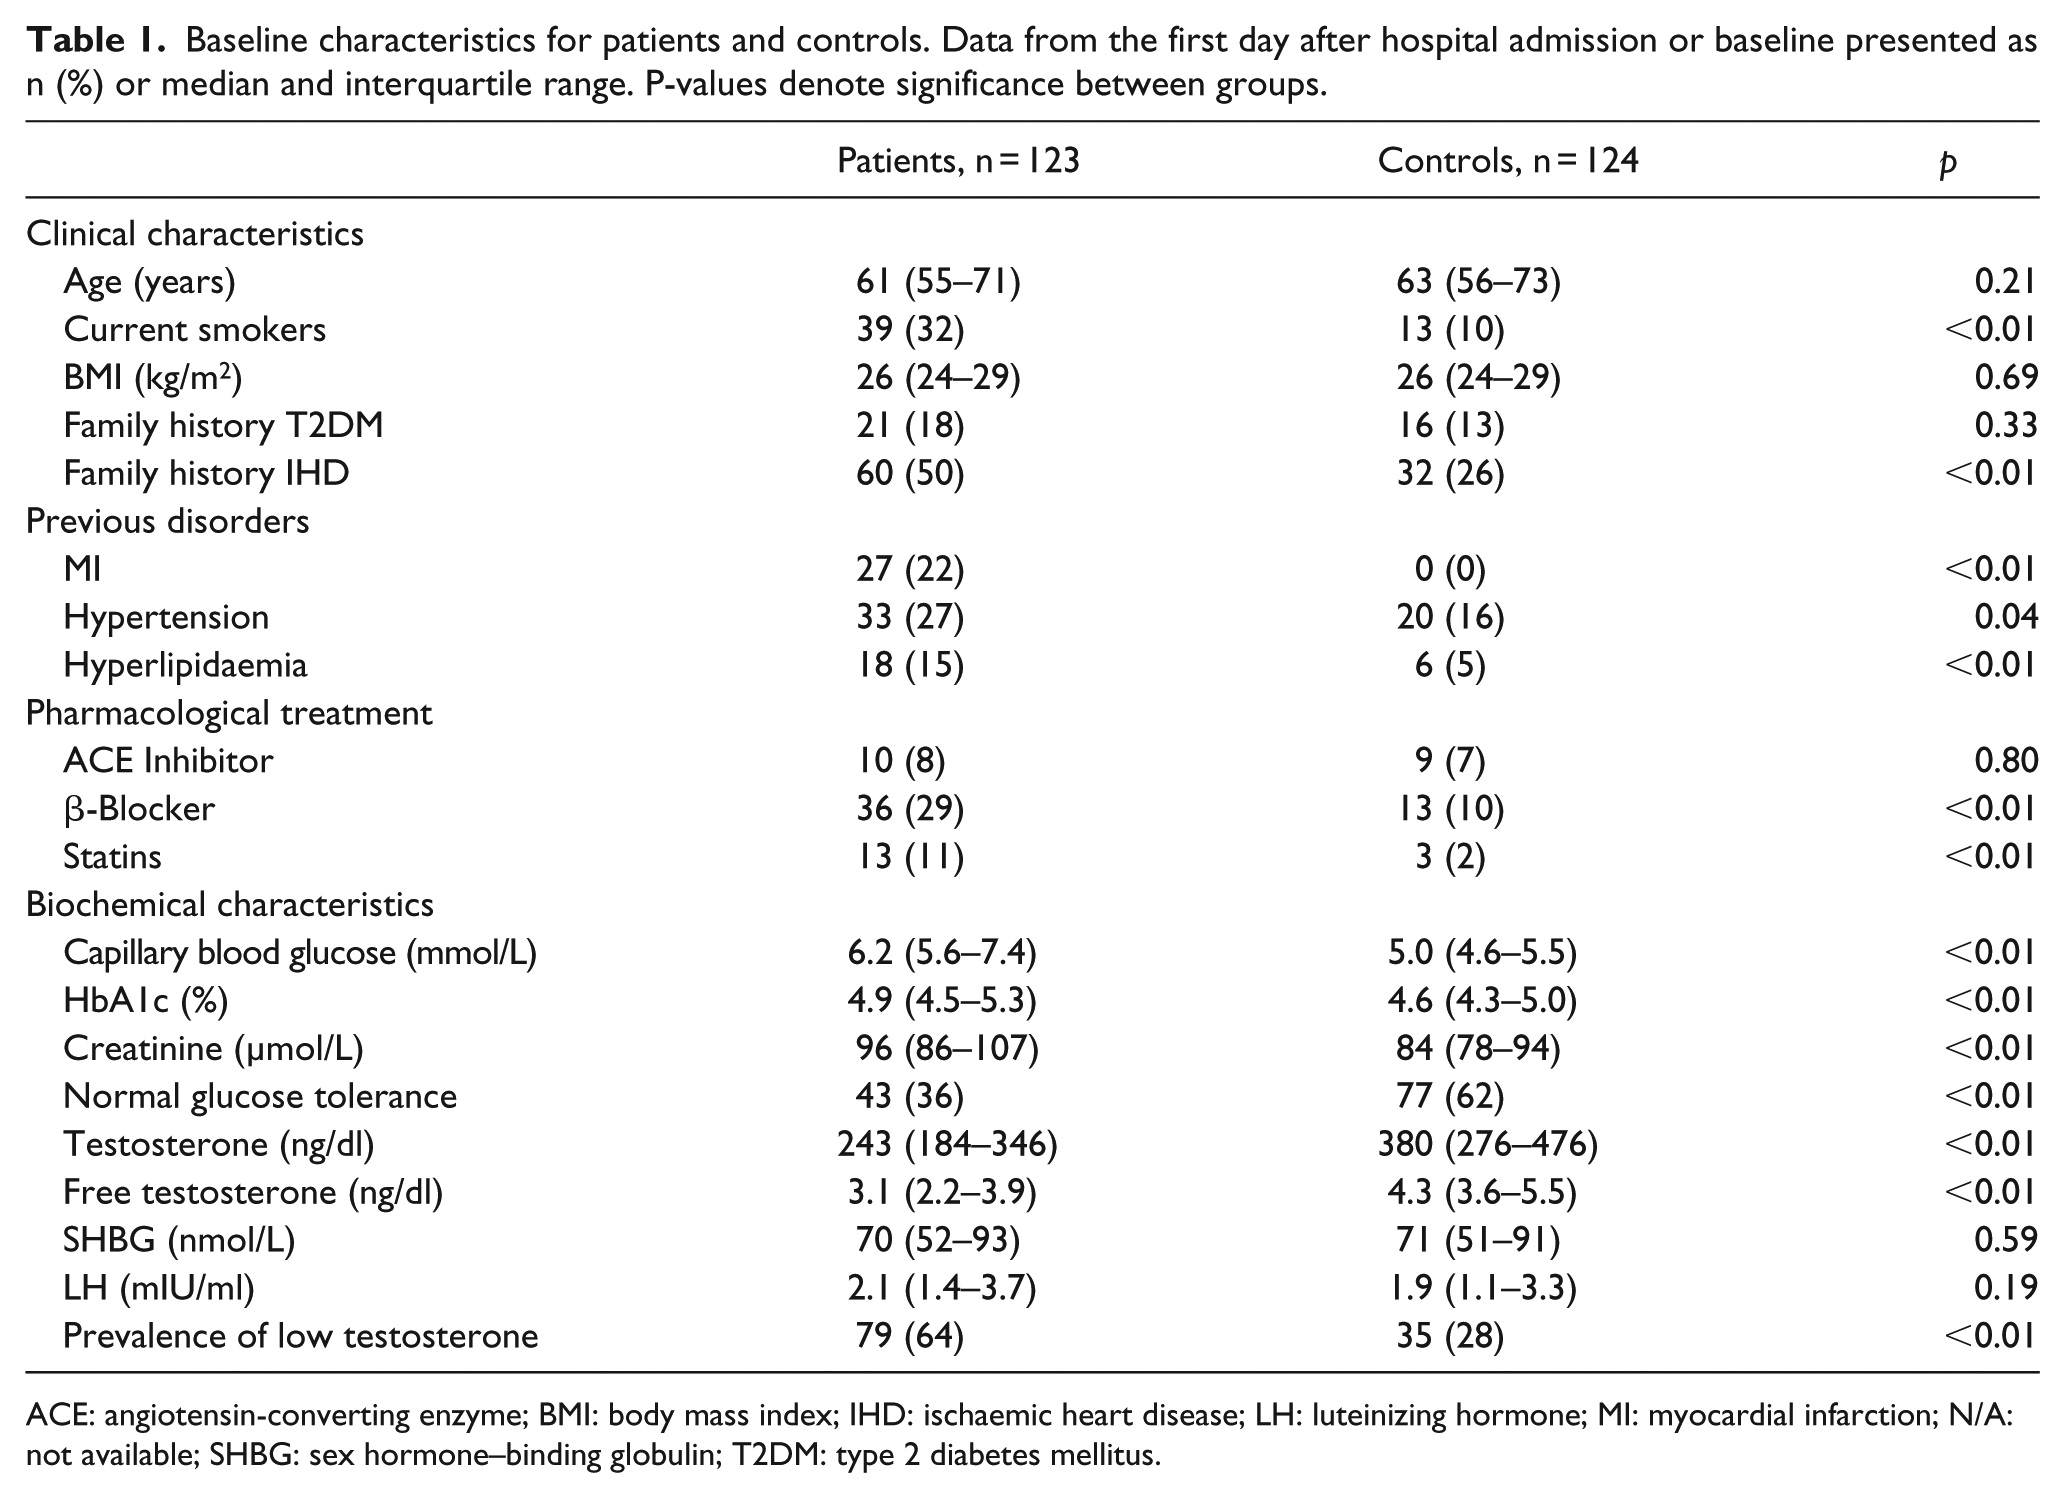
ACE: angiotensin-converting enzyme; BMI: body mass index; IHD: ischaemic heart disease; LH: luteinizing hormone; MI: myocardial infarction; N/A: not available; SHBG: sex hormone–binding globulin; T2DM: type 2 diabetes mellitus.
Testosterone levels over time
Around 64% of the patients had low total testosterone levels (⩽300 ng/dl) on the day after admission compared to 28% of the controls at baseline (p < 0.001). The proportion of patients with low total testosterone decreased over time from 46% at hospital discharge to 35% after 3 and to 30% after 12 months, a prevalence similar to that of the controls.
Total testosterone levels at the day after admission were significantly lower in patients than in controls (243 vs 380 ng/dl; p < 0.01; Table 1). At discharge, the median total testosterone levels had increased to 311 ng/dl and continued to increase to 345 ng/dl after 3 and 357 ng/dl after 12 months (Table 2). A similar development was observed for free testosterone with median levels after admission of 3.1 and 3.5 ng/dl at discharge, 4.2 ng/dl after 3 months and 4.3 ng/dl after 12 months, that is, the same level to that observed among the controls (Table 2). On the first day after admission, the total testosterone/LH ratio (TT/LH) was 115.7 in the patient cohort (data not shown). At the following time points, TT/LH was 163.2, 156.8 and 162.3. The free testosterone/LH ratio (FT/LH) was 1.5, 1.8, 1.9 and 1.9, respectively, at the different time points. In controls, the TT/LH ratio was 200 and the FT/LH ratio 2.3.
Total and free testosterone levels (ng/dl) for patients and controls and prevalence of low total testosterone (% ⩽300 ng/dl) with regards to glucose categorisation. Testosterone levels presented as median and interquartile range. P-value denotes significance between testosterone levels in AGT versus NGT group.
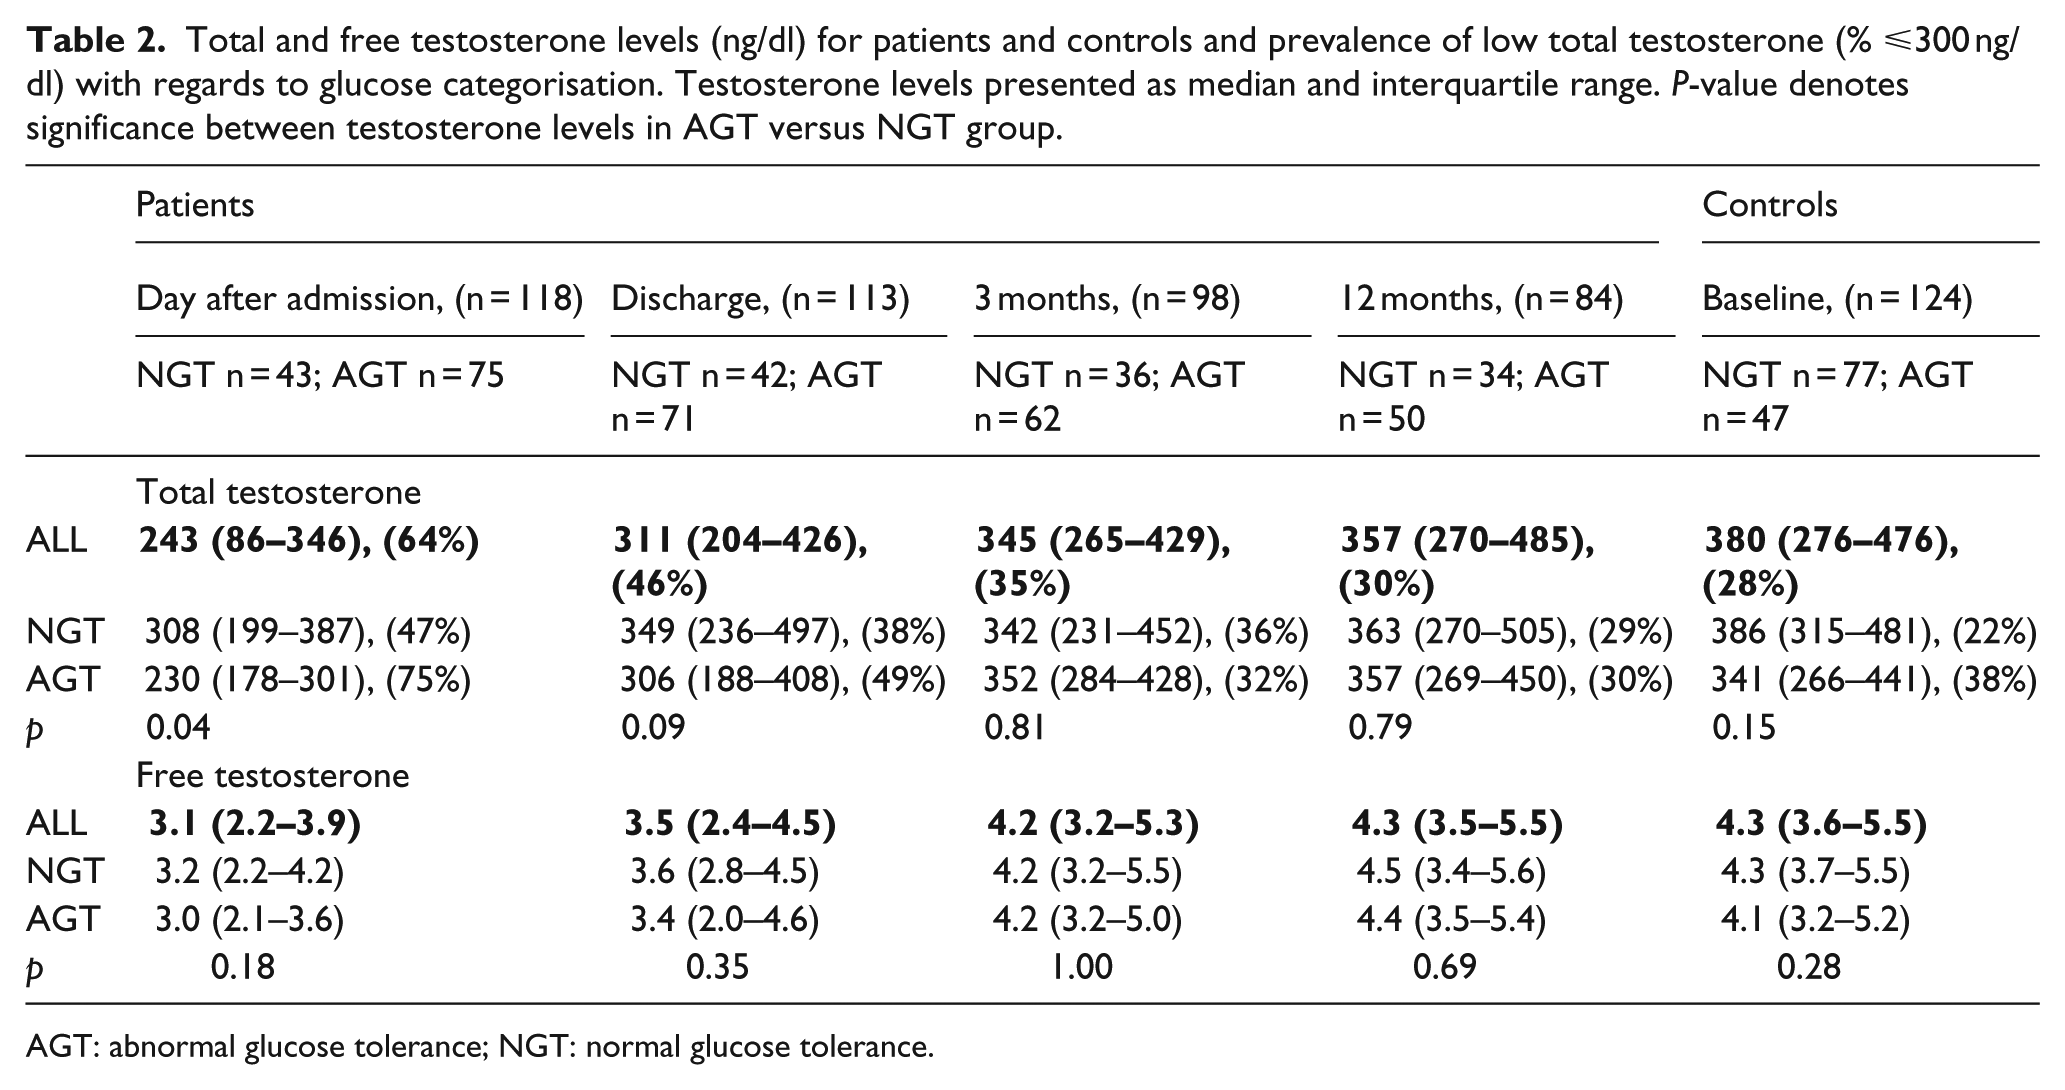
AGT: abnormal glucose tolerance; NGT: normal glucose tolerance.
Testosterone by glucose category
Subgroup analyses of total and free testosterone and the prevalence of low total testosterone by glucose category is shown in Table 2. On the day after admission total testosterone levels were lower in patients with AGT than NGT and the prevalence of low testosterone was higher (p = 0.002). This difference between patients with AGT versus NGT had disappeared at the time for discharge and thereafter. Among controls, there was no difference in the median testosterone levels and no significant difference in prevalence of low testosterone between AGT versus NGT group (38 vs 22%, p = 0.05). The levels of free testosterone did not differ between patients or controls with AGT and NGT at any of the time points.
Testosterone as a predictor of outcome
Patients and controls were followed during a median time of 11.6 and 10.4 years, respectively. The number of events is presented in Figures 1 and 2. No significant difference was shown in total or free testosterone levels at admission or discharge in patients with regards to any of the three outcomes (data not shown). However, controls suffering CV or total mortality had significantly lower levels of free testosterone than their event free counterparts [3.2 ng/dl (3.1–4.3) vs 4.3 ng/dl (3.7–5.5); p < 0.05 and 3.7 ng/dl (3.1–4.6) vs 4.3 ng/dl (3.8–5.5); p = 0.02].
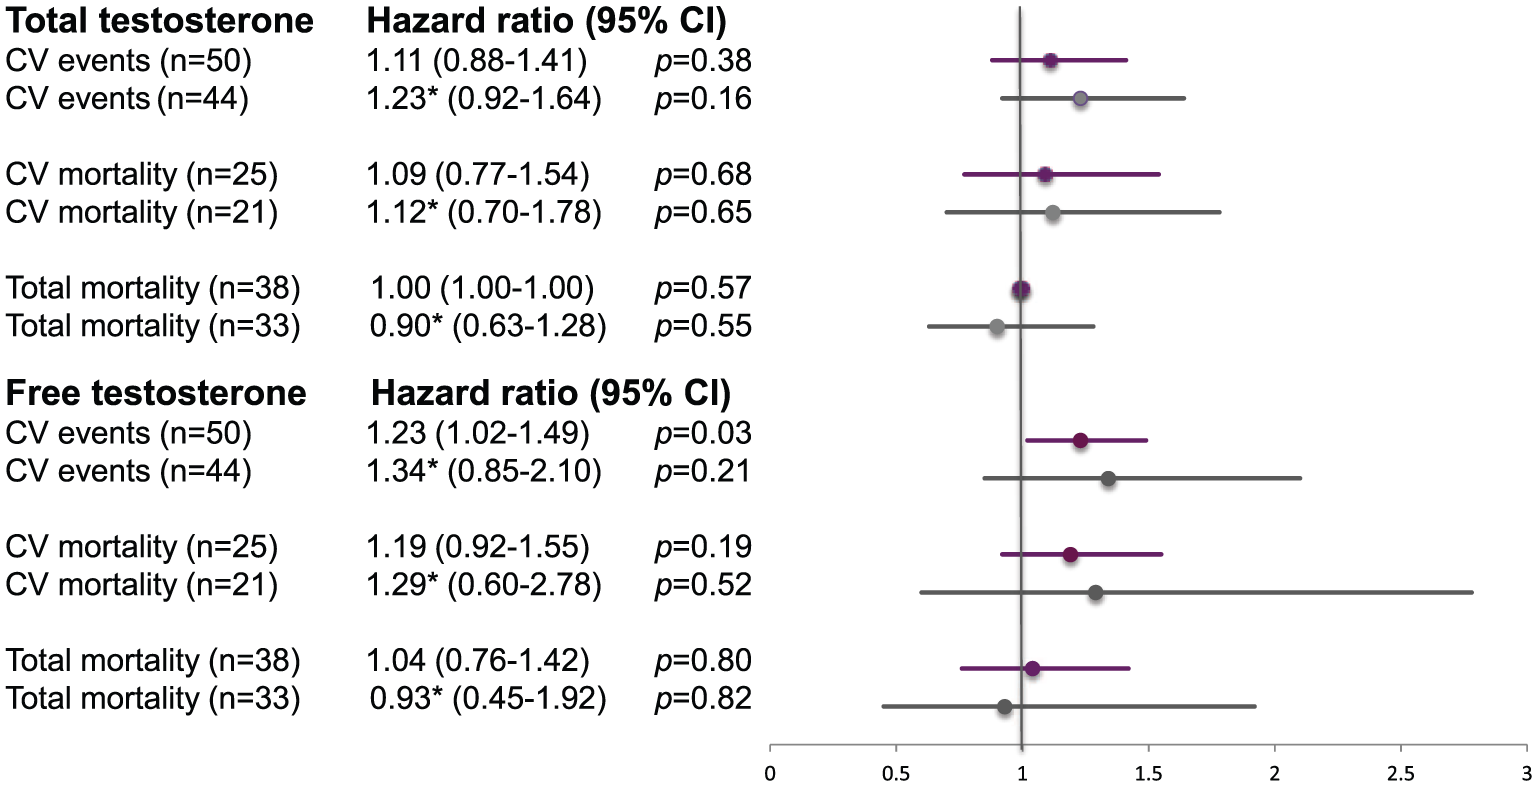
The predictive ability of testosterone in patients. Increments by 1 SD for patients from samples at the day after admission, before and after adjusting for confounders in a multivariable model. Data are presented as number of events (n), hazard ratio (HR) and 95% confidence interval (CI) for cardiovascular (CV) events and CV and total mortality. Purple represents results before adjustments. Grey represents results after adjustments.
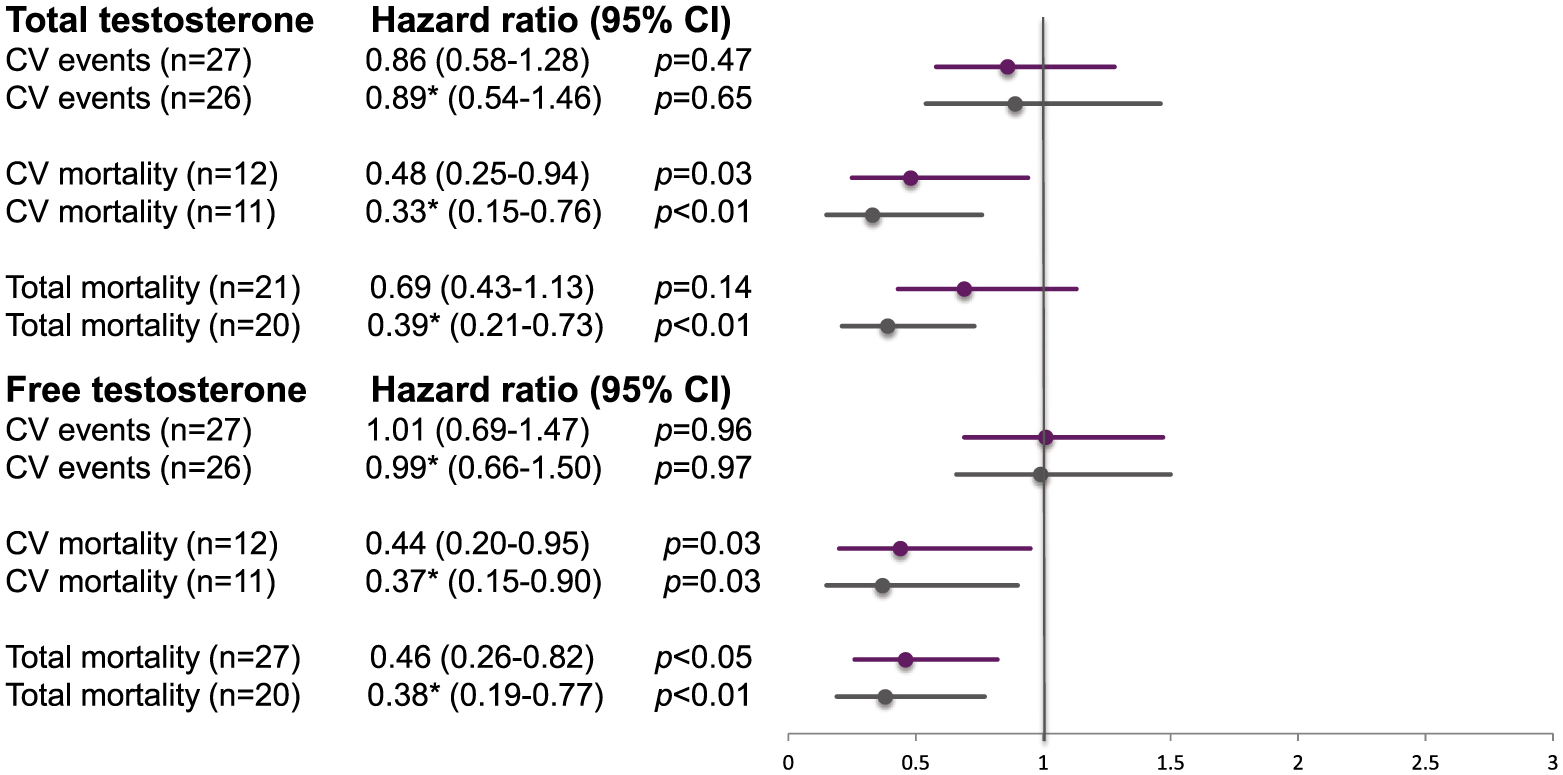
The predictive ability of testosterone in controls. Increments by 1 SD for controls at baseline before and after adjusting for confounders in a multivariable model. Data are presented as number of events (n), hazard ratio (HR) and 95% confidence interval (CI) for cardiovascular (CV) events and CV and total mortality. Purple represents results before adjustments. Grey represents results after adjustments.
In Cox hazard regression analyses, an increment by one SD of total testosterone at admission (SD = 163.4 ng/dl; Figure 1) did not predict any of the studied outcomes in patients. An SD increment of free testosterone (2.93 ng/dl) predicted the primary CV endpoint in patients (HR = 1.23; 95% CI = 1.02–1.49; p = 0.03) and remained a significant predictor after univariate adjustments for post-load glucose. Following univariate adjustments for serum SHBG, BMI and smoking separately, and in the multiple model, it was, however, no longer significant.
In controls, an increment of total testosterone by one SD (SD = 153.1 ng/dl) decreased CV death by 52% (HR = 0.48; 95% CI = 0.25–0.94; p = 0.03) but did not influence the other endpoints before adjustments (Figure 2). Total testosterone remained a significant predictor for CV and total mortality even after adjustments including post-load glucose, serum SHBG, BMI and smoking (Figure 2). Furthermore, the analysis of free testosterone in controls (SD = 1.99 ng/dl) showed an association with lower CV (HR = 0.44; 95% CI = 0.20–0.95; p = 0.03) and total mortality (HR = 0.46; 95% CI = 0.26–0.82; p < 0.05), which remained significant after adjustments (Figure 2).
Discussion
An important finding in this study was that male patients with AMI had low testosterone levels at hospital admission but increased to similar values as seen among age-matched controls within a year. Moreover, in controls but not in AMI patients, higher endogenous total and free testosterone were associated with decreased risk for CV and total mortality.
As early as the 1970s, Wang et al. 11 reported on suppressed levels of testosterone during the initial phase of an AMI with a nadir after 4 days and a slow increase during the following 2 weeks. In another prospective case–control study, a transient reduction in both total and bioavailable testosterone was shown during the first 24 h in patients with AMI. 12 The authors hypothesised that the instant fall in testosterone levels could be related to a compromised hypothalamic-pituitary-testicular (HPT) axis in patients under acute stress. Suppressed activity in the HPT axis result in lower testosterone levels 20 as the pituitary via LH stimulates testosterone production through activation of Leydig cells in the testes. The study results are in line with former findings 21 but also expand previous knowledge by demonstrating that when testosterone levels were followed up to a year after an AMI, they recovered after 3 months. Whether the initially low testosterone is a physiological response to the acute condition or if it is part of the pathological syndrome of an AMI, which may justify studies to establish if acute testosterone supplementation might be of benefit, cannot be answered by this investigation. Although survival bias cannot be completely ruled out, the results indicate that diagnosing testosterone deficiency as an indication for testosterone treatment should not be performed in the acute phase.
The prevalence of low testosterone levels in the GAMI patients 12 months post-AMI (30%) and controls (28%) was similar to that in previous reports estimating the prevalence to 20%–30% in middle-aged men.22,23 An interesting finding was that the initial high prevalence of low testosterone and the low median testosterone levels were particularly evident among patients with AGT. This finding was supported by data from epidemiological observations where men with T2DM were reported to have lower testosterone levels than those without T2DM.24,25 A complex, bidirectional relation comprising insulin resistance, obesity and dysregulation of the HPT axis has been suggested for the pathophysiology behind low testosterone and T2DM.24,26 A possible hypothesis why patients with AGT have lower testosterone levels may relate to a more sensitive HPT axis, resulting in a stress-related inability to respond to LH stimulation, eventually in combination with decreased LH secretion. Indeed, when the acute phase of AMI was over, there was no difference in testosterone levels between AGT and NGT patients. Insulin resistance has been related to alterations in Leydig cell function with a decreased responsiveness to LH, resulting in lesser testosterone synthesis and release. 27 In this study, LH levels in patients and controls were similar at all time points while the testosterone/LH ratio at the day after admission was lower than at the subsequent time points of blood sampling. The findings are in line with previous data, where acute physical stress induces an immediate decrease in serum testosterone even though LH levels may be normal or elevated. The mechanism is not clear but an immediate suppression by inflammatory cytokines on androgen production in the Leydig cells is potentially involved. 28 The results fit with the assumption that insulin resistance is enhanced during the early phase of an AMI, 29 decreasing the ability of the testicles to respond to LH. In conclusion, the immediate fall in testosterone after an AMI, especially in patients with AGT, is likely related to multiple factors acting transiently at both central and peripheral levels. Thus, the results suggest a pathophysiologic mechanism that could support our hypothesis regarding the link between testosterone, insulin resistance and CVD.
Finally, total or free testosterone in patients at the day after admission for AMI did not predict any of the CV endpoints following adjustments for potential confounders. In a previous report by Malkin et al., 7 930 patients with testosterone levels below threshold and CAD had a lower survival rate than those with normal testosterone. Hence the temporary fall in testosterone levels due to AMI does not have the same prognostic importance compared to low testosterone levels in chronic conditions such as CAD. Several population-based reports have related diabetes and CAD to low testosterone levels on the basis of inflammatory response. 1 In this study, both free and total testosterone were significant predictors of CV and total mortality in controls post-adjustments, whereas they were not in patients. This is consistent with previous data from the Epic-Norfolk and MrOS (Osteoporotic fractures in Men) study,4,5 in which testosterone significantly predicts CV mortality in study participants drawn from the general population indicating that low testosterone could be a marker for chronic conditions influencing prognosis in healthy subjects. Taken together, these results suggest that low testosterone has a more important role for the future CV risk in healthy males than those admitted for AMI and that the temporarily low testosterone levels post-MI does not have a prognostic implication.
Strengths and limitations
The fairly limited number of studied subjects could influence the generalisability of the results. Moreover, all patients in this study had suffered an AMI, which makes the prognostic results applicable for such patients but not necessarily for patients with stable CAD. Nevertheless, the present observations were based on a long period of follow-up of a well-defined, consecutive cohort of male patients with AMI and a well-matched control group. 17 Another strength is that clinical and biochemical data were prospectively collected, and testosterone was estimated at four different time points during the first year after the AMI. However, all patients did not have testosterone measured at each time point due to technical problems and their condition. Moreover, the prognostic analyses were based on a single testosterone measurement in patients and controls. Another limitation could be uncertainties about the appropriate methodology to assess free testosterone. In this study, Vermeulen’s formula for calculation of free testosterone served as a proxy for measurements with equilibrium dialysis. 19 Limited access to equilibrium analysis and the sparse availability of reference data at this point left us relying on current methods. Finally, subgroup analyses according to glucose categorisation and prognosis were not performed due to limited number of events.
Conclusion
Low testosterone levels were common in male AMI patients in the acute phase, especially in the presence of glucose abnormalities, but levels increased over time, indicating that testosterone measured in close proximity to AMI should be interpreted with caution. Moreover, testosterone did not predict prognosis in patients with AMI; however, increasing testosterone levels were associated with improved total and CV survival in controls. This suggests that testosterone is a more important risk marker in healthy males than in those with a recent AMI and warrants further studies.
Footnotes
Acknowledgements
The authors would like to thank Åke Tenerz MD, PhD; Marja-Leena Ojutkangas RN and Camilla Hage RN, PhD for recruiting patients to the GAMI study and Christina Edman Jönsson RN for assistance in collecting patient records.
Declaration of conflicting interests
L.G.M reports grants from Bayer AG. Other authors have no competing interests relevant to the contents of this paper.
Funding
This study was supported by the Swedish Heart and Lung Foundation, by the Centre for Gender Medicine, Karolinska Institutet, Stockholm, and by an unconditional grant from Bayer AG, Germany.