
Abstract
Background:
Fluctuation of kidney function may signify intra-glomerular microvascular hemodynamic instability. We aim to examine the association of long-term serum creatinine and estimated glomerular filtration rate variability with diabetic retinopathy.
Methods:
We included type 2 diabetes mellitus patients who attended the Diabetes Centre in 2011–2014 and were followed up (median = 3.2 years). Digital colour fundus photographs were assessed for diabetic retinopathy at follow-up. Diabetic retinopathy severity was categorized into non-proliferative diabetic retinopathy and proliferative diabetic retinopathy. We conducted a nested case–control study involving 177 diabetic retinopathy (118 non-proliferative diabetic retinopathy, 50 proliferative diabetic retinopathy) and 327 age- and gender-matched non-diabetic retinopathy. Serum creatinine measured before follow-up visit was obtained (⩾3 readings/patient). Variability was calculated as intra-individual standard deviation/√n/(n – 1).
Results:
Diabetic retinopathy have higher adjusted-serum creatinine-standard deviation than non-diabetic retinopathy [9.1 (4.9–21.6) vs 5.4 (3.4–10.1) µM, p < 0.001]. After multivariable adjustment, adjusted-serum creatinine-standard deviation was associated with diabetic retinopathy [odds ratio = 1.47, 95% confidence interval (1.02–2.10), p = 0.04]. The area under the curve increased significantly after adding adjusted-serum creatinine-standard deviation [0.70 (0.65–0.75) vs 0.72 (0.68–0.77), p < 0.03]. Proliferative diabetic retinopathy have higher adjusted-serum creatinine-standard deviation than non-proliferative diabetic retinopathy [15.5 (6.6–39.7) vs 7.47 (4.52–17.8) µM, p < 0.001]. After adjustment, adjusted-serum creatinine-standard deviation remained associated with non-proliferative diabetic retinopathy [1.48 (1.04–2.12), p = 0.03] and proliferative diabetic retinopathy [2.43 (1.34–4.39), p = 0.003; p-trend = 0.002]. Similar findings were observed for estimated glomerular filtration rate variability.
Conclusion:
Serum creatinine and estimated glomerular filtration rate variability is associated with the presence and severity of diabetic retinopathy independent of intra-individual means. This may inform novel therapeutic strategies aiming to achieve stable renal function in type 2 diabetes mellitus.
Keywords
Introduction
Type 2 diabetes mellitus (T2DM) is a rapidly evolving global health issue, and Asia is the epi-centre of this epidemic. 1 The prevalence of T2DM among Singapore adults is projected to rise to 15% (13.8%–16.2%) in 2050. 2 Diabetic retinopathy (DR), one of the most important diabetic microvascular complications, is a leading cause of irreversible blindness among working age individuals around the world. 3 Although the overall prevalence of DR is lower in Asians (12.1%–23.0%) when compared with Western population (28.5%–43.5%), the prevalence of DR in Singapore (25.4%–35%) is higher than other Asian countries, reaching close approximation with Western countries. 3
DR and chronic kidney disease (CKD) may progress in a parallel manner, possibly because of shared risk factors (i.e. poor glycaemia control, systolic hypertension) and similar microvascular lesions in the glomerular and retinal vessels. 4 Previous studies have consistently demonstrated the association of worse kidney function with increased risk of DR among T2DM patients. 4 However, most studies have considered kidney function only at a single time point without consideration of variability over time. It is well recognized that kidney function markers derived from a one-time measurement may not provide sufficient and complete information to kidney function. 5
To date, few studies have applied intra-individual variability of kidney function over time by using repeated measures of estimated glomerular filtration rate (eGFR) or serum creatinine (SCr) to predict CKD progression or mortality. For example, greater variability in eGFR over 2-year duration has been associated with CKD progression even after adjustment for eGFR means and slopes among diabetic patients. 5 Two studies reported that increased variability of SCr over 3-year duration was associated with a greater risk of mortality in CKD patients.6,7 Recently, we have demonstrated and validated the association between higher SCr variability and elevated risk of onset of albuminuria in both discovery and validation cohorts of T2DM. 8 The fluctuation of kidney function measured as intra-individual variability of SCr and eGFR may signify intra-glomerular microvascular hemodynamic instability. This microangiopathic process, if similarly affect other vascular-bed systemically, may lead to other microvascular complications of T2DM, such as DR.
However, to date, there is no study on the association of variability in kidney function with DR. In this study, we aim to evaluate the association of SCr and eGFR variability with the presence and severity of DR in a multi-ethnic T2DM Asian cohort in Singapore.
Materials and methods
Study cohort
The Singapore Study of Macro-angiopathy and Micro-vascular Reactivity in Type 2 Diabetes (SMART2D) is a completed cross-sectional study conducted between August 2011 and February 2014 including a total of 2057 adults aged 21–90 years with T2DM. 9 The participants were recruited consecutively from a secondary hospital and a neighbouring primary-care public outpatient clinic in equal proportion in Singapore. Diagnosis of T2DM was based on American Diabetes Association criteria. The exclusion criteria included: type 1 diabetes, pregnant subjects, subjects with active inflammation (e.g. systemic lupus erythematosus) and cancer, subjects taking non-steroid anti-inflammation drugs on the same day of clinical/vascular/biomedical assessment, subjects on oral steroids equivalent to >5 mg/day prednisolone, those who could not fulfil the informed consent process and those who wore a pacemaker or any device that may be affected by electric current. After phlebotomy, those with fasting glucose < 4.5 mmol/L or > 15.0 mmol/L, and subjects with HbA1c > 108 mmol/mol (>12%) were also excluded from the study. 9 A total of 1329 patients have been followed up for a median of 3.2 years from September 2014. This study has been approved by the National Healthcare Group Domain Specific Review Board (NHG-DSRB). Individual written informed consent was obtained prior to enrolment in the study.
Assessment of DR
Single field photos, centred on the macula, were taken using non-mydriatic camera (pupils were not dilated); photos of both eyes were taken in all study subjects using a retinal camera (TRC-NW 200, Topcon Co., Japan) at follow-up visit. For each eligible eye, two digital colour fundus photographs were captured and assessed by a fellowship trained retina specialist in a masked fashion to minimize any possible bias. The photographs were not graded and labelled as ungradable if more than 50% of the retinal photographs were not clearly visible. DR was considered present if any characteristic lesions as defined by Early Treatment Diabetic Retinopathy Study were present. The minimum criterion for diagnoses of DR was presence of at least one definite microaneurysm and/or retinal haemorrhage. DR severity was further categorized into non-proliferative diabetic retinopathy (NPDR) and proliferative diabetic retinopathy (PDR). 10 DR was classified as NPDR based on the presence of one or more of the following features: microaneurysms, haemorrhages, hard or soft exudates, venous beading, and intraretinal microvascular abnormalities. DR was classified as PDR if there was neovascularization, pre-retinal haemorrhages, vitreous haemorrhage or panretinal laser photocoagulation scars. The severity of DR in the worse affected eye was used for retinopathy grading.
Totally, 957 patients with gradable fundus were included in the study. Given a significance level of 0.05, the minimum sample size is 94 for Cohen’s kappa value of 0.75 (good agreement) to achieve a study power of 0.8, 11 assuming 50% agreement between two raters under the prevalence of 8.6% non-DR, 21.4% NPDR and 70.0% PDR. Therefore, 119 patients were selected using probability sampling method and re-graded by the original grader in a masked fashion to establish the intra-grader reliability. Intra-rater reliability was excellent with an observed percentage agreement of 92.4% for the presence of DR (kappa = 0.79) and 89.9% for the severity of DR (kappa = 0.74).
SCr and eGFR variability
SCr was determined by enzymatic method on Roche/Hitachi cobas c system (Roche Diagnostic GmbH, Mannheim, Germany) at baseline and follow-up visit. Serial SCr measures during follow-up period were retrospectively obtained from electronic medical records in Khoo Tech Puat Hospital, Singapore. Among the 957 patients, 589 patients with at least three SCr readings in total were included in our study (Figure 1). Average SCr and SCr variability was calculated as the intra-individual mean (SCr-mean) and standard deviation (SD) (SCr-SD), respectively. Because the number of SCr observations (n) could influence SD, SCr-SD was divided by √n/(n – 1) (adj-SCr-SD) to adjust this possibility. 12 As a normalized measure of variability, the coefficient of variation for SCr (Cr-CV) was calculated as the ratio of adj-SCr-SD and SCr-mean to correct for larger SD because of higher absolute values of SCr. eGFR was calculated based on a widely used Chronic Kidney Disease Epidemiology Collaboration (CKD-EPI) equation in patients with diabetes. 13 Same methods were used to derive eGFR-mean and variability, including eGFR-SD, adj-eGFR-SD and eGFR-CV.
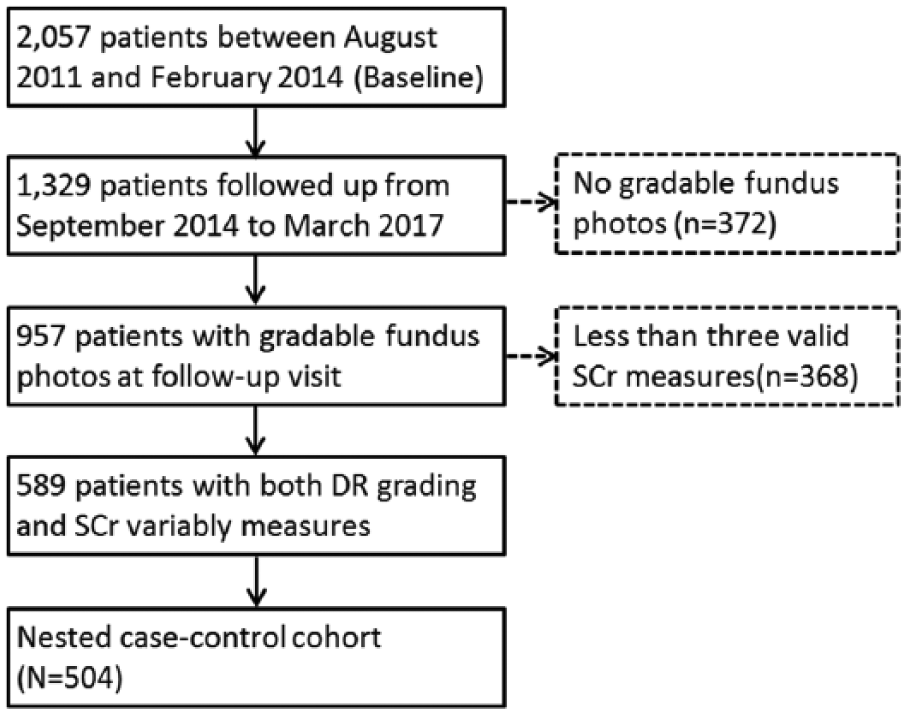
Inclusion and exclusion steps for the nested case–control study population.
Nested case–control study design
We conducted a nested case–control (prevalent cases) analysis nested in the cohort of T2DM patients with both gradable fundus and SCr or eGFR variability (n = 589). Generally, these 589 patients have similar profile compared to unselected subjects in SMART2D (Supplementary Table S1). T2DM patients without DR constituted the pool of patients for control selection. For each DR case, we randomly selected two control matched according to age (±3 years) and gender (Figure 1).
Baseline clinical and biochemical measurement
Body mass index (BMI) was calculated as body weight (kg)/height (m) 2 . Blood pressure was measured using a mercury sphygmomanometer on the right arm using appropriate cuff sizes. Systolic blood pressure (SBP) and diastolic blood pressure (DBP) were calculated from the average of three most consistent readings. Urinary albumin-to-creatinine ratio (ACR) was determined by urinary creatinine measured by enzymatic method on Roche/Hitachi cobas c system (Roche Diagnostic GmbH) and albumin measured by a solid-phase competitive chemiluminescent enzymatic immunoassay with a lower detection limit of 2.5 µg/mL (Immulite; DPC, Gwynedd, UK). Haemoglobin A1c (HbA1c) was measured based on monoclonal antibody agglutination reaction using a point-of-care immunoassay analyzer (DCA Vantage Analyzer; Siemens, Erlangen, Germany) certified by National Glycohemoglobin Standardization Program. High-density lipoprotein cholesterol (HDL-C) and low-density lipoprotein cholesterol (LDL-C) were quantified by enzymatic method using Kodak Ektachem chemistry slides. The intra- and inter-assay coefficients of variation were 5.7% and 7.7%, respectively. The sensitivity reported by the manufacturer was 4.12 pg/mL. Plasma level of two inflammatory factors known to be associated with diabetic vasculopathy, including pigment epithelium-derived factor (PEDF) and adiponectin, was quantified by enzyme-linked immunosorbent assay (ELISA) (Biovendor Laboratory Medicine, Modrice, Czech Republic) and multiplex immunoassays on a Luminex 200 platform (Affymetrix, Santa Clara, CA, USA), individually. Assessment for neuropathy was by a neurothesiometer (Horwell Scientific) for vibration and with a 10 g monofilament for light touch. 14 All foot examinations were performed by diabetes nurse educators who received standardized training and accreditation. Neuropathy was present if an abnormal finding in monofilament (inability to detect at least 8 of 10 points on either foot) or neurothesiometer testing of 25 V was detected. CKD was defined by the presence of eGFR < 60 mL/min/1.73 m2 or kidney damage as indicated by ACR ⩾30 mg/g. 15
Statistical analysis
Standard descriptive statistics were used to describe the characteristics of individuals with T2DM. Normally distributed continuous data were expressed as means and standard deviations (SDs). Skewed variables were expressed as median and interquartile range (IQR) and nature log (ln)-transformed before data analysis. Differences between groups were compared by t test or χ2 test where appropriate.
Conditional logistic regression model was used to evaluate the association of SCr and eGFR variability with the presence of DR in nested case–control study. Variables that were statistically significant in univariate analysis (Supplementary Table S2) or with putative roles in the pathobiology of DR were added for adjustment, including SCr-mean or eGFR-mean, ethnicity, T2DM duration, HbA1c, SBP, CKD, neuropathy, renin–angiotensin system (RAS) medication, PEDF and adiponectin. Other independent predictors for DR include T2DM duration, SBP and CKD. Performance in prediction of DR presence was assessed by area under the curve (AUC) calculated before and after addition of SCr or eGFR variability into the model. We also calculated the integrated discrimination improvement (IDI) and the net reclassification improvement (NRI) to examine whether DR prediction with addition of adj-SCr-SD or adj-SCr-eGFR was significantly improved. 16 Multinomial logistic regression was used to examine the associations of SCr and adj-SCr-eGFR variability with the severity of DR. Ordinal logistic regression models were used to estimate the overall trend of the above associations. All statistical analysis was performed using STATA version 14.0 (STATA Corporation, College Station, TX, USA). A two-tailed p value of less than 0.05 was considered as statistically significant. In collinearity test for each variable, the tolerance value is > 0.2 and variance inflation factor was < 3.5 for all variables, indicating that there is no serious problem with multicollinearity.
Results
Variability of SCr and eGFR with the presence of DR
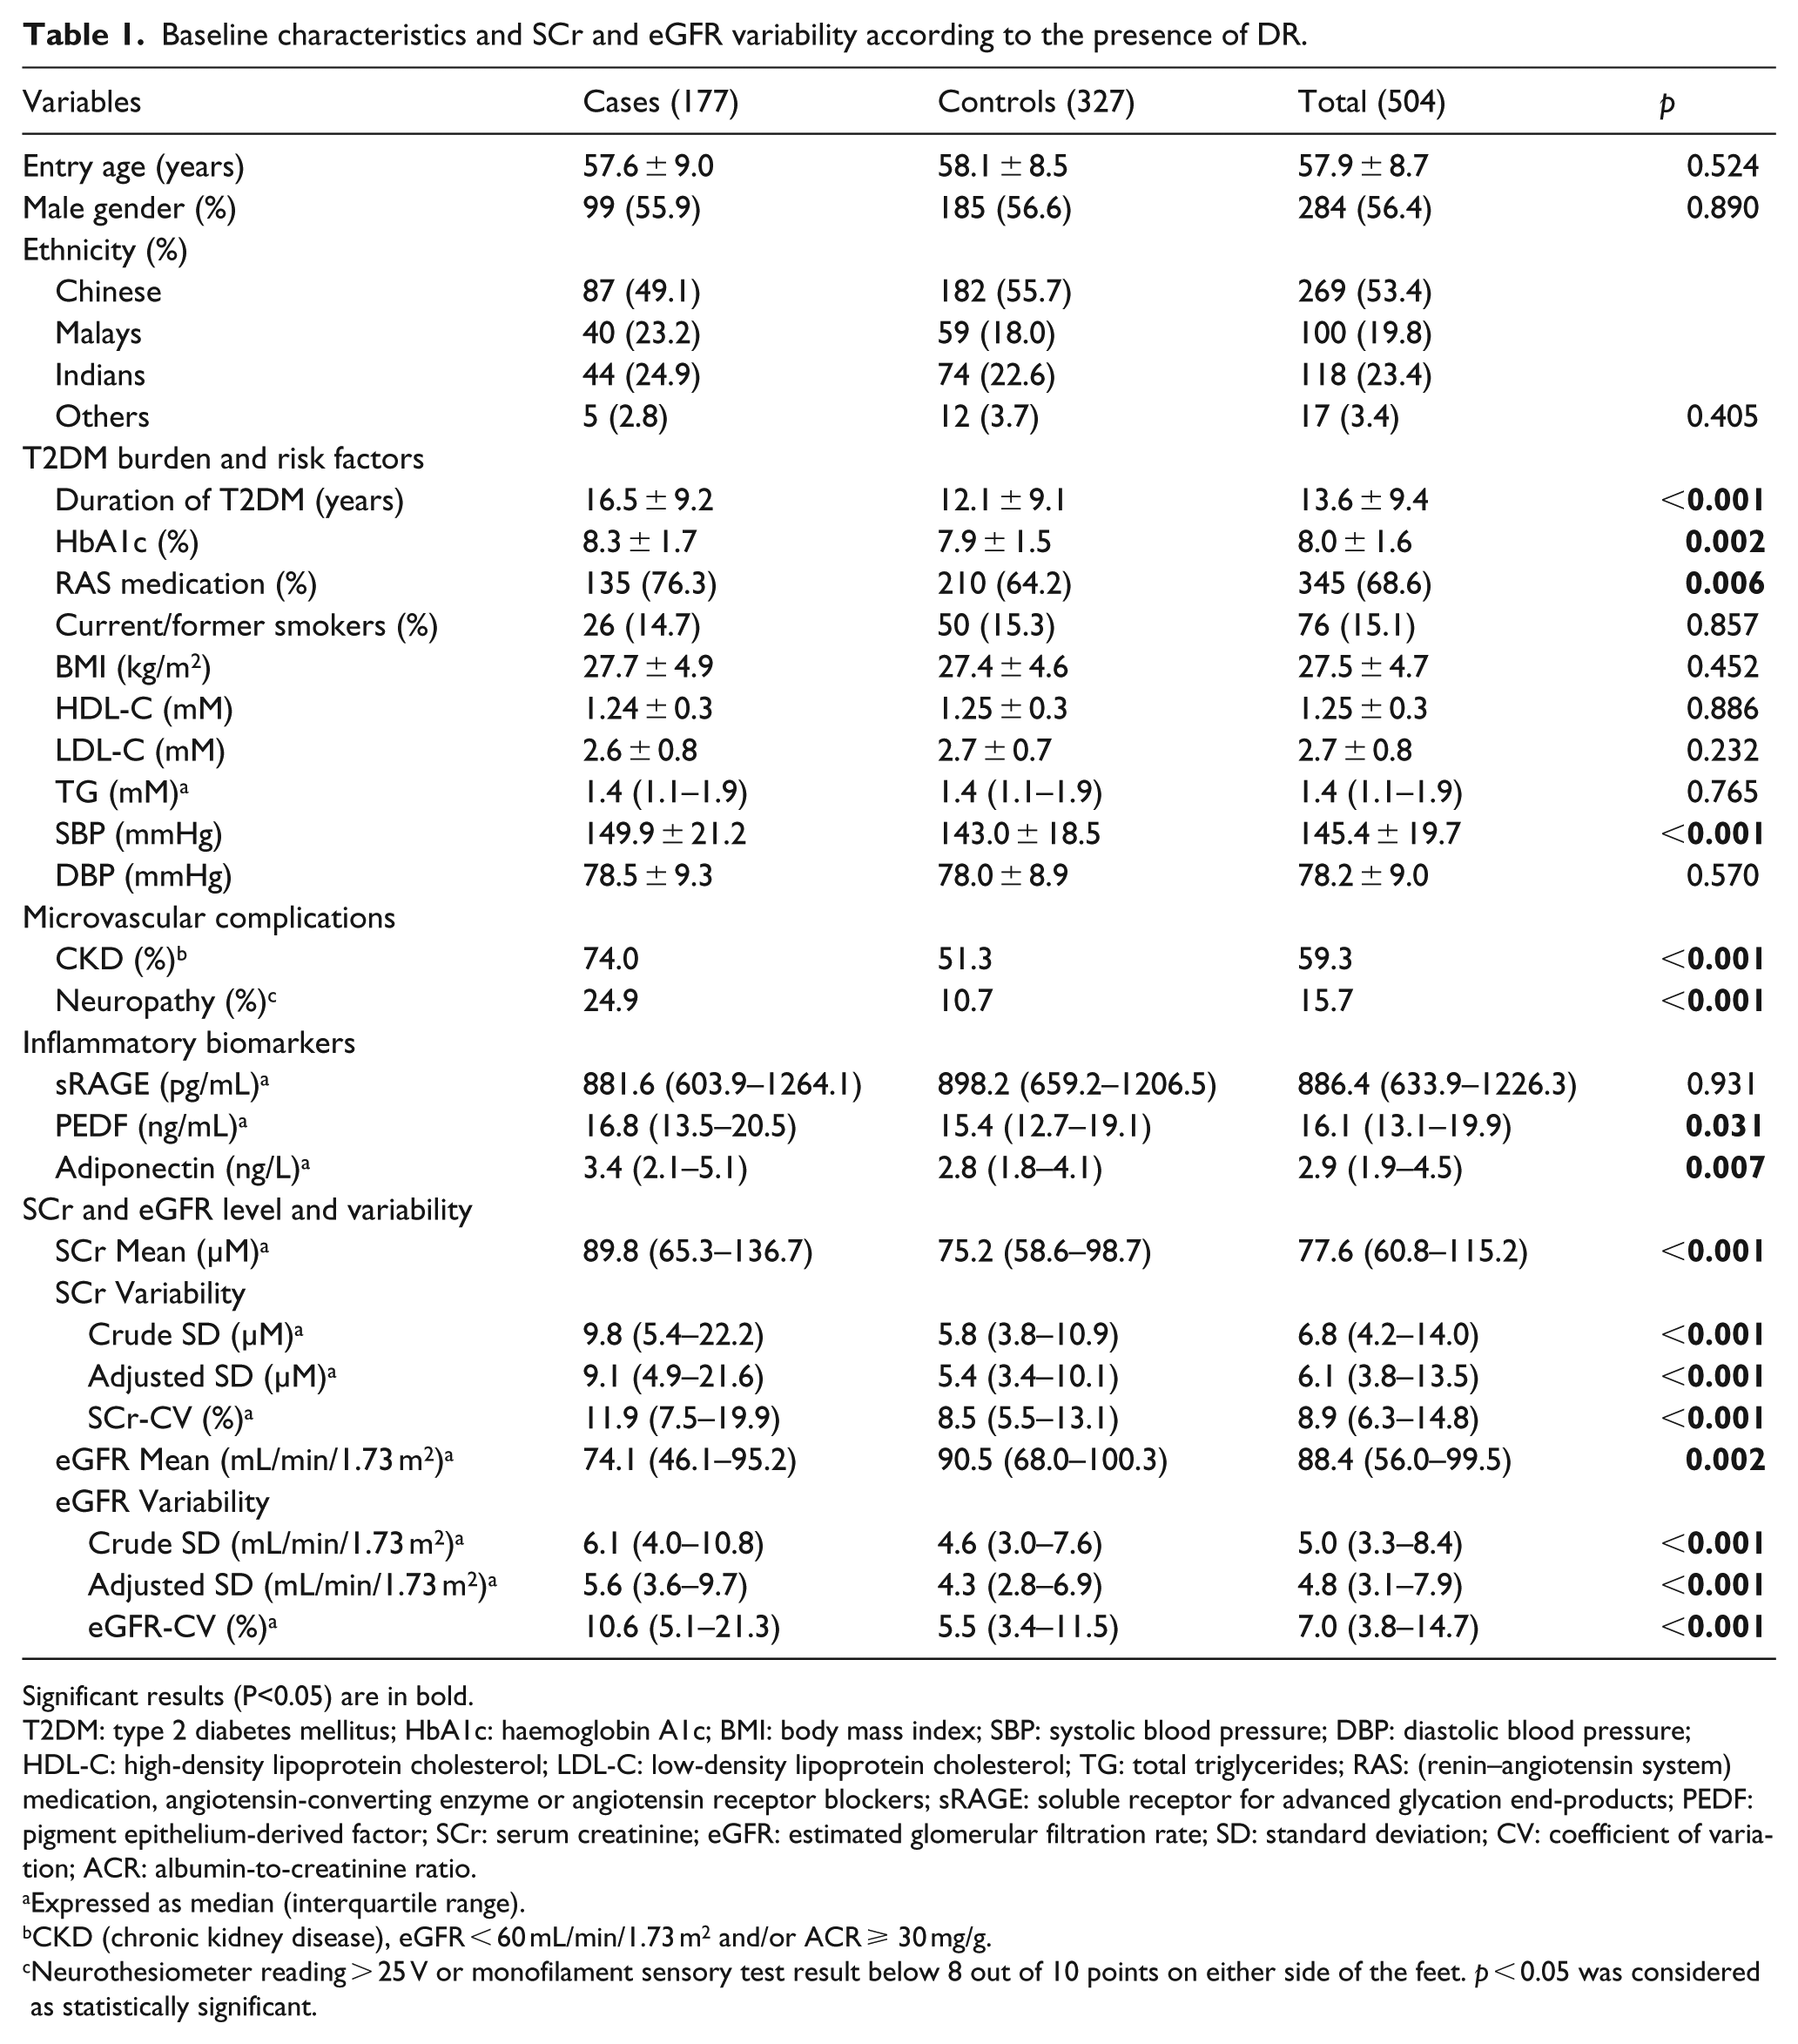
A total of 177 DR cases and a sample of 327 matched controls (27 unmatched) were identified. Table 1 shows the baseline characteristics. Compared with controls, DR cases had significantly higher SBP and HbA1c level, longer duration of T2DM, higher percentage of CKD, neuropathy and usage of RAS medication (angiotensin-converting-enzyme inhibitors or angiotensin receptor blockers), and higher level of PEDF and adiponectin. There were no significant differences in age, gender, ethnicity, BMI, smoking status, DBP, HDL-C, LDL-C, total cholesterol, triglycerides and neuropathy between DR cases and controls.
Baseline characteristics and SCr and eGFR variability according to the presence of DR.
Significant results (P<0.05) are in bold.
T2DM: type 2 diabetes mellitus; HbA1c: haemoglobin A1c; BMI: body mass index; SBP: systolic blood pressure; DBP: diastolic blood pressure; HDL-C: high-density lipoprotein cholesterol; LDL-C: low-density lipoprotein cholesterol; TG: total triglycerides; RAS: (renin–angiotensin system) medication, angiotensin-converting enzyme or angiotensin receptor blockers; sRAGE: soluble receptor for advanced glycation end-products; PEDF: pigment epithelium-derived factor; SCr: serum creatinine; eGFR: estimated glomerular filtration rate; SD: standard deviation; CV: coefficient of variation; ACR: albumin-to-creatinine ratio.
Expressed as median (interquartile range).
CKD (chronic kidney disease), eGFR < 60 mL/min/1.73 m2 and/or ACR ⩾ 30 mg/g.
Neurothesiometer reading > 25 V or monofilament sensory test result below 8 out of 10 points on either side of the feet. p < 0.05 was considered as statistically significant.
SCr-mean was significantly higher in DR cases than controls [median (IQR): 89.8 (65.3–136.7) vs 75.2 (58.6–98.7) µM, p < 0.001]. DR cases have significantly higher variability measures of SCr-SD [9.8 (5.4–22.2) vs 5.8 (3.8–10.9) µM, p < 0.001], adj-SCr-SD [9.1 (4.9–21.6) vs 5.4 (3.4–10.1) µM, p < 0.001] and SCr-CV [11.9% (7.5%–19.9%) vs 8.5% (5.5%–13.1%), p < 0.001]. eGFR-mean was significantly lower in DR cases than controls [74.1 (46.1–95.2) vs 90.5 (68.0–100.3) mL/min/1.73 m2, p = 0.002]. DR cases have significantly higher variability measures of eGFR-SD [6.1 (4.0–10.8) vs 4.6 (3.0–7.6) mL/min/1.73 m2, p < 0.001], adj-eGFR-SD [5.6 (3.6–9.7) vs 4.3 (2.8–6.9) mL/min/1.73 m2, p < 0.001] and eGFR-CV [10.6% (5.1%–21.3%) vs 5.5% (3.4%–11.5%), p < 0.001] (Table 1).
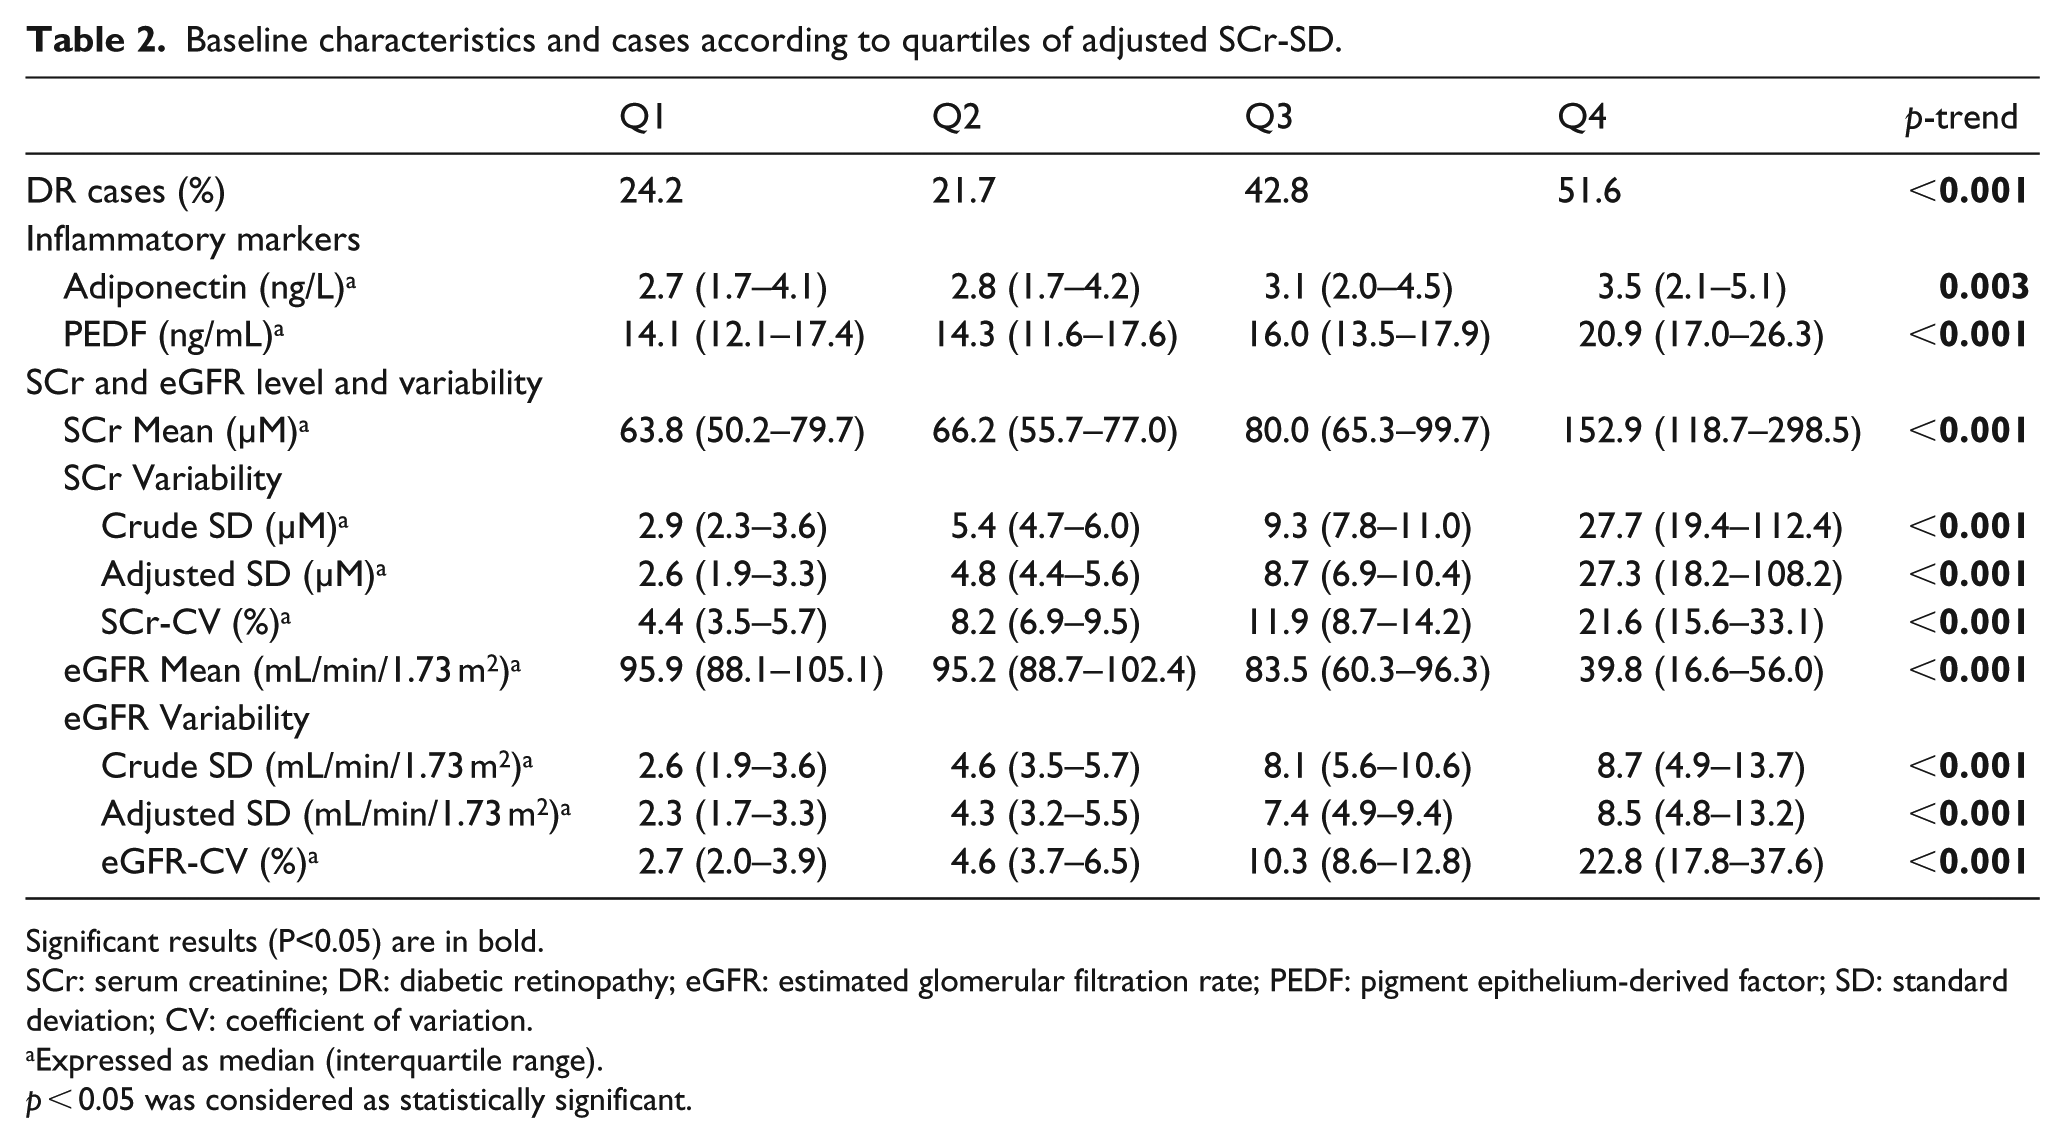
Table 2 shows baseline inflammatory markers, SCr level and variability, as well as percentage of DR cases according to quartiles of adj-SCr-SD. The percentage of DR cases increased significantly across increasing quartiles of adj-SCr-SD. The levels of adiponectin and PEDF increased across increasing quartiles of adj-SCr-SD. SCr level variably increased with adj-SCr-SD quartiles progressively. eGFR level decreased and eGFR variability increased across increasing quartiles progressively.
Baseline characteristics and cases according to quartiles of adjusted SCr-SD.
Significant results (P<0.05) are in bold.
SCr: serum creatinine; DR: diabetic retinopathy; eGFR: estimated glomerular filtration rate; PEDF: pigment epithelium-derived factor; SD: standard deviation; CV: coefficient of variation.
Expressed as median (interquartile range).
p < 0.05 was considered as statistically significant.
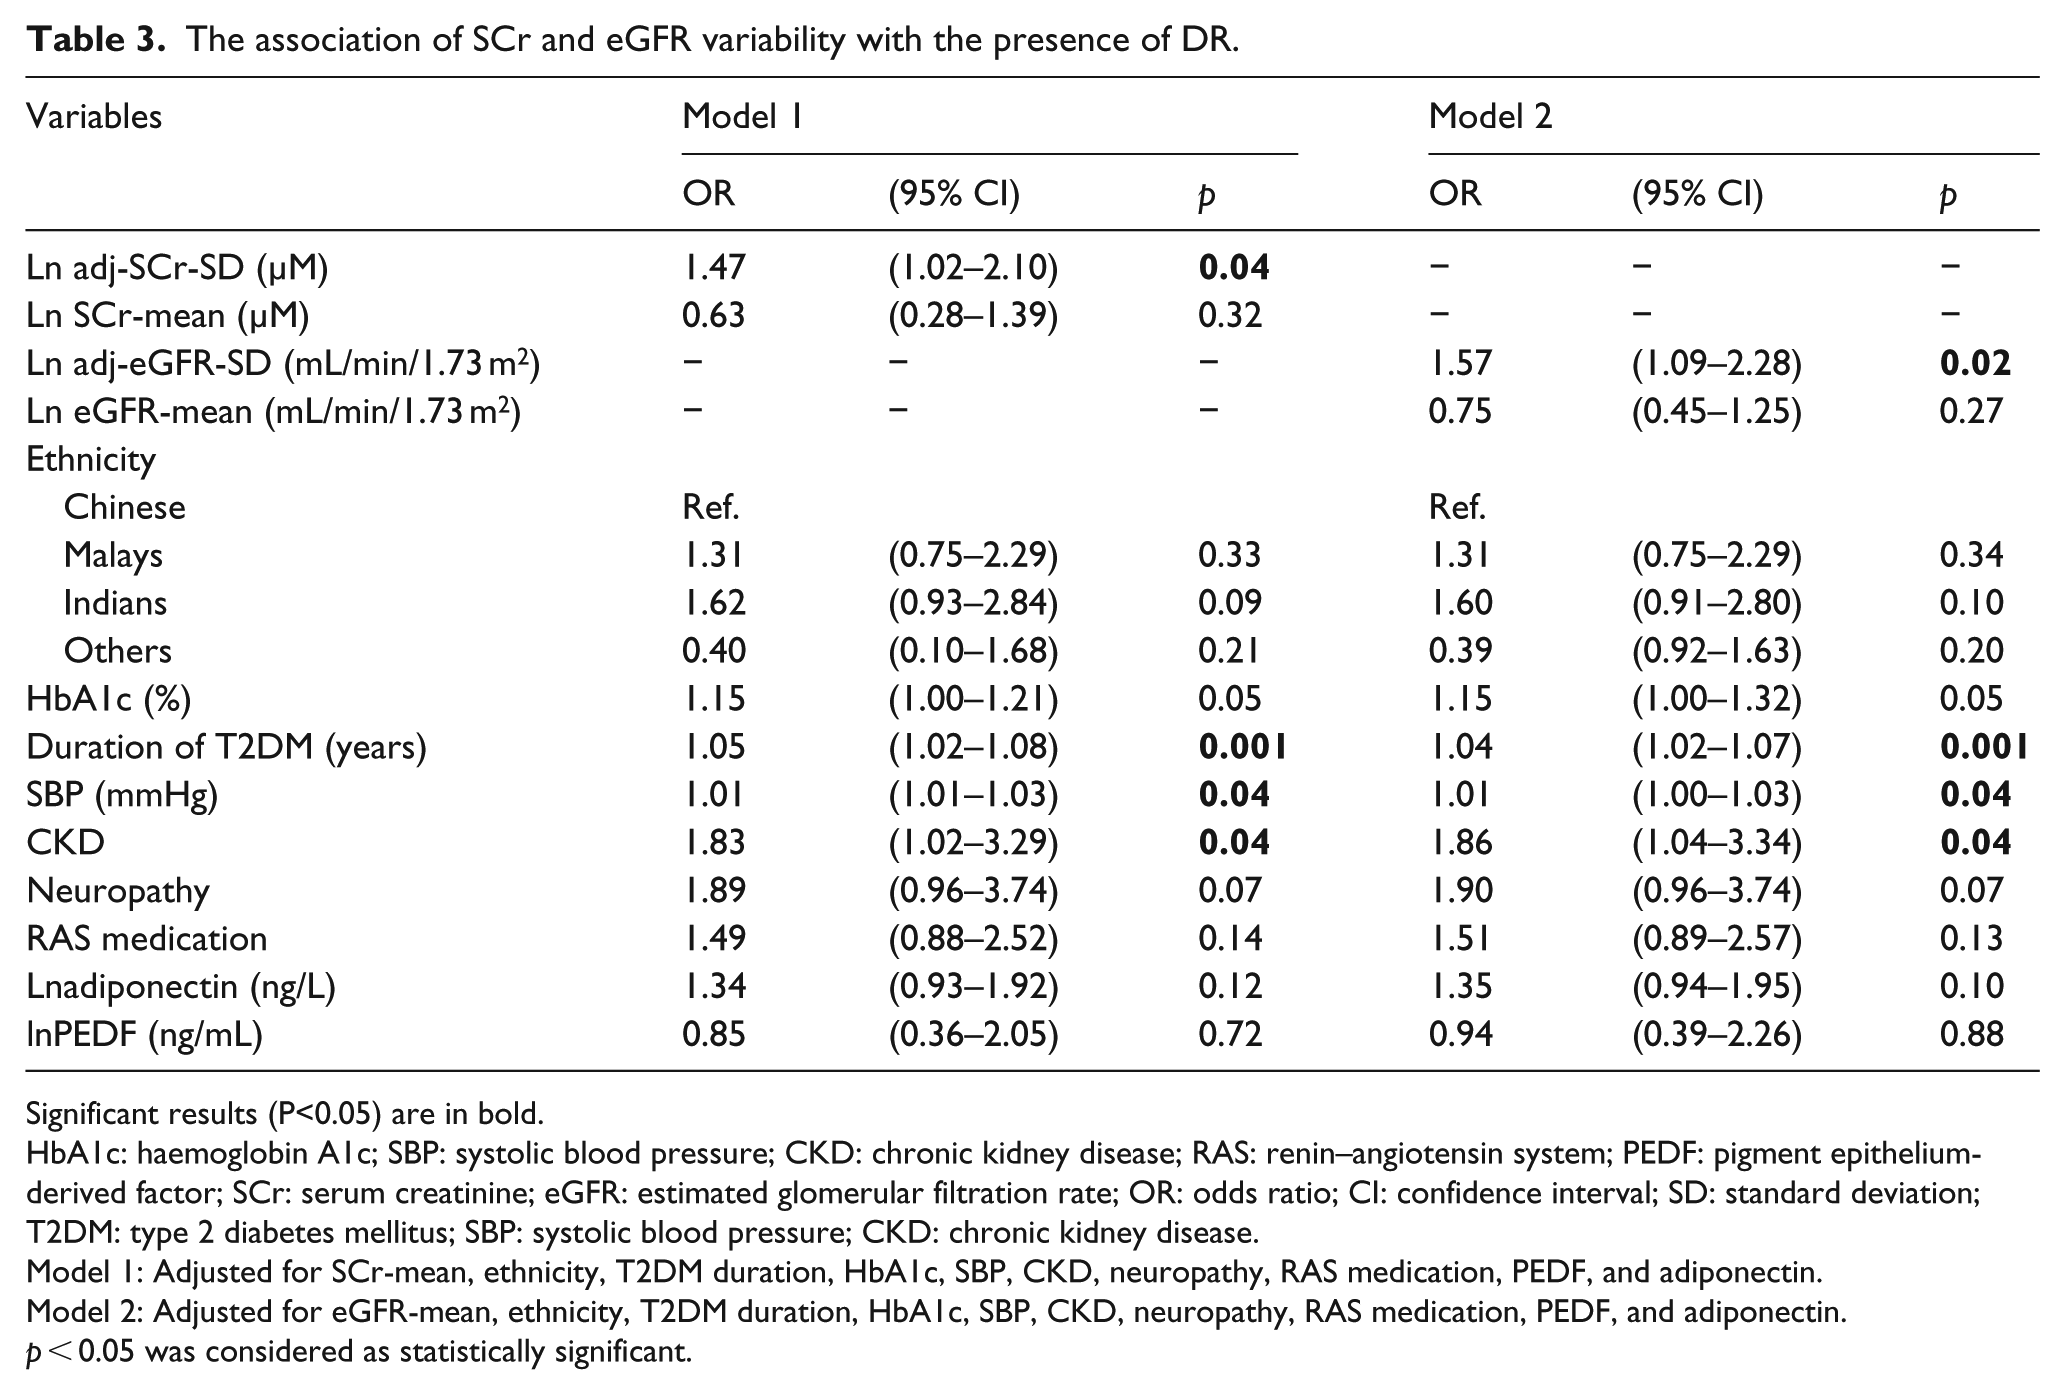
In univariate analysis, 1-unit increase in lnadj-SCr-SD [odds ratio (OR) = 1.50, 95% confidence interval (CI), 1.26–1.79, p < 0.001] and lnadj-eGFR-SD (OR = 1.83, 95% CI, 1.37–2.43, p < 0.001) were associated with DR. After adjustment for routinely available key variables, including T2DM duration, HbA1c and SBP, lnadj-SCr-SD (OR = 1.53, 95% CI, 1.10–2.13, p = 0.01) and lnadj-eGFR-SD (OR = 1.63, 95% CI, 1.16–2.28, p = 0.005) remained associated with DR. We further examined the associations in expanded models adjusted for routinely available key variables and variables that are not routinely available, including SCr-mean or eGFR-mean, ethnicity, CKD, neuropathy, RAS medication, PEDF and adiponectin. The associations between DR and variability in lnadj-SCr-SD (OR = 1.47, 95% CI, 1.02–2.10, p = 0.04) and lneGFR-SCr-SD (OR = 1.57, 95% CI, 1.09–2.28, p = 0.02) remained significant in multivariate conditional regression model. Other independent predictors for DR include T2DM duration, SBP and CKD (Table 3).
The association of SCr and eGFR variability with the presence of DR.
Significant results (P<0.05) are in bold.
HbA1c: haemoglobin A1c; SBP: systolic blood pressure; CKD: chronic kidney disease; RAS: renin–angiotensin system; PEDF: pigment epithelium-derived factor; SCr: serum creatinine; eGFR: estimated glomerular filtration rate; OR: odds ratio; CI: confidence interval; SD: standard deviation; T2DM: type 2 diabetes mellitus; SBP: systolic blood pressure; CKD: chronic kidney disease.
Model 1: Adjusted for SCr-mean, ethnicity, T2DM duration, HbA1c, SBP, CKD, neuropathy, RAS medication, PEDF, and adiponectin.
Model 2: Adjusted for eGFR-mean, ethnicity, T2DM duration, HbA1c, SBP, CKD, neuropathy, RAS medication, PEDF, and adiponectin.
p < 0.05 was considered as statistically significant.
Figure 2 shows the predictive ability of adj-SCr-SD or adj-eGFR-SD alone, variables adjusted in our model, and combination of adj-SCr-SD or adj-eGFR-SD and variables. The AUC was 0.64 (95% CI, 0.59–0.69) for adj-SCr-SD, 0.62 (95% CI, 0.56–0.67) for adj-eGFR-SD, and 0.70 (95% CI, 0.65–0.75) for the combined variables. We observed significant improvement in AUC when adj-SCr-SD (0.72, 95% CI, 0.68–0.77, p = 0.03; Figure 2(a)) or adj-eGFR-SD (0.72, 95% CI, 0.67–0.76 vs 0.70, 95% CI, 0.65–0.75, p = 0.03; Figure 2(b)) was added to the model consisting of the above variables.
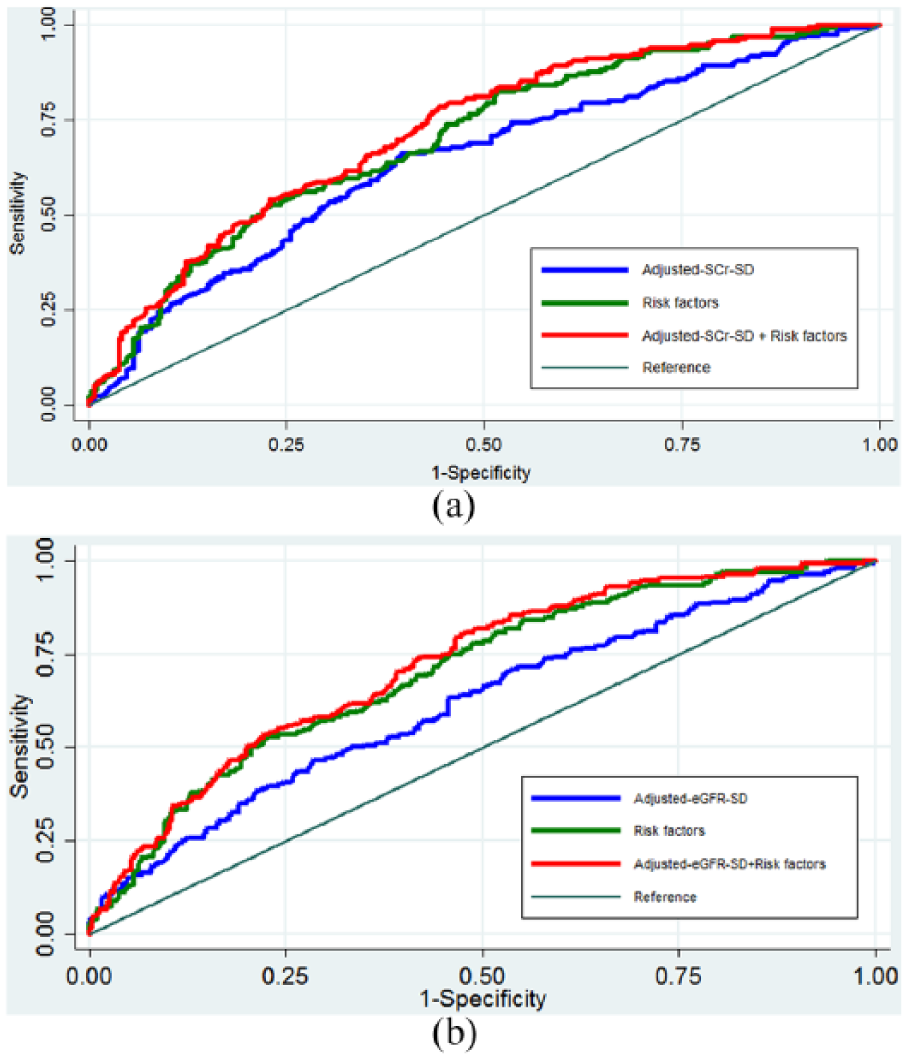
Receiver operating curves (ROC) of (a) adj-SCr-SD alone, variables adjusted in our model and combination of adj-SCr-SD and variables to predict DR; (b) adj-eGFR-SD alone, variables adjusted in our model and combination of adj-eGFR-SD and variables to predict DR.
To examine whether DR prediction with addition of adj-SCr-SD or adj-eGFR-SD was significantly improved, reclassification of the model was assessed by calculating the NRI and IDI. The inclusion of adj-SCr-SD to the multivariable model resulted in a category-free NRI of 0.174 (95% CI, 0.031, 0.291) for cases and 0.038 (95% CI, –0.108, 0.135) for controls. It also increased the difference in mean predicted probabilities between cases and control by 0.015 (95% CI, –0.001, 0.044), resulting in relative improvement in discrimination slope by 5.8%. In absolute terms, an additional eight patients (1.5% of number of patients 504) were correctly classified for DR. The inclusion of adj-eGFR-SD resulted in a category-free NRI of 0.128 (–0.020, 0.249) for cases, and 0.044 (–0.059, 0.161) for controls. It also increased the difference in mean predicted probabilities between cases and control by 0.010 (–0.001, 0.036), resulting in relative improvement in discrimination slope by 4.2%, and an additional five patients correctly classified for DR.
Variability of SCr and eGFR with the severity of DR
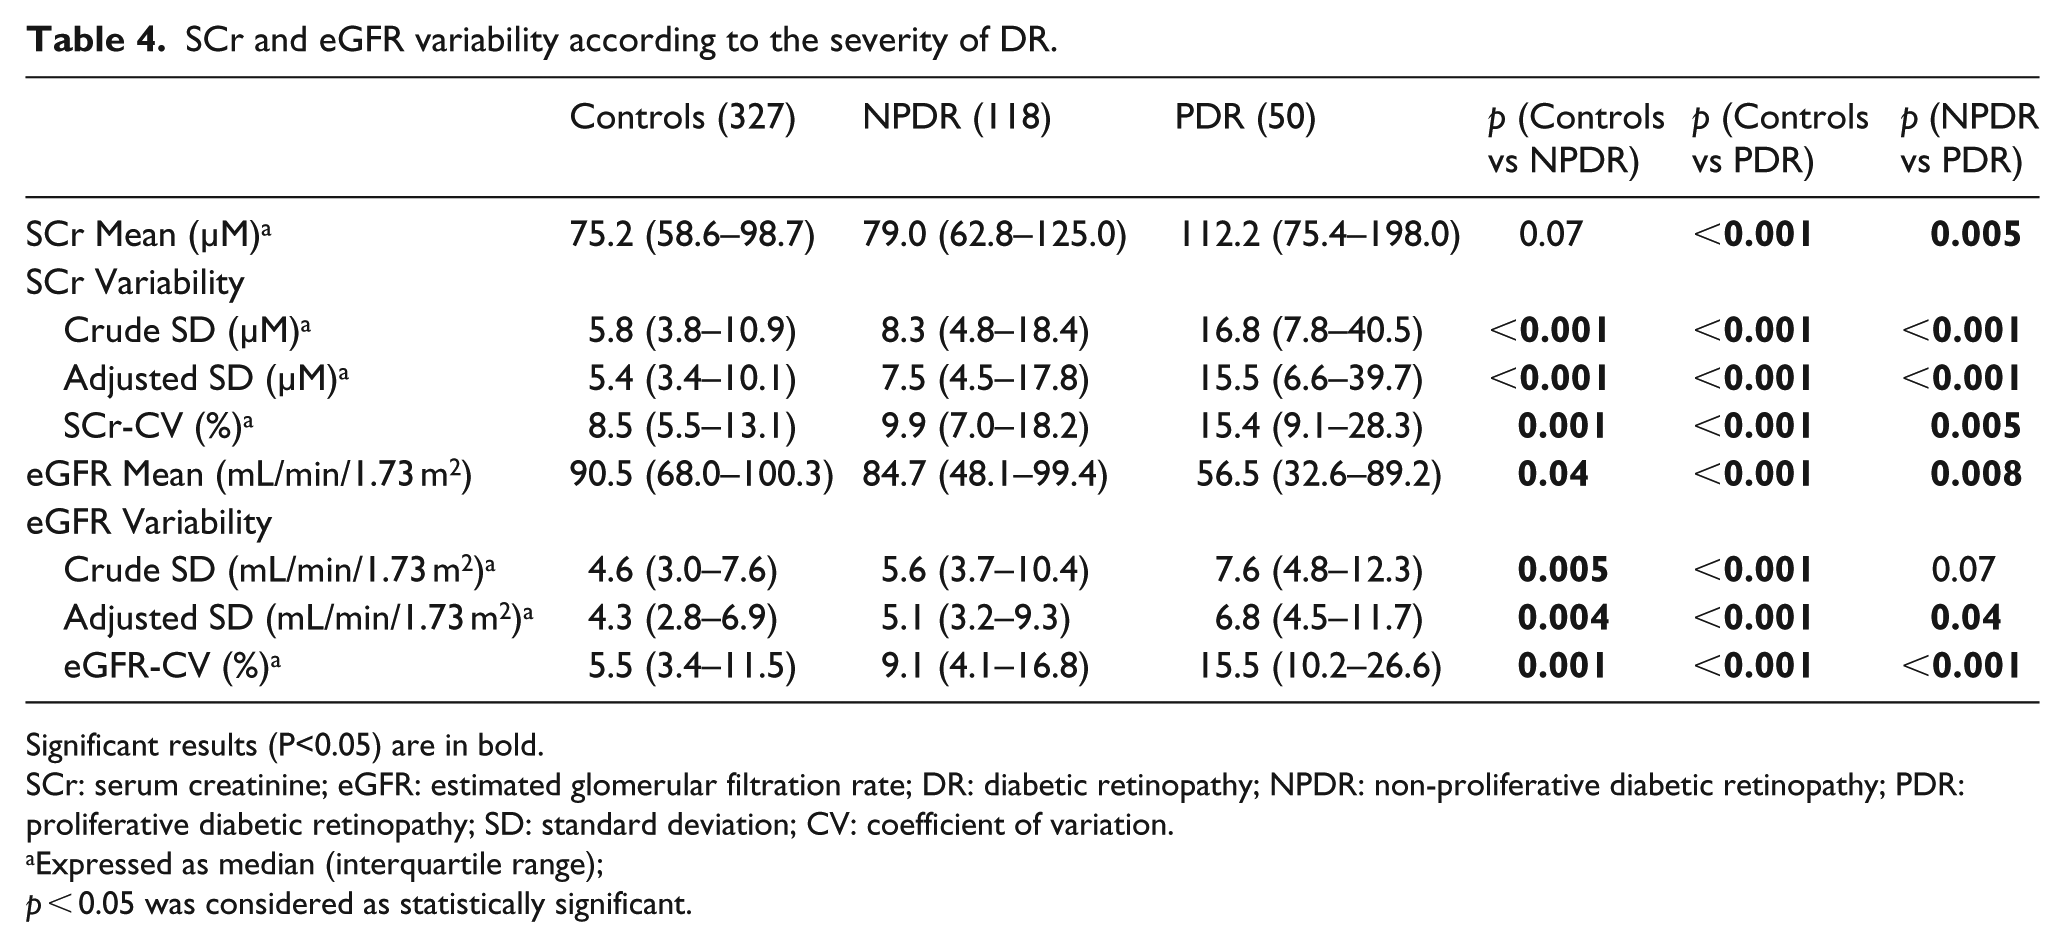
In 177 DR cases, there are 118 NPDR and 50 PDR (9 ungradable). Table 4 shows the mean and variability of SCr and eGFR according to the severity of DR. SCr-mean [112.2 (75.4–198.0) vs 79.0 (62.8–125.0) µM, p = 0.005] and variability measured as SCr-SD [16.8 (7.8–40.5) vs 8.3 (4.8–18.4) µM, p < 0.001], adj-SCr-SD [15.5 (6.6–39.7) vs 7.5 (4.5–17.8) µM, p < 0.001] and SCr-CV [15.4% (9.1%–28.3%) vs 9.9% (7.0%–18.2%), p = 0.005] are significantly higher in PDR than NPDR. eGFR-mean is significantly lower in PDR than NPDR [56.5 (32.6–89.2) vs 84.7 (48.1–99.4) mL/min/1.73 m2, p = 0.008]. The difference of eGFR-SD between PDR and NPDR is at the margin of statistical significance [7.6 (4.8–12.3) vs 5.6 (3.7–10.4) mL/min/1.73 m2, p = 0.07]. PDR have significantly higher adj-eGFR-SD [6.8 (4.5–11.7) vs 5.1 (3.2–9.3) mL/min/1.73 m2, p = 0.04] and eGFR-CV [15.5% (10.2%–26.6%) vs 9.1% (4.1%–16.8%), p < 0.001] than NPDR.
SCr and eGFR variability according to the severity of DR.
Significant results (P<0.05) are in bold.
SCr: serum creatinine; eGFR: estimated glomerular filtration rate; DR: diabetic retinopathy; NPDR: non-proliferative diabetic retinopathy; PDR: proliferative diabetic retinopathy; SD: standard deviation; CV: coefficient of variation.
Expressed as median (interquartile range);
p < 0.05 was considered as statistically significant.
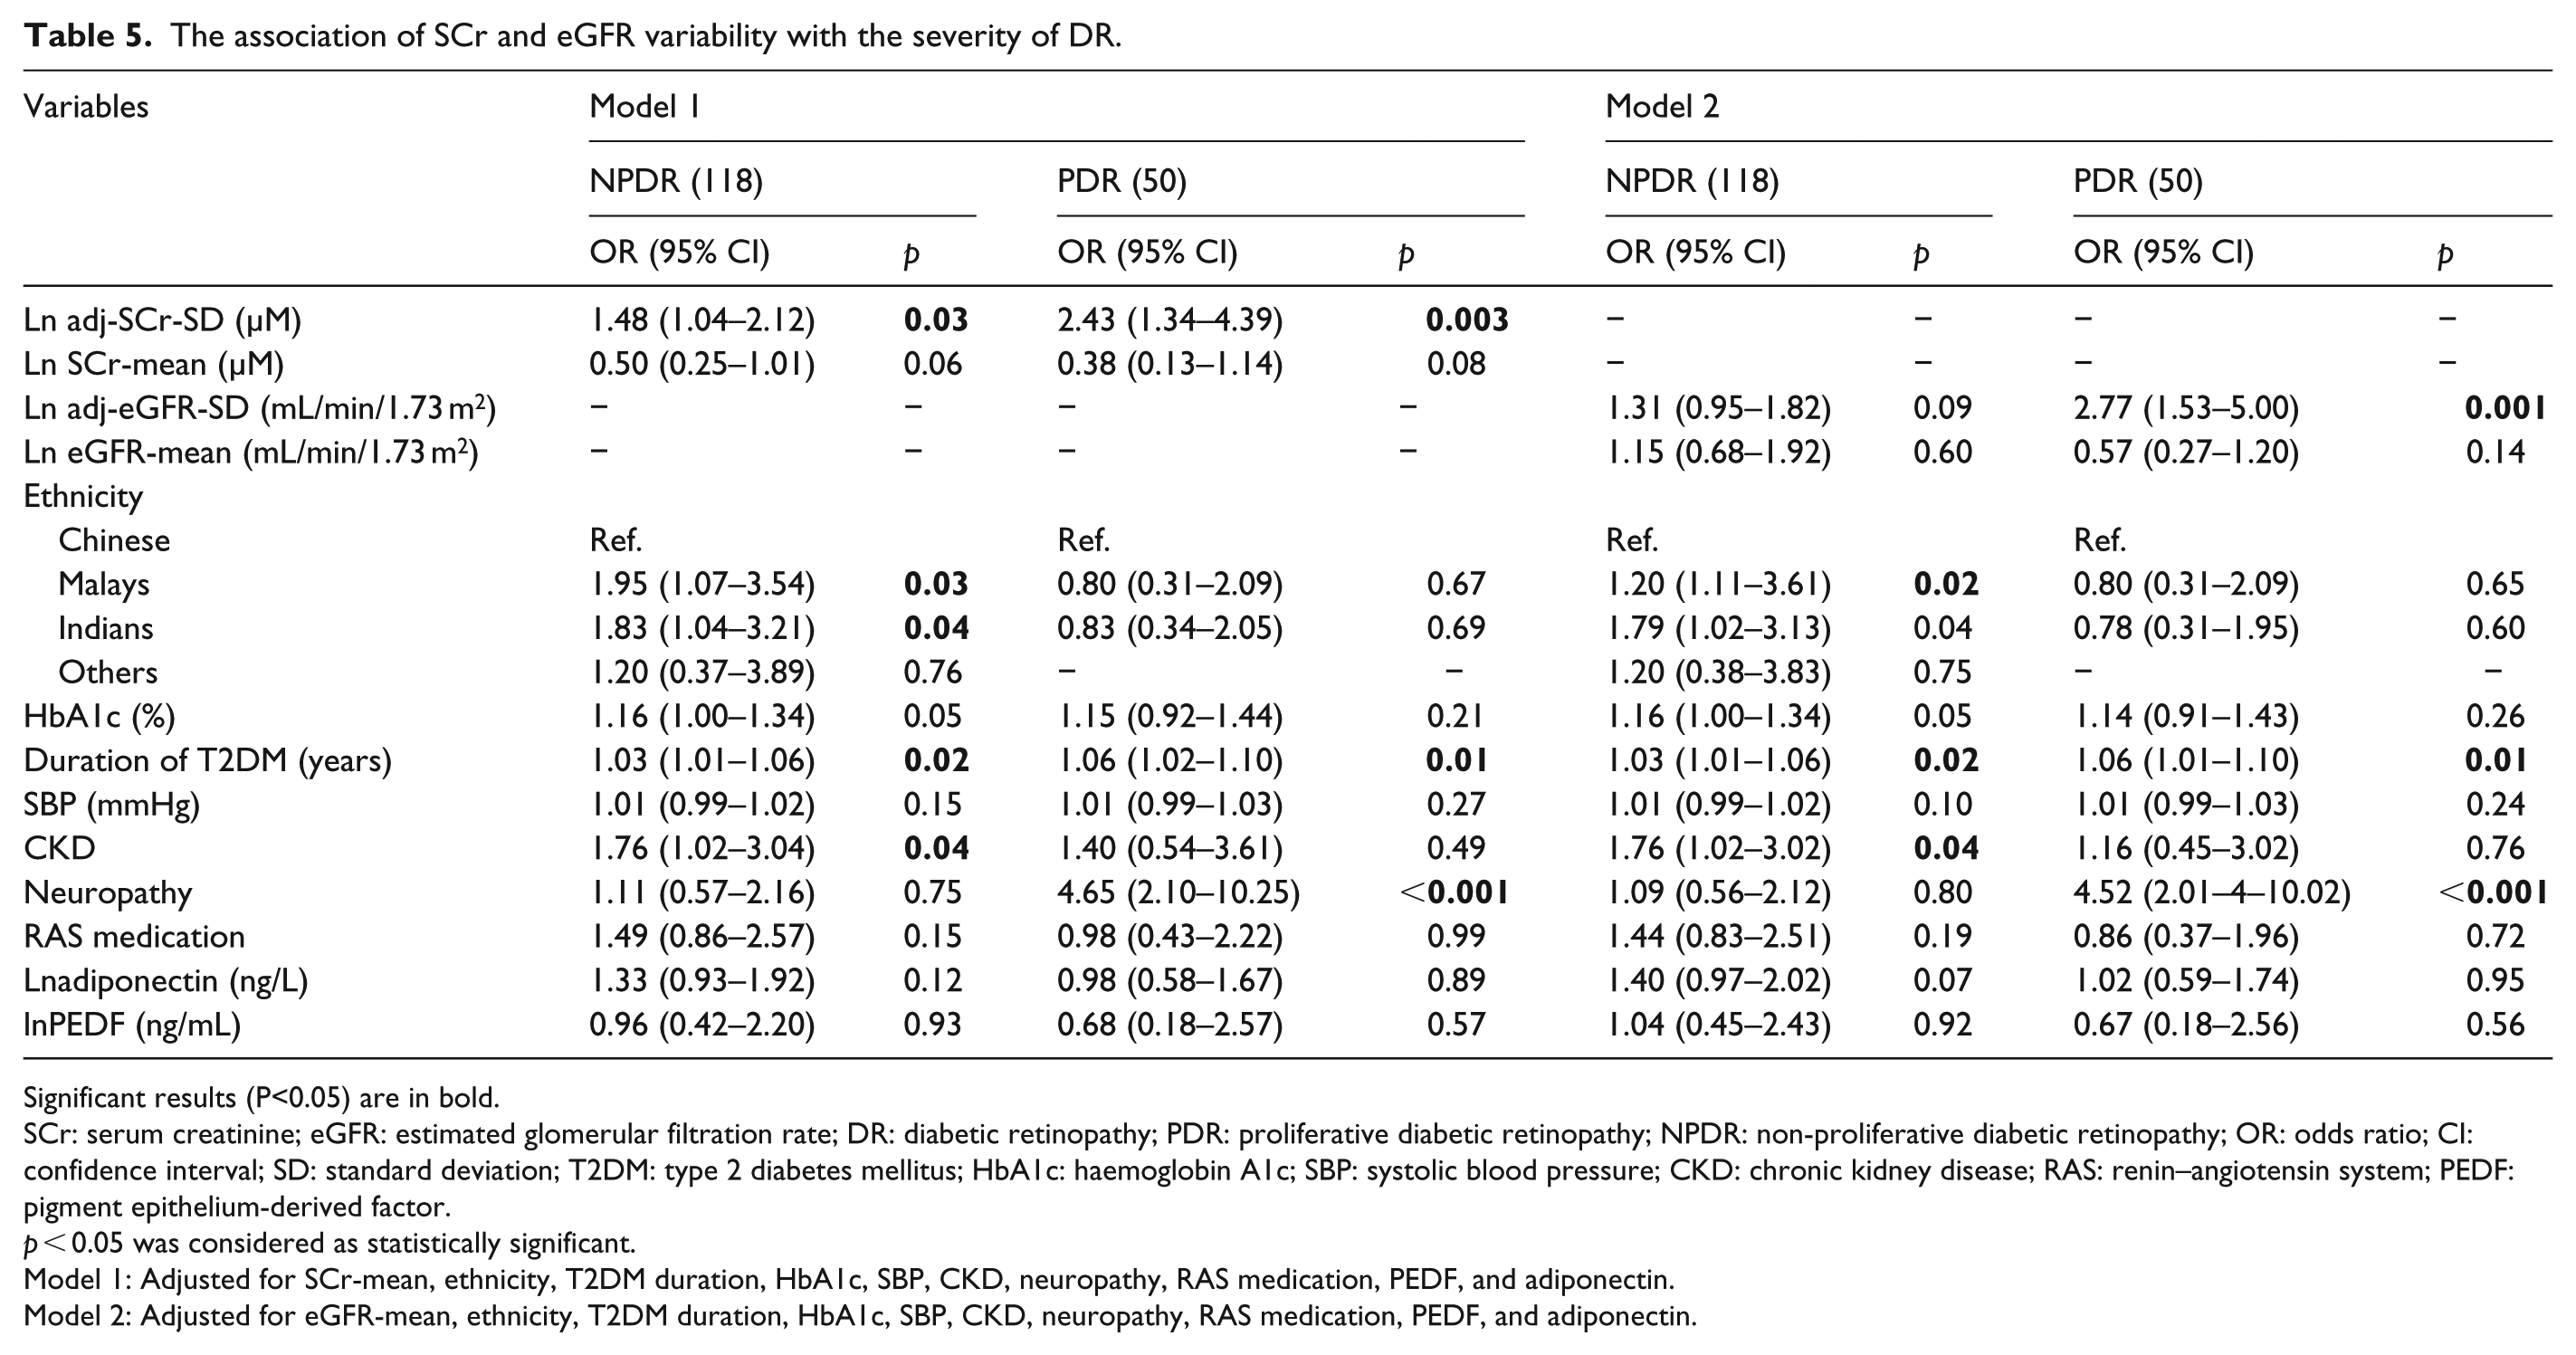
In severity analysis, lnadj-SCr-SD (OR = 1.72, 95% CI, 1.24–2.40, p = 0.001 for NPDR, OR = 2.51, 95% CI, 1.51–4.16, p < 0.001 for PDR) and lnadj-eGFR-SD (OR = 1.57, 95% CI, 1.16–2.12, p = 0.003 for NPDR; OR = 2.79, 95% CI, 1.73–4.49, p < 0.001 for PDR) were associated with the severity of DR in univariate models. In models adjusted for routinely available key variables, the association between lnadj-SCr-SD (OR = 1.60, 95% CI, 1.13–2.27, p = 0.007 for NPDR; OR = 2.25, 95% CI, 1.31–3.89, p = 0.004 for PDR) and lnadj-eGFR-SD (OR = 1.44, 95% CI, 1.06–1.97, p = 0.022 for NPDR; OR = 2.47, 95% CI, 1.48–4.12, p = 0.001 for PDR) with the severity of DR was attenuated but remained significant. Table 5 shows the association of SCr and eGFR variability with the severity of DR in expanded model. With one-unit increase in adj-SCr-SD, the relative risk of having NPDR and PDR was 1.48 (95% CI, 1.04–2.12, p = 0.03) and 2.43 (95% CI, 1.34–4.39, p = 0.003; p-trend = 0.002), respectively. Similarly, with one-unit increase in adj-eGFR-SD, the relative risk of having NPDR and PDR was 1.31 (95% CI, 0.95–1.82, p = 0.09) and 2.77 (95% CI, 1.53–5.00, p = 0.001; p-trend = 0.005), respectively.
The association of SCr and eGFR variability with the severity of DR.
Significant results (P<0.05) are in bold.
SCr: serum creatinine; eGFR: estimated glomerular filtration rate; DR: diabetic retinopathy; PDR: proliferative diabetic retinopathy; NPDR: non-proliferative diabetic retinopathy; OR: odds ratio; CI: confidence interval; SD: standard deviation; T2DM: type 2 diabetes mellitus; HbA1c: haemoglobin A1c; SBP: systolic blood pressure; CKD: chronic kidney disease; RAS: renin–angiotensin system; PEDF: pigment epithelium-derived factor.
p < 0.05 was considered as statistically significant.
Model 1: Adjusted for SCr-mean, ethnicity, T2DM duration, HbA1c, SBP, CKD, neuropathy, RAS medication, PEDF, and adiponectin.
Model 2: Adjusted for eGFR-mean, ethnicity, T2DM duration, HbA1c, SBP, CKD, neuropathy, RAS medication, PEDF, and adiponectin.
Discussion
We, for the first time, found that greater intra-individual variability in serum creatinine and eGFR over 3-year follow-up, measured by SDs, was independently associated with the presence and severity of DR, even after controlling for the intra-individual mean of SCr or eGFR level during follow-up and other known risk factors for DR. There was a significant improvement in the risk prediction for the presence of DR when SCr or eGFR variability was incorporated in the risk prediction model with known clinical and biochemical risk factors for DR.
Both retina and kidney are low vascular resistance end organs supplied by small vessels that are highly susceptible to fluctuations in blood flow. 17 In addition to the anatomical similarities, they also shared risk factors, such as chronic hyperglycaemic, the central imitating factor for various microvascular complications and albuminuria, that may influence the microvasculature of both kidney and retina.4,18 Therefore, previous studies have identified robust associations between CKD and DR among T2DM patients, suggesting that they may progress in parallel.4,17,18
Although variability in SCr level has never been studied in DR, the concept of biomarker variability has been applied for CKD progression among T2DM patients. For example, HbA1c variability has been associated with albuminuria progression or eGFR decline among T2DM patients independent of mean HbA1c in others19,20 and our own studies. 21 Greater variability in eGFR or SCr over duration was found to be associated with CKD progression in diabetic patients 5 or with mortality in CKD patients.6,7 Our results not only agree with the previous finding in CKD 5 but also suggest that SCr and eGFR variability may be extended to serve as a novel marker for another closely related microvascular bed, such as retinal microcirculation.
The exact mechanism underlying fluctuation of kidney function is not clear from our study, but several possibilities have been proposed. First, retinal and renal vascular bed injury may share similar substrate. Variability of SCr and eGFR may be a reflection of poor adaptation to renal hemodynamic changes in the background of reduced nephron mass.6,22 Because of the shared substrate, such hemodynamic abnormalities could occur throughout the body and affect retinal vasculature, resulting in changes in retinal blood flow and impairment in retinal auto-regulations. 23 This hypothesis is supported by studies suggesting that hemodynamic as an early marker for DR. 24 Further investigations are needed to quantify the retinal hemodynamic changes to better understand its role in DR. Second, variability of SCr and eGFR may suggest recurrent episode of acute kidney injury (AKI). When there is recurrent minor AKI with recovery (albeit partial, at times), injurious factors like inflammatory burden may accumulate and contribute to DR.5,25 Production of interleukin-1 and interleukin-6 after experimental AKI has been reported in previous studies, suggesting that systemic production of proinflammatory cytokines associated with AKI may be responsible for the increased risk of diabetic complications. 26 In our study, across increasing quartiles of adj-SCr-SD, we found increased levels of adiponectin and PEDF, two factors that have been associated with DR.27,28 The higher level of PEDF, a potent angiogenic inhibitor, occurs probably as a secondary response to counteract the activity of the angiogenic stimulators. 27 Adiponectin is a multi-functional protein secreted by adipocytes that may be involved in inflammation, angiogenesis, and tissue injury and repair.28,29 More studies are needed on other inflammatory factors to elucidate the relationships of SCr variability, inflammation and DR.
Our findings have potentially important clinical implications. First, the simple statistic of standard deviation can be easily derived by using data collected during routine clinical care from electronic health records. Incorporating the variability may improve the ability to identify subjects at high risk of DR for intensive intervention. Second, intervention strategies which ameliorate hemodynamic instability may be particularly advantageous. Based on the associations between SBP variability and poor renal prognosis,30,31 Uehara et al. 22 considered that SBP variability could also be associated with eGFR variability. A meta-analysis reported the protective effect of calcium-channel blocker on cardiovascular risks through reducing blood pressure variability, 32 suggesting that specific treatment might preferentially reduce SCr or eGFR variability without affecting their mean levels.
The strengths of this study include accurate DR status obtained by fundus imaging, complete patient information and the use of a nested case–control design. When comparing DR status obtained by self-report and fundus imaging, the overall accuracy of self-report DR status is 73.2% and 74.6% in our and other studies. 33 Previous studies relying on secondary data were unable to retrieve complete patient information, such as BMI and commonly used medications in diabetes. 7 In our study, we compared variability after taking into account the effect of these confounding factors. Therefore, problems of inaccurate or incomplete data could be overcome in this study. Finally, using the nested case–control design in our study, the likelihood of selection bias, especially for the controls, has been minimized.
Several limitations have also been identified. First, our findings should be interpreted with caution because of small sample size and the prevalent case–control design due to the lack of baseline fundus photographs. Second, our study was based on diabetes patients in a secondary hospital, whose conditions may be different from diabetes patients at national level. For example, Singapore National Health Survey in 2010 reports better profiles than ours, such as lower fasting plasma glucose level and less poor glycaemic control. Therefore, whether our findings can be extrapolated to a national level remains to be determined. Validation on an independent cohort of T2DM patients would be required. Third, the single-field fundus photographs were captured using non-mydriatic camera and therefore it is possible that some cases of DR were not detected. Finally, SCr and eGFR levels could be affected by factors, such as laboratory assay variability, dietary factors (i.e. protein) and metabolic variability (i.e. creatinine generation rate);34,35 therefore, assessing factors affecting SCr variability is warranted.
In summary, SCr and eGFR variability is associated with the presence and severity of DR independent of average SCr and eGFR. Our findings may inform novel therapeutic strategies aiming to achieve stable renal function in T2DM.
Supplemental Material
dvdres-oct-2017-00153-File005 – Supplemental material for The association of serum creatinine and estimated glomerular filtration rate variability with diabetic retinopathy in Asians with type 2 diabetes: A nested case–control study
Supplemental material, dvdres-oct-2017-00153-File005 for The association of serum creatinine and estimated glomerular filtration rate variability with diabetic retinopathy in Asians with type 2 diabetes: A nested case–control study by Xiao Zhang, Neelam Kumari, Serena Low, Keven Ang, Darren Yeo, Lee Ying Yeoh, Allen Liu, Pek Yee Kwan, Wern Ee Tang, Subramaniam Tavintharan, Chee Fang Sum and Su Chi Lim in Diabetes & Vascular Disease Research
Footnotes
Declaration of conflicting interests
The author(s) declared no potential conflicts of interest with respect to the research, authorship and/or publication of this article.
Funding
This work was supported by Singapore National Medical Research Council Grant (PPG/AH(KTPH)/2011) and (NMRC/CIRG/1398/2014). The funder has no role in study design, data collection, analysis, interpretation and manuscript writing.
Supplementary Material
Supplementary material for this article is available online.
References
Supplementary Material
Please find the following supplemental material available below.
For Open Access articles published under a Creative Commons License, all supplemental material carries the same license as the article it is associated with.
For non-Open Access articles published, all supplemental material carries a non-exclusive license, and permission requests for re-use of supplemental material or any part of supplemental material shall be sent directly to the copyright owner as specified in the copyright notice associated with the article.