
Abstract
Hyperandrogenic state in females is accompanied with metabolic syndrome, insulin resistance and vascular pathologies. A total of 67%–85% of hyperandrogenic women suffer also from vitamin D deficiency. We aimed to check a potential interplay between hyperandrogenism and vitamin D deficiency in producing insulin resistance and effects on coronary resistance arteries. Adolescent female rats were divided into four groups, 11–12 animals in each. Transdermal testosterone-treated and vehicle-treated animals were kept either on vitamin D-deficient or on vitamin D-supplemented diet for 8 weeks. Plasma sexual steroid, insulin, leptin and vitamin D plasma levels were measured, and oral glucose tolerance test was performed. In coronary arterioles, insulin receptor and vitamin D receptor expressions were tested by immunohistochemistry, and insulin-induced relaxation was measured in vitro on isolated coronary resistance artery segments. Testosterone impaired glucose tolerance, and it diminished insulin relaxation but did not affect the expression of insulin and vitamin D receptors in vascular tissue. Vitamin D deficiency elevated postprandial insulin levels and homeostatic model assessment insulin resistance. It also diminished insulin-induced coronary arteriole relaxation, while it raised the expression of vitamin D and insulin receptors in the endothelial and medial layers. Our conclusion is that both hyperandrogenism and vitamin D deficiency reduce sensitivity of coronary vascular tissue to insulin, but they do it with different mechanisms.
Introduction
Insulin plays a crucial role in metabolic regulation, but its actions are modulated by many other hormones and sexual steroids, among them. Among its numerous effects, insulin contributes to regulation of vascular function and vasomotor balance. 1 Insulin resistance (IR) is an important component of the metabolic syndrome (MetS) and is associated with an increased risk of cardiovascular disease. Impaired glucose tolerance, which is characterized by excessive postprandial hyperglycaemia, and long period of IR with compensatory hyperinsulinemia are considered to be key elements in the development of type 2 diabetes mellitus (T2DM). Currently, 30%–40% of the world’s population are reported to be insulin resistant. 2 Gender differences in insulin sensitivity are substantial and may be due to the modifying effects of sexual steroid hormones. 3 Female gender seems to have advantageous effects on insulin sensitivity and body fat composition. 4 Oestrogen replacement therapy after menopause improves insulin sensitivity, while polycystic ovarian syndrome (PCOS), characterized by androgen excess (AE) in fertile-aged females, is frequently associated with obesity, IR and increased cardiovascular morbidity. The interconnection between PCOS and MetS is strongly supported by recent epidemiological data. According to these, 75% of PCOS females are insulin resistant. A sound gynaecological fact is that the interconnection is even stronger from the other side: PCOS-like symptoms can be identified in practically all fertile-aged females with IR and MetS.5,6
Several nutritional factors, in addition to excess caloric intake, contribute to the development of IR. Vitamin D deficiency (VDD) is a worldwide phenomenon, which affects approximately 30%–50% of the world’s population. Optimal vitamin D (VitD) supplementation can be obtained from exposure to sunlight or diet (fortified foods and dietary supplements, widely accepted in the United States). According to recent data, a high serum 25-dihydroxyvitamin D concentration is associated with a significant reduction in the risk of diabetes, cardiovascular diseases (CVD) and MetS. 7 Coexistence of hyperinsulinemia, VDD and AE in women has frequently been described,8,9 and the prevalence of VDD in women with AE is 67%–85%.10,11
Taking into consideration the frequent comorbidities of PCOS and VDD with hyperinsulinemia, in the recent article, we aimed to examine some metabolic parameters and early alterations in the coronary resistance artery function in an animal model, in which female rats were subjected to excess androgen (inducing explicit PCOS histology in ovaries) with and without VDD deficiency.12–15
Materials and methods
Animals
A total of 46 adolescent (4-week-old) female Wistar rats with mean initial body weight of 106 ± 7 g were purchased (Semmelweis University, Charles Rivers, Budapest, Hungary). The animals were supplied ad libitum with rat food according to the group protocols (see below) and tap water. A total of 4–5 rats were housed, later 2–3 together, at constant humidity (56%), room temperature (22°C ± 1°C) and light-dark cycle (12 h/12 h). Blood sampling was made in superficial ether narcosis. Euthanasia was performed by bleeding in Nembutal anaesthesia [45 mg/kg intraperitoneal (i.p.)]. The investigation conforms to the Guide for the Care and Use of Laboratory Animals published by the US National Institutes of Health (8th edition, 2011) and the EU conform Hungarian Law on Animal Care (XXVIII/1998). The institutional Animal Care Commission approved the study protocol (IRB: 8/2014 PEI/001/1548-3/2014).
Chemicals
We obtained testosterone transdermal gel (Androgel 1%) from Laboratories Besins International S.A. (Paris, France). For VitD supplementation per os cholecalciferol suspension (Vigantol oil 20.000 IU/mL from Merck/Merck Serono, India) was used. Human-recombinant insulin (Actrapid pentafill 100 IU/mL) from Novo Nordisk A/S (Novo Allé, Bagsvard, Denmark) was used for in vitro vascular tests. For in vitro studies, we used normal Krebs–Ringer (nKR) solution, which consisted of the following (in mmol/L): NaCl 119, KCl 4.7, NaH2PO4 1.2, MgSO4 1.17, NaHCO3 24, CaCl2 2.5, glucose 5.5 and ethylenediaminetetraacetic acid (EDTA) 0.034. To relax smooth muscle, Ca-free Krebs solution was applied (in mmol/L): NaCl 92, KCl 4.7, NaH2PO4 1.18, MgCl2 20, MgSO4 1.17, NaHCO3 24, glucose 5.5, EDTA 0.025 and ethylene glycol-bis (β-aminoethyl ether)-N,N,N′,N′-tetraacetic acid (EGTA) 2.0. Solutions were kept at fixed temperature (37°C) and bubbled with a gas mixture, O2 20%, CO2 5% and N2 75%, which were also kept at pH stabilized at 7.4.
Chronic treatment
The study lasted 8 weeks for each group. Rats were randomly selected into four groups. In total, 24 animals received complete, normal diet (ssniff Germany – Standard maintenance (SM) rat/mouse complete diet containing 1000 IU/kg vitamin D3). To reach optimal VitD serum levels (serum 25-hydroxicholecalciferol of 30 ng/mL), these animals received additional per os VitD supplementation (see below). Half of VitD-supplemented rats were subjected to transdermal testosterone treatment as described below (group VD+/T+, n = 12), while the other 12 animals formed the VitD-supplemented testosterone-free group (VD+/T− n = 12). In total, 22 animals were put on a VitD-free diet (ssniff Germany – Experimental for (EF) rat/mouse complete VitD-free diet: containing vitamin D3 <5 IU/kg; additional VitD intake was excluded during the entire protocol period). This ensured severe VDD in the course of the study. Half of these animals were testosterone free (group VD−/T−, n = 11), while the other half was transdermally treated with testosterone (group VD−/T+, n = 11). Body weight was measured 5 times a week during the complete study period. Body mass gain ratio (%) was calculated, final body weight/initial body weight × 100%. Our protocol for VitD supplementation was as follows: 500 IU cholecalciferol was per os added as a loading dose at the beginning of the second week. From the fourth week, cholecalciferol was provided weekly up to 3000 IU/kg body weight (based on regular body weight measurements) to reach higher range normal VitD levels.
The back skin was regularly shaved before testosterone treatment. Testosterone-treated groups received 5 times a week transdermal testosterone gel from the second day of treatment. The applied dose was 0.033 mg/g body weight, which ensured close to 10 times elevation in plasma testosterone levels in these female animals (see Table 1).
Mean final body weights, body mass gain ratio, systolic blood pressure, steroid hormone and leptin serum levels on the eighth week of treatment in the four treatment groups.
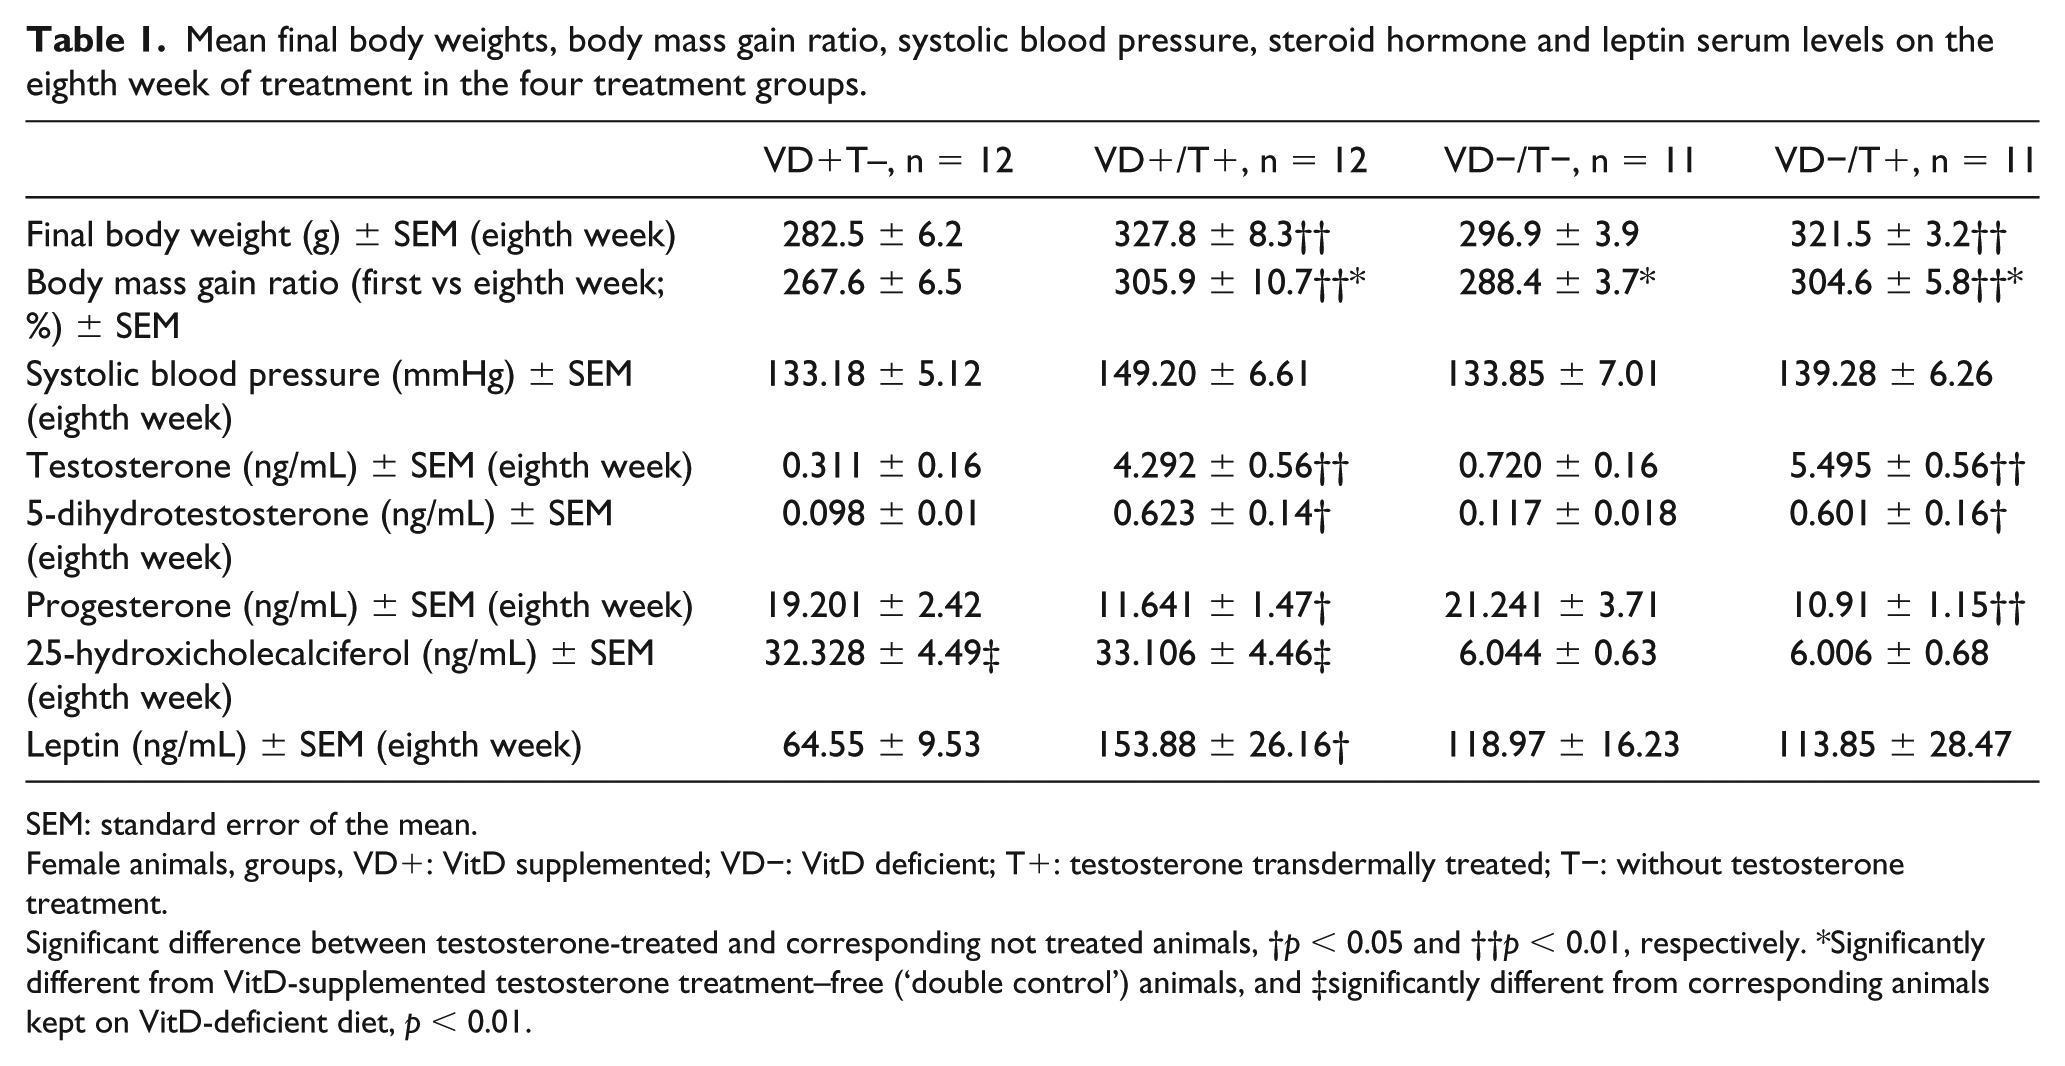
SEM: standard error of the mean.
Female animals, groups, VD+: VitD supplemented; VD−: VitD deficient; T+: testosterone transdermally treated; T−: without testosterone treatment.
Significant difference between testosterone-treated and corresponding not treated animals, †p < 0.05 and ††p < 0.01, respectively. *Significantly different from VitD-supplemented testosterone treatment–free (‘double control’) animals, and ‡significantly different from corresponding animals kept on VitD-deficient diet, p < 0.01.
Oral glucose tolerance test and Homeostatic model assessment-IR
Oral glucose tolerance test (OGTT) test was performed on the sixth week of treatment. After overnight fasting, a loading dose of per os 30% glucose solution was administered through a gauge, as described earlier. 16 Blood sugar levels were measured at 0′–60′–120′ by Decont Personal Accu-check (77 Electronics). Serum insulin levels at 0′–120′ were detected by enzyme-linked immunosorbent assay (ELISA; Merck/Merck Millipore, Hungary). Homeostatic model assessment (HOMA)-IR was calculated as fasting plasma insulin (in milliunits per litre) × fasting plasma glucose (in millimoles per litre)/22.5.
Sexual steroid, leptin and VitD plasma levels
Blood samples were taken on the eighth week of treatment from tail vein. Serum samples were obtained and analysed with high-performance liquid chromatography. The 5-dihydrotestosterone, 5-hydroxycholecalciferol, progesterone and testosterone levels were evaluated using a Flexar FX-10 ultra-performance liquid chromatograph coupled with a Sciex 5500 QTRAP tandem mass spectrometer operated in the positive electrospray ionization mode. Dihydrotachysterol (DHT), 5-hydroxycholecalciferol, progesterone and testosterone were assayed in the same run. Reversed phase chromatographic separation was performed using an octadecylsilica stationary phase. Detection was carried out using scheduled multiple reaction monitoring. 100–400 µL serum sample was spiked with 10 µL internal standard solution (containing 200 ng/mL 13 C3-testosterone, 5 ng/mL D5-estradiol and 2.5 µg/mL D6-25-hydroxycholecalciferol in acetonitrile) and diluted with 350–650 µL water and 250 µL methanol to obtain a 1 mL mixture which was vortexed and extracted 2 times with 1 mL ethyl acetate. The organic phases were combined and evaporated to dryness under a stream of nitrogen. For assessing DHT, 5-hydroxycholecalciferol, progesterone and testosterone levels, the residue was dissolved in a 50:50 v/v % mixture of water and methanol and was submitted for analysis. 17 Calibration was performed using the Chromsystems MassChrom® Steroids 6PLUS1® Multilevel serum calibrator set Steroid Panel 2 (Abl&E-Jasco Magyarország Kft, Budapest, Hungary) with ranges of 0.47–1.34, 0.04–4.94, 0.17–25.6 and 0.05–11.8 ng/mL for DHT, progesterone and testosterone, respectively. 25-Hydroxycholecalciferol was calibrated using aqueous solutions containing 1.0–50 ng/mL 25-hydroxycholecalciferol. All calibrators were treated in the same way as test samples.17,18 Serum ratio of testosterone to DHT ratio was calculated. Leptin levels were measured at eighth week of treatment with ELISA (Phoenix Pharmaceuticals/Phoenix Europe GmbH, Germany).
Pressure arteriography of coronary arterioles
Animals were anesthetized (45 mg/100 g i.p. Nembutal) on the eighth week of treatment. Invasive blood pressure measurement was performed through carotid artery cannulation. The chest was opened in order to extract the heart. The heart was perfused with non-heparinized normal Krebs solution for 2 min. After micropreparation, a coronary arteriole segment with in vivo outer diameter of 100–150 µm was obtained from the intramural network of the left anterior descendent coronary artery (LAD). The arteriole was microcannulated in normal Krebs solution (nKR) in an organ chamber filled with saline and oxygenized at fixed 37°C temperature. The microcannulas were connected to the servo pumps (Living Systems, St. Albans, Vermont, USA). Under no-flow conditions, the arteriole was intraluminally pressurized at 50 mmHg and extended to its normal, in vivo length. The set-up was positioned in the light route of an inversed Leica microscope to allow the evaluation of inner and outer diameter changes of the arteriole. With the aid of a digital histologic Leica video camera (DFC 320) and Leica QWin software, magnified pictures of the arteriole were obtained. Analysis of the vessel pictures was performed off-line with the help of Leica QWin image-analysing program. The arteriole was allowed to equilibrate in oxygenized nKR at fixed pressure (50 mmHg) and temperature (37°C) for 30 min. During this incubation, these arteriolar segments developed spontaneous tone. Their steady-state diameter in this state was measured. As the next step, increasing dose of insulin (insulin concentration of 30, 100, 300 and 600 mIU/mL; 1 IU = 0.035 mg insulin) was added to the bath, and segments were incubated for 8 min, respectively. After registration each dose–response, the drug was washed out from the bath of the organ chamber with slow continuous flow of oxygenized and heated nKR. Maximum relaxant diameters of the segments were obtained in calcium-free Krebs solution (also warmed and oxygenized). Remaining tone in insulin was expressed as percentage of actual radius as percentage of passive (fully relaxed) radius: Tins = 100 × (Rcafree − Rins)/Rcafree (%), where Rins is the inner radii of coronary arteriole in insulin containing normal Krebs solution and Rcafree is the inner radii in calcium-free solution.
Immunohistochemistry of coronary arterioles
Paraffin-embedded tissue sections were stained against insulin receptor (IR) beta and vitamin D receptor (VDR) by BenchMark ULTRA automated immunohistochemistry (IHC)/in situ hybridisation (ISH) slide staining system (Ventana Medical Systems, Inc., Tucson, AZ) using monoclonal mouse anti-IR beta (Santa Cruz Biotechnology, Dallas, TX) and polyclonal rabbit anti-VDR (Abcam, Cambridge, UK) antibodies. Visualization of specific labelling with diaminobenzidine (DAB) as coloured substrate and haematoxylin counterstaining was achieved by ultraView Universal DAB Detection Kit (Ventana Medical Systems, Inc.). Microscopic images of the stained vessels were taken by Zeiss Axio Imager system (Zeiss, Oberkochen, Germany). Positively stained area as the percentage of total tissue area was measured in the intimal and medial layers of the vessel walls using the ImageJ software [National Institutes of Health (NIH), Bethesda, MA].
Statistical analysis
For statistical analysis, GraphPad Prism 6.0 (GraphPad Software, Inc., San Diego, California, USA) was used. A repeated-measures analysis of variance (ANOVA) was used for the statistical analysis of the curves (e.g. cumulative concentration–diameter curve). Discrete parameters (e.g. body weight) were compared with one-way ANOVA. Tukey test was used as a post hoc test, and p < 0.05 was uniformly accepted as the threshold for statistical significance. Data are shown as mean ± standard error of the mean (SEM).
Results
Physiological parameters and hormone levels
These data are shown in Table 1. Eight weeks of regular transdermal testosterone treatment resulted in higher body weights (p < 0.01). VitD had some weight effect too: the mass gain ratio was higher in the VitD-deficient group (in testosterone-free animals, p < 0.05). Testosterone levels elevated several times (p < 0.01) in the testosterone-treated groups, so did its active metabolite, 5-dihydrotestosterone (p < 0.05). This proved the effectiveness of our transdermal testosterone treatment. Serum progesterone levels were reduced, a typical feature for this PCOS model (missing luteinization). The mean number of follicles in the ovarium was significantly higher than in the other groups, and these were mostly small-sized primordial follicles (not shown). VitD-deficient diet resulted about 5 times lower serum 25-hydroxicholecalciferol levels compared to the supplemented groups (p < 0.01), and no change in other sexual steroids measured could be detected. A further interesting observation is that serum leptin levels significantly elevated as an effect of testosterone treatment (but only in the VitD-supplemented group, p < 0.05).
Testosterone elevates OGTT glucose in female animals
Regarding fasting glucose levels, no significant difference between the four groups could be observed (Figure 1(a)). The 60-min postload blood sugar levels for the VD+/T+ rats, however, were significantly higher than for their testosterone-untreated counterparts (p < 0.05). Finally, testosterone resulted significantly higher 120-min values regardless of the VitD status (p < 0.05 and p < 0.01).
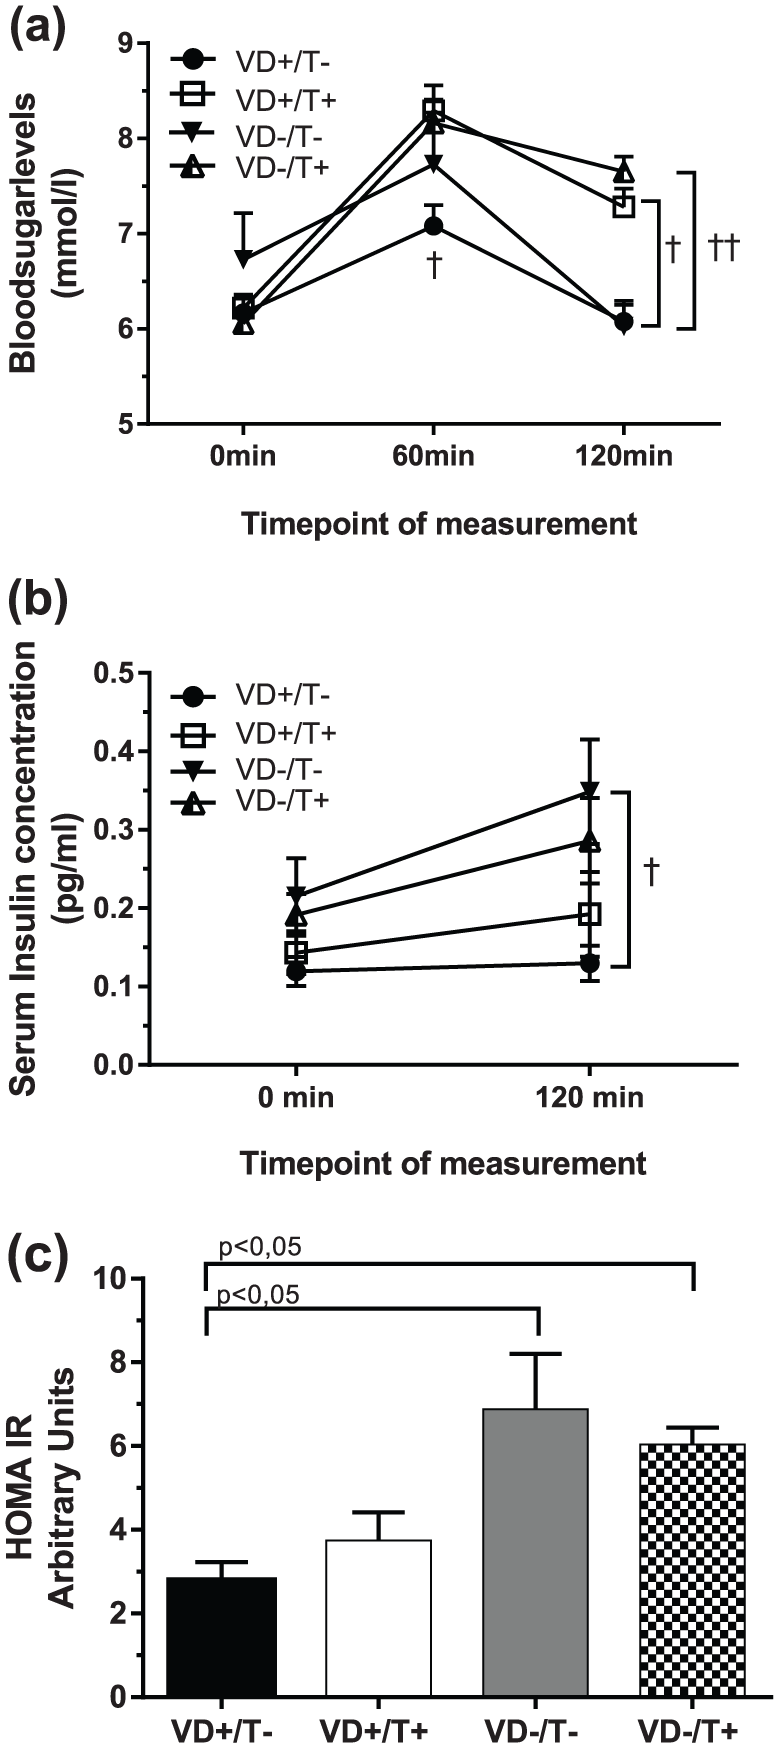
Results of OGTT – plasma glucose, insulin serum levels and HOMA-IR values: (a) serum glucose levels of the four groups following OGTT at the sixth week of treatment, n = 11 for each group; (b) plasma insulin levels following OGTT, n = 6; and (c) computed HOMA-IR values. N = 11 for each group.
VDD elevates OGTT insulin and HOMA-IR
While plasma insulin levels measured before OGTT did not differ, 120-min values of VitD-deficient, testosterone-untreated group was significantly higher than their VitD-supplemented counterparts (Figure 1(b), p < 0.05). Furthermore, VitD-deficient animals had significantly higher computed HOMA-IR values (Figure 1(c), p < 0.05), compared to VitD-substituted ones, regardless of the presence or absence of testosterone treatment.
Both testosterone treatment and VDD reduce insulin relaxation in coronary arterioles
Insulin-induced relaxation of coronary arterioles was examined with elevating concentrations of insulin (Figure 2(a)). In fact, relaxation could be observed only in testosterone-untreated, VitD-supplemented (‘double control’) rats. All the three other groups affected by either one or both of the two noxas, produced significantly less (p < 0.01) relaxation or no relaxation at all.
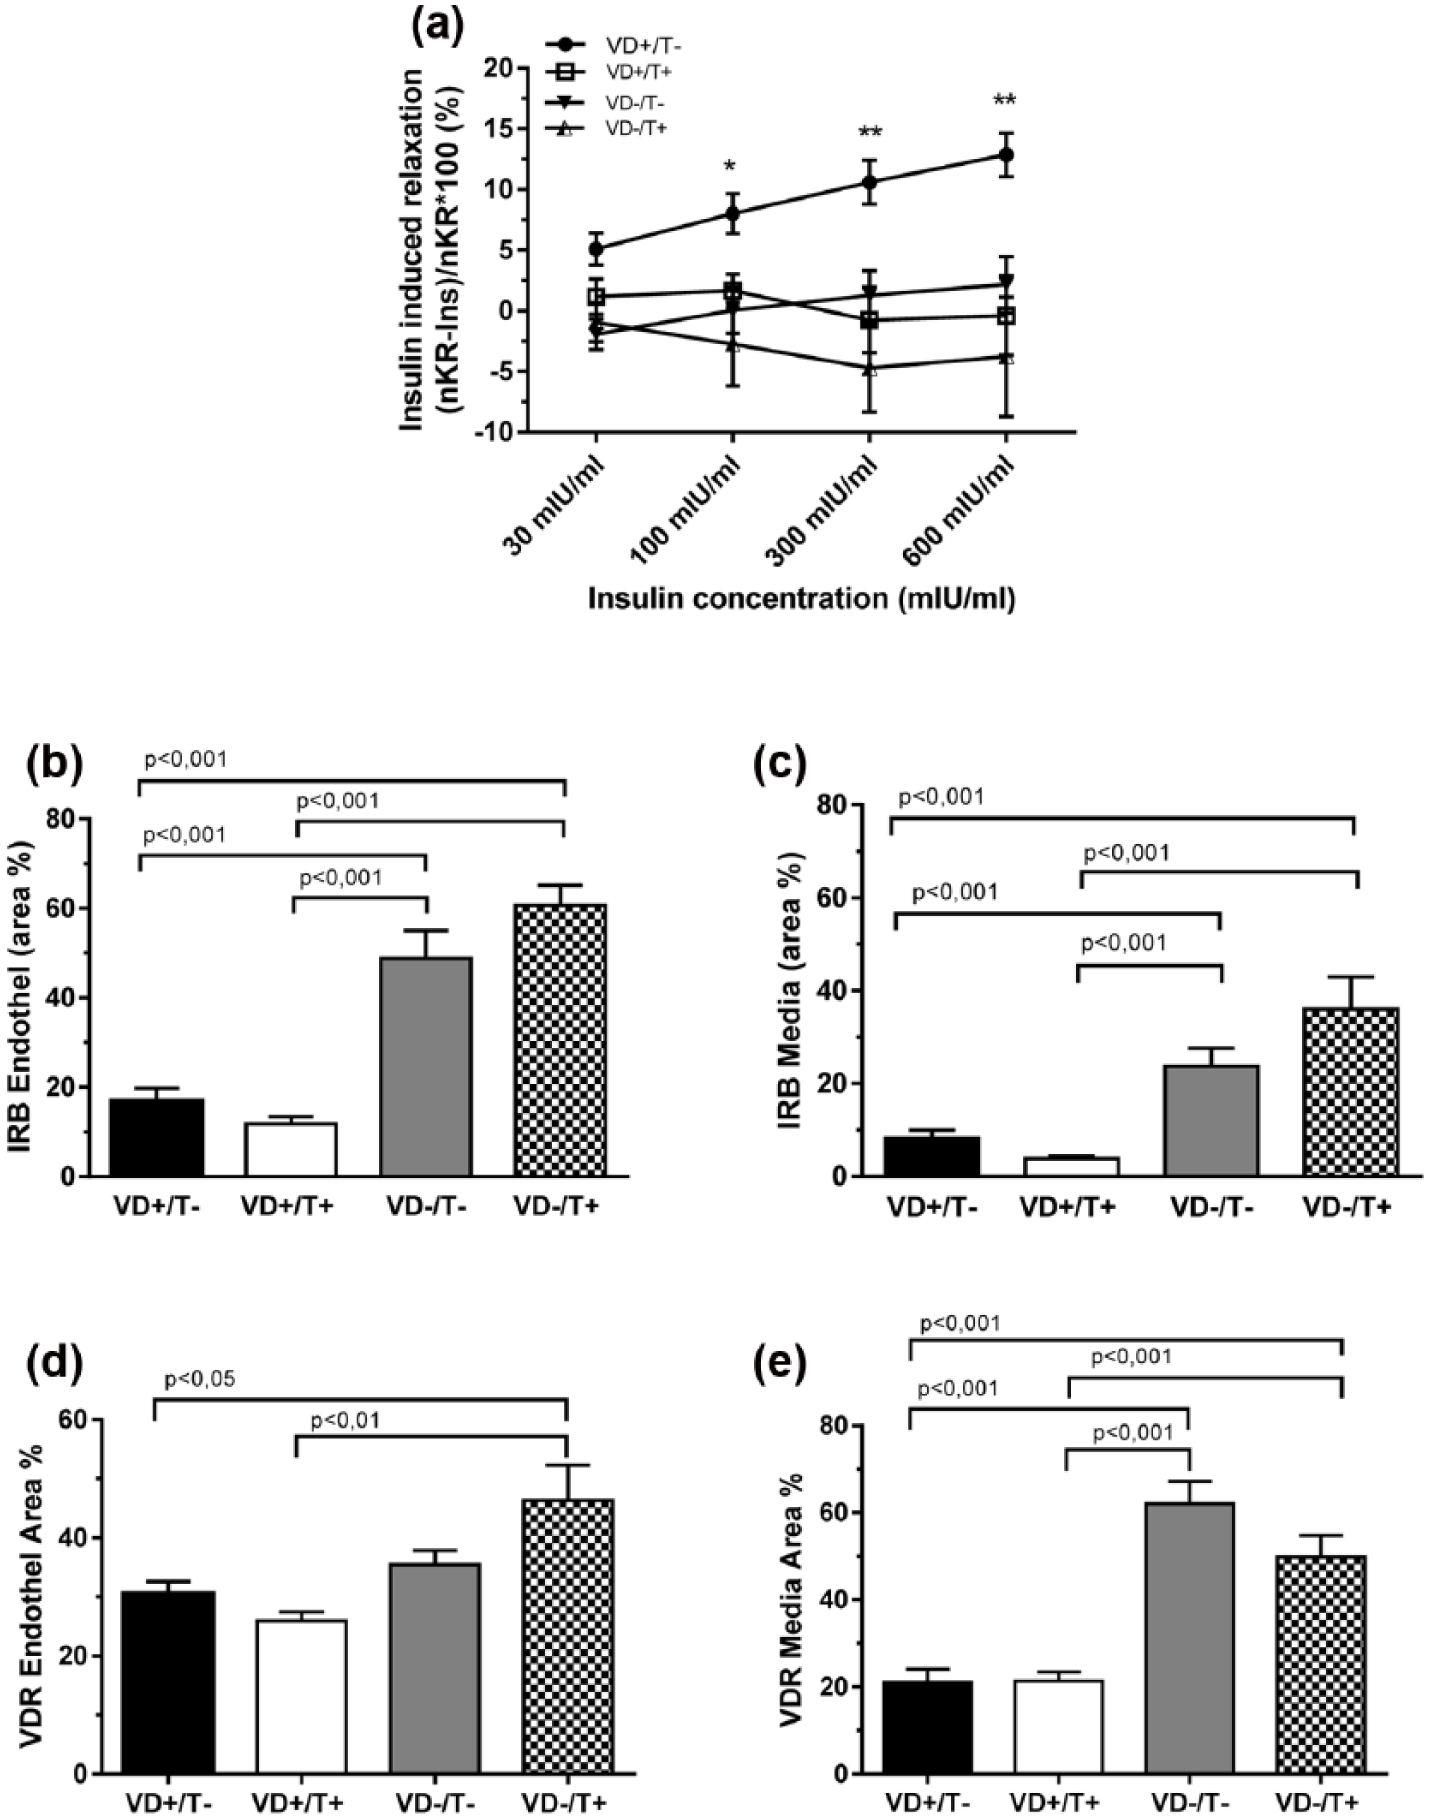
Coronary arteriole insulin sensitivity and receptor expression in their wall: (a) in vitro relaxation of intramural coronary arterioles in response to elevating concentrations of insulin; (b and c) immunohistochemical density of insulin receptor (IR) in endothelial and medial tissue, respectively; and (d and e) immunohistochemical density of VitD receptor (VDR) in endothelial and medial tissue, respectively. (b–e) Total area ratio percentages, n = 6 in all groups, and (a–e) mean ± SEM. Significances of ANOVA tests are shown.
VitD control of IR and VDR expression in coronary arteriolar tissue
IR density in the coronary arteriole wall was examined with immunohistochemistry. Both VitD-deficient groups, regardless of the presence or absence of testosterone treatment, had significantly higher expressions of IR in endothelium and media (Figure 2(b) and (c), p < 0.001). VDR density in coronary arteriole tissues was also elevated in VitD-deficient female animals (Figure 2(d) and (e), p < 0.01 and 0.001), and it was unaffected by testosterone.
Discussion
Both noxious factors applied in this study, hyperandrogenism and VDD, are known to be frequently present together in the human PCOS. Both are considered as risk factors for CVDs and diabetes mellitus.9,11–13,19,20 Such clinical studies have suggested that in case of AE in females, lower VitD levels may be associated with higher risk of IR and coronary disease. Our aim was further to reveal the interaction of these two noxas in producing metabolic disturbance and coronary microvascular damage.
Our model animals were comparable with the clinical situation: 25-hydroxycholecalciferol levels of VitD-treated animals were in the higher normal range, while VitD-deficient animals had plasma values close to that of females suffering with PCOS who are typically VitD deficient (with exception of the United States where VitD supplementation of food is more widely used).13,21 Testosterone levels were normal in our testosterone-untreated animals and markedly elevated in testosterone-treated ones proving that our therapy was adequate.
One important observation we made is the development of marked IR as a result of both interventions. Previously, we have described IR as a consequence of hyperandrogenic state.5,6,21 However, the effect of VDD and interaction of the two noxas were not investigated. This study (Figure 1(a) and (b)) showed that while testosterone treatment elevated blood sugar levels without affecting plasma insulin levels (in comparison with testosterone-untreated controls), VDD caused elevated insulin secretion, but glucose levels remained unaltered (in comparison with VitD-supplemented animals). Both alterations can be summarized as a special, but different form of IR. In the first case, during the OGTT, similar insulin levels were inadequate to prevent hyperglycaemia to develop, while in the second, higher insulin levels appeared and were able to keep blood glucose just at normal levels. We have to admit here that in the first case, a decreased beta-cell sensitivity component cannot be excluded (elevated glucose did not induce higher insulin levels). However, VDD was able to elevate the HOMA-IR values (Figure 1(c)). As a consequence, with the application of the combined noxas, in VitD-deficient, testosterone-treated animals, the somewhat higher 120-min insulin levels during OGTT were not able to normalize plasma glucose levels.
In a somewhat similar manner, both testosterone treatments elevated serum leptin levels. Upregulation of VDR in adipose tissue is one factor that can elevate serum leptin levels. 22 Higher leptin levels, in turn, are accompanied by leptin resistance, another well described metabolic risk factor. 23
Insulin causes endothelial nitric oxide synthase mediated vasodilatation on different arteries, which is influenced by several other hormones. 24 At the end of our 8-week protocol, insulin-induced relaxation of coronary arterioles prepared from VitD-deficient and also from VitD-supplemented, testosterone-treated female rats practically diminished. This phenomenon was more pronounced at higher in vitro insulin concentrations. The mechanisms initiating such effects could be suspected as follows: Testosterone alone diminished insulin relaxation (Figure 2(a)) without affecting the number of IRs in the wall (Figure 2(b) and (c)) or affecting postprandial insulin levels (Figure 1(b)). The specific pathways of vascular IRs should be affected, as elevation of HOMA-IR index (Figure 1(c)) did not reach the level of significance. VitD deficiency alone, again, diminished insulin relaxation (Figure 2(a)), while substantially elevating the number of IRs in the vascular wall (Figure 2(b) and (c)). The presence of reduced IR sensitivity in the vascular wall is plausible. It can appear in frame of a general IR functional disturbance as HOMA-IR values were also elevated (Figure 1(c)), and there was a substantial postprandial plasma insulin elevation which kept postprandial glucose levels at bay (Figure 1(a)). From clinical point of few, it is interesting to see the noxious effects acting together. Here, the MetS is present in practically all detail studied: increased body weight (Table 1), high postprandial glucose (Figure 1(a)) that has not been reduced by the slightly elevated postprandial insulin (Figure 1(b)), massive IR (elevated HOMA-IR, Figure 1(c)), as well as insensitivity of vascular tissue to insulin (Figure 2(a)). The functional incompetence of IRs in vascular tissue is shown in Figure 2(b) and (c) that demonstrates higher IR expression despite the observed reduced sensitivity.
Conclusion
The metabolic and vascular effects of the combined pathogenic factors of hyperandrogenic state in females with VitD deficiency, a common clinical situation, were studied in an animal polycystic ovary syndrome (PCOS) model. Transdermal testosterone applied to adolescent female rats with and without VitD deficiency revealed that both factors induced symptoms of MetS and reduced sensitivity of the coronary arteriolar wall to insulin, but they did it with different mechanisms. Testosterone elevated postprandial sugar without hyperinsulinemia, without HOMA-IR elevation, while serum leptin was augmented. Vascular response to insulin diminished despite unaltered IR expression. However, VitD deficiency raised postprandial insulin concentrations, resulted elevated HOMA-IR values and diminished vascular response to insulin despite substantial elevation in the number of vascular IRs in both layers of the wall. A total of two different ways for vascular insulin insensitivity seem to be existing, both aggravate the pathological situation. Our observations confirm earlier reports that VitD deficiency should be avoided with specific care in case of the frequent female hyperandrogenic state to minimize MetS and vascular damage.
Footnotes
Acknowledgements
The authors express their gratitude to Péter Magyar MD, Anna Buday MD, PhD; Attila Patócs, MD, PhD; and Bionics Innovation Centre (AP, Budapest) for the kind help in the measurement of serum sexual steroid and to Mrs Ildikó Murányi for her devoted technical assistance and István Dóczi DPharm for pharmaceutical advices. L.H. and S.V. contributed equally to this work.
Declaration of conflicting interests
The author(s) declared no potential conflicts of interest with respect to the research, authorship and/or publication of this article.
Funding
This work was supported by grants from OTKA-PD 113022 by the Dean of the Medical Faculty, Semmelweis University, Budapest, and by the Hungarian Hypertension Society.