
Abstract
Background:
We assessed the association between admission blood glucose levels and acute stroke mortality and examined whether there was any incremental value of adding glucose status to the validated acute stroke mortality predictor – the SOAR (stroke subtype, Oxford Community Stroke Project classification, age, and pre-stroke modified Rankin) score.
Methods:
Data from Norfolk and Norwich University Hospital stroke and Transient Ischaemic Attack register (2003–2013) and Anglia Stroke Clinical Network Evaluation Study (2009–2012) were analysed. Multivariable logistic regression analysis assessed the association between admission blood glucose levels with inpatient and 7-day mortality. The prognostic ability of the SOAR score was then compared with the SOAR with glucose score.
Results:
A total of 5575 acute stroke patients (ischaemic stroke: 89.2%) with mean age (standard deviation) of 76.97 ( ± 11.88 ) years were included. Both borderline hyperglycaemia (7.9–11.0 mmol/L) and hyperglycaemia (>11.0 mmol/L) when compared to normoglycaemia (4.0–7.8 mmol/L) were associated with both 7-day and inpatient mortality after controlling for sex, age, Oxford Community Stroke Project classification and pre-stroke modified Rankin score. Both the SOAR stroke score and SOAR-G score were good predictors of inpatient stroke mortality [area under the curve: 0.82 (95% confidence interval: 0.81–0.84) and 0.83 (95% confidence interval: 0.81–0.84)], respectively. These scores were also good at predicting outcomes in both patients with and without diabetes.
Conclusion:
High blood glucose levels at admission were associated with worse acute stroke mortality outcomes. The constituents of the SOAR stroke score were good at predicting mortality after stroke.
Introduction
Hyperglycaemia after acute stroke has a prevalence ranging of 8%–20% with many patients having previously diagnosed diabetes mellitus.1,2 Observational evidence suggests that hyperglycaemia following stroke is strongly associated with poor outcomes and limited neurological recovery. 3
Scoring systems comprising simple, easily assessable factors following stroke have been shown to be useful in predicting stroke mortality and length of hospital stay.4–7 We have previously developed a simple indicator – SOAR (stroke subtype, Oxford Community Stroke Project classification, age, and pre-stroke modified Rankin) stroke score, 8 which has been shown to accurately predict acute stroke mortality and length of stay by external validation work.6,9
The original SOAR score did not include glucose in its calculation. However, the Get with the Guidelines-Stroke investigators has included a presence of diabetes mellitus in the calculation of their prediction score. 4 Furthermore, the addition of hyperglycaemia to the IScore improved the score’s ability to predict 30-day and 1-year mortality after an acute ischaemic stroke. 5
We are therefore interested in whether including blood glucose status as an additional criterion in the SOAR stroke score would improve the prognostic accuracy. Therefore, the aims of this study were first to examine the independent association between blood glucose levels at admission and acute stroke mortality outcomes at 7 days. Second, to assess whether adding glucose status to the SOAR score would improve the ability of the SOAR score in predicting 7-day and inpatient mortality. We also considered it important to assess the predictive ability of these scores in patients with and without diabetes mellitus.
Materials and methods
The stroke cases included in this study were drawn from two datasets, Norfolk and Norwich University Hospital (NNUH) stroke and Transient Ischaemic Attack (TIA) register (NNSTR) and the Anglia Stroke Clinical Network Evaluation Study (ASCNES). Both of these datasets have been previously described.9–13 Briefly, NNUH stroke and TIA register was set up in 1996 and has a catchment population of ~750,000. These data were obtained from both paper-based and electronic records, and rigorous data entry checks ensured accuracy.10–12 The study rationale, aims and methods of the ASCNES have been previously reported.13,14 In brief, this study used routinely collected data from eight specified months between October 2009 and September 2011 and had a 1-year follow up of the included patients. The ASCNES collected data from eight acute stroke services from eight NHS Trusts in East of England with a catchment population of ~2.5 million. For calculation of SOAR stroke score, the pre-stroke modified Rankin score (mRS) at admission was extracted from medical records of each patient or was assessed by gaining information from relatives. From the acute stroke unit, admission, mortality and discharge dates were collected which enabled the derivation of length of hospital stay and mortality status at discharge.
For both study populations, the patient’s medical history, computed tomography (CT) or magnetic resonance imaging (MRI) scans were used to ascertain cases of ischaemic and haemorrhagic stroke. TIA, subdural haematoma and subarachnoid haemorrhages were specifically excluded from the study. ASCNES included NNUH patients (8 study months between 2009 and 2011), any patient who had a duplicate record, one of the records (from NNSTR as a default) was excluded from the current study. For those with recurrent strokes, their first occurrence of stroke was included in the study.
SOAR score
The SOAR score is an 8-point score ranging from score 0 to 7, which comprises stroke subtype (haemorrhagic/ischaemic), Oxford Community Stroke Project (OCSP) classification, age and pre-stroke modified Rankin score.8,9 Glucose levels on admission were added to the SOAR score as a criterion which scores 1 point; the SOAR with glucose (SOAR-G) score ranged from 0 to 8 and gave a person with an abnormal glucose score (either borderline hyperglycaemia or hyperglycaemia) an additional point in the scoring system. The calculation of the new score (SOAR-G) is described in Supplementary Table 1.
Statistical analysis
The main exposure of interest was blood glucose levels at admission. The former was categorized into four categories using standard cut-off points, hypoglycaemia (<4.0 mmol/L), normoglycaemia (4.0–7.8 mmol/L), borderline hyperglycaemia (7.9–11.0 mmol/L) and hyperglycaemia (⩾11.1 mmol/L). 15 Only stroke cases with complete data to calculate SOAR and no missing data for admission glucose were included in this study. The outcomes of interest were 7-day mortality and inpatient mortality. Inpatient mortality included any deaths that occurred during the same admission. 7-day mortality included all deaths within 7 days of hospital admission, and status at discharge did not impact inclusion into this outcome.
Data analyses were performed using SPSS V.22.0 (Chicago, Illinois, USA). Unconditional logistic regression models were constructed for both inpatient and 7-day mortality outcomes. This model adjusted for sex, age categories (⩽60, 61–79 and ⩾80 years), OCSP classification [total anterior circulation stroke (TACS), lacunar stroke (LACS), posterior circulation stroke (POCS) and partial anterior circulation stroke (PACS)], pre-stroke mRS (0–5), diabetes status prior to diagnosis and stroke type (ischaemic or haemorrhagic). Sex was assessed as a confounder in the multivariable regression, and there were no data available on ethnicity but majority were White Caucasians (>99.5%). Using the multivariable model, a sensitivity analysis was completed treating admission blood glucose as a continuous variable. Further models were created by stratifying the initial models by stroke type (haemorrhagic and ischaemic stroke types) for both outcomes. Complete case analysis was used to address missing data.
The discriminating ability of SOAR and SOAR-G was compared using receiver operating characteristic (ROC) curves; a combined command was used to assess the equality of each of the curves from each score using area under the curve (AUC). A sensitivity analysis was completed; this entailed stratifying each of the ROC curves by diabetes status. These have been presented as AUC from the ROC curves. STATA V.13SE (STATA Corp, Texas, USA) was used for the ROC curve analysis.
Results
Characteristics of study population
The potentially eligible sample consisted of 4825 patients from the NNSTR and 1766 patients from the ASCNES; 74 patients had missing discharge status data. A further 116 patients had missing glucose data on admission and 826 patients had other missing clinical or demographic data. As shown in Figure 1, this provided a total of 5575 patients eligible to be included in the study. The sample characteristics are shown in Table 1. The sample mean [standard deviation (SD)] age was 76.96 ± 11.8 years, with 48.6% males. Of the whole group, 89.2% had an ischaemic stroke and 60.4% had a pre-stroke mRS of 0 (i.e. fully independent). The most common OCSP stroke classification was PACS with 36.1% of patients. The majority (74.1%) of patients had a normal glucose level on admission with 20.7% of patients known to have diabetes; 18% of the study subjects died as inpatient and 8.4% died within 7 days of admission. The median length of stay was 8 days [interquartile range (IQR) = 4–18] and the range was 0–180 days.
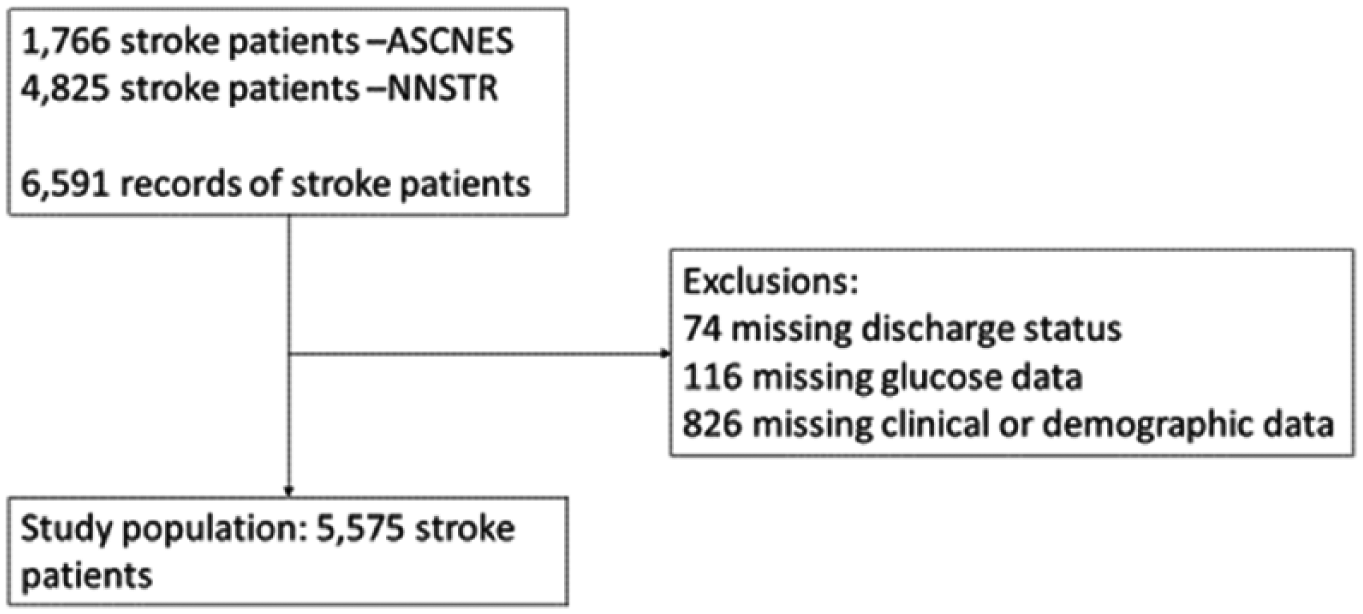
Derivation of study population.
Overall sample characteristics of the combined ASCNES and NNUH datasets.
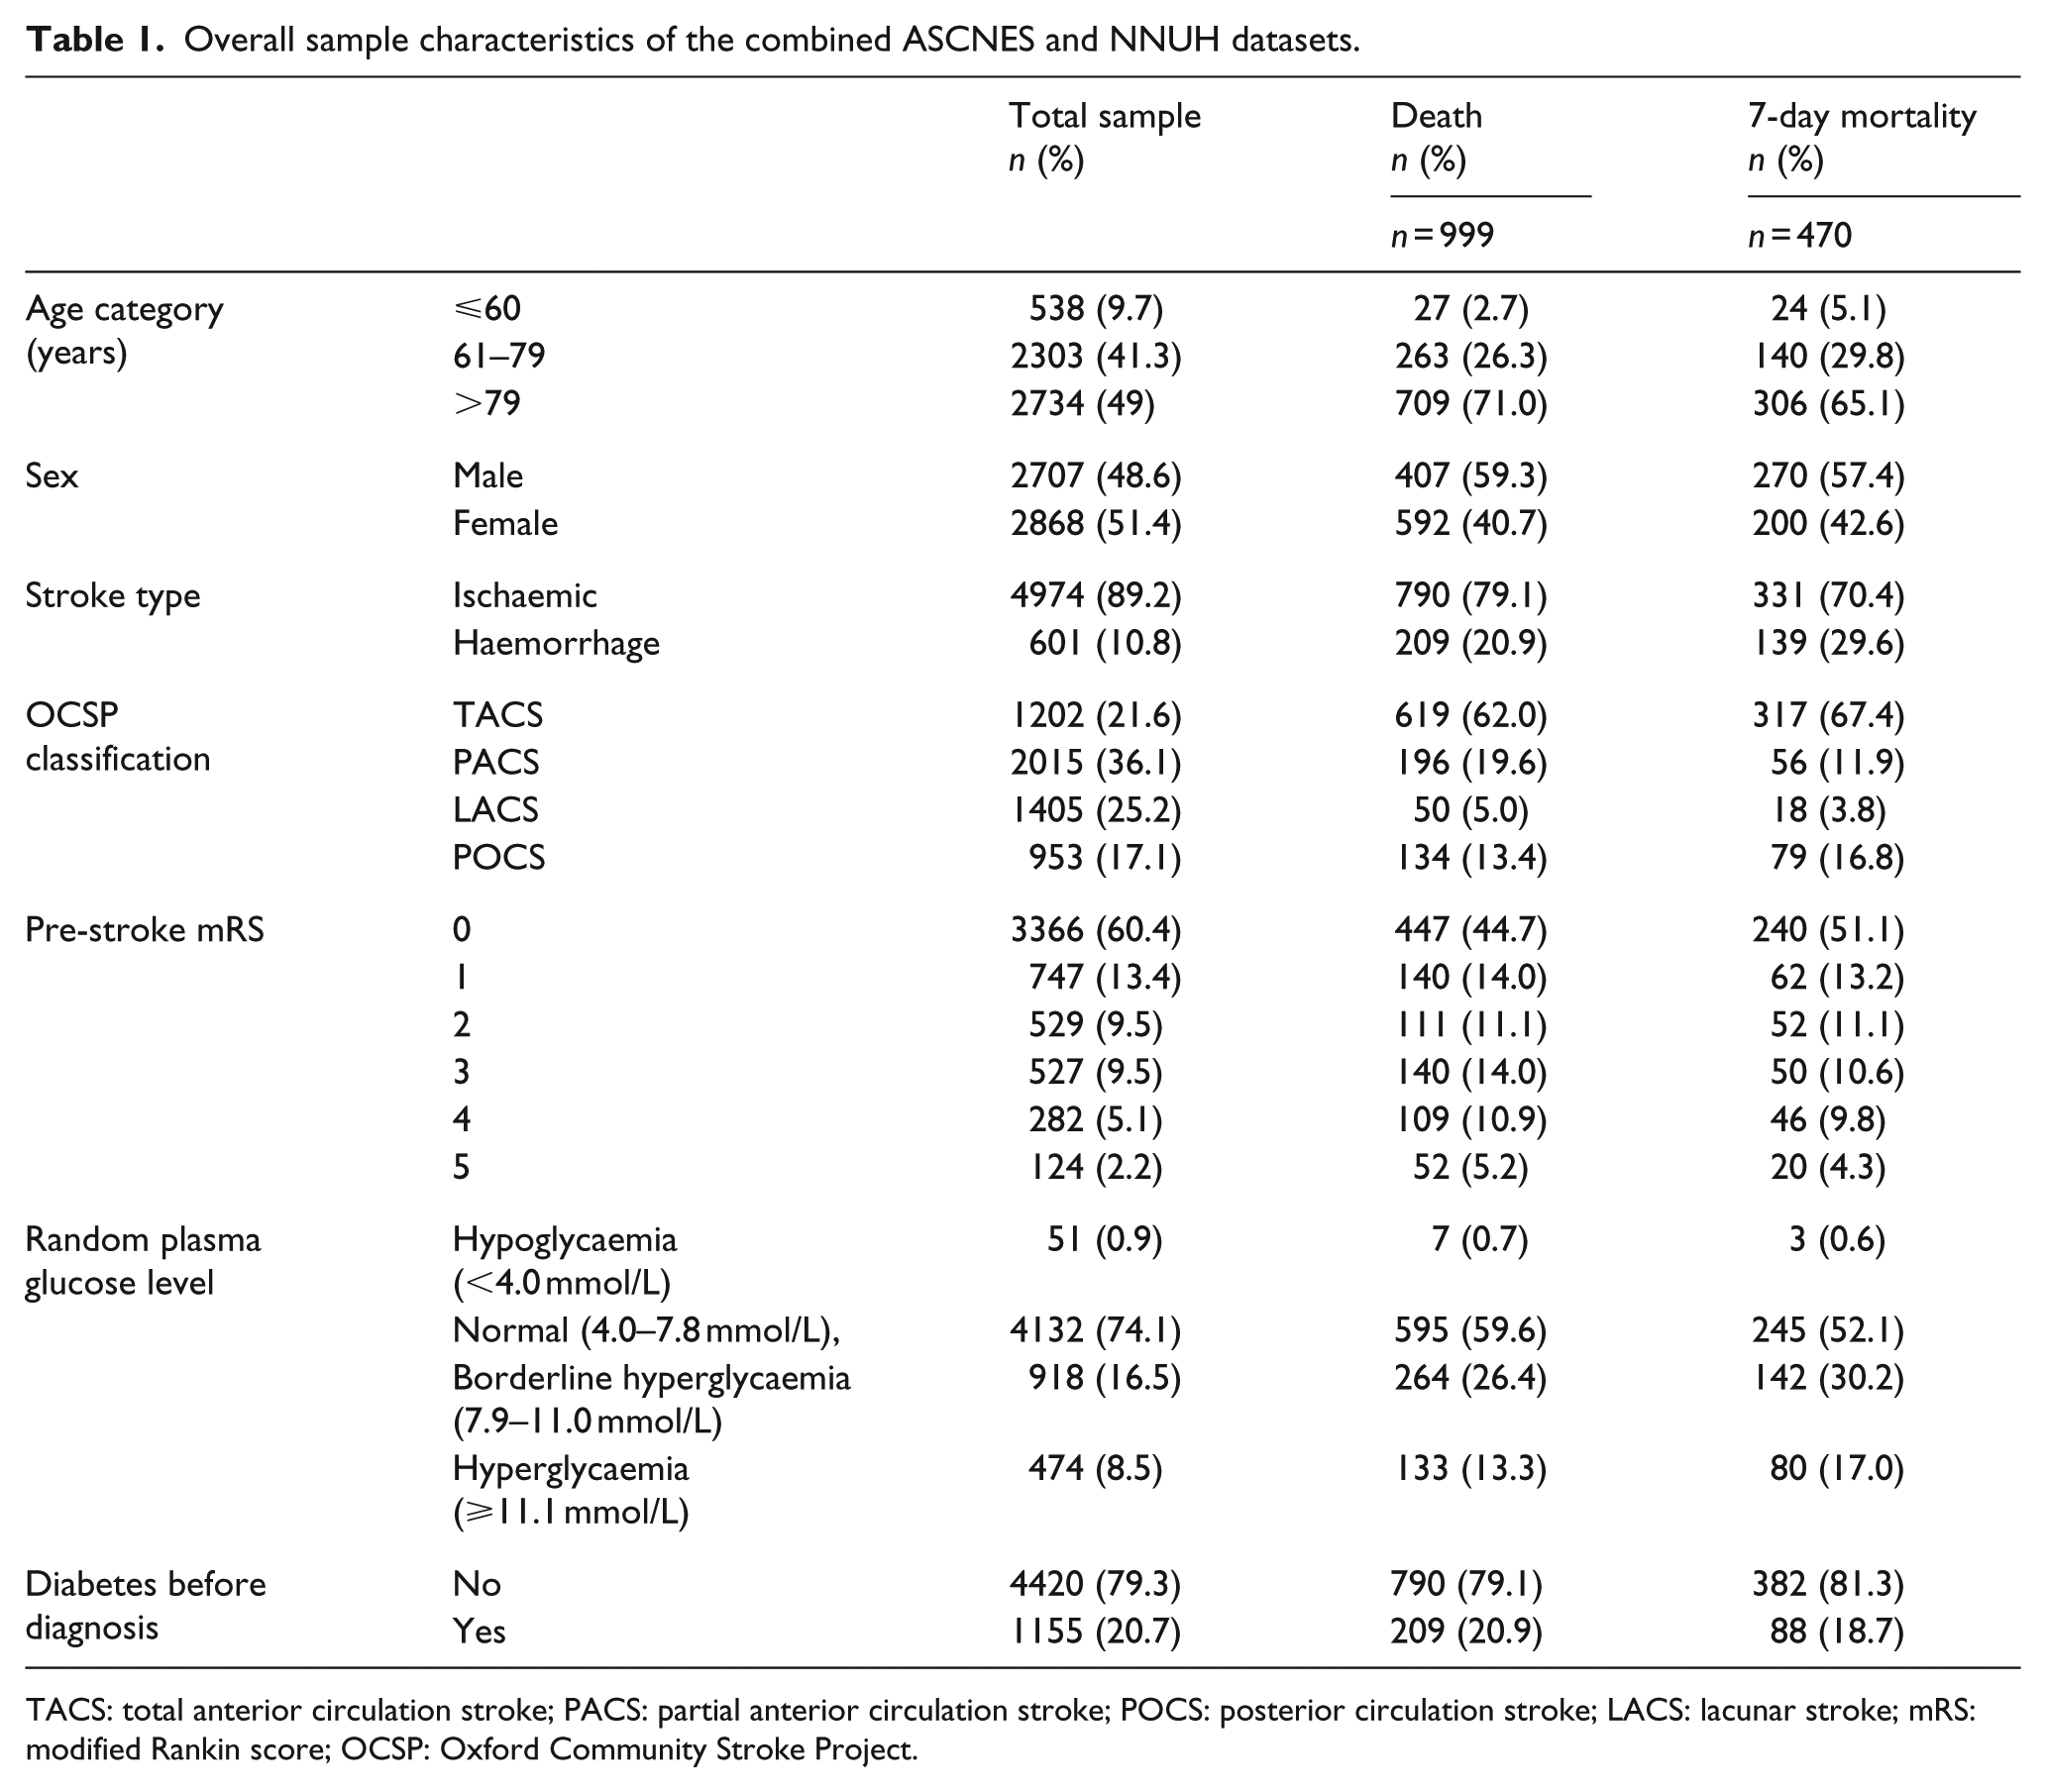
TACS: total anterior circulation stroke; PACS: partial anterior circulation stroke; POCS: posterior circulation stroke; LACS: lacunar stroke; mRS: modified Rankin score; OCSP: Oxford Community Stroke Project.
Glucose level and mortality after stroke
In a multivariate analysis including all stroke types, those with borderline hyperglycaemia, compared to those with normal glucose levels, had an increased likelihood of inpatient mortality with an adjusted odds ratio (aOR) of 1.93 [95% confidence interval (CI): 1.57–2.37] and of 7-day mortality with an aOR of 2.18 [95% CI: 1.70–2.80]. The likelihood of inpatient and 7-day mortality was not significantly higher for hyperglycaemia versus normoglycaemia [aOR: 2.64 (95% CI: 1.98–3.54) vs aOR: 3.6 (95% CI: 2.61–5.17), respectively].
Glucose level and mortality after stroke by stroke type
A similar trend was evident for both mortality outcomes when the analysis was stratified by stroke subtype. The impact on inpatient mortality by having hyperglycaemia compared to a normal glucose level on admission appeared to be greater for haemorrhagic stroke than for ischaemic stroke [aOR 4.92 (95% CI: 2.47–9.77) vs aOR 2.32 (1.68–3.22)]. There was a similar trend for the 7-day mortality outcome. In a sensitivity analysis, the adjusted odds of inpatient mortality increased by 11% per each additional unit increase in glucose level at admission [aOR: 1.11 (95% CI: 1.08–1.14)] (See Table 2). Similarly, the adjusted odds of 7-day mortality increased by 12% per unit increase in glucose level at admission [aOR: 1.12 (95% CI: 1.09–1.16)] (Data not presented).
Multivariate analysis examining the risk of mortality for glucose levels and patient characteristics by all stroke types, ischaemic and haemorrhagic strokes.
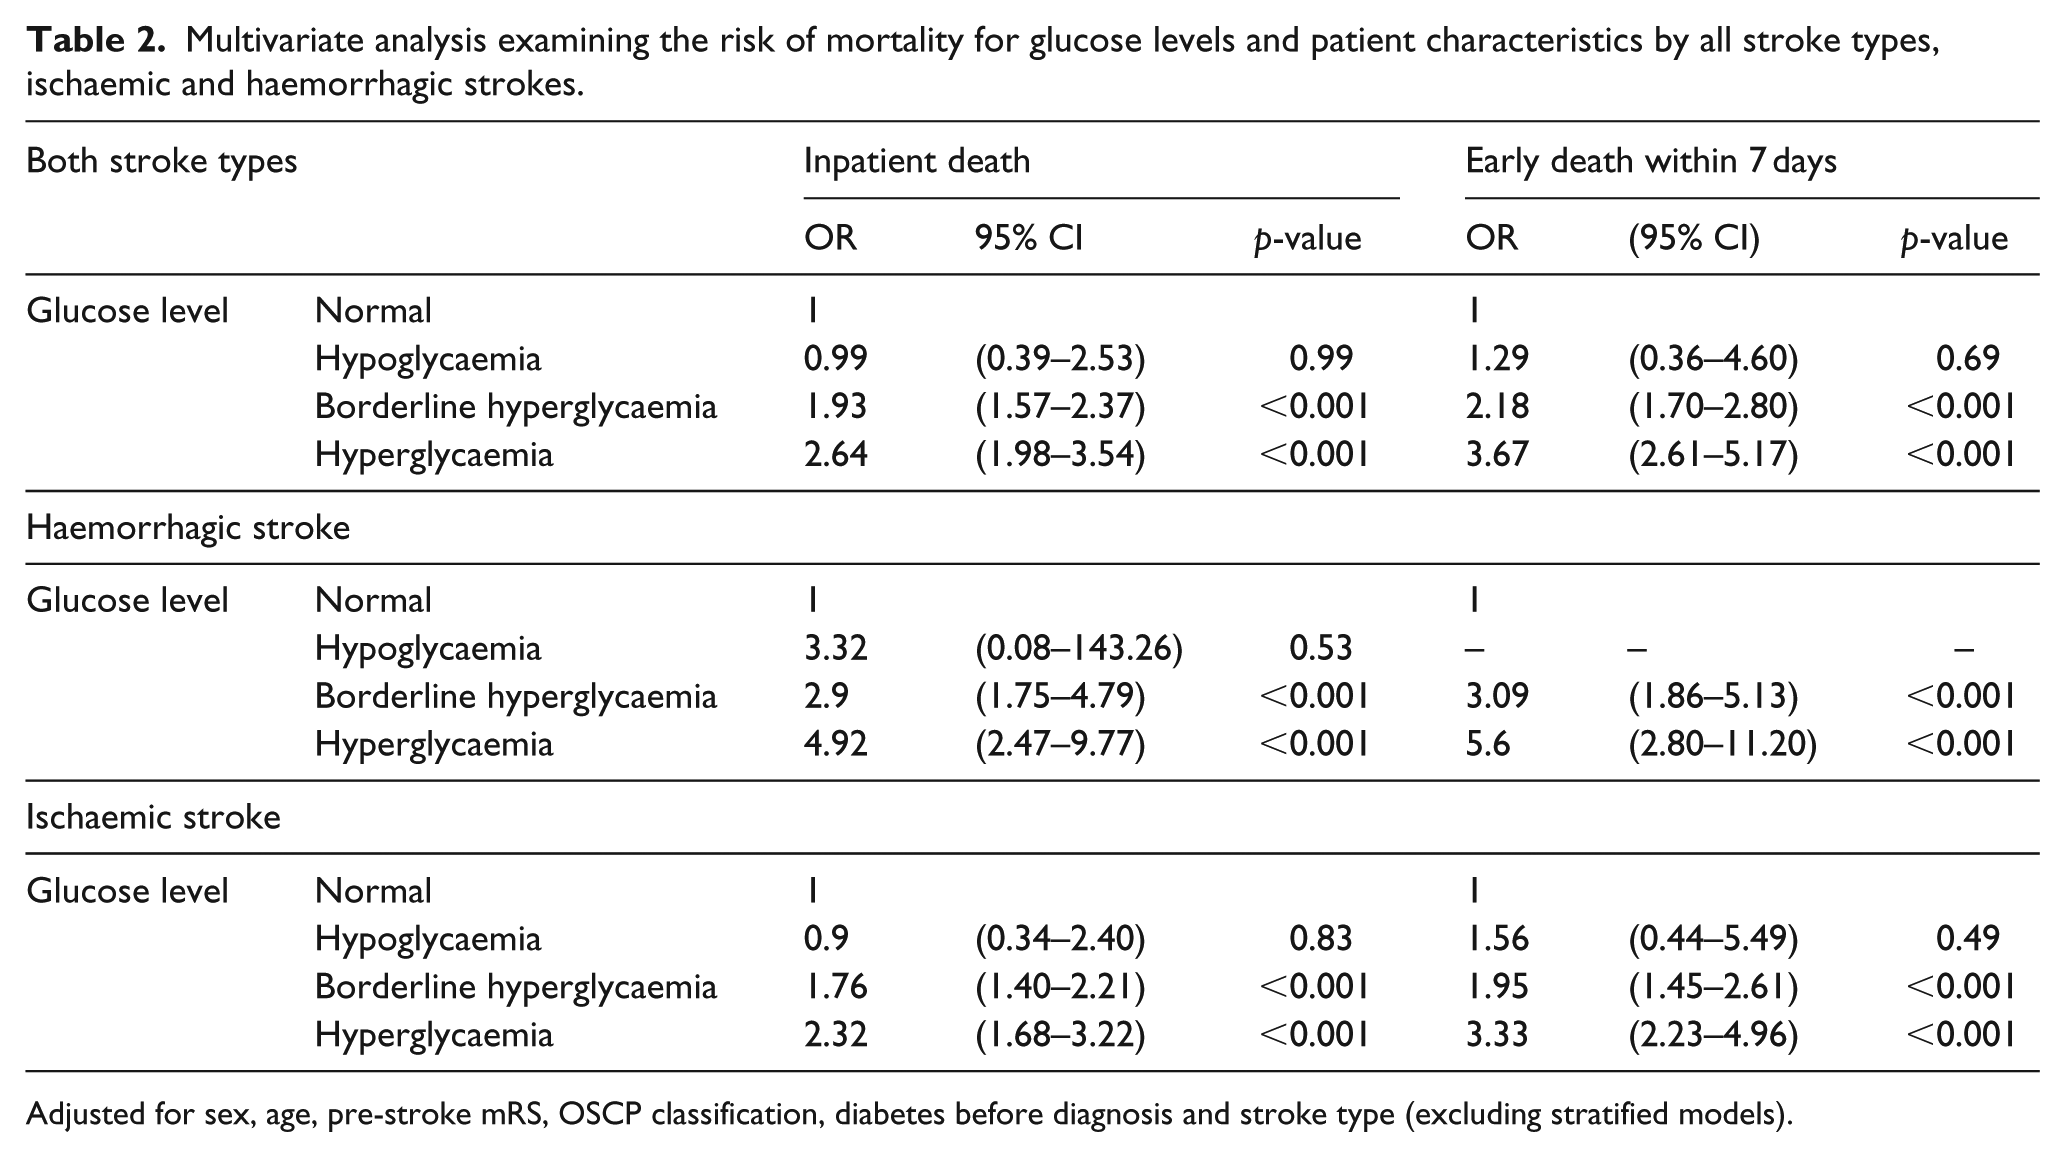
Adjusted for sex, age, pre-stroke mRS, OSCP classification, diabetes before diagnosis and stroke type (excluding stratified models).
SOAR, SOAR-G and mortality outcomes
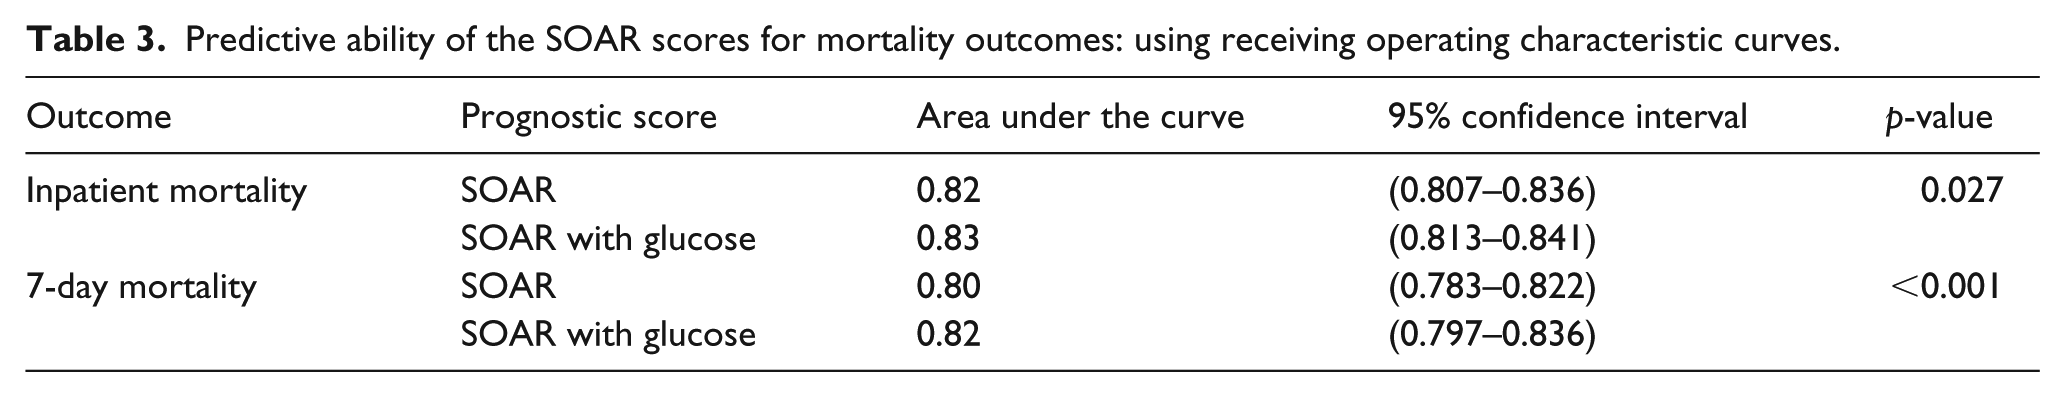
The overall discriminating value for each SOAR score and mortality outcome is presented in Supplementary Table 2. Both the SOAR and SOAR-G scores were highly predictive in discriminating inpatient mortality with an AUC of 0.82 (95% CI: 0.81–0.84) and 0.83 (95% CI: 0.81–0.84), respectively (see Table 3). Similarly, the SOAR and SOAR-G scores were highly predictive in discriminating 7-day mortality with an AUC of 0.80 (95% CI: 0.78–0.82) and 0.82 (95% CI: 0.80–0.84), respectively (see Figure 2(a) and (b)). For both outcomes, in the combined analysis, despite a minimal absolute increase in the AUC between the SOAR and SOAR-G scores, there was a statistical difference in the predictive ability between the scores, with SOAR-G performing better than SOAR.
Predictive ability of the SOAR scores for mortality outcomes: using receiving operating characteristic curves.
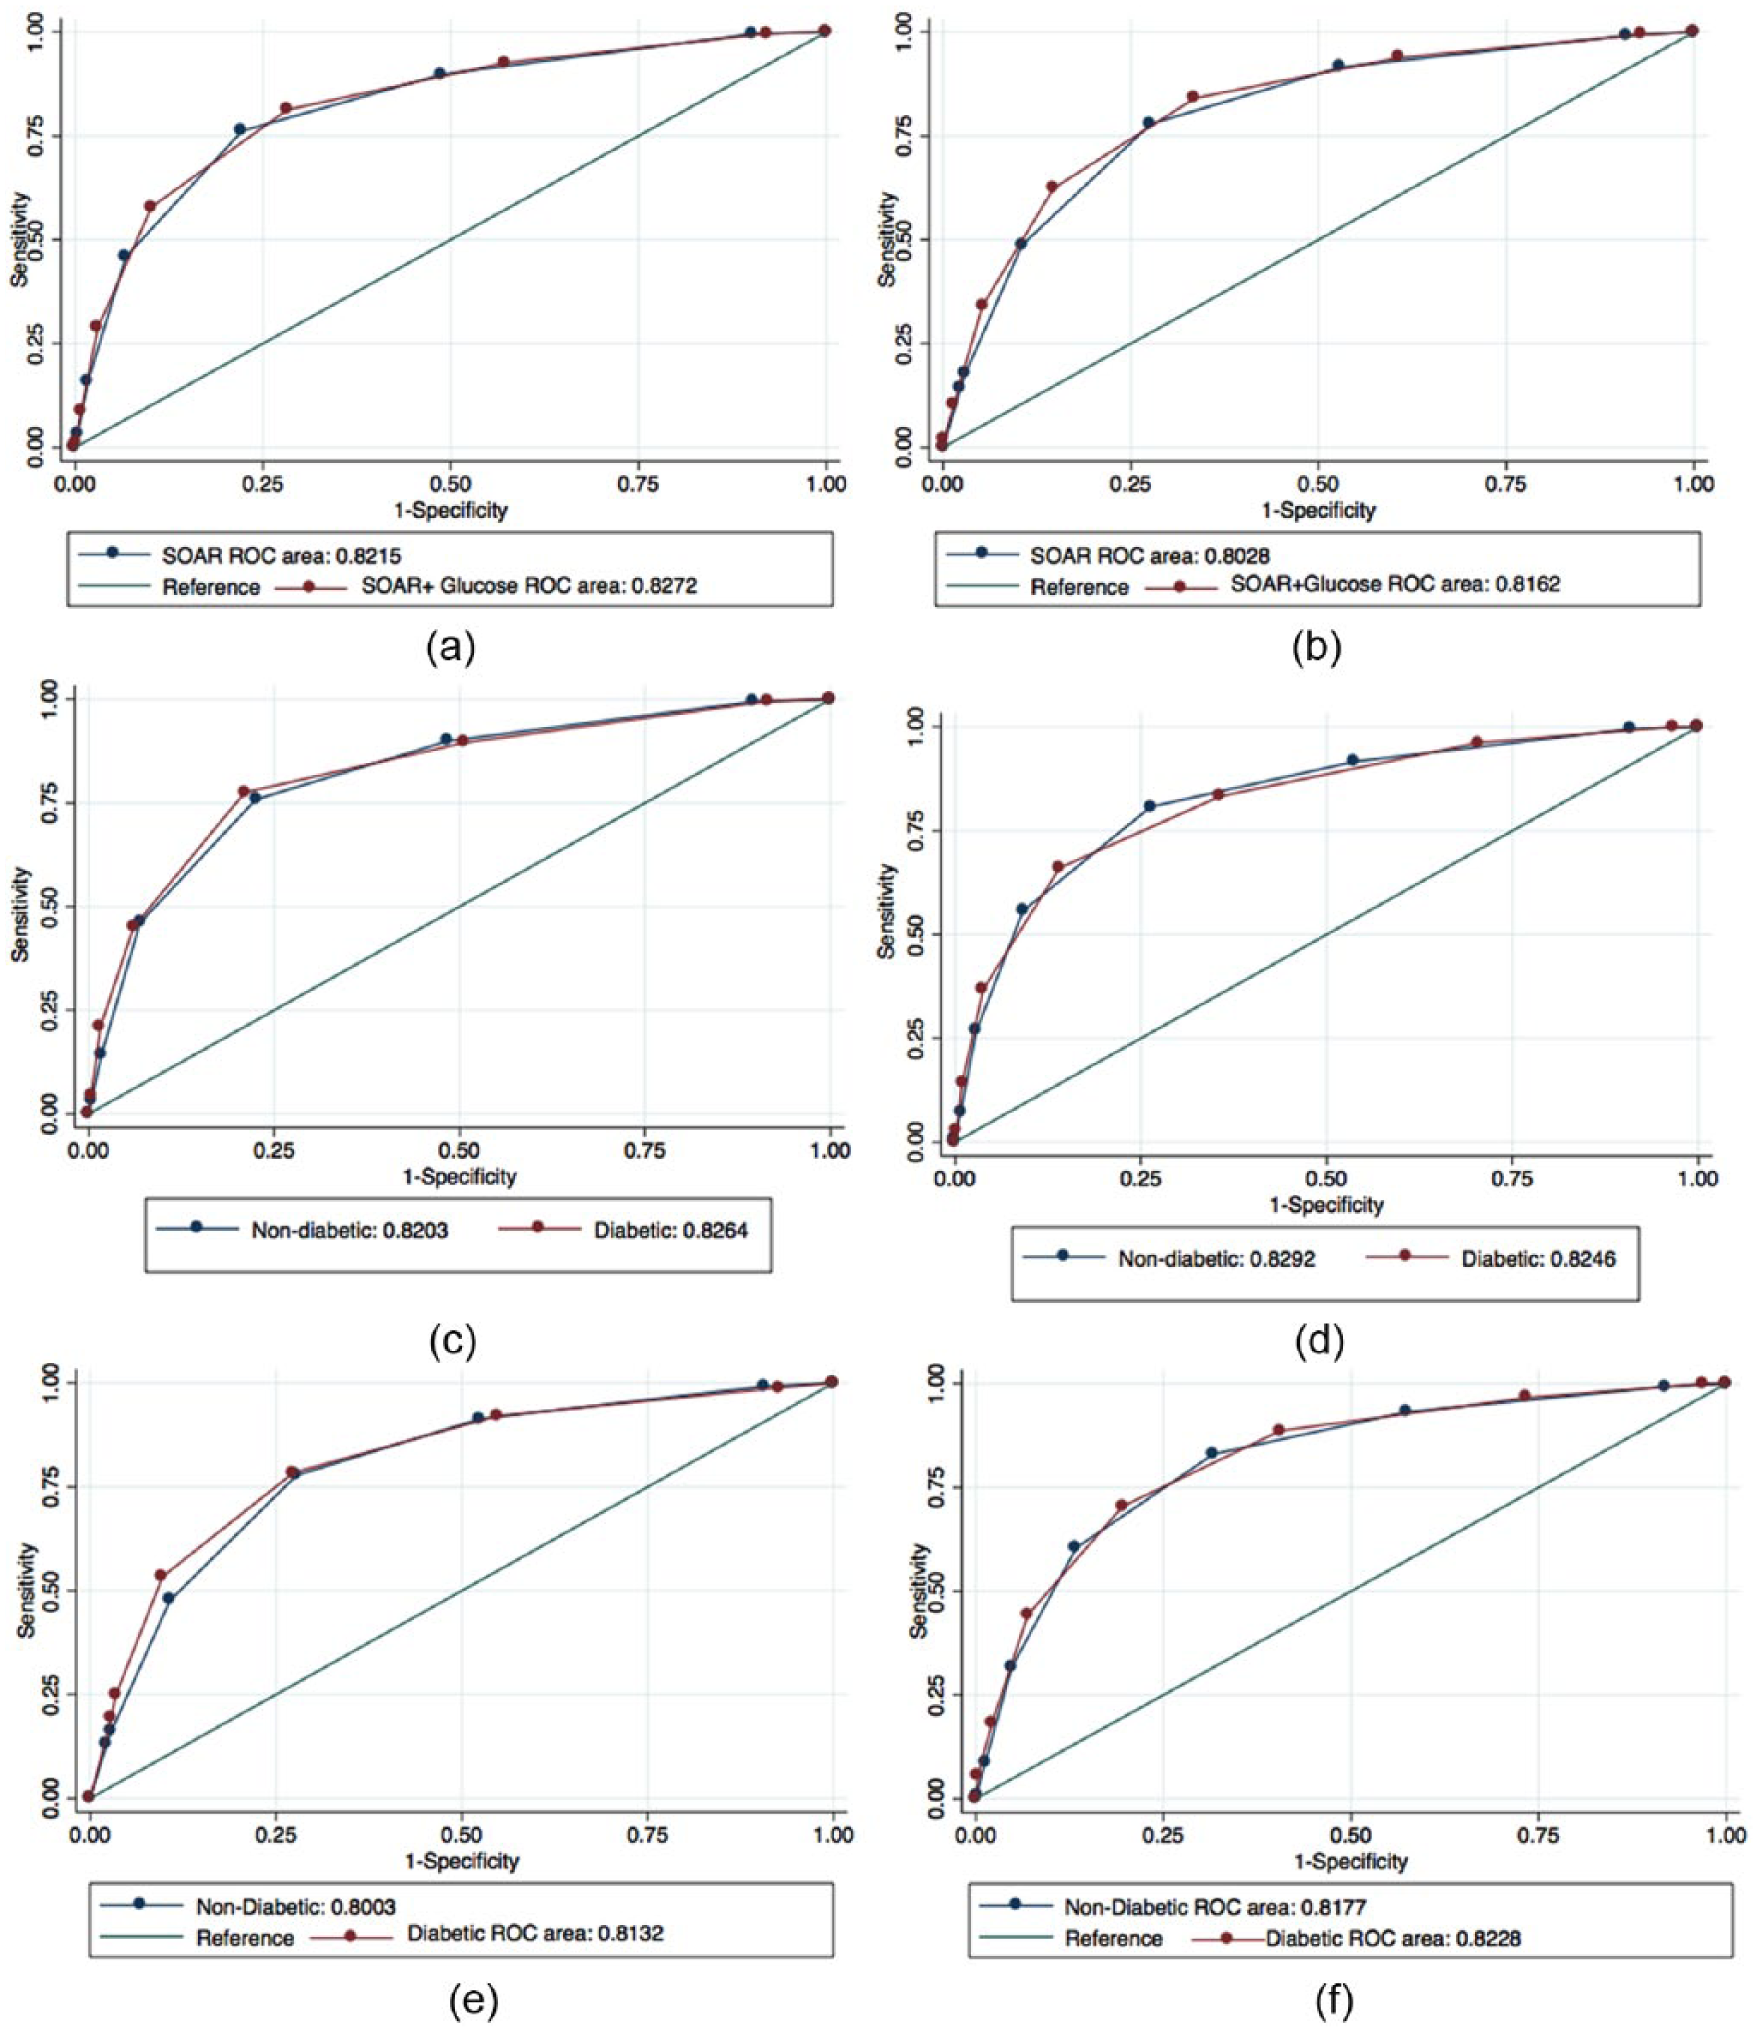
Receiver operating characteristic curve differentiating (a) inpatient mortality using SOAR and SOAR with glucose score, (b) 7-day mortality using SOAR and SOAR with glucose score, (c) inpatient mortality using SOAR and stratified by diabetes status before diagnosis, (d) inpatient mortality using SOAR with glucose score stratified by diabetes status before diagnosis, (e) 7-day mortality using SOAR and stratified by diabetes status before diagnosis and (f) 7-day mortality using SOAR with glucose score stratified by diabetes status before diagnosis.
Prognostics values stratified by diabetes status
Figure 2(c)–(f) highlights the ROC curve analysis stratified by diabetes status. The SOAR score had very similar predictive abilities when stratified by diabetes diagnosis status, in both respective outcomes. The SOAR score including glucose had very similar predictive abilities when stratified by diabetes diagnosis status, in both respective outcomes.
Discussion
Study summary
In this study, we confirmed that SOAR stroke score was highly predictive of both inpatient and 7-day mortality. While admission glucose level was an independent predictor of early stroke mortality, addition of glycaemic status to SOAR stroke score did not bring clinically meaningful benefit despite the score’s discriminating ability being improved statistically. When this analysis was stratified by diabetes status, both SOAR scores were good at predicting stroke outcomes in both patients with and without diabetes.
Findings in context of literature – glucose and stroke outcome
Our study findings are in consistent with much of the previous literature, as a number of studies have shown a strong association between hyperglycaemia and poor stroke outcome.16–20 Similar to previous research, this study illustrates that there was a linear association between increased glucose levels and post-stroke mortality. 16 Despite this association, there remains debate around the causal relationship between glucose and post-stroke outcome. A Cochrane Review has shown that there was no evidence to support benefit in maintaining blood glucose at a range of 4–7.5 mmol/L after stroke; the main outcomes studied in this system review were death, functionality and neurological deficit. 21
Findings in context of literature – prognostic score
Despite a statistically significant difference between SOAR and SOAR-G scores, the addition of SOAR-G is unlikely to be useful in clinical practice as the improvement in score performance is minimal despite the statistical significance. Stratifying upon diabetes status did not change the predictive ability of the either SOAR scores. The most recent Cochrane Review suggested that there is no specific blood glucose threshold that must be maintained in patients with hyperglycaemia after an acute stroke. 21 This illustrates that the constituents of the SOAR score already contain the informative predictors of poor outcomes after a stroke.
The purposes of this study were to assess whether in our population, glucose level after stroke was associated with poor outcomes and if so whether the addition of glycaemic status to the SOAR stroke score improved its prognostic ability. As this association existed, we further assessed whether it would improve the predictive ability of an established SOAR stroke score. The data from our study suggest that although an increase in glucose level was associated with mortality, it did not materially change the predictive ability of the SOAR score.
Strengths and weaknesses
Our prospectively collected study had a relatively large and representative sample using the data from multiple centres across the East Anglia. The SOAR score itself is very easy to obtain and calculate, unlike other prognostic measures, this makes it a very practical measure to use in a clinical setting.6,8 As this was an observational study, it cannot imply the causal relationship between glucose and stroke outcome. The use of data from hospital-based registries may be a potential limitation of this study as severe strokes that resulted in death in the community were not included in the registry; similarly, mild strokes may have not attended secondary care. 8 However, the truncation of distribution will only attenuate the observed associations. Further prognostic information of mortality is irrelevant to those who died prior to admission and those who sustained mildest forms of stroke with almost 0% chance of mortality from the event.8,22
Conclusion
To conclude, we have shown that both SOAR stroke score and SOAR-G score were very good at predicting both inpatient and 7-day mortality after an acute stroke. Although there was a statistically significant difference between the scores, the added value of including glucose to the SOAR did not clinically increase its discriminating ability in an unselected stroke patient population.
Key messages
A borderline hyperglycaemic score and a high SOAR score had an increased likelihood of acute stroke mortality.
The addition of hyperglycaemia did not improve the prognostic ability of the SOAR score.
The constituents of the SOAR stroke score are good at predicting poor outcomes after stroke without the addition of glucose.
Footnotes
Acknowledgements
S.J.M. and T.A.A. are joint first authors. P.K.M. is the PI of both NNUSTR and ASCNES, and conceived the idea; S.D.M. and J.H.B-.S. performed data linkages; S.J.M. and T.A.A. did literature search, and cleaned and analysed the data under supervision of A.B.C.; J.F.P.D.M., M.O.B. and A.K.M. are co-I of ASCNES, and J.F.P.D.M., K.M.B. and A.K.M. are co-I of NNUSTR; and S.J.M. and P.K.M. drafted the manuscript. All authors contributed in writing the paper. P.K.M. is the guarantor. The authors gratefully acknowledge the data teams of the eight NHS Trusts which made up the ASCNES and the data team at the Norfolk and Norwich NHS Foundation Trust.
Declaration of conflicting interests
The author(s) declared no potential conflicts of interest with respect to the research, authorship and/or publication of this article.
Ethical approval
Both NNUH Stroke and TIA register and ASCNES received the ethical approval.
Funding
The author(s) disclosed receipt of the following financial support for the research, authorship, and/or publication of this article: The authors would like to acknowledge the funders of the Anglia Stroke Clinical Network Evaluation Study (ASCNES) and the Norfolk and Norwich Stroke and TIA Register. ASCNES is funded by the National Institute for Health Research (NIHR) Research for Patient Benefit Programme (PB-PG-1208-18240). This work presents independent research funded by the NIHR under its Research for Patient Benefit (RfPB) programme (grant reference no. PB-PG-1208-18240). The views expressed are those of the author(s) and not necessarily those of the NHS, the NIHR or the Department of Health. The NNUH stroke and TIA register is maintained by the NNUH NHS Foundation Trust Stroke Services, and data management for this study is supported by the NNUH Research and Development Department through Research Capability Funds.