
Abstract
Quantitative polymerase chain reaction was employed to quantify expression of two genes coding for advanced glycation end-product receptors [RAGE (AGER) and AGER1 (DDOST)] and of the gene coding the deacetylase SIRT1 (SIRT1) in peripheral blood mononuclear cells from type 1 diabetes patients without [Group A, n = 35; 28.5 (24–39) years old; median (interquartile interval)] or with at least one microvascular complication [Group B, n = 117; 34.5 (30–42) years old]; 31 healthy controls were also included. In a subgroup of 48 patients, daily advanced glycation end-products intake before blood collection was assessed. Lower expression of DDOST was found in patients than in controls after adjustment for sex, age, use of statins, angiotensin-converting enzyme inhibitors and angiotensin receptor blockers. Higher expressions of AGER, DDOST and SIRT1 were observed in Group A. Stratifying by complications, AGER and DDOST expressions were higher in those without retinopathy and without diabetic kidney disease, respectively, compared to patients with these complications. Patients using statins or angiotensin receptor blockers presented higher expression of DDOST. Expression of SIRT1 was higher in patients consuming ≥12,872 KU daily of advanced glycation end-products. Although AGER, DDOST and SIRT1 are differently expressed in peripheral blood mononuclear cells from type 1 diabetes patients with and without microvascular complications, they are also influenced by dietary advanced glycation end-products and by statins and angiotensin receptor blockers.
Keywords
Introduction
The formation of advanced glycation end-products (AGEs) is regarded as one of the most important mechanisms in the pathogenesis of retinopathy, diabetic kidney disease (DKD) and peripheral neuropathy. 1 The glycation (or Maillard) reaction is characterized by the non-enzymatic covalent bond between reducing aldehydes or sugars and proteins, nucleic acids and phospholipids such as phosphatidylethanolamine, 2 resulting in the formation of early glycation products. The molecular rearrangement of these compounds and the intracellular generation of glucose-derived dicarbonyl precursors give rise to the heterogeneous array of AGEs, which can irreversibly alter the structure of macromolecules, as well as bind to non-specific and specific cell receptors. 3
The most studied AGE receptors are the receptor for advanced glycation end-products (RAGE) and the advanced glycation end-product receptor 1 (AGER1). While the former binds AGEs and triggers a pro-oxidative/pro-inflammatory cascade, the latter mediates AGEs endocytosis and degradation and prevents AGE-initiated transactivation of epithelial growth factor receptor, restricting pro-oxidative/pro-apoptotic pathways and possibly acting in synergy with Sirtuin 1 (SIRT1), a deacetylase which exerts anti-inflammatory and antioxidant actions. 4 On the contrary, AGEs-RAGE system was shown to increase the ubiquitination and subsequent proteasome-mediated degradation of SIRT1. 5
AGE concentrations depend not only on endogenous formation and catabolism but also on oral intake, since they are present in foods prepared in high temperatures. In healthy subjects, short-term elevations or reductions in AGEs intake elicit, respectively, increases and decreases in both RAGE and AGER1 expression, while in the diabetes setting, hyperglycaemia is reported to persistently increase RAGE and suppress AGER1 expression, although both receptor contents may be restored to normal when patients are submitted to low AGE diets. 6
Given the well-known participation of AGEs in the pathogenesis of diabetes complications, 7 we assessed the messenger RNA (mRNA) expression of the genes coding RAGE, AGER1 and SIRT1 in peripheral blood mononuclear cells (PMBC) from long-term type 1 diabetes (T1D) patients, to test the hypothesis that an imbalance among the expression of these genes could reflect the presence of diabetic microvascular complications. We also evaluated the association of mRNA expression of those target genes with plasmatic concentrations of the AGE carboxymethyllysine (CML), with markers of oxidative stress, use of medicines and, in a subgroup of patients, with dietary intake of AGEs.
Participants and methods
Participants
A total of 152 T1D patients (62% women) with median (interquartile interval) of 33.5 (28.0–40.7) years old, median diabetes duration of 19.5 (15.0–27.0) years and median HbA1c of 8.2%/66.1 mmol mol−1 (7.3–9.4/56.3–79.2) were enrolled between September 2013 and December 2014 in this cross-sectional study. Inclusion criterion was diabetes duration ≥10 years. All patients presenting autoimmune diseases and HIV or HCV infection were excluded from the study, as well as smokers, kidney-transplanted patients and patients with overt kidney disease who did not present concomitant diabetic retinopathy to minimize the possibility of including T1D patients with non-DKD.
A total of 31 healthy subjects not taking angiotensin-converting enzyme inhibitors (ACEI), angiotensin receptor blockers (ARB) or statins were included as the control group (67% women) with median (interquartile interval) of 30.0 (27.0–34.0) years old.
All participants signed informed consent and the study was conducted in compliance with the Institutional Ethics Committee (Committee approvals #149,940 and #294, 169 CEP/CONEP) and the Declaration of Helsinki of 1975, revised in 1983. All patients were followed up in the Diabetes Outpatient Clinic of Hospital das Clínicas da Faculdade de Medicina da Universidade de São Paulo.
Evaluation of diabetes complications
Diabetes microvascular complications were evaluated as previously described. 8 Briefly, diabetic retinopathy (DR) was assessed by standardized seven-field retinal colour photographs with the use of TRC-NW8 Non-Mydriatic Retinal Camera (Topcon, Oakland, NJ, USA), following the International classification of diabetic retinopathy and macular edema: 9 without DR (n = 44), with mild non-proliferative DR (n = 58), moderate non-proliferative DR (n = 5), severe non-proliferative DR (n = 9) or with proliferative DR (n = 36).
DKD was defined based on urinary albumin-to-creatinine ratio (ACR). The absence of DKD was defined as ACR < 30 mg g−1 creatinine (n = 109); incipient DKD was defined as persistent microalbuminuria (ACR = 30–300 mg g−1 creatinine; n = 19) and overt DKD was defined as macroalbuminuria (ACR > 300 mg g−1 creatinine; n = 24, including 12 patients on dialysis). CKD-EPI was used to calculate estimated glomerular filtration rate (eGFR). 10
Diagnosis of peripheral neuropathy (PN) was made according to the sum of score of the Neuropathy Symptoms Score and Modified Neuropathy Disability Score, as proposed by Boulton 11 and Meijer et al. 12 Patients were stratified into two groups: those without PN (n = 71) and those with PN (n = 48). Cardiovascular autonomic neuropathy (CAN) was evaluated based on spectral analysis of the heart rate variability, Ewing Tests and measurement of systolic blood pressure after 3 min standing; a total of seven parameters were assessed. Diagnosis of CAN was made as previously described: 13 those without CAN (presence of <3 abnormal tests, n = 106) and those with CAN (presence of ≥3 abnormal tests, n = 45).
mRNA expression in PBMC
Blood was collected into BD Vacutainer CPT tubes (BD, Franklin Lakes, NJ, USA) after a 12-h fasting period and separated by the Ficoll method to isolate PBMC, as previously described. 14 Plasma was stored at −80°C for measurements of CML, thiobarbituric acid–reactive substances (TBARS) and reduced glutathione (GSH). PBMCs were lysed by Trizol reagent (Life Technologies, Carlsbad, CA, USA), and after addition of chloroform and centrifugation, the aqueous phase was aspirated from the phenol phase and transferred to RNeasy Spin columns (Qiagen, Germantown, MD, USA). RNA quantity was evaluated by NanoDrop (ND-1000 Spectrophotometer) and RNA integrity was evaluated by 1% agarose gel electrophoresis. Reverse transcription of 1,000 ng of total RNA was performed with the use of High Capacity cDNA Reverse Transcription Kit (Life Technologies) according to manufacturer’s instructions.
AGER (encodes RAGE), DDOST (encodes AGER1) and SIRT1 mRNA expressions were evaluated using the StepOne plus Real-Time PCR System (Life Technologies). For quantitative PCR, 10 μL of Taqman Gene Expression Master Mix (2X, Life Technologies), 1 μL of hydrolysis probes set (20×), 10 ng of cDNA and 7 μL of RNase free H2O were mixed. Each sample was run in duplicate. The relative mRNA abundance was calculated using the 2−ΔΔCt method. 15 The average of β-actin (ACTB) and β2-microglobulin (B2M) expression was used as reference gene.
Measurement of CML and of oxidative stress markers
Plasmatic CML concentrations were obtained with the use of CircuLex CML/Nε-(Carboxymethyl)lysine ELISA kit (MBL International Corporation, MA, USA) following the manufacturer’s instructions. Plasmatic TBARS concentrations were determined as an indicator of lipid peroxidation by a colorimetric method. 16 The concentration of lipid peroxidation products was calculated as malondialdehyde (MDA) equivalent using a molar extinction coefficient for the MDA-thiobarbituric acid complex of 1.56 × 10⁵ mol−1 cm−1. TBARS concentrations were expressed as nmol mL−1.
GSH was determined in total blood by the method of Sedlak and Lindsay. 17 GSH was quantified by the average standard curve of cysteine and expressed as μmol mL−1. 18
Measurement of dietary AGEs intake
In a subgroup of 48 T1D patients randomly chosen, daily AGEs intake during the three consecutive days before blood collection was assessed based on 3-day food records, which allowed the estimation of consumed food and beverages. 19 A dietitian reviewed the records with patients, detailing portion sizes and cooking preparation methods. AGEs content was estimated from a database containing approximately 560 foods with respective AGE values (based on CML content) and was expressed as AGE equivalents (Eq) per day (AGE Eq = 1,000 kilounits). 19
Statistical analysis
JMP software version 8.0 (SAS Institute, Cary, NC, USA) was used to perform statistical analyses. Before the analyses, AGER, DDOST and SIRT1 mRNA expressions normalized by the reference genes were log10 transformed. Non-parametric Wilcoxon signed-rank test was employed to identify the differences among the studied groups followed by Tukey’s post-test for the analyses with three or more groups; all analyses including only T1D patients were adjusted by sex, age, diabetes duration, HbA1c, eGFR, presence of arterial hypertension, triglyceride concentrations and use of ACEI or ARB and statins. Spearman’s rank correlation coefficient was used for the correlation analyses. A p value of <0.05 was considered statistically significant.
Results
No differences were observed in mRNA expressions of AGER, DDOST and SIRT1 between T1D patients and healthy controls after adjustment for sex and age. However, when the analyses were also adjusted by use of ACEI, ARB and statins, DDOST (but not AGER and SIRT1, Figure 1, panels a and c, respectively) expression was significantly lower in T1D patients in comparison to healthy controls (p = 0.002; Figure 1, panel b). T1D patients were sorted into two groups: Group A comprised patients with no microvascular complications (n = 35) while Group B comprised patients presenting at least one of the following microvascular complications (DKD, DR, PN or CAN) (n = 117). Demographic, clinical and biochemical characteristics of T1D patients are shown in Table 1. Patients in Group B were older [34.5 (30–42) vs 28.5 (24–39) years; p = 0.04, respectively], presented lower eGFR [88 (59–110) vs 100 (87–110) mL min−1 1.73 m2; p = 0.0095], higher frequency of arterial hypertension (38% vs 15%, p = 0.01), higher triglyceride concentrations [83 (57–114) vs 65 (52–83) mg dL−1; p = 0.01], longer diabetes duration [22 (16–28) vs 16 (12–21) years; p = 0.006] and a higher frequency of ACEI use (33% vs 14%; p = 0.034) in comparison to Group A. There were no significant differences in CML, GSH and TBARS concentrations and in dietary AGEs intake between Groups A and B.
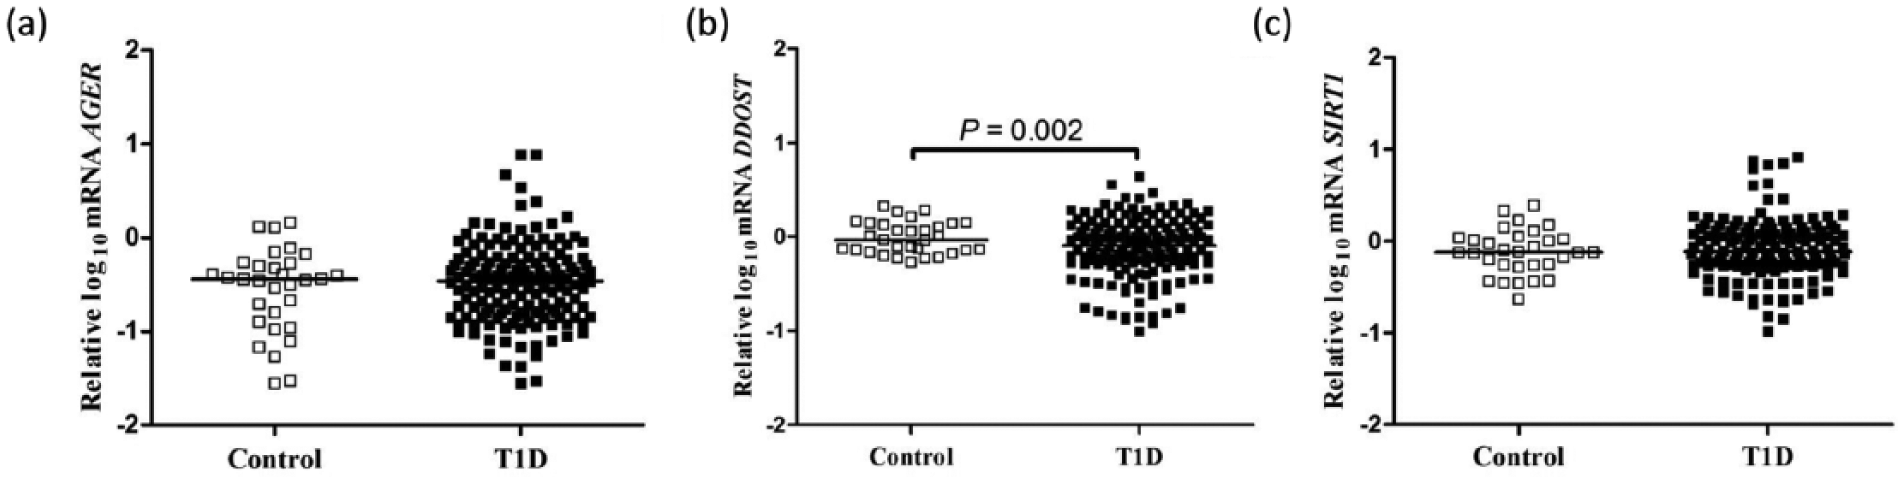
Expressions of (a) AGER, (b) DDOST and (c) SIRT1 mRNA in peripheral blood mononuclear cells from type 1 diabetes (T1D) patients and from healthy control participants. Analyses adjusted by sex, age, angiotensin-converting enzyme inhibitors, angiotensin receptor blockers and statins use. The horizontal lines within scatterplots represent the median value.
Demographic, clinical and biochemical characteristics of type 1 diabetes patients sorted into two groups: Group A, patients with no microvascular complications; Group B, patients presenting at least one microvascular complication (diabetic kidney disease, retinopathy, peripheral neuropathy or cardiovascular autonomic neuropathy).
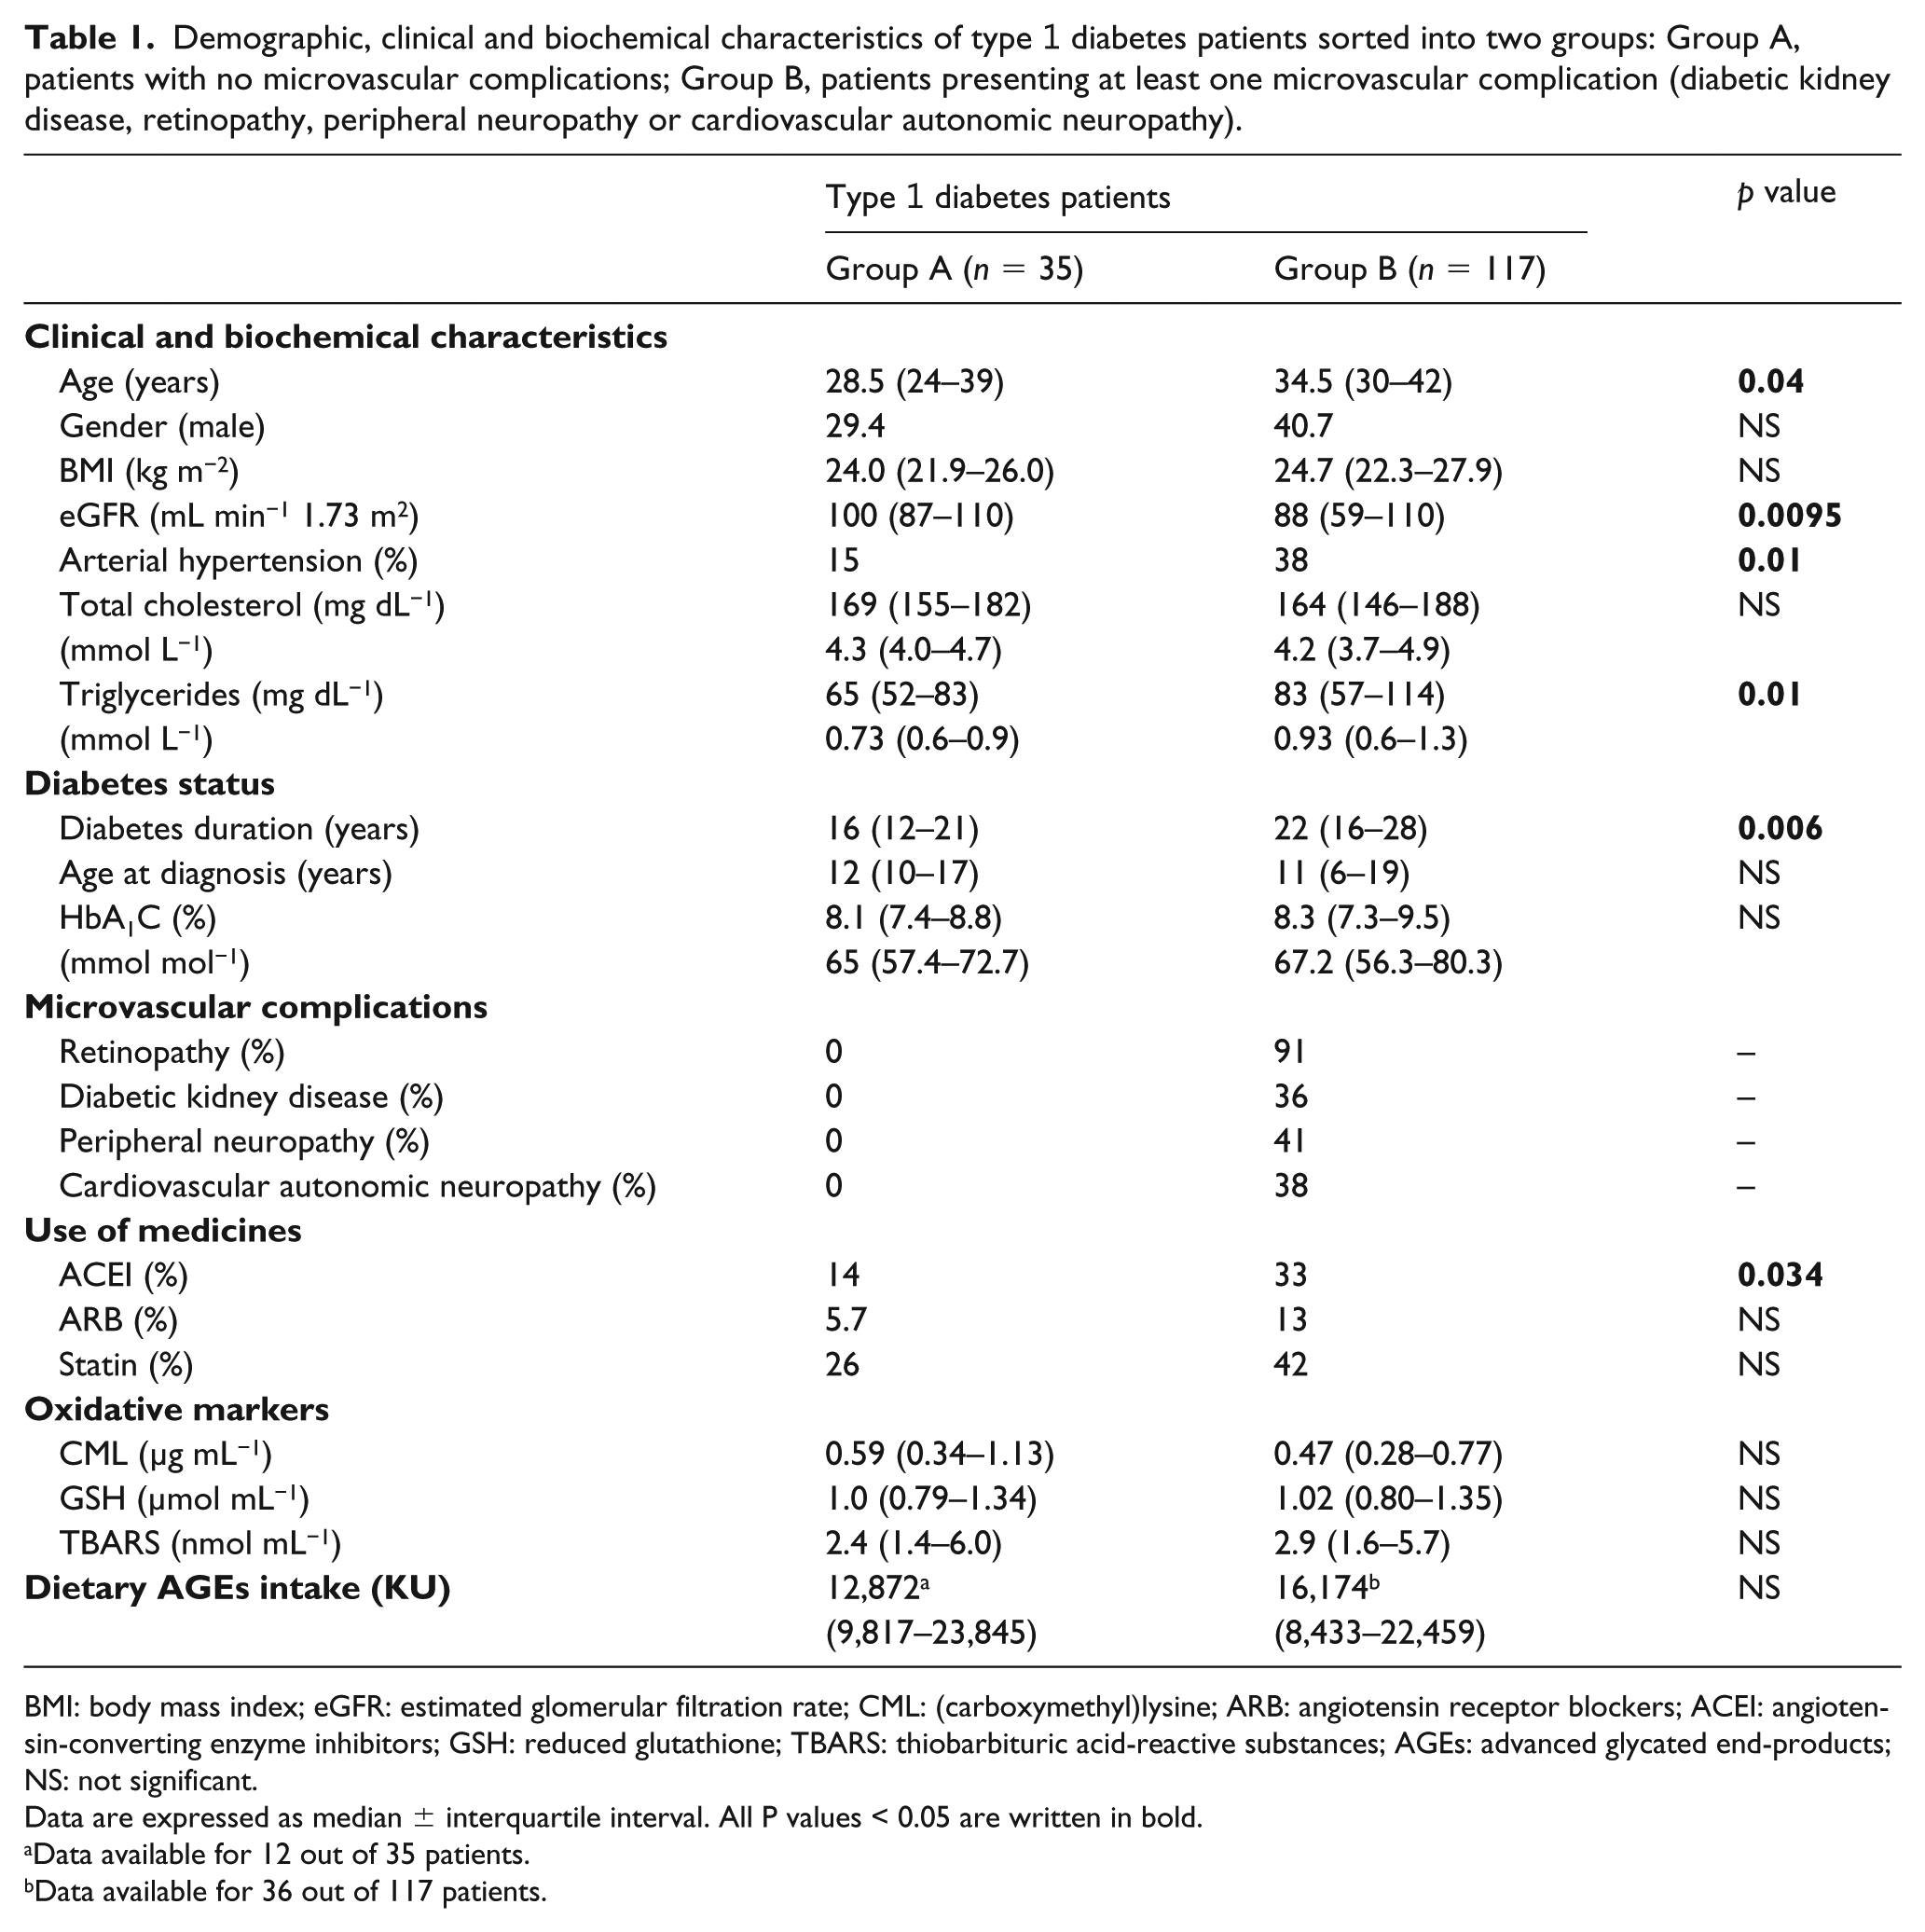
BMI: body mass index; eGFR: estimated glomerular filtration rate; CML: (carboxymethyl)lysine; ARB: angiotensin receptor blockers; ACEI: angiotensin-converting enzyme inhibitors; GSH: reduced glutathione; TBARS: thiobarbituric acid-reactive substances; AGEs: advanced glycated end-products; NS: not significant.
Data are expressed as median ± interquartile interval. All P values < 0.05 are written in bold.
Data available for 12 out of 35 patients.
Data available for 36 out of 117 patients.
When patients from Group A were compared to patients from Group B, higher expressions of AGER (p = 0.03), DDOST (p = 0.03) and SIRT1 (p = 0.002) were observed in Group A (Figure 2, panels a, b and c, respectively). After stratification by sex, it was found that the difference observed in AGER was determined by a higher expression of this gene in male T1D patients (p = 0.013) rather than in females (p = 0.33) (data not shown). We also investigated whether mRNA expressions of these genes would be different between T1D patients using and not using ACEI, ARB and statins. The group of patients using statins presented higher expression of DDOST (but not of AGER and SIRT1) than patients not using this class of drug after adjustment for sex, age, diabetes duration, HbA1c, eGFR, presence of arterial hypertension, triglyceride concentrations and use of ACEI or ARB (p = 0.004; Figure 2, panel d). Increased DDOST expression was also higher in the group of patients using ARB in comparison to patients not using this class of drug after adjustment for the same aforementioned clinical confounders and for the use of ACEI and statins (p = 0.003; Figure 2, panel e).
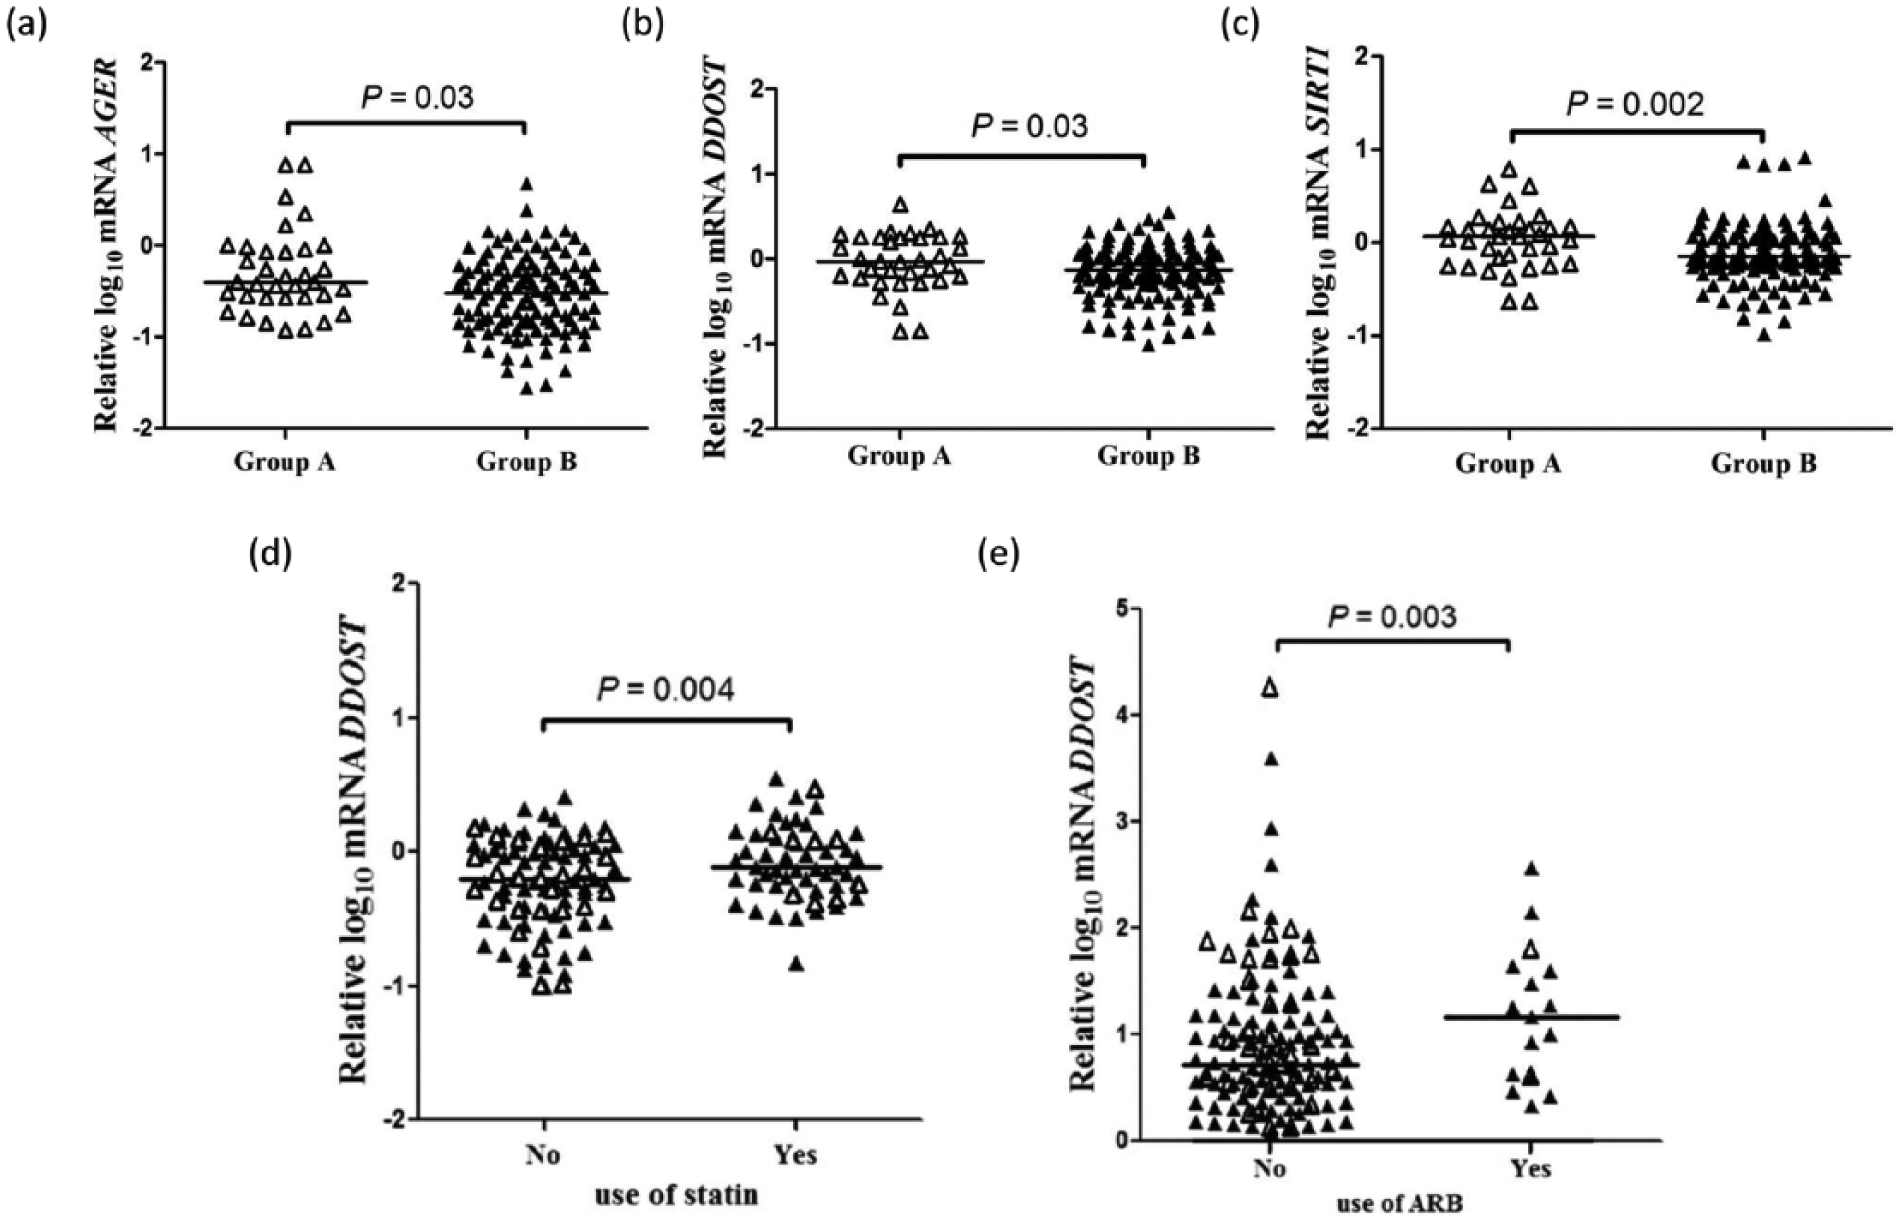
Expressions of (a) AGER, (b) DDOST and (c) SIRT1 mRNA in peripheral blood mononuclear cells from type 1 diabetes (T1D) patients with (Group B) and without (Group A) microvascular complications; analyses adjusted by sex, age, diabetes duration, HbA1c, estimate glomerular filtration rate (eGFR), presence of arterial hypertension, triglyceride concentrations and angiotensin-converting enzyme inhibitors (ACEI), angiotensin receptor blockers (ARB) and statins use. (d) Expression of DDOST in T1D patients according to the use or not of statins; analysis adjusted by sex, age, diabetes duration, HbA1c, eGFR, presence of arterial hypertension, triglyceride concentrations and ACEI and ARB use. (e) Expression of DDOST in T1D patients according to the use or not of ARB; analysis adjusted by the same aforementioned clinical confounders and ACEI and statins use. Open triangles, T1D patients from Group A; closed triangles, T1D patients from Group B. The horizontal lines within scatterplots represent the median value.
When T1D patients were stratified by diabetic complications, AGER expression was higher in those without DR in relation to patients with DR, even after adjustment for sex, age, diabetes duration, HbA1c, eGFR, presence of arterial hypertension, triglyceride concentrations and use of ACEI, ARB and statins (p = 0.029).
Regarding DKD, patients with normoalbuminuria presented higher AGER and DDOST expressions than patients with macroalbuminuria (p = 0.029 and p = 0.004, respectively), but after adjustment for sex, age, diabetes duration, HbA1c, presence of arterial hypertension, presence of DR, triglyceride concentrations and use of ACEI, ARB and statins, only DDOST expression remained significantly different between the two groups (p = 0.02). The stratification by degree of PN, CAN or eGFR did not show differences in the expression of AGER, DDOST or SIRT1 between those with and without the diabetic complication (data not shown).
A positive correlation was observed between mRNA expressions of AGER and SIRT1 (r = 0.49; p < 0.0001) and between mRNA expressions of DDOST and SIRT1 (r = 0.39; p < 0.0001; Figure 3). A weak marginal correlation was detected between mRNA expressions of AGER and DDOST (r = 0.14; p = 0.06; data not shown). A positive correlation was found between GSH and TBARS concentrations (r = 0.67; p < 0.0001; data not shown). AGER mRNA expression did not correlate with TBARS, GSH or CML concentrations (Figure 4, panels a, b and c, respectively) while DDOST mRNA expression presented a weak negative correlation with TBARS (r = −0.19; p = 0.025), but did not correlate with GSH and CML concentrations (Figure 4, panels d, e and f, respectively).
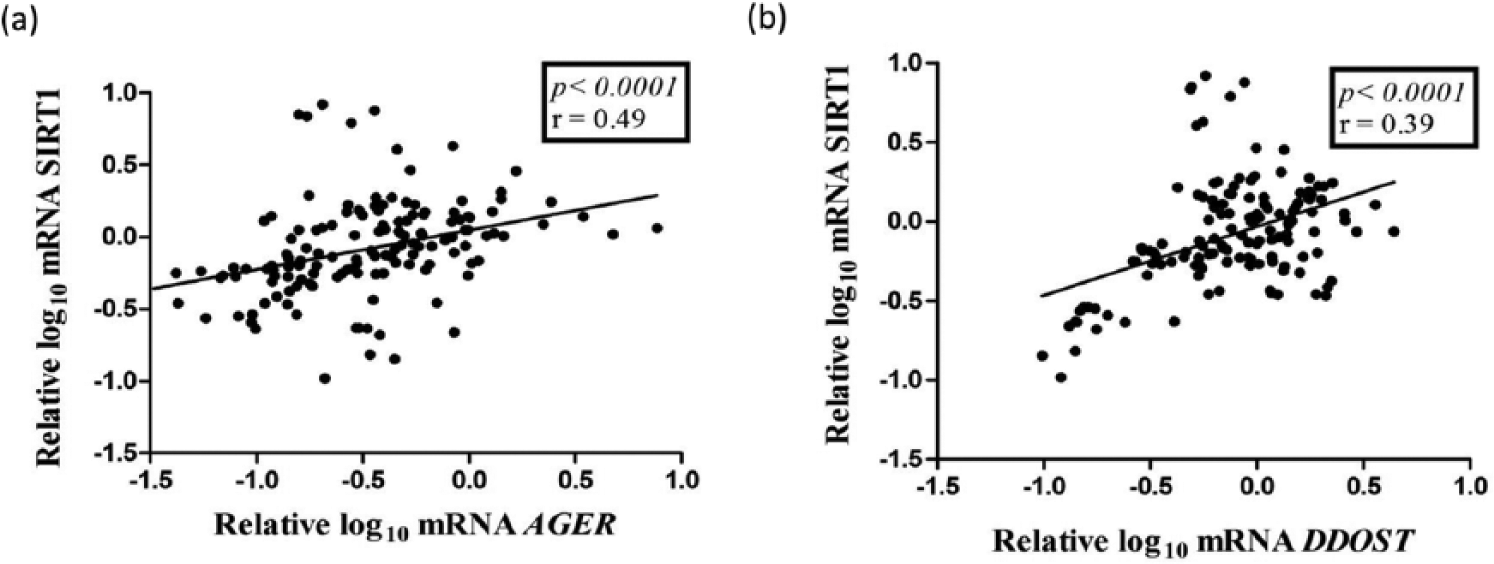
Correlations between (a) AGER and SIRT1 and (b) DDOST and SIRT1 mRNA expressions in peripheral blood mononuclear cells from type 1 diabetes patients.
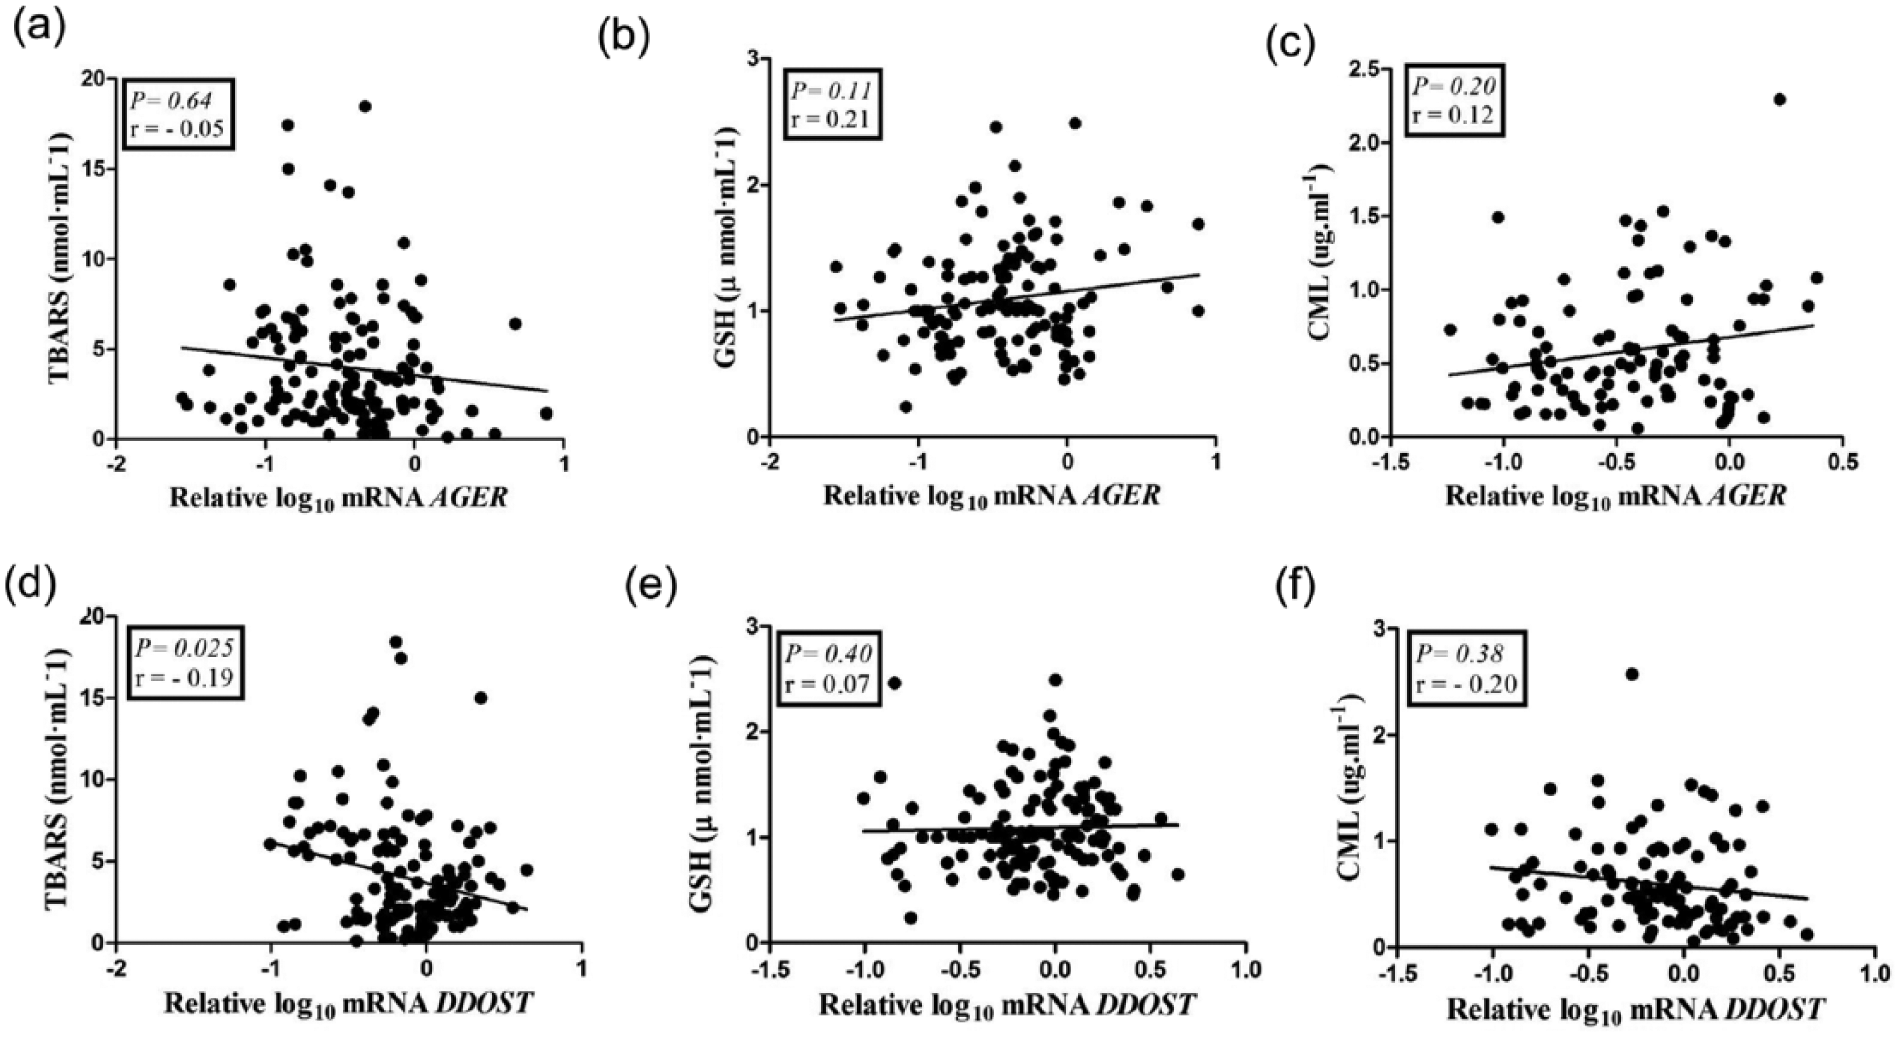
Correlations between mRNA expressions of AGER and DDOST with TBARS (panels a and d, respectively), GSH (panels b and e, respectively) and CML (panels c and f, respectively) in type 1 diabetes patients.
AGEs intake
In the subgroup of 48 T1D patients evaluated by a dietitian [56% women; 34.0 (26.0–39.0) years old; median diabetes duration of 19.0 (14.2–26.7) years; median HbA1c of 8.2%/66.1 mmol mol−1 (7.3–10.2/56.3–88.0); 70% with DR, 23% with DKD, 20% with PN, 29% with CAN], the median daily AGEs intake was 12,872 KU. SIRT1 mRNA expression was significantly higher in patients who consumed more than 12,872 KU daily in comparison to patients who consumed less than that value (p = 0.002; Figure 5, panel a) after adjustment for confounders. Positive correlations were observed between DDOST and SIRT1 mRNA expressions and dietary AGEs intake (r = 0.36; p = 0.0009 and r = 0.36; p = 0.011, respectively; Figure 5, panels b and c, respectively). There was no significant difference in CML concentrations between the two groups (data not shown).
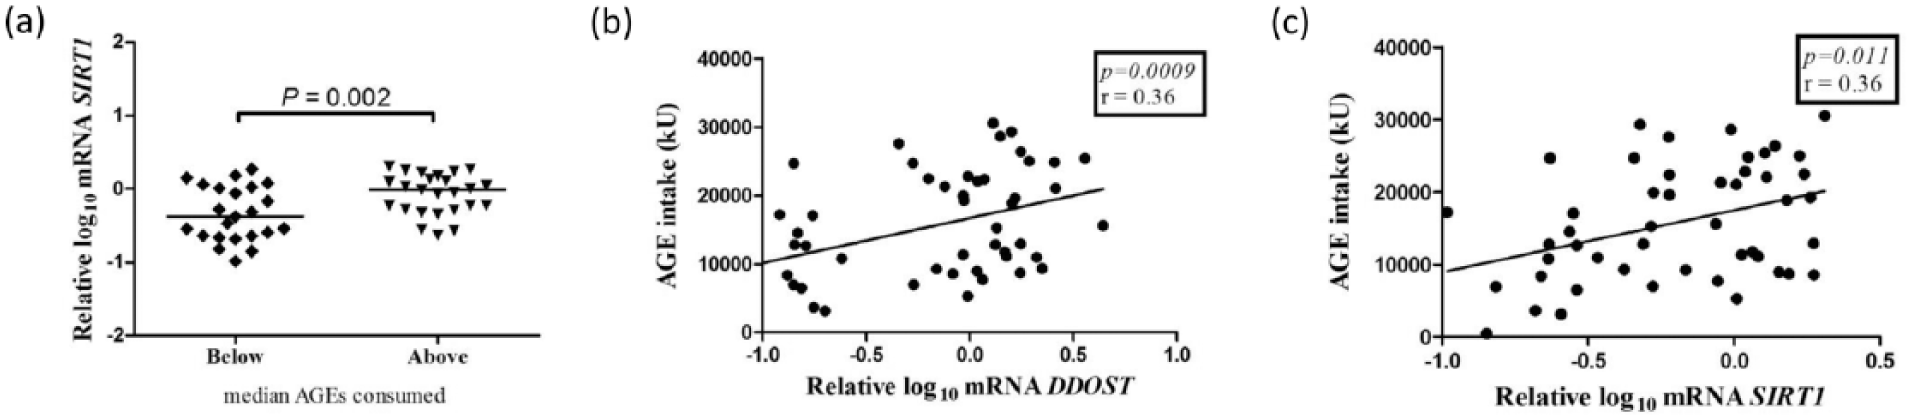
Expressions of (a) SIRT1 mRNA in peripheral blood mononuclear cells from type 1 diabetes (T1D) patients according to the median daily AGEs intake recorded during three consecutive days before blood collection. Analyses adjusted by sex, age, diabetes duration, HbA1c, estimate glomerular filtration rate, presence of arterial hypertension, triglyceride concentrations and angiotensin-converting enzyme inhibitors, angiotensin receptor blocker and statins use. The horizontal lines within scatterplots represent the median value. Correlations between (b) DDOST and (c) SIRT1 mRNA expressions in peripheral blood mononuclear cells and median daily AGEs intake in T1D patients.
Discussion
We evaluated the expression of the genes encoding RAGE, AGER1 and SIRT1 in PBMC from long-term T1D patients (and from healthy controls) to test the hypothesis that an imbalance among the expression of these genes could reflect the presence of microvascular complications.
The only difference observed between T1D patients and healthy controls was a lower expression of DDOST in the former group, a finding already reported by Uribarri et al. 20 in T2D patients. Another resemblance between both studies was the absence of upregulation of AGER in diabetes patients, a finding described in some other studies conducted in T2D patients.21,22 It is interesting to mention that in this study, the lower DDOST expression in T1D patients was detected only after adjustment for sex, age and use of ACEI, ARB and statins. The influence exerted by statins and ARB in DDOST expression was also shown by the higher expression of this gene in those T1D patients receiving statins or ARB versus those not taking these medicines, even after adjustment for potential confounders. These findings show one more pleiotropic effect of both classes of drugs, which already have been reported to reduce AGER expression in endothelial cells.23–25
Considering only T1D patients, the expressions of AGER, DDOST and SIRT1 were higher in patients with no complications in comparison to those with at least one microvascular complication. He et al. 26 have reported, in a smaller series of T1D patients, that patients without DR presented higher mRNA expression of DDOST in PBMC than patients with this complication. Miura et al. 27 have evaluated Japanese T1D patients with different degrees of microvascular complications and found increased AGER mRNA expression in monocytes from patients without DR and without DKD versus patients with these complications. When we stratified patients by diabetic complications, we also found a higher AGER expression in patients without DR and without DKD (although the statistical significance for the latter had been lost after adjustment for potential confounders), as well as a higher expression of DDOST in patients without DKD. These data suggest that the lower AGER and DDOST expressions observed when all T1D patients with complications were grouped are actually reflecting the presence of DR and of DKD, respectively. Intriguingly, SIRT1 mRNA expression did not differ between patients with and without each one of the complications, only when all diabetic complications were considered together. At this moment, we do not have a clear explanation for the differences of AGER and DDOST expressions depending on the microvascular complications.
One interesting finding from this study was the higher expression of SIRT1 in the group of T1D patients with the higher dietary AGEs intake, which suggests that even presenting chronically elevated glycaemia, patients with long-term T1D still seem to maintain some ability of activating defence mechanisms when exposed to dietary glycoxidation products. The positive correlations between AGEs intake and DDOST and SIRT1 expressions reinforce this hypothesis, although these results are unexpected, in view of previous studies showing that restriction of dietary AGEs increases expression of both genes in PBMC from T2D patients 20 and from obese individuals with metabolic syndrome. 28 However, in healthy individuals, restriction of dietary AGEs was associated with reduction in DDOST mRNA expression in PBMC,29,30 suggesting that the expression of this gene in these peripheral cells might be differently affected by restriction of AGEs, depending on the basal metabolic status. It is possible that the positive correlations between AGEs intake and DDOST and SIRT1 expressions reflect the unique milieu of suboptimally controlled T1D patients, who differ from T2D patients in several aspects, such as the degree of insulin resistance and of subclinical inflammation.
In this cross-sectional study, the use of a 3-day food record allowed an estimation of the amount of CML in the regular patient’s diet without the precise quantification of this AGE. Thus, we cannot compare our findings with the ones reported in the aforementioned longitudinal intervention studies that employed standardized diets containing high or low AGEs contents. This might have contributed to the lack of association between higher AGEs intake and increased CML plasma levels.
Our data suggest that the expressions of AGER and DDOST in PBMC do not reflect tissue damage induced by the AGE/RAGE axis. Additionally, we propose that the divergent results regarding the expression of AGER and DDOST in different diabetes populations reflect the balance of several factors that modulate these genes, be them metabolic, dietetic or pharmacological. Besides the influence of statins and ARB showed in this study, ACEI has been described to affect AGER expression in monocyte-derived macrophage, 31 although in this study, we had not found differences in the expression of this gene when we compared patients taking or not ACEI (data not shown). The use (or not) of exogenous insulin could be another interfering factor; Lam et al. 32 have demonstrated, in vitro, that insulin increases AGER mRNA expression in THP-1 monocytic cells. Medicines and distinct metabolic states may also account for the absence of correlation between AGER mRNA expression and CML levels.
AGER and DDOST mRNA expressions presented a moderate correlation with SIRT1 expression, but a weak correlation with each other, which decreases the possibility of a mutual modulation between these genes in PBMC from T1D patients. The correlation between DDOST and SIRT1 became stronger when patients taking statins and ARB were excluded from the analyses (r = 0.54 vs r = 0.39, for both p < 0.0001). These results suggest that the interrelationship between these genes is complex and subjected to the influence of several factors.
TBARS and GSH concentrations did not differ between patients with versus without complications, indicating that these oxidative stress markers easily measured in the body fluids do not represent the extent of the tissue oxidative insult induced by hyperglycaemia and its by-products. However, TBARS concentrations presented a weak negative correlation with DDOST mRNA expression, suggesting that they slightly reflect the unfavourable environment associated with suboptimal metabolic control.
The lack of association between plasmatic CML concentrations and microvascular complications is in agreement with previous studies33,34 and probably indicates the participation of other AGEs, besides CML, in the development of chronic complications. The measurement of plasmatic and dietary CML as the only AGE compound and the absence of quantification of soluble and endogenous secretory RAGEs, which are important players in AGE detoxification, are limitations of this study.
Conclusion
The present findings must be interpreted in the context of limitations of cross-sectional studies, but they demonstrate that the expressions of AGER and DDOST in PBMC do not mirror tissue damage induced by the AGE/RAGE axis. Additionally, DDOST and SIRT1 expressions are importantly influenced by medications and by dietary AGEs, respectively, which must be taken into consideration in future studies evaluating the expression of these genes in PBMC.
Footnotes
Declaration of conflicting interests
The author(s) disclosed receipt of the following financial support for the research, authorship, and/or publication of this article: The author(s) declared no potential conflicts of interest with respect to the research, authorship and/or publication of this article.
Funding
This work was supported by grants from Fundação de Amparo à Pesquisa do Estado de Sao Paulo (FAPESP) to D.P.S.-B. (12/25490-8) and to M.P., U.F.M. and M.L.C.-G. (12/04831-1 and 16/15603-0). U.F.M. and M.L.C.-G. are recipients of Conselho Nacional de Desenvolvimento Científico e Tecnológico (CNPq) fellowships.