
Abstract
Objective:
Maximum home systolic blood pressure has been shown to predict target organ damage. We aimed to clarify the association between maximum home systolic blood pressure and urine albumin to creatinine ratio, an indicator of early-phase diabetic nephropathy in patients with type 2 diabetes.
Methods:
In 1040 patients, we assessed the relationship of mean or maximum home systolic blood pressure and urine albumin to creatinine ratio, and compared the area under the receiver operating characteristic curve of mean or maximum home systolic blood pressure for diabetic nephropathy (urine albumin to creatinine ratio ⩾30 mg/g Cr).
Results:
Multivariate linear regression analyses indicated that mean morning systolic blood pressure (β = 0.010, p < 0.001) and maximum morning systolic blood pressure (β = 0.008, p < 0.001) were significantly associated with urine albumin to creatinine ratio. Area under the receiver operating characteristic curve (95% confidence interval) for diabetic nephropathy in mean and maximum morning systolic blood pressure was 0.667 (0.634–0.700; p < 0.001) and 0.671 (0.638–0.703; p < 0.001), respectively.
Conclusion:
Maximum home systolic blood pressure, as well as mean home systolic blood pressure, was significantly associated with diabetic nephropathy in patients with type 2 diabetes.
Keywords
Introduction
Diabetes and hypertension are significantly related to nephropathy development and progression. 1 Albuminuria which is a primary indicator of early-phase diabetic nephropathy is considered to be a leading cause of end-stage renal disease.2,3 Moreover, elevated urinary albumin excretion is associated with increased risk of cardiovascular disease and mortality.4,5 Thus, the hope is that early intervention will lead to the prevention of new development of nephropathy, and the regression of existing nephropathy. 6 The development and progression of nephropathy were improved by glycaemic and blood pressure (BP) controls.7,8
It has been established that home systolic BP (HSBP) better predicts target organ damage and has a stronger predictive power for mortality than clinic systolic blood pressure (SBP).9–11 HSBP has also been reported to more accurately reflect target organ damage than clinic SBP in patients with diabetes. 12 We also reported that uncontrolled HSBP, which was defined as mean morning HSBP ⩾125 mmHg, was significantly associated with nephropathy in patients with type 2 diabetes. 13
Recently, several studies reported not only mean HSBP but also variability of HSBP, pulse pressure and heart rate as indicators of HSBP–albuminuria correlation.13–15 In addition, a recent study reported that maximum (max) HSBP was better correlated with hypertensive target organ damage than mean HSBP in untreated hypertensive patients. 16 We also reported the association between max HSBP and arterial stiffness in patients with type 2 diabetes. 17 Max HSBP can be clear at first glance, though it is complicated to accurately calculate mean HSBP from multiple HSBP self-measurement values on logbook for physicians in clinical practice.
However, there have been no studies of the association between max HSBP and diabetic nephropathy in patients with type 2 diabetes. We aimed to assess the association between max HSBP and urine albumin to creatinine ratio (UACR), which is an indicator of early-phase diabetic nephropathy and is also associated with the progression of organ damage, and compare max HSBP with mean HSBP in their correlations to diabetic nephropathy in patients with type 2 diabetes.
Methods
Study design
We designed post hoc analysis of a cross-sectional multicenter study which was based on data from HBP cohort of patients with type 2 diabetes mellitus. The study was performed between March 2008 and October 2012 at the Hospital of Kyoto Prefectural University of Medicine or one of the other four general hospitals, all of which are located in the Kansai area in Japan (KAMOGAWA-HBP study). This study was approved by the local Research Ethics Committee and was conducted in accordance with the Declaration of Helsinki, and informed consent was obtained from all patients.
Patients
We recruited 1292 patients with type 2 diabetes who had regularly attended the diabetes outpatient clinic at five facilities, as previously reported. 13 Home blood pressure (HBP) measurements were performed among all patients in this study; however, there was no BP level criterion for study inclusion. The diagnosis of type 2 diabetes mellitus was based on the American Diabetes Association criteria. 18
BP measurement
HBP measurements were performed with the HEM-7080IC automated device (Omron Healthcare Co. Ltd, Kyoto, Japan), which uses the cuff-oscillometric method to generate a digital display of heart rate and systolic/diastolic BP value for all patients. HEM-7080IC employs the components and BP-determining algorithm identical to those of another device, HEM-705IT, which was previously validated and shown to satisfy the criteria of the British Hypertension Society protocol. 19 Patients underwent triplicate morning and evening BP measurements for 14 consecutive days. The mean of three measurements in the morning or evening for 14 consecutive days for each patient was taken as the mean HBP, and max HBP was defined as the highest per-patient readings among 3 × 14 measurements. We computed day-by-day variability of HSBP as within-patient coefficient of variation (CV) of measurements. CV was determined as within-patient standard deviation (SD) divided by within-patient mean. The first morning BP measurements were made within 1 h of awakening, before breakfast or taking any drugs, with the patient seated and rested for at least 5 min. 20 The evening BP measurements were performed in the same way just before going to bed. The cuff was directly placed around the patient’s non-dominant arm with the cuff position at the level of the heart. Clinic BP was taken as the mean of three readings by HEM-7080IC at the same time as it was available.
Data collection
Information including sex, age, duration of diabetes, smoking and alcohol consumption status, hypoglycaemic treatment and antihypertensive medication were obtained at the time of the BP measurement.
Blood samples were taken at the hospital in the morning. Serum lipid profile (low-density lipoprotein cholesterol, triglycerides and high-density lipoprotein cholesterol) and other biochemical data were assessed using standard enzymatic methods. HbA1c was assayed using high-performance liquid chromatography in accordance with the National Glycohemoglobin Standardization Program.
Urinary albumin excretion was measured with an immunoturbidimetric assay. A mean value for urinary albumin excretion was determined from three urine collections.
Nephropathy was graded as follows: normoalbuminuria, UACR < 30 mg/g of creatinine (mg/g Cr); microalbuminuria, 30–300 mg/g Cr; or macroalbuminuria, >300 mg/g Cr. Retinopathy was assessed by chart review and was graded as follows: no diabetic retinopathy (NDR), simple diabetic retinopathy (SDR) and proliferative diabetic retinopathy (PDR). Neuropathy was defined by the diagnostic criteria for diabetic neuropathy proposed by the Diagnostic Neuropathy Study Group. 21 Macrovascular complication was defined as the presence of previous cardiovascular disease, cerebrovascular disease or arteriosclerosis obliterans, which is caused by arterial atherosclerotic stenosis and obliteration in the lower limbs, based on the clinical history or physical examination.
Statistical analysis
Values were expressed as mean ± SD for continuous variables and as a number for categorical variables. Because UACR showed a skewed distribution, logarithmic transformation was carried out before performing statistical analysis. The univariate correlations between mean HBP or max HBP and logarithm of UACR were assessed using Pearson’s correlations. Differences between values of correlation coefficients were compared with Fisher’s z-transformation tests. Multivariate linear regression analyses were used to evaluate independent determinants of the UACR logarithm. To adjust the effects of various factors on elevated albuminuria, the following factors, which were known risk factors for nephropathy, were considered as covariates: age, sex, duration of diabetes mellitus, body mass index, mean clinic SBP, HbA1c, total cholesterol, creatinine, smoking status, alcohol consumption status, use of renin angiotensin system inhibitors, use of calcium channel blockers and use of diuretics.
In addition, we compared the area under the receiver operating characteristic (ROC) curve (AUC) of mean HSBP or max HSBP for diabetic nephropathy as UACR ⩾30 mg/g Cr. AUCs of the two ROC curves were compared using the nonparametric comparison of the areas under correlated ROC curves. 22
Moreover, we have performed the subgroup analyses. Subgroup factors were use of antihypertensive drugs (the presence and the absence of antihypertensive medication) and age (equal to or more than 65 years and less than 65 years).
Two-tailed values of p < 0.05 indicated statistical significance. All statistical analyses were performed using JMP version 10 (SAS institute).
Results
Of the 1292 patients, we excluded patients who measured HBP for fewer than 7 days, either in the morning or evening, or both (n = 168), who had advanced renal dysfunction (serum creatinine ⩾ 2.0 mg/dL) and who were undergoing haemodialysis (n = 11). Moreover, we excluded patients whose UACR data were unavailable (n = 73). Finally, 1040 patients comprised the study population (562 males and 478 females).
The clinical characteristics of patients with type 2 diabetes are presented in Table 1. Mean age and HbA1c were 65.8 ± 9.6 years and 7.2% ± 1.0%, respectively. Among them, 585 patients (56.2%) were treated with antihypertensive drugs. The average number of morning and evening BP measurements per patient for 14 consecutive days was 39.2 ± 1.4 and 35.4 ± 1.9, respectively.
Clinical characteristics of patients.
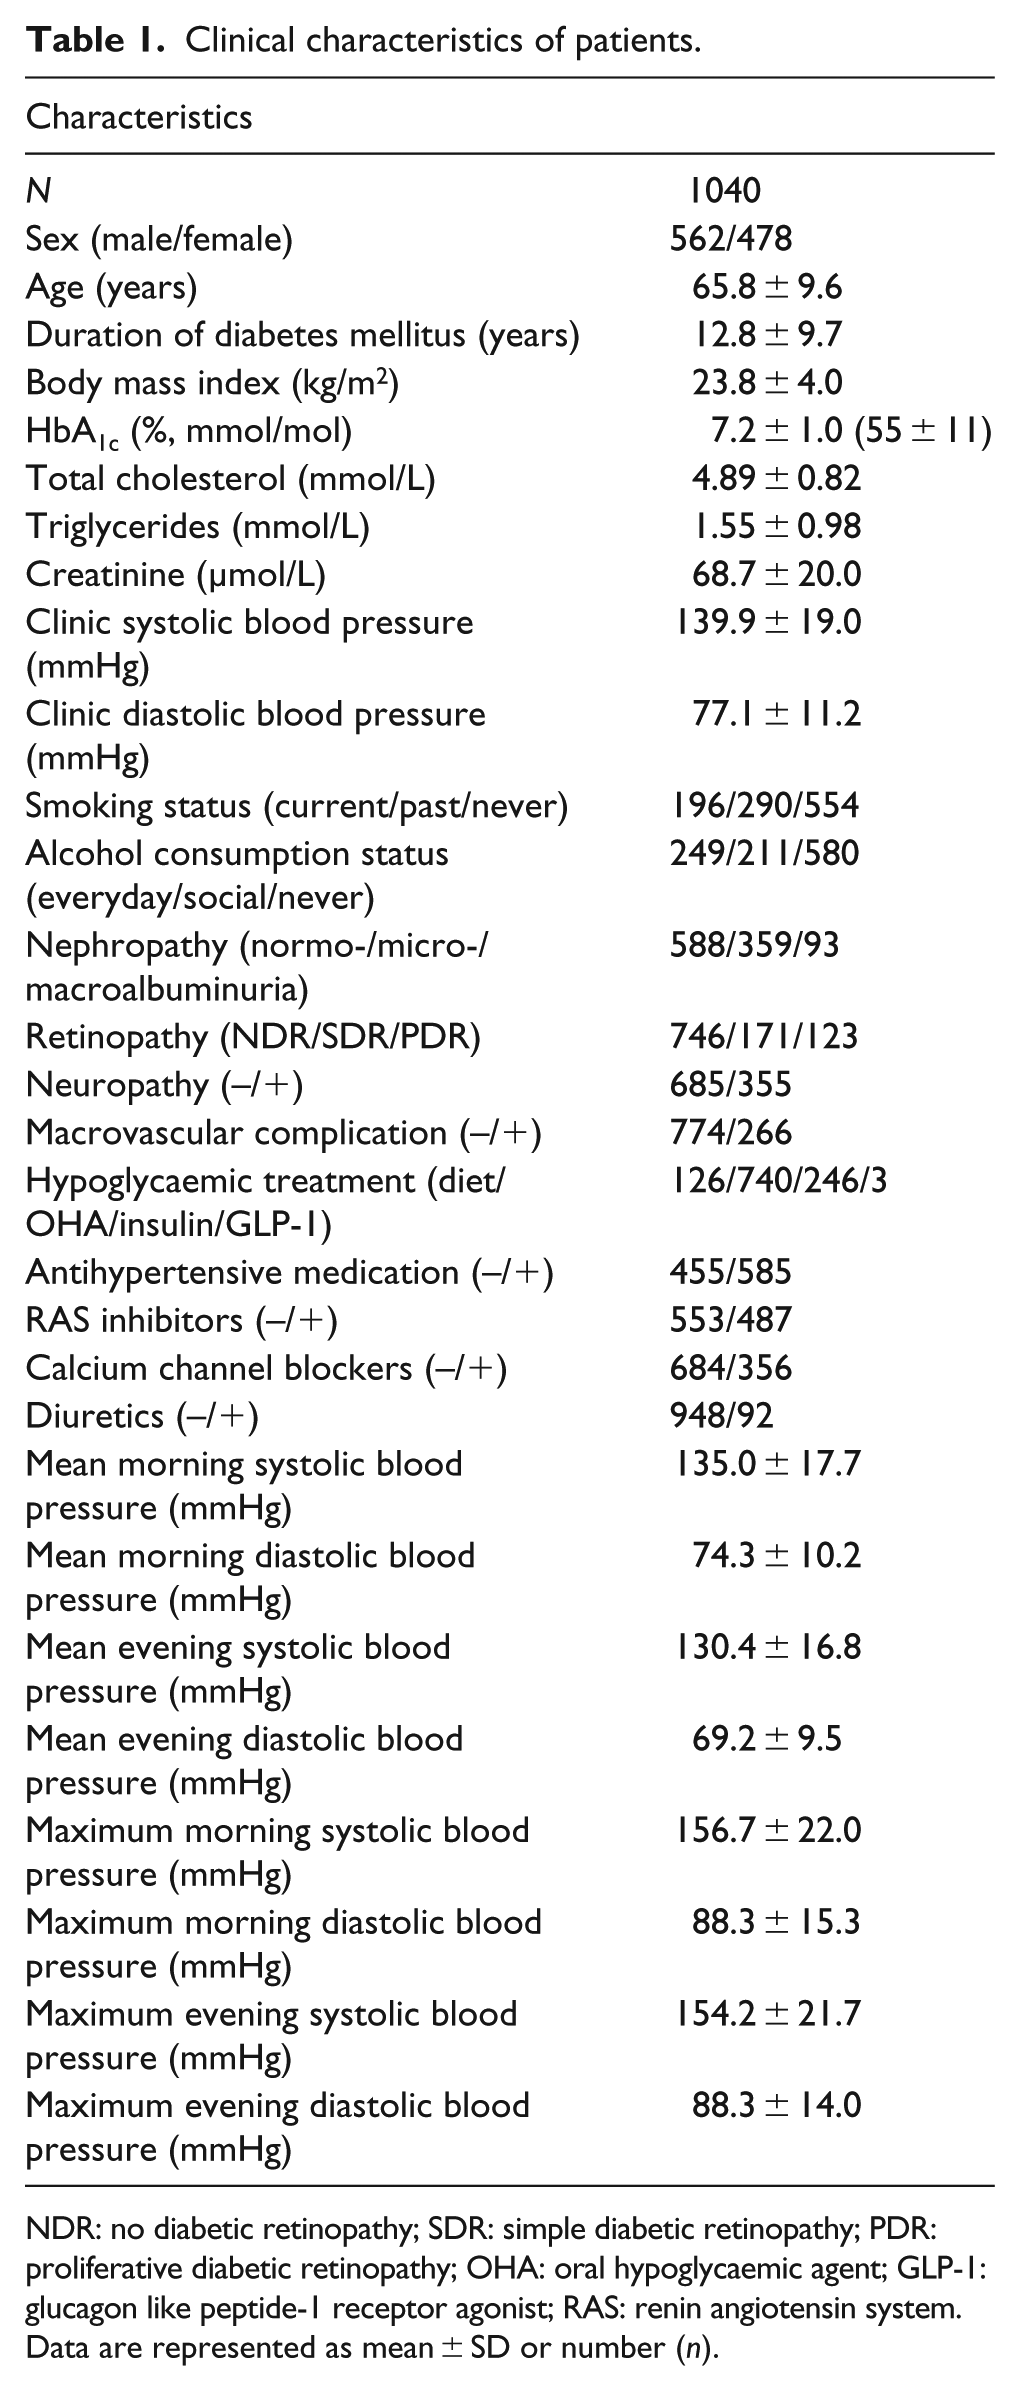
NDR: no diabetic retinopathy; SDR: simple diabetic retinopathy; PDR: proliferative diabetic retinopathy; OHA: oral hypoglycaemic agent; GLP-1: glucagon like peptide-1 receptor agonist; RAS: renin angiotensin system.
Data are represented as mean ± SD or number (n).
In univariate analyses, all BP measurements except mean evening diastolic blood pressure (DBP) were associated with logarithm of UACR (Table 2). Next, we compared the correlation coefficients between mean and max HSBP with Fisher’s z-transformation tests; the correlation coefficients were not significantly different between mean morning SBP and max morning SBP (β = 0.013 vs β = 0.010) and between mean evening SBP and max evening SBP (β = 0.012 vs β = 0.006). Multivariate linear regression analyses also indicated that all BP measurements except mean evening DBP were significantly associated with logarithm of UACR. AUCs [95% confidence interval (CI)] of the two ROC curves for mean SBP and max SBP in the morning and those in the evening – associated with diabetic nephropathy (UACR ⩾ 30 mg/g Cr) – are presented in Figure 1. AUCs (95% CI) for diabetic nephropathy in mean morning SBP and max morning SBP were 0.667 (0.634–0.700; p < 0.001) and 0.671 (0.638–0.703; p < 0.001), respectively. There were no differences between AUC for diabetic nephropathy in mean morning SBP and max morning SBP. AUCs (95% CI) for diabetic nephropathy in mean evening SBP and max evening SBP were 0.655 (0.622–0.689; p < 0.001) and 0.654 (0.621–0.688; p < 0.001), respectively. There were no differences between AUCs for diabetic nephropathy in mean evening SBP and max evening SBP.
Unadjusted and adjusted regression analyses on logarithm of urine albumin to creatinine ratio.
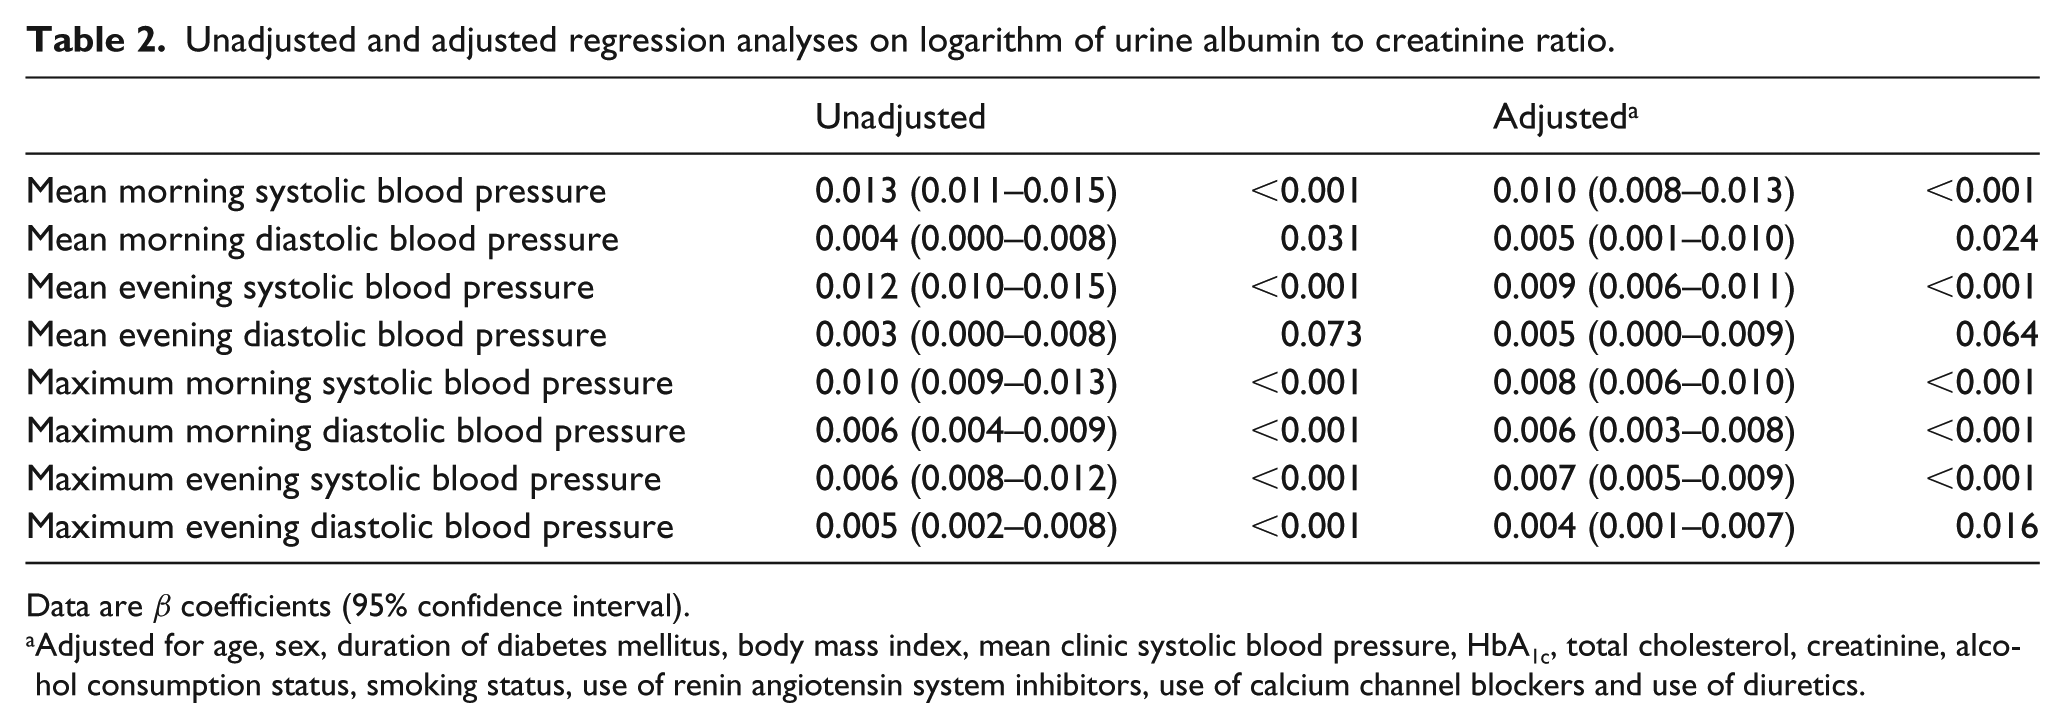
Data are β coefficients (95% confidence interval).
Adjusted for age, sex, duration of diabetes mellitus, body mass index, mean clinic systolic blood pressure, HbA1c, total cholesterol, creatinine, alcohol consumption status, smoking status, use of renin angiotensin system inhibitors, use of calcium channel blockers and use of diuretics.
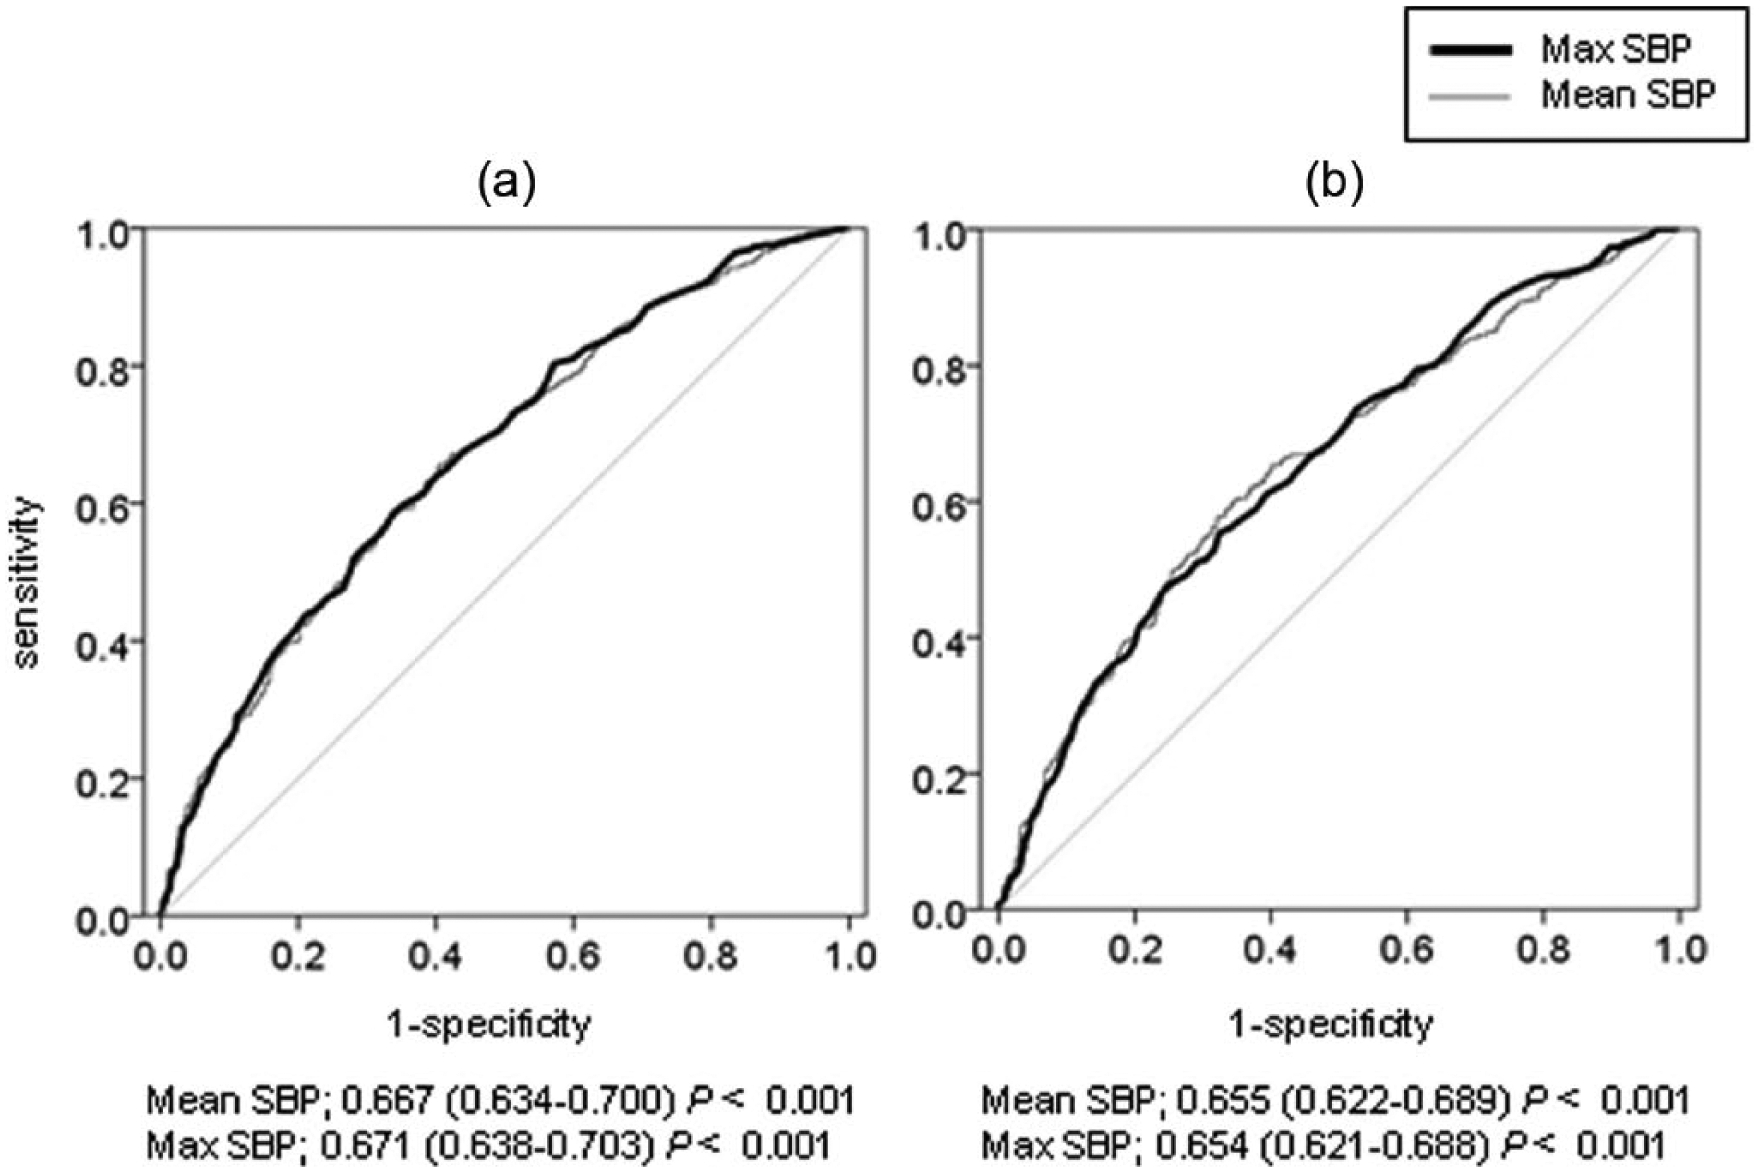
Area under the receiver operating characteristic curve (AUC; 95% CI) of maximum systolic blood pressure (max SBP) and mean SBP for diabetic nephropathy defined as urine albumin to creatinine ratio equal to or more than 30 mg/g Cr: (a) AUC of morning max SBP and mean SBP for diabetic nephropathy and (b) AUC of evening max SBP and mean SBP for diabetic nephropathy.
We show the daily distribution when max morning SBP or max evening SBP was observed during 14 days in Figure 2. Max morning SBP or max evening SBP was found to be highest on the first day (16.3%, n = 170 or 12.3%, n = 128, respectively). Then, we have performed the analyses wherein the first day’s measurements were excluded. The results were that multivariate linear regression analyses indicated that max morning SBP (β = 0.008, p < 0.001) and max evening SBP (β = 0.007, p < 0.001) were significantly associated with logarithm of UACR, and AUCs (95% CI) for diabetic nephropathy in mean morning SBP and max morning SBP were 0.671 (0.637–0.703, p < 0.001) and 0.653 (0.619–0.685, p < 0.001), respectively.
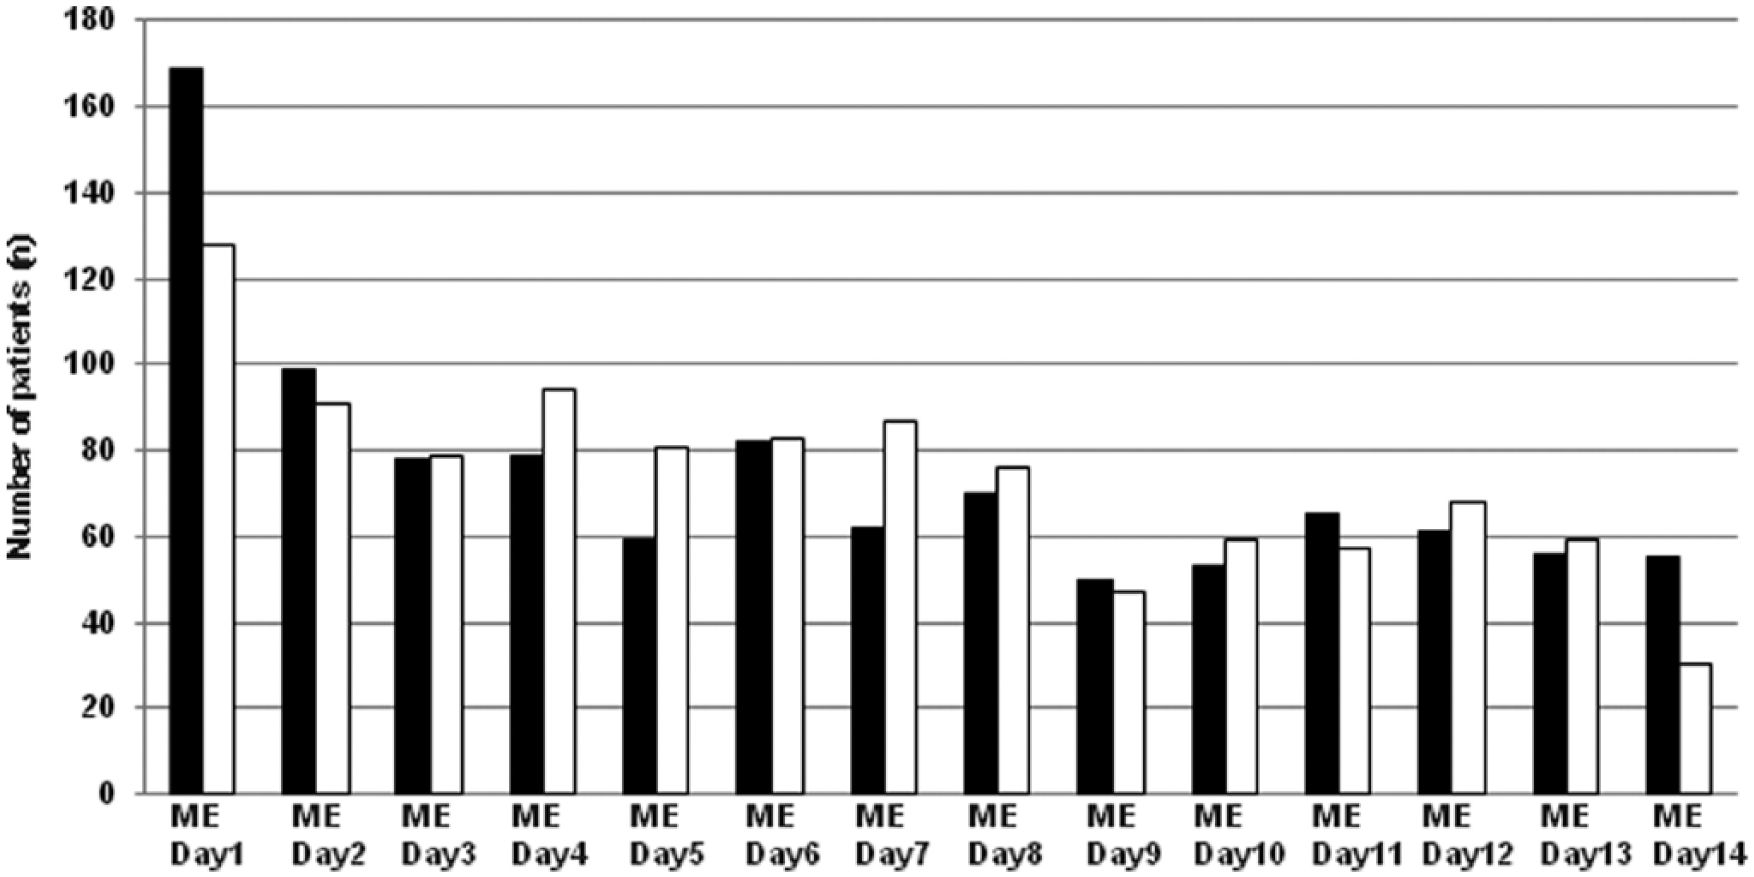
Distribution of the days when max morning systolic blood pressure or max evening systolic blood pressure was observed over a 14-day period.
Moreover, we have assessed the relationship between CV of HSBP, which is used as an indicator for daily HSBP variability, and logarithm of UACR. There was a significant association between them (CV of morning SBP; β = 2.361, p < 0.001, CV of evening SBP; β = 1.640, p = 0.036).
To examine whether there was graded effect of max HSBP on UACR, we have examined graded effect of max HSBP on UACR. To show comprehensive interpretation, we have estimated the graded effect on UACR using binarized max HSBP levels by the Youden Index cut-off point (158 mmHg). Multivariate linear regression analyses indicated that max HSBP was significantly associated with UACR (p < 0.001).
We have performed the subgroup analyses according to the presence or the absence of antihypertensive medication. Multivariate linear regression analyses indicated that max morning SBP (β = 0.006, p < 0.001) and max evening SBP (β = 0.005, p = 0.002) were significantly associated with UACR in patients without antihypertensive medication, and max morning SBP (β = 0.009, p < 0.001) and max evening SBP (β = 0.008, p < 0.001) were also associated with UACR in those with antihypertensive medication. AUCs for diabetic nephropathy in max morning SBP and max evening SBP were 0.681 (0.627–0.731; p < 0.001) and 0.658 (0.603–0.709; p < 0.001), respectively, in patients without antihypertensive medication. AUCs for nephropathy in max morning SBP and max evening SBP were 0.645 (0.600–0.688; p < 0.001) and 0.633 (0.588–0.677; p < 0.001), respectively, in those with antihypertensive medication. We have also performed the subgroup analyses according to the presence or the absence of RAS inhibitors. Multivariate linear regression analyses indicated that max morning SBP (β = 0.006, p < 0.001) and max evening SBP (β = 0.005, p < 0.001) were significantly associated with UACR in patients without RAS inhibitors, and max morning SBP (β = 0.009, p < 0.001) and max evening SBP (β = 0.008, p < 0.001) were also associated with UACR in those with RAS inhibitors.
In addition, we have also performed age-specific analyses. Multivariate linear regression analyses indicated that max morning SBP (β = 0.008, p < 0.001) and max evening SBP (β = 0.005, p = 0.003) were significantly associated with UACR in patients less than 65 years of age, and that max morning SBP (β = 0.008, p < 0.001) and max evening SBP (β = 0.007, p < 0.001) were significantly associated with UACR in those equal to or more than 65 years of age. AUCs (95% CI) for nephropathy in max morning SBP and max evening SBP were 0.666 (0.611–0.716; p < 0.001) and 0.653 (0.589–0.717; p < 0.001), respectively, in patients less than 65 years of age. AUCs (95% CI) for nephropathy in max morning SBP and max evening SBP were 0.658 (0.613–0.699; p = 0.003) and 0.631 (0.586–0.674; p < 0.001), respectively, in those equal to or more than 65 years of age.
Discussion
To our knowledge, this is the first reported study that has assessed the association between max HSBP and diabetic nephropathy, and compared max HSBP with mean HSBP in correlation with diabetic nephropathy in patients with type 2 diabetes. The important findings in this study were that max HSBP and mean HSBP were significantly associated with logarithm UACR, an indicator of diabetic nephropathy, and that AUC for diabetic nephropathy in max HSBP was similar to that in mean HSBP, which is an established index for BP control. This finding is different from the previous report 16 in which the max HSBP was independently associated with the left ventricular mass index and carotid intima-media thickness, whereas there was a relatively weak association between max HSBP and albuminuria in 356 never-treated hypertensive subjects. They suggested that the kidney might not be affected by transient BP increases, as far as autoregulatory mechanisms are normally functioning. The difference in the study population (diabetes vs never-treated hypertensive subjects) may have influenced the variation in results between the two studies.
In this study, max HSBP was most frequent on the first day after starting BP measurement. One factor could be that more than one-third of patients started taking HBP measurements for this study. In several studies, it has been reported that HSBP of the first day showed higher HBP values, which were more unstable and had lower prognostic ability.23–25 The Didima study provided a statistical and clinical validation of the home BP monitoring schedule recommended by the European and American guidelines; it concluded that average HBP and its variability were reduced and that prognostic ability improved by averaging readings, suggesting that the first day’s data should be discarded. Therefore, we also conducted the similar analysis where the first day’s measurements were excluded, and the results were not changed.
Both max SBP and SBP variability are strong predictors of vascular events independent of mean SBP, 26 and these two indicators also have similar clinical implications.26,27 Then, we assessed the relationship between CV of HSBP and logarithm of UACR, and the same results were obtained.
In this study, 585 patients using antihypertensive medication were included. Thus, we have performed the subgroup analyses according to the presence or the absence of antihypertensive medication because BP levels absolutely depend on antihypertensive medication. Results of this subgroup analyses showed that max morning and evening HSBP were significantly associated with UACR regardless of the presence or absence of antihypertensive medication. Of the patients treated with antihypertensive drugs, 487 patients (83%) were treated with RAS inhibitors. We have performed the subgroup analyses according to the presence or the absence of RAS inhibitors, and the results did not change. We have also performed age-specific analyses because BP level was affected by age, and the results were also unchanged.
The strengths of this study include that we employed a device equipped with memory storage for readings rather than trusting patients’ logbooks, which have poor adherence, and that HBP measurements were performed over a relatively long consecutive period. 28
There are some limitations in this study. First, our cross-sectional data do not prove the precise demonstration of the proper cause–effect relationships between max HSBP and logarithm of UACR. In the future, large prospective studies and intervention trials are needed to fully understand the association between max HSBP and logarithm of UACR, the prognostic values of max HSBP, and the cut-off value for max HSBP in patients with type 2 diabetes. Second, the generalizability of our study to non-Japanese populations is uncertain. Third, this study is a post hoc analysis of a cross-sectional multicenter study, and it originally excluded the winter period. Therefore, we might inadvertently omit the arbitrary potential major factor of HBP and limit any clinical implication of the study. It might be preferable to also include a winter period of study and investigate the influence of the season using the regression model, especially in this diabetic cohort. Finally, although it was reported that morning BP levels were associated with alcohol intake, 29 we only have data for alcohol consumption status and do not have data for the amount of alcohol consumption.
In conclusion, our main finding is that max HSBP and mean HSBP were significantly correlated with diabetic nephropathy in patients with type 2 diabetes. This gave us the new knowledge leading to the importance of max HSBP, which we can obtain at first sight from HBP logbook through routine clinical practice. Max HSBP should not be disregarded as noise but be taken seriously as an important indicator for diabetic nephropathy in patients with type 2 diabetes, though major clinical guidelines recommend HBP monitoring with treatment decisions based on mean BP. 30 Further research is needed to develop understanding of the causes, consequences and treatment of max HSBP for diabetic nephropathy.
Footnotes
Acknowledgements
The authors thank Atsushi Omoto and Wataru Fukuda in Kyoto First Red Cross Hospital, Yoshihiro Kitagawa in Osaka General Hospital of West Japan Railway Company and Yohei Oda in Yasaka Hpspital for their assistance of collecting data. They also thank Naoko Higo, Machiko Hasegawa and Terumi Kaneko for teaching patients how to measure their blood pressure; Sayoko Horibe and Hiroko Kawamura for their secretarial assistance; and Akane Miki for her enormous help with data handling. Each of these individuals is affiliated with Kyoto Prefectural University of Medicine.
Declaration of conflicting interests
C.O., E.U., S.M., M.T., M.Y. and M.F. have received grant and research support from AstraZeneca plc, Astellas Pharma Inc., Bristol-Myers Squibb K.K., Daiichi Sankyo Co., Ltd, Eli Lilly Japan K.K., Kyowa Hakko Kirin Company Ltd, Kowa Pharmaceutical Co., Ltd, Kissei Pharmaceutical Co., Ltd, MSD K.K., Mitsubishi Tanabe Pharma Corporation, Novo Nordisk Pharma Ltd, Nippon Chemiphar Company Ltd, Sanwa Kagaku Kenkyusho Co., Ltd, Sanofi K.K., Taisho Toyama Pharmaceutical Co., Ltd, Ono Pharmaceutical Co., Ltd, Takeda Pharmaceutical Co., Ltd and TERUMO Co. For the remaining authors, none were declared.
Funding
E.U. received grant support from Japanese Study Group for Physiology and Management of Blood Pressure and Astellas Foundation for Research on Metabolic Disorders.