
Abstract
Skin and kidney microvascular functions may be affected independently in diabetes mellitus. We investigated skin microcirculatory function in 79 subjects with diabetes type 2, where 41 had microalbuminuria and 38 not, and in 41 age-matched controls. The oxygen saturation, fraction of red blood cells and speed-resolved microcirculatory perfusion (% red blood cells × mm/s) divided into three speed regions: 0–1, 1–10 and above 10 mm/s, were assessed during baseline and after local heating of the foot with a new device integrating diffuse reflectance spectroscopy and laser Doppler flowmetry. Arterial stiffness was assessed as carotid-femoral pulse wave velocity. Subjects with diabetes and microalbuminuria had significantly higher carotid-femoral pulse wave velocity compared to subjects without microalbuminuria and to controls. The perfusion for speeds 0–1 mm/s and red blood cell tissue fraction were reduced in subjects with diabetes at baseline and after heating, independent of microalbuminuria. These parameters were correlated to HbA1c. In conclusion, the reduced nutritive perfusion and red blood cell tissue fraction in type 2 diabetes were related to long-term glucose control but independent of microvascular changes in the kidneys and large-vessel stiffness. This may be due to different pathogenic pathways in the development of nephropathy, large-vessel stiffness and cutaneous microvascular impairment.
Introduction
There is increasing knowledge that type 2 diabetes mellitus (DM) is associated with microcirculatory changes and endothelial dysfunction. It is generally accepted that DM causes microvascular dysfunction such as nephropathy and retinopathy. 1 On the other hand, microvascular dysfunction can be the cause of insulin resistance and impaired fasting glucose. 2 In skeletal muscle, insulin normally redirects blood flow from nonnutritive to nutritive capillaries and thereby increase insulin-mediated glucose uptake without increasing total blood flow. 3 Obesity can cause defects in the endothelial insulin signalling leading to impairment of this microcirculatory process, causing insulin resistance. 4
The cutaneous microvascular function in terms of vascular reactivity can be noninvasively examined using various provocation protocols such as hyperaemic responses to iontophoresis of acetylcholine and sodium nitroprusside, local heating and vascular occlusion. 5 The methods for evaluation of vascular reactivity are normally pointwise measurements of microvascular perfusion using laser Doppler flowmetry (LDF). 6 This is challenging due to large biological variability, such as local spatial and temporal variations in blood flow, and technical variability in terms of uncertainty in optical properties of the tissue and measurement volume. 7 Thus, the perfusion is measured in arbitrary units, not allowing calibration in physiological perfusion units. 8
Development of the conventional laser Doppler technique towards assessment of speed-resolved blood flow utilizes the laser Doppler power density spectra for analysis in different ways.9–11 These measures separate the effect in low-speed vessels (preferentially capillaries) from those in high-speed microvascular vessels. With speed-resolved perfusion, a reduced high-speed perfusion was observed for the first time in type 2 DM during heat provocation, presumably due to inability to dilate shunt vessels. 12 Also, the diabetes duration negatively affected the low-speed nutritive capillary blood flow during baseline. 12 Another study indicated that there are differences in speed distribution in unprovoked blood flow between DM type 1 and healthy controls, with a higher average speed of the blood flow in DM. 13
By integrating LDF and diffuse reflectance spectroscopy (DRS), which utilize different absorption spectra of oxygenized and deoxygenized haemoglobin in an adaptive skin model, it is possible to determine red blood cell (RBC) oxygen saturation, tissue fraction of RBCs and speed-resolved perfusion simultaneously 14 and also in absolute units15,16 as shown in a healthy population. 15 Another technique assessing tissue oxygenation by spectrophotometry in combination with blood flow measurements with conventional LDF has been used in a population with diabetes. 17 Simultaneously measured blood flow and blood oxygen saturation enables a more comprehensive understanding of microvascular pathophysiology. However, the value of blood oxygen saturation and concentration remains to be evaluated since very few studies have been performed with this integrated technology.
The aim of this study was to evaluate the relationship between microcirculatory dysfunction in type 2 diabetes and microalbuminuria and arterial stiffness in large vessels. Subjects with type 2 diabetes with and without microalbuminuria and control subjects underwent a heat provocation while assessing microcirculatory blood flow distribution in different speed regions, RBC tissue fraction and RBC oxygen saturation.
Methods
Ethical approval
Informed consent was obtained from all subjects. This study of the microcirculation was a detached part of a larger study and the participants could choose to be a part of both the larger study and the extended, or just the larger study. The extended microcirculation protocol was approved by the regional ethical review board at Linköping University, Linköping, Sweden (D. no. 2012/322-32).
Study population
Three groups of subjects were studied: two groups with diabetes, with and without microvascular complications in form of microalbuminuria, and one control group.
The subjects in this study were all part of two larger studies, the Cardiovascular Risk Factors in Patients with Diabetes – a Prospective Study in Primary Care (CARDIPP), which was launched together with a non-diabetic control study, CAREFUL. The two studies started in 2005 with the aim to identify markers for cardiovascular disease in middle-aged patients with type 2 diabetes. In the CARDIPP study, the albumin/creatinine ratio (ACR) was tested in a one morning urine sample spot and based on the definition on microalbuminuria (ACR, ⩾3 g/mol), 41 patients with an ACR ⩾3 g/mol and 38 patients with an ACR <3 g/mol were asked to join this extended study. The 38 patients with ACR <3 g/mol were not on insulin treatment. The 79 subjects included in this study had their first visit in the CARDIPP study during year 2006–2007. In addition, 41 subjects from the original CAREFUL population were participating in this study. All were free from anti-hypertensive treatment or overt cardiovascular disease at their first study visit, some years back in time, but at this study occasion, a few control subjects had started taking cardiovascular medication (Table 3).
In the CARDIPP study, a follow-up visit 4 years after the first visit was conducted. The subjects included in this study had their follow-up visit during year 2010–2012. At the follow-up visit, data on ongoing medications, smoking status and diabetes duration were collected. Also, parameters such as height, weight and blood pressure were measured. A fasting blood sample was also obtained from the patients. Carotid-femoral pulse wave velocity (PWVc-f) was calculated as a measure of central arterial stiffness. An additional morning urine sample was obtained during year 2012 at the same occasion as the microcirculation measurement to give an up-to-date value of the ACR. Toe blood pressure/systolic brachial pressure (TBPI) was only measured at the first visit.
Since the CAREFUL study did not include a follow-up visit, all parameters such as smoking status, height, weight and blood pressure were collected at the microcirculatory measurement occasion (year 2012). Blood and urine samples were also collected and PWVc-f was performed. TBPI was only measured at the first visit.
Hardware
The microcirculation was measured using an integrated white light spectroscopy and LDF probe based system, an early prototype of the PF6000 EPOS system (Perimed AB, Järfälla, Stockholm, Sweden). 15 An optical notch filter was added between the probe and the spectroscopes to suppress wavelengths 785 ± 20 nm to ensure minimal influence from the laser light on the DRS spectra. The probe was placed in a thermostatic probe holder (PH 08; Perimed AB) during the measurements which was fixated to the skin using double-sided adhesive rings (PF 105-1; Perimed AB).
Microcirculatory protocol
Endothelium-dependent vasoreactivity of the microcirculation was determined by local heating of the skin, where local thermal hyperaemia is characterized by a first peak in perfusion within 5 min after heat onset, followed by a plateau phase after 20–30 min. 5 The first peak depends mostly on local nerve axon reflex, while the plateau phase depends mostly on nitric oxide (NO). 5 The measurements were conducted in a room with an ambient temperature of 23.7°C ± 0.4°C [mean ± standard deviation (SD)] and the subjects were acclimatized for 15 min before the measurements. During the measurements, the subjects were in a supine position fully rested. The microcirculatory measurements were performed on the volar surface of the foot avoiding any visible blood vessels or bones. The thermostatic probe holder was used to assure a stable skin temperature and was also used for the local heating of the skin. The probe holder was set to 32°C during 5 min baseline measurement and increased to 44°C during 25 min of local heating. In addition to the DRS and LDF probe, a tcpO2 electrode (transcutaneous oxygen pressure) was attached on the other foot during the full 30-min protocol. The tcpO2 electrode heated the skin locally to 44°C to create local hyperaemia and to increase oxygen pressure. The tcpO2 value was measured after a more than 15-min-long stabilization period.
Baseline values were calculated as the median over the first 3 min of the 5-min baseline recording and the plateau phase values were calculated as the median over the last 3 min of the 25-min heating provocation. First peak values were calculated as the median over 1 min in the time interval 0–5 min after start of heating. Figure 1 shows a representative tracing of the parameters from a control subject and the selected intervals. This subject had a distinguishable first peak in perfusion in the axon reflex time interval (peak in time interval 3–4 min after start of heating), while the perfusion at the plateau phase was rising.
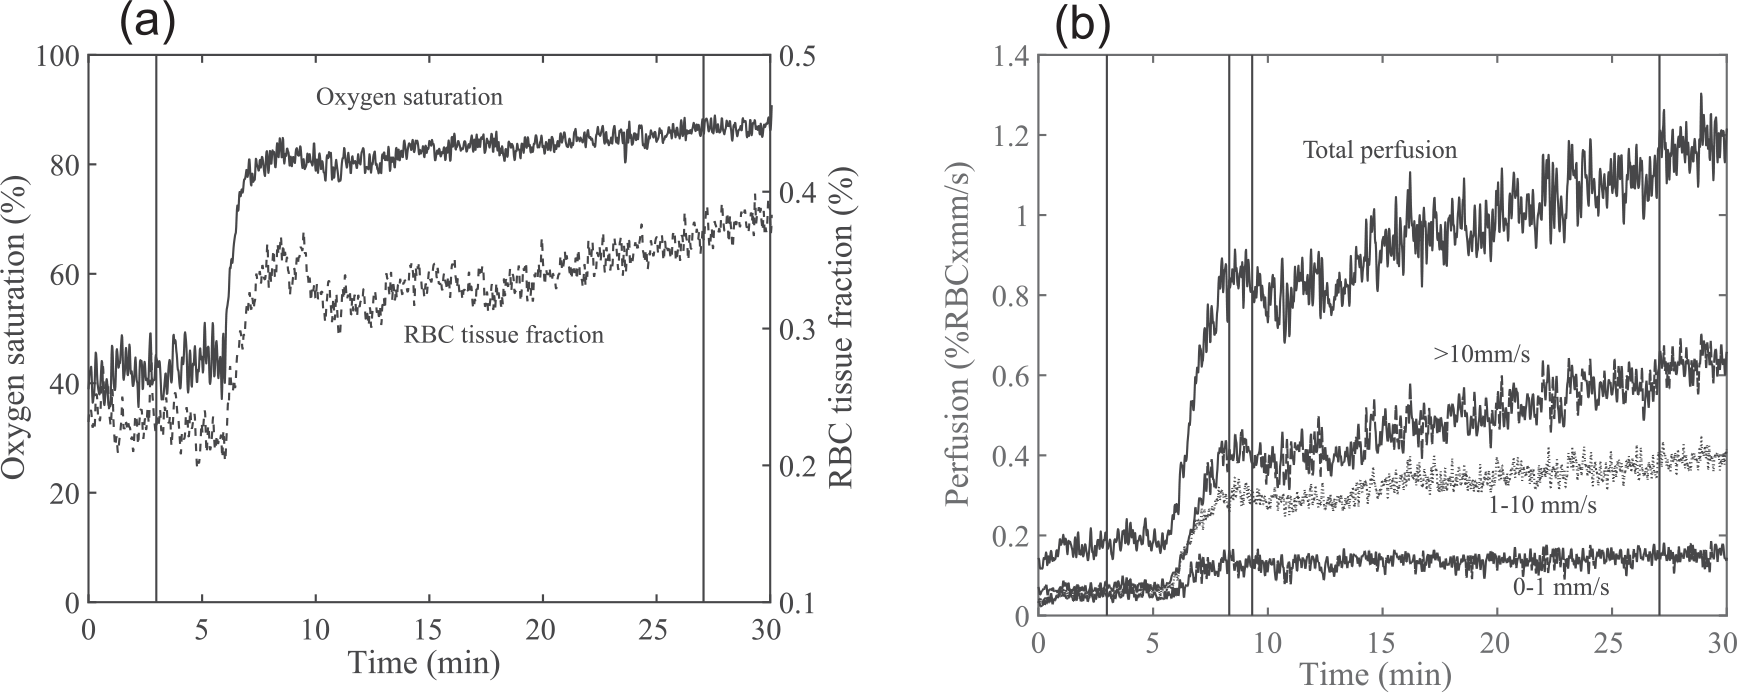
Microvascular response from a control subject in (a) oxygen saturation and RBC tissue fraction and (b) speed-resolved perfusion during local heating, together with selected periods for baseline, first peak and plateau.
Microcirculatory parameters
A three-layer skin model for DRS and LDF was used to calculate tissue fraction of RBC, RBC oxygen saturation and perfusion, divided in three speed regions (0–1, 1–10 and above 10 mm/s). The model described in Fredriksson et al. 16 was modified to have a 200 µm thickness of the second layer. DRS and LDF spectra were calculated from the skin model and compared to measured spectra in an optimization routine to find the skin model with the best fit to measured spectra. When the best fit model was found, the microcirculatory parameters were calculated directly from the model.
Data exclusion
If the haemoglobin signature in DRS spectra was too weak, the RBC oxygen saturation estimation became unstable. The oxygen saturation estimate was hence discarded at too small haemoglobin areas 15 and also if the estimated RBC tissue fraction was below 0.1%. Motion artefacts cause peaks in the normally monotonically decreasing measured Doppler power spectrum, and measurement points containing such peaks in the Doppler power spectrum were therefore excluded.
Statistical analysis
Continuous variables are given as mean ± SD and the categorical variables are given as total number with corresponding percentages. The microcirculatory parameters were analysed by one-way analysis of variance (ANOVA) followed by Tukey’s post hoc test to study pairwise differences. The null hypothesis was rejected at p < 0.05. Significance is reported without correction for multiple testing. Potential confounding variables were tested in a linear mixed model: age, sex, smoking status, body mass index (BMI), mean arterial pressure (MAP) and cholesterol. Correlations were performed using Pearson’s correlation. Post hoc analysis of the possible influence of medication was done in the subjects with diabetes. The independent sample t-test was used to compare microcirculatory parameters of subjects in the diabetes groups prescribed angiotensin-converting enzyme (ACE) inhibitors or calcium antagonists to those not prescribed these medications. A similar analysis was done for β-blockers. Statistical analyses were performed in SPSS Statistics version 21 (Statistical Package of Social Sciences, SPSS Inc., Chicago, IL, USA).
Results
Due to data acquisition failure, six subjects were excluded (one control, four with diabetes and microalbuminuria and one with diabetes but no microalbuminuria). Two additional subjects were excluded from the control group due to an elevated level of albumin in the urine at the measurement occasion. Three subjects were excluded from the diabetes group with no microalbuminuria due to abnormal calibration spectra. In total, measurements from 38 subjects in the control group were analysed, 34 from the diabetes group with no microalbuminuria (DNMA) and 37 from the diabetes group with microalbuminuria (DMA). Characteristics on the analysed subjects are given in Table 1.
Characteristics and laboratory data of control subjects and patients with diabetes type 2 divided in two subgroups: without microalbuminuria (DNMA) or with microalbuminuria (DMA).
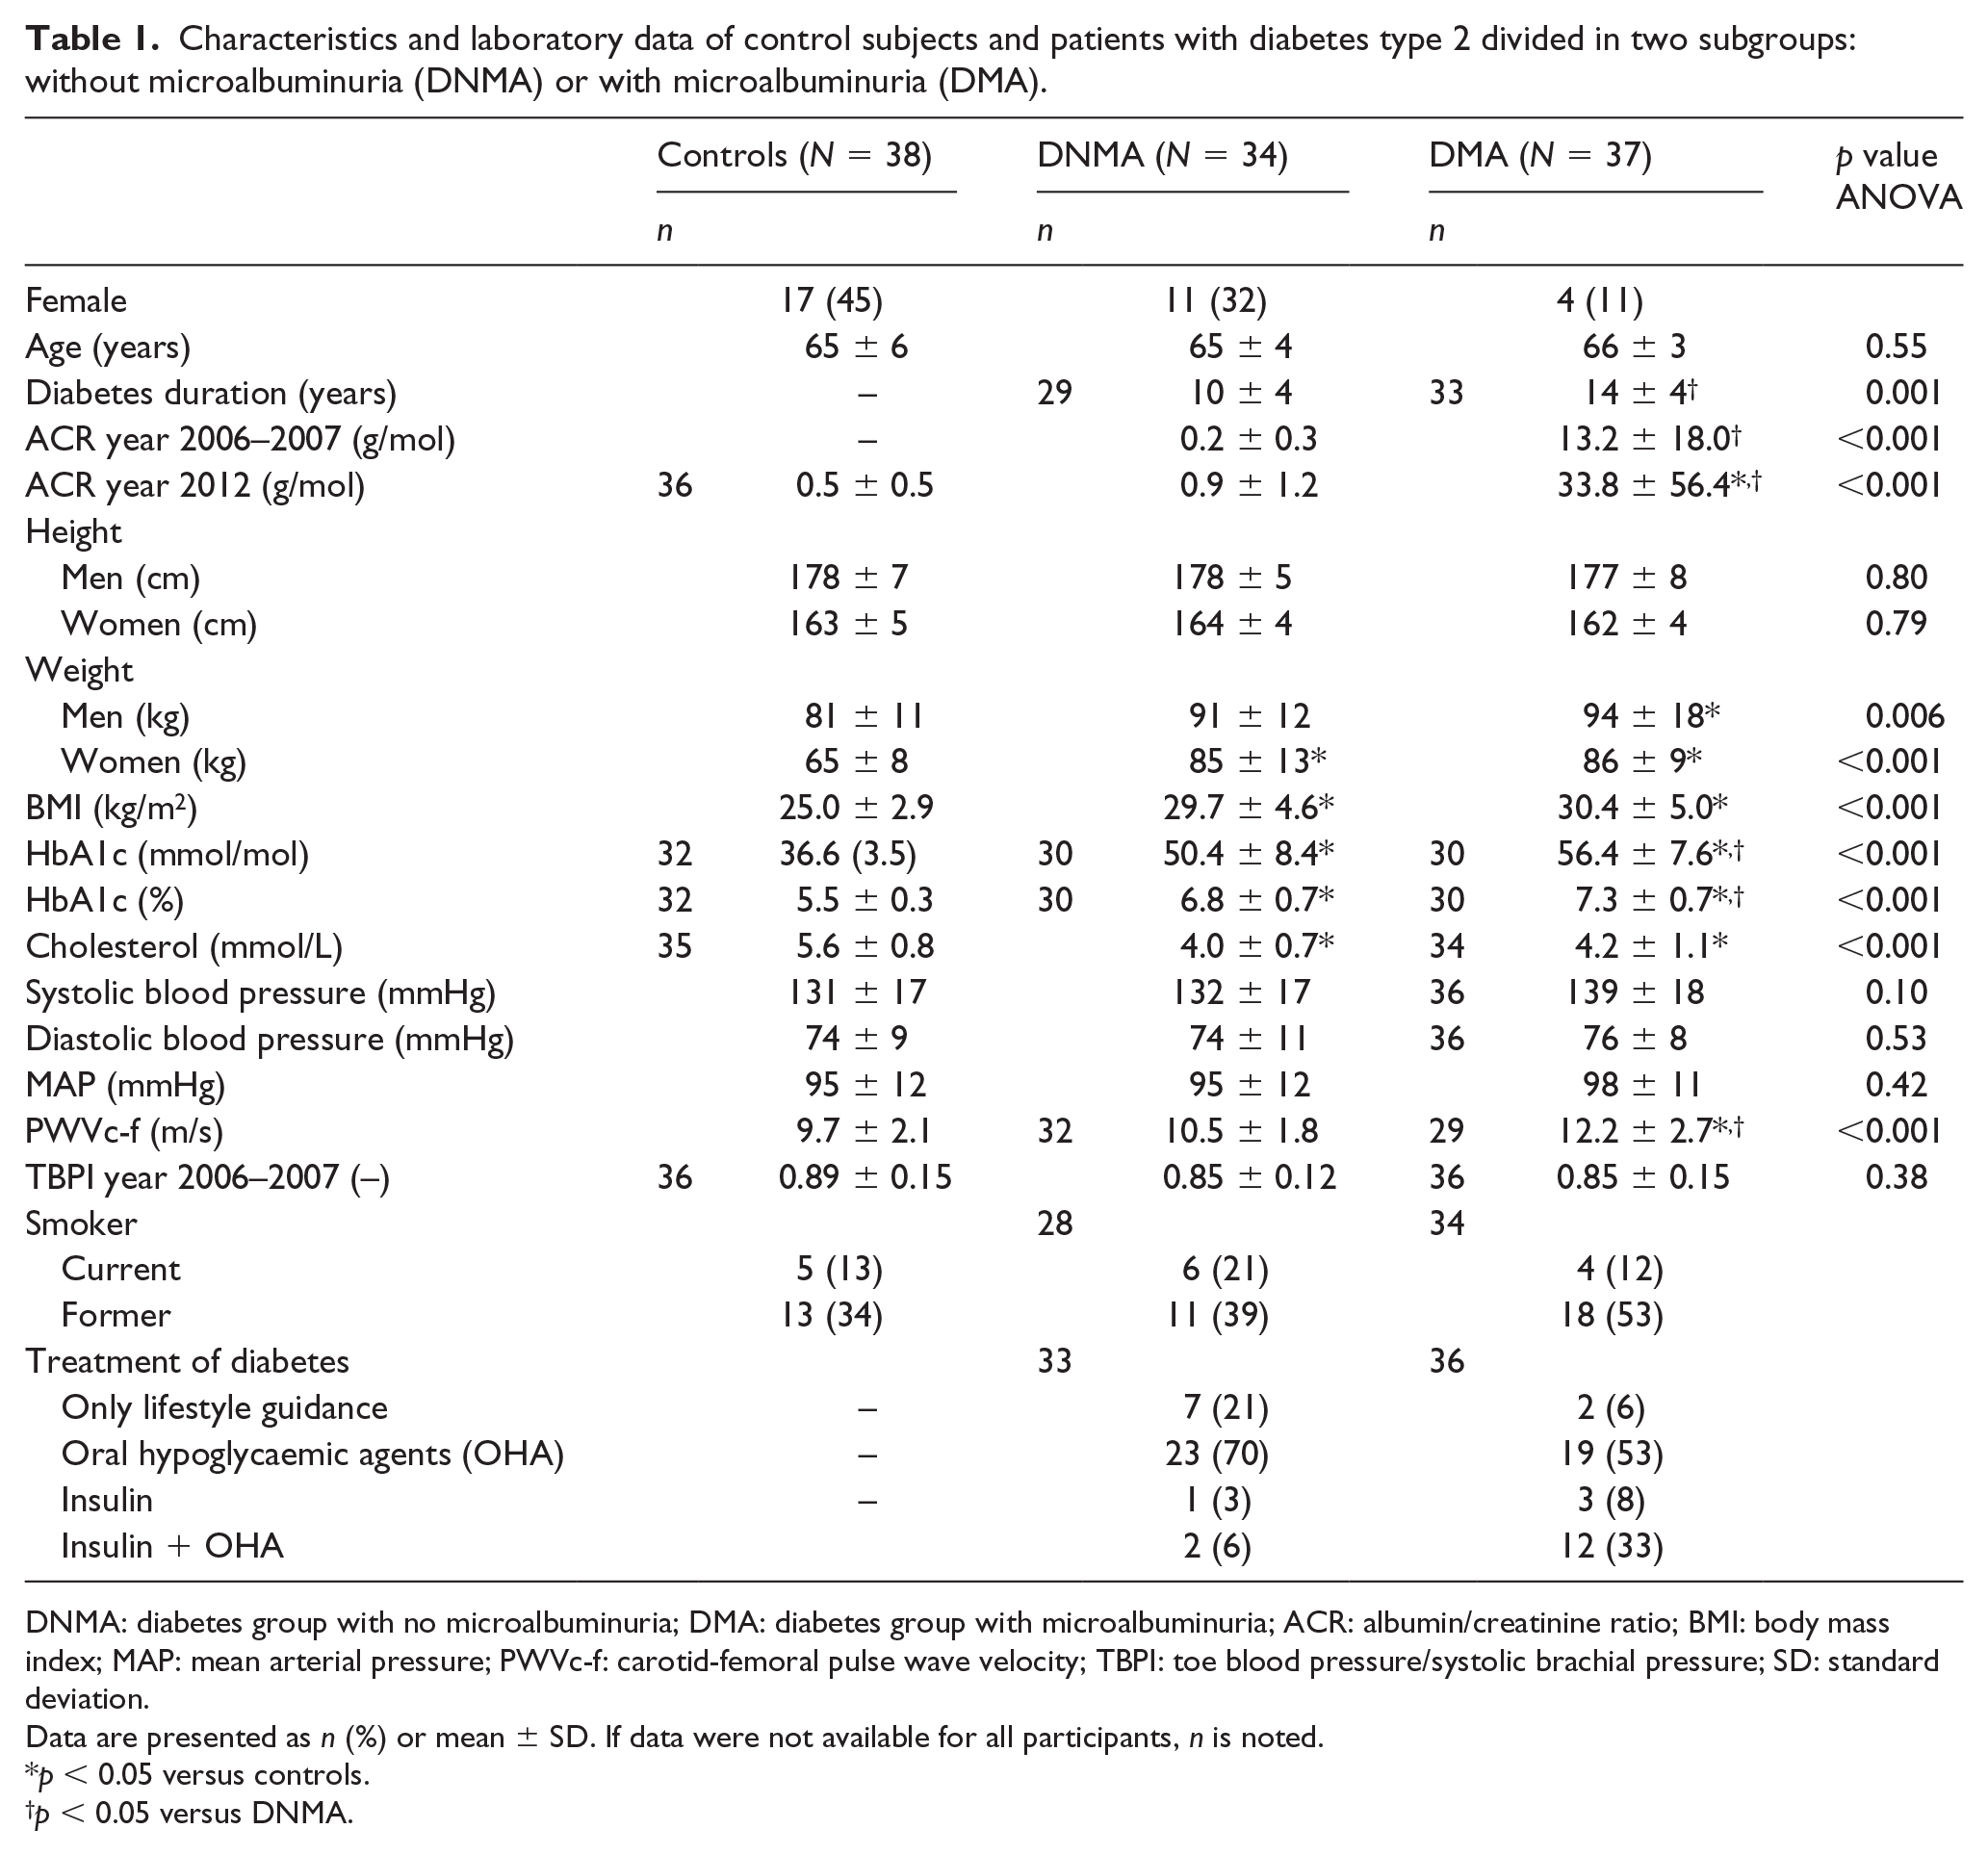
DNMA: diabetes group with no microalbuminuria; DMA: diabetes group with microalbuminuria; ACR: albumin/creatinine ratio; BMI: body mass index; MAP: mean arterial pressure; PWVc-f: carotid-femoral pulse wave velocity; TBPI: toe blood pressure/systolic brachial pressure; SD: standard deviation.
Data are presented as n (%) or mean ± SD. If data were not available for all participants, n is noted.
p < 0.05 versus controls.
p < 0.05 versus DNMA.
Microvascular assessment
The microcirculatory parameters during baseline and after thermal hyperaemia are summarized in Table 2. All significant differences between the groups remained after adjusting for potential confounders.
Microcirculatory parameters during baseline and at thermal hyperaemia for control subjects and patients with diabetes type 2 without microalbuminuria (DNMA) and with microalbuminuria (DMA).
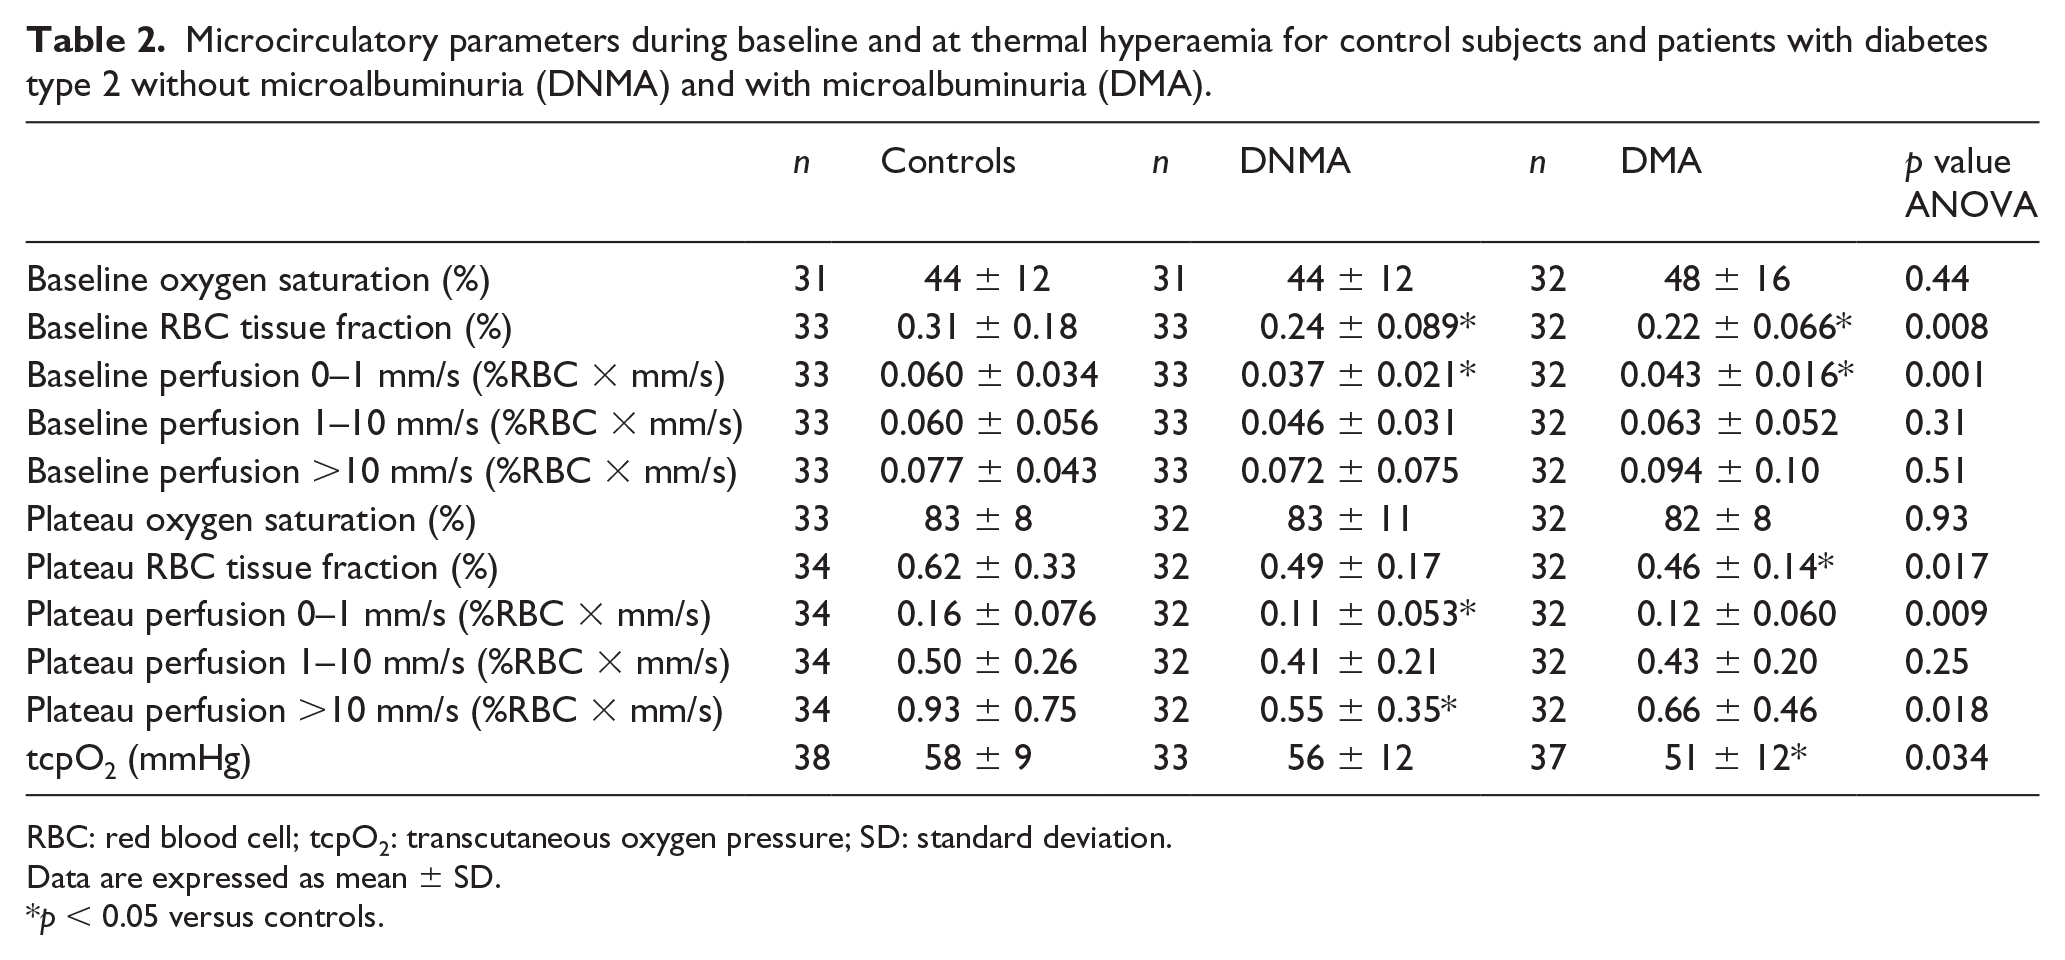
RBC: red blood cell; tcpO2: transcutaneous oxygen pressure; SD: standard deviation.
Data are expressed as mean ± SD.
p < 0.05 versus controls.
Subjects with diabetes prescribed ACE inhibitors or calcium antagonist (n = 60) had no significant differences in microcirculatory parameters compared to those not prescribed these medications (n = 13). Subjects with diabetes prescribed β-blockers had significant lower perfusion for speeds below 1 mm/s and RBC tissue fraction in baseline (p = 0.029 and p = 0.012, respectively) and significant lower RBC tissue fraction after heat (p = 0.016).
Medications for the included subjects are given in Table 3.
Medications for the included subjects in the control group, patients with diabetes type 2 without microalbuminuria (DNMA) and patients with diabetes type 2 with microalbuminuria (DMA).
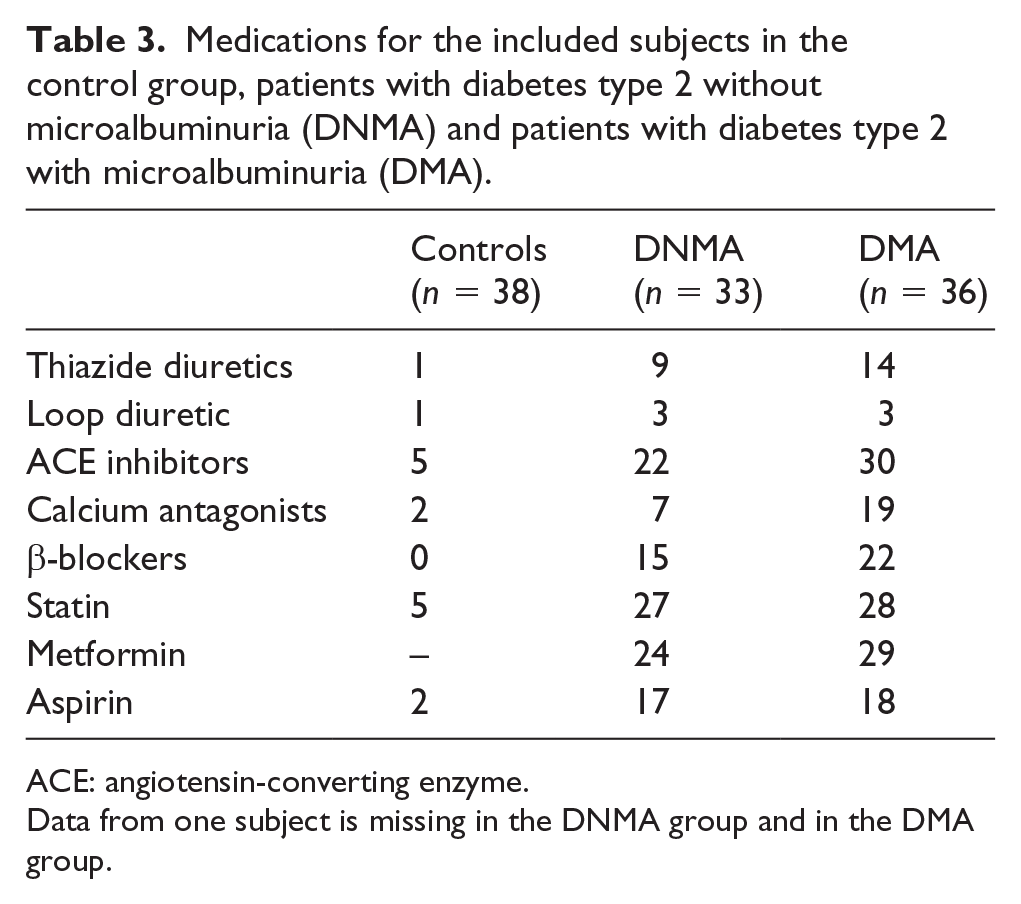
ACE: angiotensin-converting enzyme.
Data from one subject is missing in the DNMA group and in the DMA group.
Oxygen saturation, RBC tissue fraction and tcpO2
The oxygen saturation was not different between the three groups during baseline or after local heating. It increased after local heating for all subjects, but the increase did not differ significantly between the groups. The oxygen saturation in baseline was negatively correlated to tcpO2 (p = 0.02, r = −0.24), but no significant correlation between oxygen saturation and tcpO2 was found after heating.
Compared with controls, RBC tissue fraction was significantly lower during baseline for DNMA (diabetes type 2 without microalbuminuria) and DMA (diabetes type 2 with microalbuminuria) (p = 0.04 and p = 0.01, respectively). The RBC tissue fraction increased after heating for all groups. For DMA, the RBC tissue fraction plateau level was significantly lower than the control group (p = 0.019). The RBC tissue fraction was negatively correlated to HbA1c both in baseline (p = 0.002, r = −0.34) and after heating (p = 0.008, r = −0.29).
TcpO2 was significantly lower in DMA compared to controls (p = 0.031). TcpO2 was positively correlated to MAP (p = 0.025, r = 0.22) and negatively correlated to PWV (p = 0.041, r = −0.21) and HbA1c (p = 0.002, r = −0.32).
Speed-resolved perfusion
The perfusion for speeds below 1 mm/s was lower during baseline both for DNMA and DMA compared with the control group (p = 0.001 and p = 0.022, respectively). At plateau, the perfusion for speeds below 1 mm/s remained lower for DNMA compared with controls (p = 0.01), while there were no differences between DMA and the control group. There was also a difference between controls and DNMA in perfusion for speeds above 10 mm/s at plateau (p = 0.016). The perfusion for speeds below 1 mm/s in baseline was negatively correlated to HbA1c (p = 0.003, r = −0.32). Also, the perfusion for speeds above 10 mm/s in baseline was positively correlated to diabetes duration (p = 0.012, r = 0.33). At plateau, the perfusion for speeds below 1 mm/s and above 10 mm/s were negatively correlated to HbA1c (p = 0.023, r = −0.25 and p = 0.037, r = −0.23, respectively). The perfusion for speeds above 10 mm/s was positively correlated to MAP at plateau (and p = 0.009, r = 0.27).
Total perfusion and conventional perfusion
The total perfusion at the first peak after heating was significantly lower for DNMA (0.69 ± 0.35% RBC × mm/s) and DMA (0.87 ± 0.38% RBC × mm/s) compared with the control group (1.26 ± 0.74% RBC × mm/s) (p < 0.001 and p = 0.013, respectively) (Figure 2). The total perfusion at plateau was also lower for DNMA (1.09 ± 0.50% RBC × mm/s) compared with controls (1.60 ± 0.98% RBC × mm/s) (p = 0.017), while it was not significantly different for DMA (1.22 ± 0.62% RBC × mm/s). At plateau, the conventional perfusion was lower for DNMA (217 ± 87 PU) compared with the control group (294 ± 159 PU) (p = 0.024). There was no significant difference in conventional perfusion between DMA (235 ± 87 PU) and controls. The total perfusion in baseline was positively correlated to diabetes duration (p = 0.01, r = 0.34). The total perfusion was negatively correlated to HbA1c at first peak (p = 0.006, r = −0.32) and at plateau (p = 0.034,r = −0.23). At first peak and at plateau, the total perfusion was positively correlated to MAP (p = 0.037, r = 0.23,p = 0.01, r = 0.26, respectively).
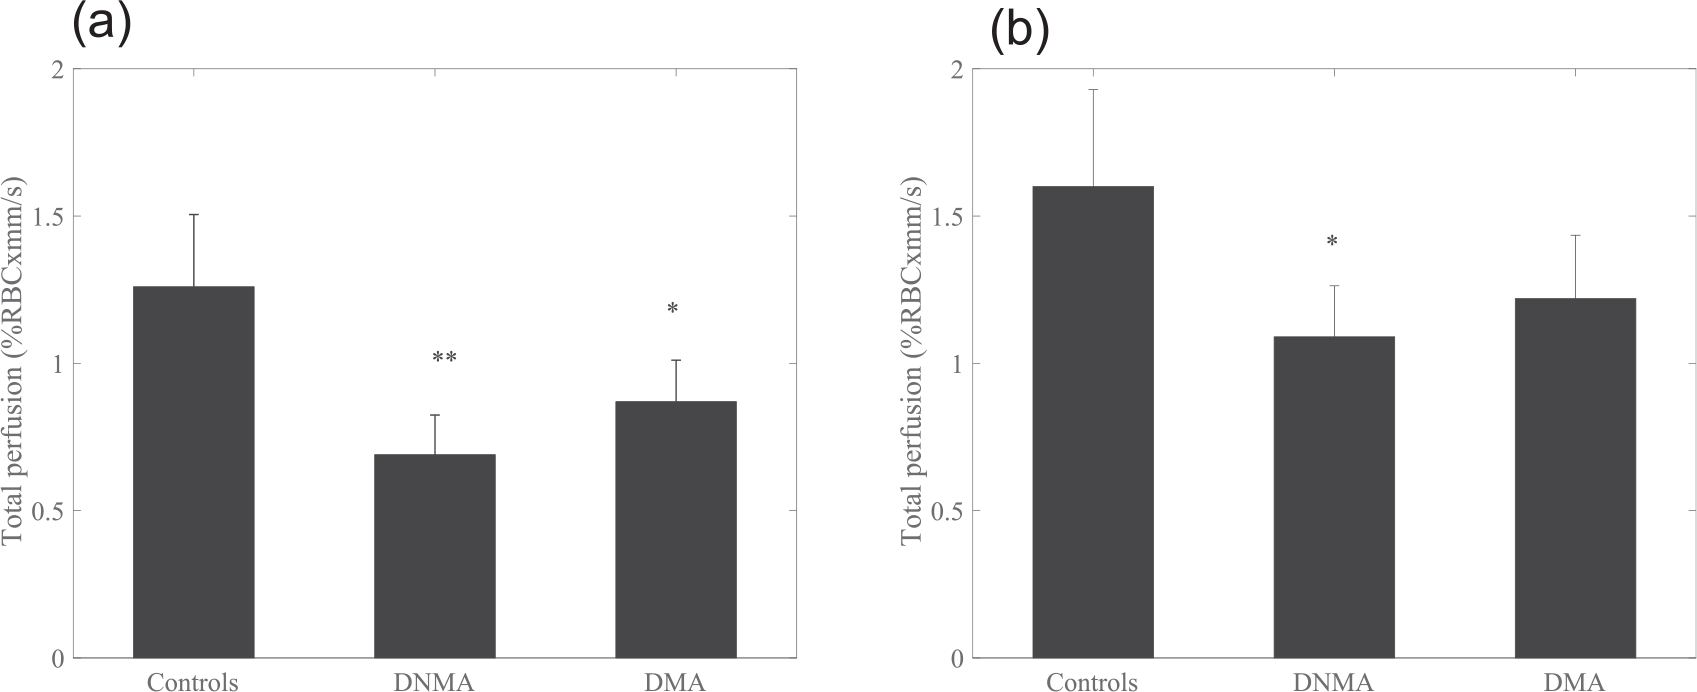
Total perfusion at (a) first peak and (b) at plateau for controls, DNMA and DMA. Data presented are means (95% confidence intervals). *p < 0.05, **p < 0.01.
Discussion
Microvascular complications to DM that are regularly screened for in clinical practice include retinopathy, nephropathy and neuropathy. It is widely held that nephropathy defined by an increased ACR is an important risk marker for developing cardiovascular disease. The hypothesis of this study was that the microcirculatory function was different between a population with type 2 diabetes with or without sign of microcirculatory dysfunction in form of an increased ACR and compared to age-matched controls.
Our findings demonstrate that cutaneous microvascular impairment in baseline and in terms of depressed vasodilation in response to thermal stimuli is evident in patients with type-2 diabetes regardless of prevalent diabetes-related nephropathy. Patients with type 2 diabetes and microalbuminuria had increased PWVc-f compared to both type 2 diabetes subjects without microalbuminuria and controls, respectively. This indicates that microcirculatory endothelial injury is present in the diabetes subjects and has different pathogenesis than both renal injury associated with microalbuminuria and large-vessel complications measured with PWV. These complications, that is, neuropathy, retinopathy and renal microproteinuria, are traditionally seen as complications of diabetes occurring over time. However, previous studies indicated that impaired glucose tolerance is associated with all three types of microvascular complications, 18 supporting our findings. The pathogenesis of these early signs is largely driven by endothelial injury due to free fatty acids and cause both insulin resistance and inflammation in the major insulin target tissues 19 resulting in inhibition of NO-mediated vasodilation. 18 Insulin resistance is linked with endothelial dysfunction and the release of NO by insulin per se is reduced in states of insulin resistance and endothelial dysfunction. Indeed, the cellular signalling to release NO in human endothelial cells is very similar as those causing glucose uptake in fat and muscle cells. 20 Thus, our findings of microcirculatory dysfunction when compared with non-diabetic controls could be an accumulation of endothelial dysfunction from insulin resistance that is aggravated by the hyperglycaemia reflected in HbA1c.
Interestingly, we also showed a depressed response in the NO-independent response to thermal stimuli, that is, a depressed axon reflex. This first peak, appearing within the first 10 min of thermal stimulation, is due to activation of C-fiber nociceptors, 21 through local release of calcitonin gene-related peptide and substance P 22 among others. It has previously been shown that activation of this pathway plays a major role in the progression of vascular complications related to diabetes. 23 It is supported by results of lower maximal vasodilation after 11 min of heating in patients with diabetes compared to healthy controls, where there were no significant differences between patients with diabetes with or without vascular complications such as present coronary heart disease, microalbuminuria and retinal damage. 24
We have previously showed that a reduced low-speed flow (0–1 mm/s) and an increased mid-speed flow (1–10 mm/s) are related to diabetes duration at baseline conditions. 12 This was associated with an increased arteriovenous shunt flow related to diabetes duration. The present findings reveal an increase in perfusion in the highest speed region and in the total perfusion related to a longer diabetes duration, which is in line with previous finding. However, in this study, the difference in the low-speed region between subjects with type 2 diabetes and controls was not related to diabetes duration but to HbA1c. Wojtkiewicz et al. 13 estimated speed distribution of RBCs based on LDF spectra decomposition, where subjects with diabetes had higher speed of RBCs during rest than controls. This is in line with our findings where, during baseline, subjects with diabetes had a smaller part of the total flow distributed in the lowest speed region compared to controls, and hence the average speed for patients with diabetes is higher. These findings show the usefulness of differentiating between different speed regions, to address the smallest vessel structure of relevance to diabetic pathogenesis.
This study showed that reduced microvascular reactivity correlated to HbA1c, represented in several parameters both related to oxygen saturation, RBC tissue fraction and perfusion, in baseline as well as due to thermal stimuli. This points out a robust relationship between hyperglycaemia and endothelial function, which is well established as a major factor contribution to endothelial function in diabetes. 25
Potential limitation of the study is the temperature of the probe used for the local heating of the skin. Local heating at a temperature of 44°C causes a maximal vasodilatation in the skin and heating to this temperature can in some cases be experienced as mildly painful. If the heating is followed by a sense of pain, other mechanisms activate inducing vasodilation. Carter and Hodges 26 reported and absent initial peak and nadir when heating the skin rapidly to 44°C where all subjects experienced a short period of pain. Even if none of the participants in this study reported any sense of pain, a first peak was not distinguishable in all subjects. This could be an effect of the temperature of 44°C and with a reduced temperature this could eventually be avoided. Also, other factors like endothelium-derived hyperpolarization factors (EDHF) contributes to the vasodilation at 44°C. 27 With a reduced temperature of 39°C, the plateau will be more dominated by NO; 28 however, the time to reach plateau will increase. Even with 44°C, the time to reach plateau may be longer than 25 min (Figure 1).
Clinical and laboratory guidelines recommend ACR as measure of albuminuria for the definition and managing of nephropathy. Our study is limited using a one-spot urine sample. However, the majority of the participants in the diabetes groups remained with an ACR <3 g/mol or with an ACR ⩾3 g/mol at the two measurement occasions with 6 years between.
Medications have the potential to affect skin microcirculation in various ways. ACE inhibitors and calcium antagonists can have a vasodilatory effect on the microcirculation and improving endothelial function,29,30 but no difference was found in the microcirculatory parameters for the diabetes groups when comparing those with prescribed ACE inhibitors or calcium antagonist to those without such subscriptions. It has previously been shown that β-blockers do not influence skin microcirculation. 30 However, in this study, those with prescribed β-blockers had lower RBC tissue fraction and low-speed perfusion comparing those without subscription. This could possibly be related to the fact that those with prescribed β-blockers had significantly more prescribed medications overall. Furthermore, the results are in line with the well-known side effects as impaired vasodilation associated with this type of medication.
The tcpO2 was significantly reduced in DMA compared to controls, while the RBC oxygen saturation was not different between the groups. There is a difference between the tcpO2 value and the RBC oxygen saturation. The RBC oxygen saturations reflect the amount of oxygen bound to haemoglobin, while the tcpO2 electrode measures the amount of diffused oxygen from the capillaries through the epidermis to the skin surface. Since oxygen in tissue can be both free and bound to haemoglobin, where haemoglobin has a maximum capacity of carrying oxygen, the oxygen saturation and tcpO2 values reflect different aspects of the oxygen transport. If the metabolic demand of the tissue is high, the tcpO2 value can be low since less oxygen will reach the electrode. Also, the tcpO2 electrode heats the skin locally to 44°C to increase blood flow and oxygen pressure and therefore the tcpO2 value cannot be considered as a baseline value but should rather be compared to plateau conditions.
Conclusion
The major findings in this study were facilitated by the new microcirculatory monitor, able to resolve the microvascular perfusion into speed regions together with simultaneous measures of oxygen saturation and RBC tissue fraction. The device enables new studies of the role of the microcirculation in diabetes by separating the nutritive blood flow from the total flow. Potentially this will lead to a better understanding and eventually better treatment of the disease.
We conclude that cutaneous microvascular impairment was evident in type 2 diabetes. A low nutritive perfusion (0–1 mm/s) and a low RBC tissue fraction were related to long-term glucose control (HbA1c), independent of microalbuminuria. This may be due to different pathogenic pathways in the development of nephropathy and cutaneous microvascular impairment.
Footnotes
Acknowledgements
Declaration of conflicting interests
The author(s) declared no potential conflicts of interest with respect to the research, authorship and/or publication of this article.
Funding
This study was financed by VINNOVA (Sweden’s innovation agency) and Perimed AB through the SamBIO research collaboration program between companies and academia within bioscience (VINNOVA D. no. 2008-00149) and the Research & Grow program (VINNOVA D. no. 2011-03074), and also by NovaMedTech supported by the European Union Regional Development Fund (D. no. 68737, 160382).