
Abstract
The objective of this study is to explore changes in microvascular tone during a contralateral cold pressor test and to compare the results obtained in healthy subjects and in patients with impaired glucose tolerance (IGT) and type 2 diabetes. Low-amplitude fluctuations of skin temperature in the appropriate frequency ranges were used as a characteristic for the mechanism for vascular tone regulation. In total, 13 adults with type 2 diabetes aged 40–67 years and 18 adults with IGT aged 31–60 years participated in this pilot study. The control group included 12 healthy men and women aged 39–60 years. The response to the cold pressor test in patients with type 2 diabetes and with IGT differs essentially from that of healthy subjects in the endothelial frequency range. Endothelial dysfunction occurs in the preclinical stage of diabetes and manifests, in particular, as a disturbance of the endothelial part of vascular tone regulation.
Keywords
Introduction
The World Health Organization estimates that more than 439 million adults (aged 20–79 years) in the world will have diabetes in 2030 and twice as many people will have impaired glucose tolerance (IGT). 1 The main reasons for disability and mortality caused by diabetes are microvascular and macrovascular complications leading to cardiovascular disease.2,3 At present, the diagnosis of diabetes complications is made only at the clinical stage, and treatment in most cases is directed towards reducing the progression of angiopathy.
The magnitude of endothelial dysfunction in diabetics is often related to the severity and duration of the illness, as well as to glycaemic and glycosylated haemoglobin A1c levels. 4 It is well recognized that vascular endothelial cells play a major role in vascular tone regulation (vasodilation and vasoconstriction), in haemostasis (synthesis and inhibition of fibrinolysis and thrombocyte aggregation factors) and in the development of remodelling processes and local inflammation. 5 The very location of the endothelium at the blood flow boundary makes it highly sensitive to various factors, including hyperglycaemia, which increase the risk of vascular diseases.6,4
In the past years, methods for the exploration of cutaneous microcirculation have aroused considerable interest of researchers. The skin is the most accessible site for non-invasive assessing of microcirculation and for performing measurements. 7 Being a dynamic structure, the human skin can be used as a microcirculation model for investigating the generalized microvascular function. Investigations have revealed a correlation of vascular reactivity in different vascular beds over the body (e.g. coronary arteries, brachial artery and skin microcirculation) of healthy people and patients, at least for endothelial functions. 8
Both the neural and local humoral factors affect the skin blood flow. The endothelium plays an important role in the regulation of vascular tone, and the endothelial function is the ability to release substances, which cause local arteriolar vasodilation by inducing relaxation of the underlying smooth muscle cells. 9
There are no methods capable of providing accurate quantitative estimation of the skin blood flow. Today, laser Doppler flowmetry (LDF) is widely used in clinical research monitoring of the microvascular blood flow. 10 To avoid movement artefacts having a strong effect on the LDF signal, a person must lie completely still, and the probe must be in close contact with the skin.
Information about cutaneous microcirculation can also be obtained by recording the low-amplitude skin temperature oscillations. 11 In this case, the results of measurements weakly depend on the mechanical transposition of temperature sensors, and the level of artefacts is quite low during long-term measurements or functional tests. In our work, the fluctuations of skin temperature in the appropriate frequency intervals were used as a characteristic of the vascular tone regulation mechanism. Low-amplitude skin temperature fluctuations are caused by periodic changes in the blood flow due to oscillations in vasomotor smooth muscle tone.12,13 A cross-spectral analysis of the variations in blood pressure waveforms and temperature shows a high degree of correlation between the spontaneous fluctuations of skin temperature and the vasomotor activity of small arteries and arterioles in subcutaneous tissues. 14 Weak phase coherence between temperature and blood flow was observed for unperturbed skin, and due to heating, it increased in all frequency intervals. 15 A wavelet spectral analysis of fluctuations in the vasomotor tone of the microcirculatory system registered by LDF and precision thermometry 16 gives information about the local, hormonal and neurogenic factors of microcirculatory regulation.
It has been found that myogenic fluctuations are registered in the frequency range of 0.05–0.14 Hz, neurogenic activity is observed in the range of 0.02–0.05 Hz and the endothelial function of blood vessels is determined in the range of 0.0095–0.02 Hz.17,10 The oscillations with frequency around 0.1 Hz correspond to the appearance of vasomotion – rhythmic oscillations in the vascular tone. 18 Vasomotions are caused by spontaneous rhythmic contractions of the vascular smooth muscles. These contractions are always preceded by changes in the membrane potential and intracellular free calcium concentration.19,20 The frequencies around 0.03 Hz correspond to the neurogenic activity. 21 Kastrup et al. 22 found out that the oscillations around 0.03 Hz disappeared after local and ganglionic nerve blockade in a chronically sympathectomized tissue in a human. The studies examining the effects of local anaesthesia by Landsverk et al. 23 supported the validity of the relation between the sympathetic activity and the spectral peak in the interval of 0.02–0.05 Hz. The frequencies around 0.01 Hz are associated with the NO-related endothelial activity. Based on the results of tests on simultaneous iontophoretic application of acetylcholine (ACh, an endothelium-dependent vasodilator) and sodium nitroprusside (SNP, endothelium-independent vasodilator), Kvernmo et al. 24 and Kvandal et al. 25 infer that the oscillations around 0.01 Hz evidently originate from the endothelial activity. By means of the spectral analysis, the LDF signal can be decomposed into components with different frequencies. The most widely used spectral methods are the fast Fourier transform, autoregressive modelling and wavelet analysis. A wavelet transform is a kind of ‘local’ Fourier transform, which allows us to isolate a given structure in the physical space and in the Fourier space. The localization property of wavelets makes the wavelet analysis capable of analysing the non-stationary systems and detecting the dynamical parameters. 26 In this article, we used the Morlet wavelet because it provides good time resolution at high frequencies and the best frequency resolution for low-frequency components.
A common approach for testing the endothelial function is to perform functional tests inducing local or systemic changes in the skin blood flow. The stimuli used are pharmacological and physical ones. The most important factors for local heating and cooling tests are flow-mediated vasodilatation or blood vessel vasoconstriction and variations of temperature. 27 The cold pressor test, as a natural constrictive test,28,29 allows us to estimate the adequacy of the endothelial, myogenic and neurogenic mechanisms of vascular tone regulation by studying low-frequency fluctuations of skin temperature. The objective of this study is to explore changes in the vascular tone over the endothelial, neurogenic and myogenic frequency ranges during a contralateral cold pressor test by performing a wavelet analysis of the skin temperature fluctuations and to compare the results obtained for healthy subjects and patients with IGT and type 2 diabetes.
Subjects and methods
Subjects
The control group (first group) consisted of 12 healthy men and women aged 39–60 years. Patients with cardiovascular diseases (myocardial infarction, angina pectoris, cerebrovascular diseases, peripheral arterial disease or cardiac insufficiency) and microvascular disorders (proteinuria and retinopathy in stages 2 and 3) were excluded from the investigation. The patients were examined at the Perm Endocrinology and Diabetes Clinic. Clinical and laboratory features are detailed in Table 1. The IGT group (second group) included 18 patients aged 31–60 years with IGT, who had a 2-h plasma glucose concentration of 7.8–11.0 mmol/L measured by an oral glucose tolerance test. The third group comprised 13 patients with type 2 diabetes aged 40–67 years (average diabetes duration of 10.6 ± 1.3 years) who used glucose-lowering medication: 8 used a combination of metformin and gliclazide, 2 received insulin therapy and 3 are treated with a combination of insulin and metformin. All patients in the third group have distal diabetic polyneuropathy.
Baseline patient characteristics.
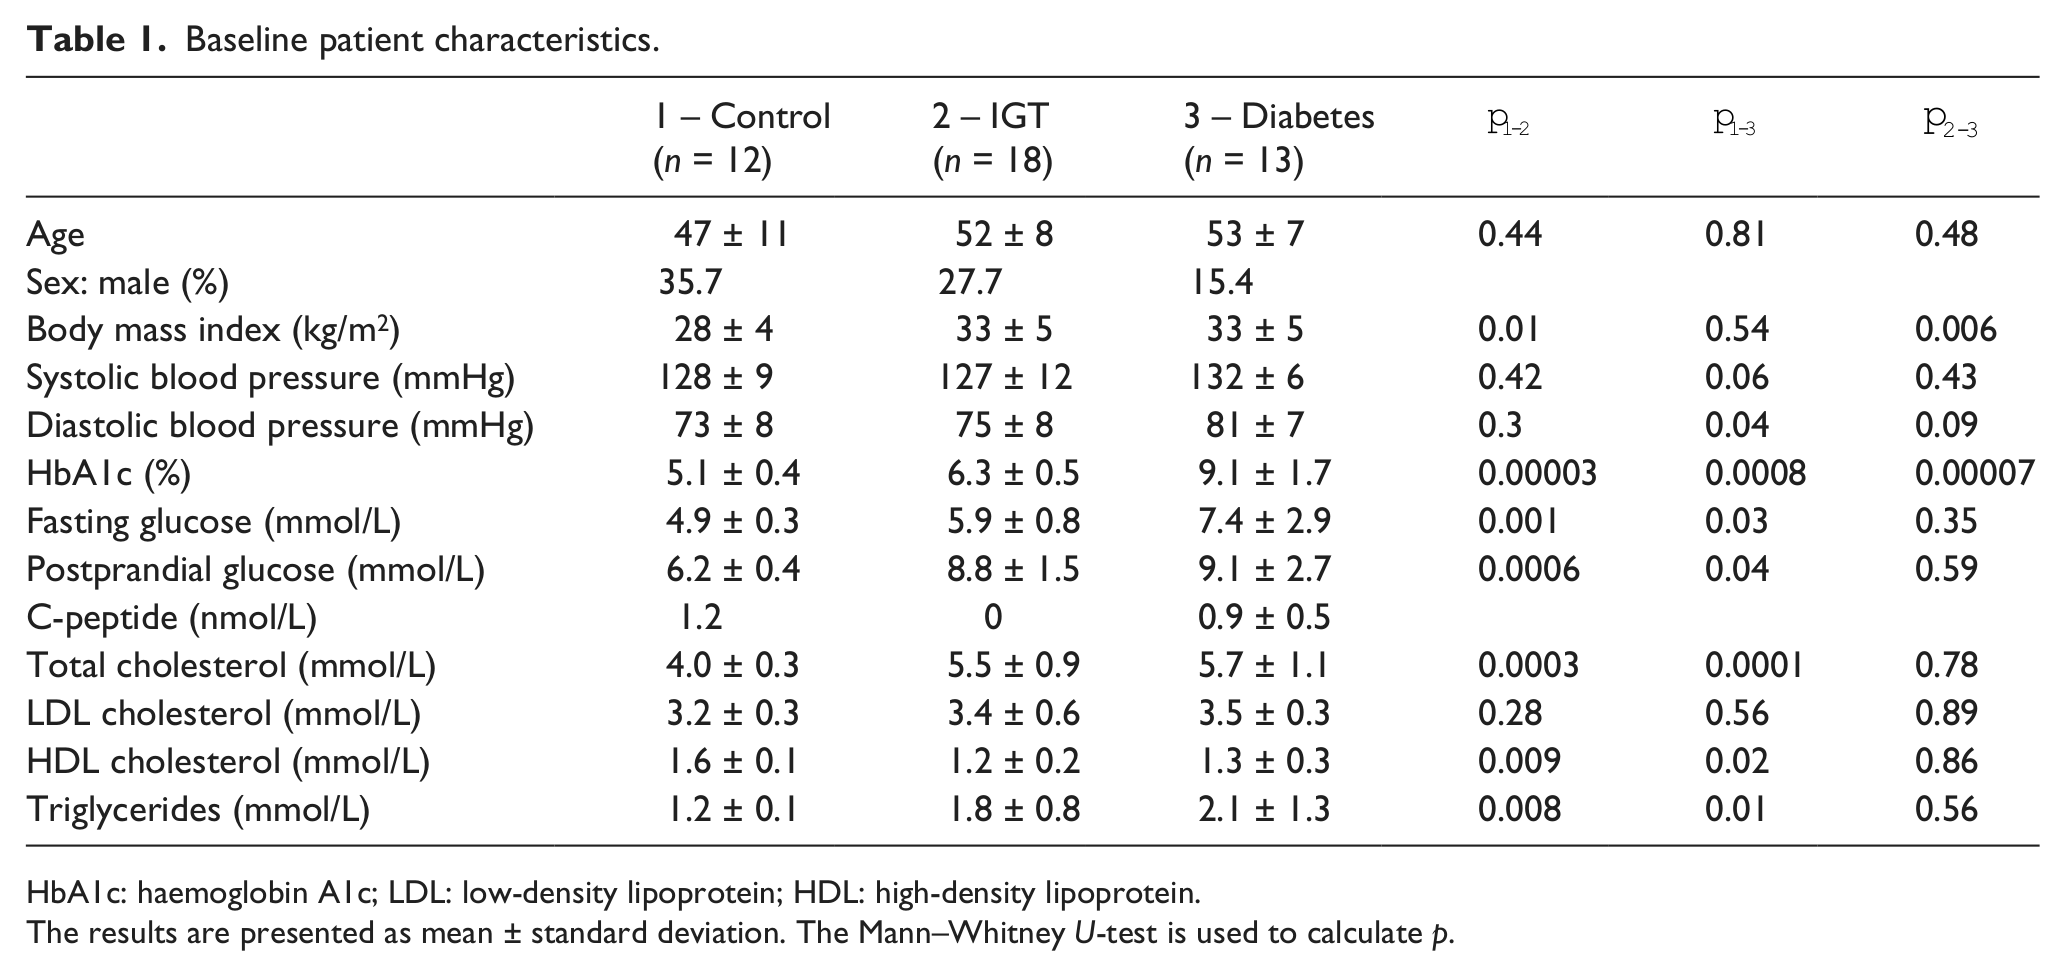
HbA1c: haemoglobin A1c; LDL: low-density lipoprotein; HDL: high-density lipoprotein.
The results are presented as mean ± standard deviation. The Mann–Whitney U-test is used to calculate p.
The study protocol was approved by the local ethics committee of the Perm State Medical Academy. All subjects gave written informed consent.
Measurement procedure
The tests were carried out at room temperature of 22.5°С ± 0.5°С. Measurements were made after a fast and 4-h abstinence from smoking. The patients did not take any medication affecting vascular tone (nitrates or calcium antagonists). During the contralateral cold test, the participants lay in the supine position. The skin temperature was measured on the palm surface of the distal phalanx of the index finger of the right hand. The output signals of the temperature sensor (HRTS-5760; Honeywell International, Inc., USA) were transmitted after amplification to the 18-bit bipolar analogue-to-digital converter (AD7793; Analog Devices, USA) scaled to ±5 V with sampling frequency of 200 Hz. For the temperature range of 20°C–40°C, with consideration for signal-to-noise amplifier ratio, the actual resolution of temperature was 0.005°C. During the measurements, all necessary precautions were taken to reduce the effect of external heat flows on the thermistor recording the skin temperature. The thermistor was placed in a specially designed plastic case (20 × 30 × 10 mm3) filled with a material with low thermal conductivity (λ < 0.02 W/(m K)) for its protection against ambient temperature variations. The case also allowed the sensors to be fixed on the skin surface with a medical plaster, which prevents sensor displacements during measurements. Cooling of the contralateral limb (left hand) minimized the motion artefacts of the sensor placed on the measured limb (right hand) and reduced the direct effect of cooling on the sensor during the registration procedure.
Temperature registration began after the establishment of a stationary thermal regime approximately 10 min after the beginning of the test. A distinct response to the cold test was recorded only if there was a sufficient degree of vasodilatation, which corresponds to a minimum initial skin temperature of 30°С. During the cold test, the left hand was immersed in a pan with an ice-water mixture (at 0°С) for 3 min. Skin temperature measurements were carried out continuously for 10 min before the test, for 3 min during the test and for 10 min upon completion of the test (Figure 1, upper panel).
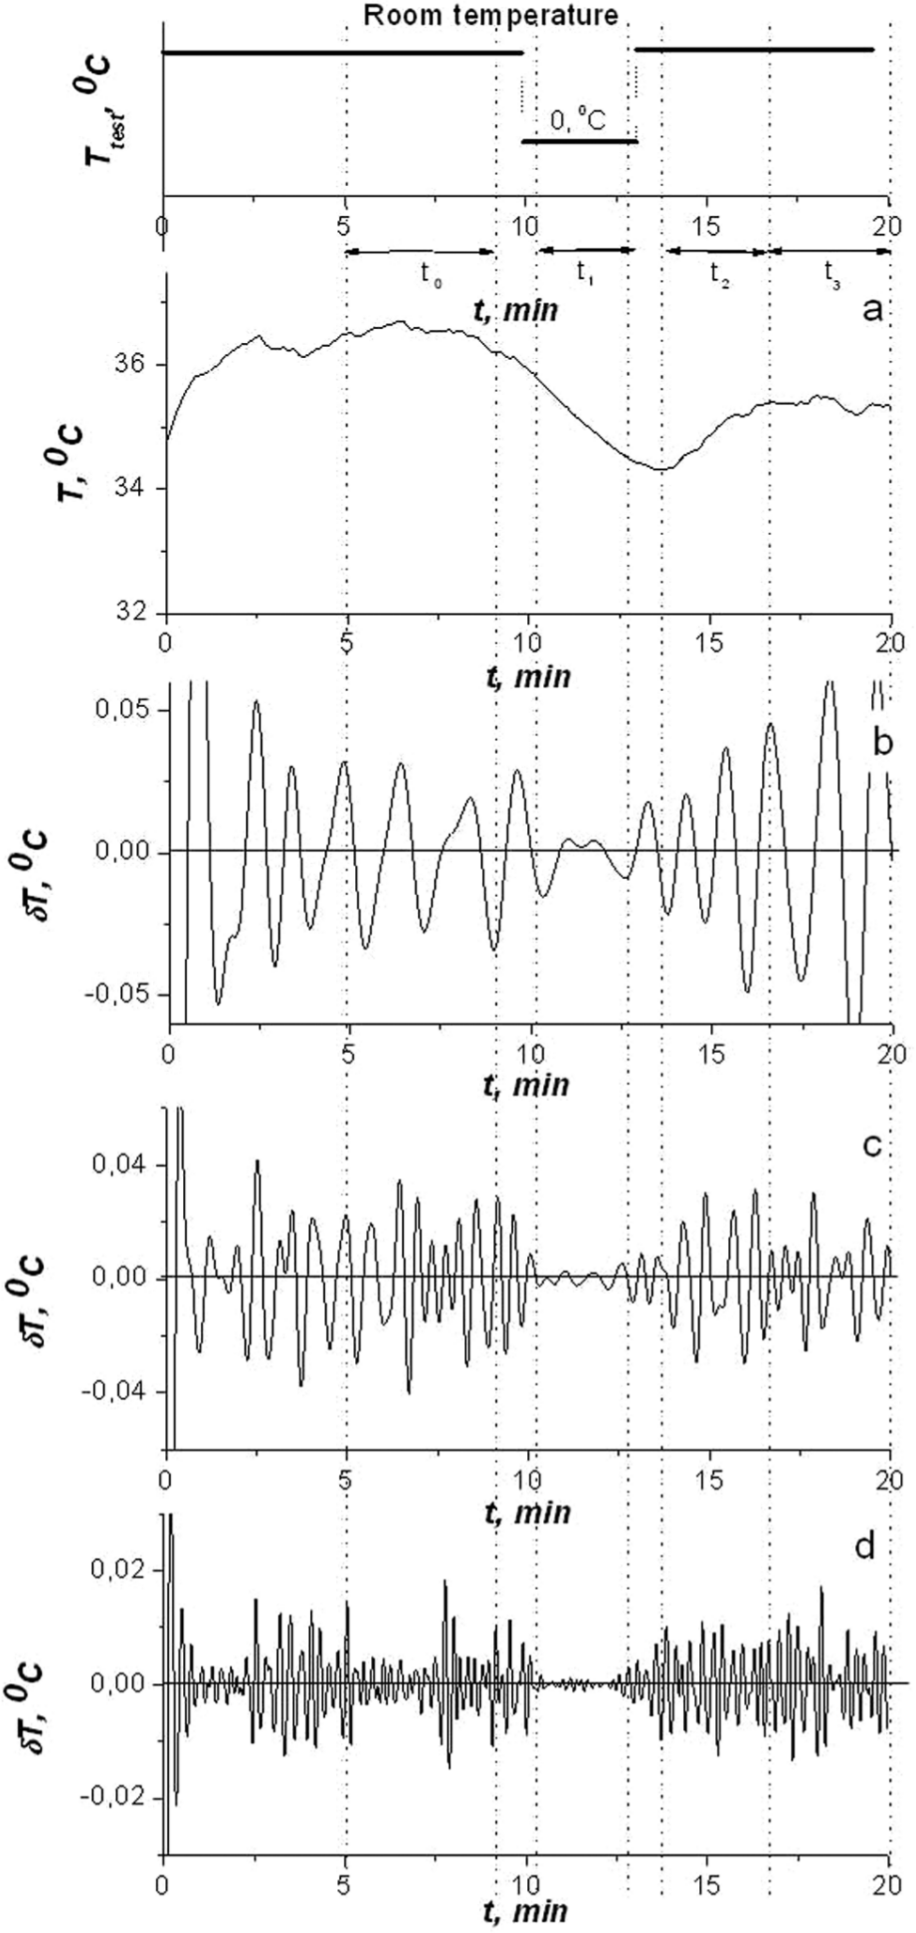
Typical skin temperature behaviour for a healthy person during the contralateral cold test. Upper panel: experimental design scheme. Lower panel: temperature of the left hand and time intervals. Panel (a): temperature record for the contralateral extremity. Panels (b, c and d): wavelet filtration of temperature in different frequency ranges – (b) endothelial range, (c) neurogenic range and (d) myogenic range.
Software and statistical analysis
A frequency–temporal analysis of temperature fluctuations was made using gapped wavelet analysis.30,31 It has several advantages over traditional time–frequency techniques based on Fourier analysis (e.g. short-term Fourier transform), including a tailored time and frequency resolution and a reduction in the spectral cross-terms. 26
We applied the inverse wavelet transform in order to reconstruct the signals reflecting the myogenic, neurogenic and endothelial activities (Appendix 1). Each of the three signals is quasi-periodic signal consisting of a sum of harmonics in the appropriate frequency range. For this task, wavelet transforms are made with respect to a Morlet mother wavelet. When choosing parameters for the Morlet wavelet, care must be taken to ensure the balance between the time and frequency resolution. In this work, we restricted ourselves to a relatively short duration of cold test (180 s) and a maximum scale of pulsation (70 s – the mean period of oscillation, caused by endothelial activity). Morlet wavelet (10) with κ = 1 provides a rather good time resolution for this case, but insufficient frequency resolution, which as a result leads to overlapping of the frequency ranges. To diminish this effect, the boundaries of the frequency ranges were corrected (in comparison with Shiogai et al. 10 ) in the following way: myogenic frequency range = 0.14–0.07 Hz, neurogenic = 0.031–0.026 Hz and endothelial = 0.0139–0.0095 Hz.
After mathematical processing of the signal, we obtained fluctuations in three frequency ranges corresponding to myogenic, neurogenic and endothelial mechanisms of vascular tone regulation. The contribution of different mechanisms of vascular tone regulation was estimated in terms of the mean-square amplitudes of the skin temperature oscillations δT in the corresponding frequency range.
The mean-square amplitudes of the fluctuations were calculated over four time intervals (Figure 1(a)). The base level interval of 300–500 s (t0) was selected with reference to the time needed to establish a stationary thermal regime in the system before the cold test. During this time, the patient was in a quiescent state, and the mean-square amplitudes of fluctuations obtained during this time were used as a reference level for calculating relative changes in the amplitudes during and after the test. The response to the cold test was registered during the interval t1 (650–730 s). After termination of the cold test, two intervals were used to estimate the dynamics of the recovery recreation process: interval t2 was the first 3 min after the cold test (830–960 s) and interval t3 was 6 min after exposure to cold (960–1100 s). Details of the experimental scheme are presented in the upper panel of Figure 1.
The response of each mechanism of vascular tone regulation was estimated in terms of relative changes in the mean-square amplitudes of temperature fluctuations in comparison with the mean-square amplitudes under basal conditions (time interval t0)
The original algorithms of the wavelet analysis were realized in C++. The data are represented as M ± SD, where M is the average mean value and SD is the standard deviation.
A comparison between groups was made using a non-parametric statistic (the Mann–Whitney U-test).The Wilcoxon test was used for comparison of paired data,p values < 0.05 were considered statistically significant. Statistical analysis was performed using Mathematica 7.0 and statistical software STATISTICA 6.0.
Results
The typical skin temperature as a function of time for a healthy person during the indirect cold test is given in Figure 1, upper panel. Figure 1(b) to (d) shows the results of wavelet filtration of the temperature fluctuations δT depicted in Figure 1(a) for the frequency ranges corresponding to the endothelial (Figure 1(b)), neurogenic (Figure 1(c)) and myogenic (Figure 1(d)) mechanisms of vascular tone regulation in healthy people.
Under stationary conditions (interval t0), the temperature is liable to fluctuations. During the cold test (interval t1), the temperature of the contralateral limb decreases, and simultaneously, the amplitudes of the fluctuations in the frequency ranges decrease (Figure 1(b) to (d)). After termination of the cold tests (intervals t2 and t3) throughout the recovery period of approximately 3 min, the temperature rises and the intensity of fluctuations increases.
During the cold test for all groups, no significant changes of the mean temperature in the time intervals were recorded (Table 2). It is evident that the mean temperature dynamics in both healthy and non-healthy patients undergoing cold test is practically the same, and therefore, the absolute magnitudes are of low informative value. Unlike the analysis of the average values of temperature, the frequency analysis of the skin temperature fluctuations allows us to gain differential information on the vascular response to the cold test. In the control group, during the cold test, the amplitude of the skin temperature fluctuations in the endothelial, the neurogenic and myogenic ranges decreased and then recovered to the initial values within 3 min (Table 3, Figure 1).
Mean values of the right index finger skin temperature (°C) in the different time intervals for the three investigated groups during the contralateral cold test.
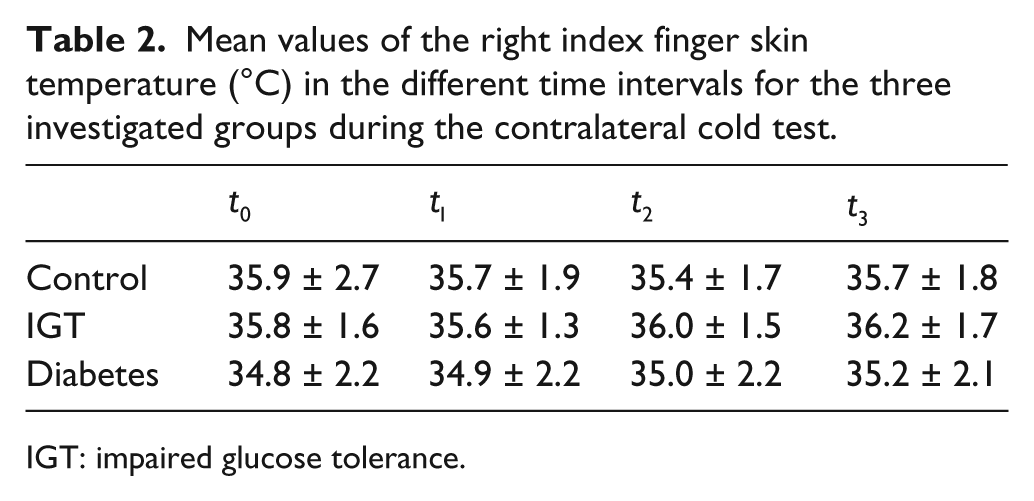
IGT: impaired glucose tolerance.
Relative skin temperature oscillation amplitudes κ in the endothelial, neurogenic and myogenic frequency ranges in the t1, t2 and t3 time intervals for different groups of patients.
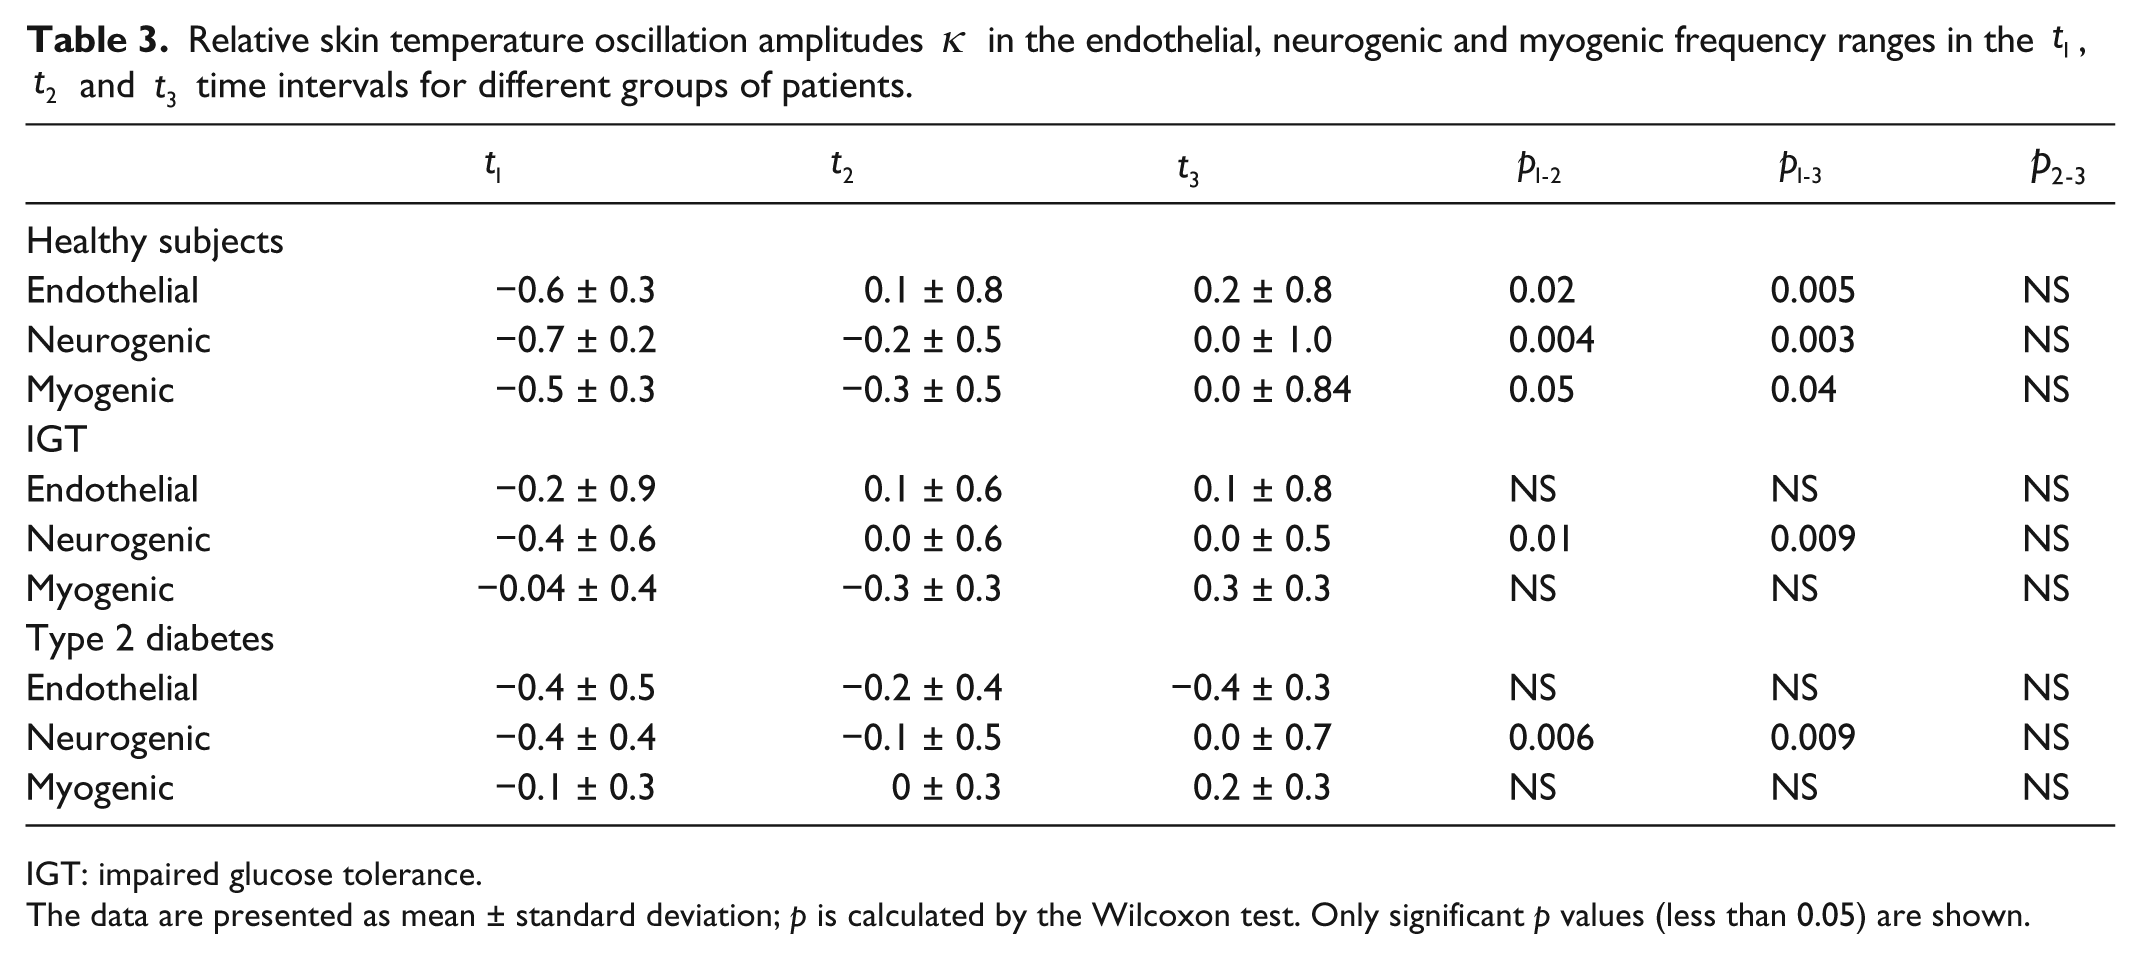
IGT: impaired glucose tolerance.
The data are presented as mean ± standard deviation; p is calculated by the Wilcoxon test. Only significant p values (less than 0.05) are shown.
The response to the cold test studied in patients with type 2 diabetes (group 3) differed from that of healthy people. After a decrease, the amplitudes of the skin temperature fluctuations did not recover except for the neurogenic range (Figure 2). In the endothelial and myogenic ranges, the increase of the amplitudes after the test was unreliable. Furthermore, during the next 10 min, the amplitudes of the fluctuations did not increase. In the neurogenic range, after the completion of the test, the amplitudes of fluctuations increased and reached their initial values.
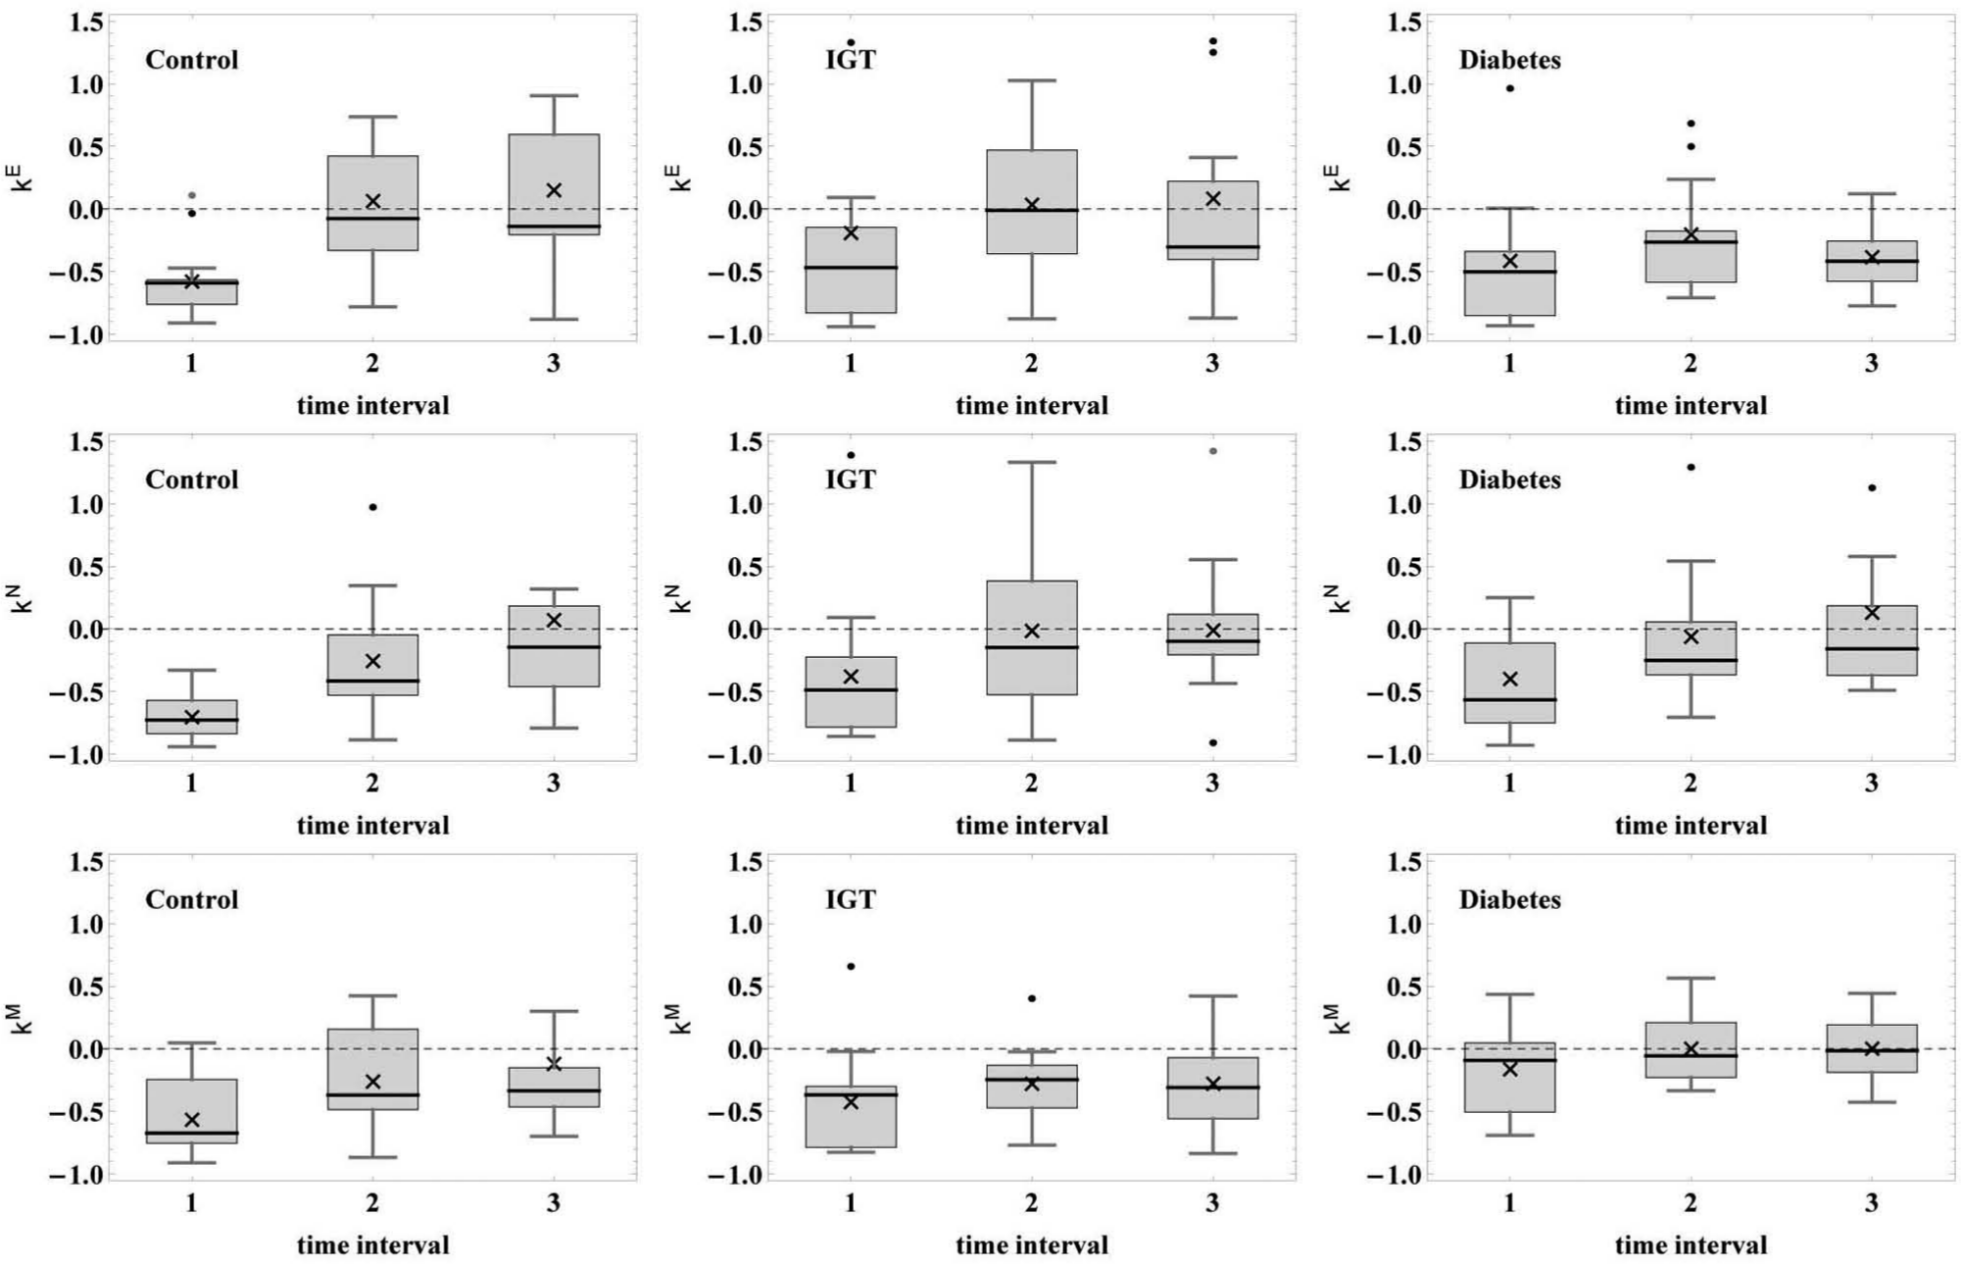
Box-and-whisker plots show the reaction to the cold test, κ is on the ordinate axis, time intervals (t1, t2, t3) are marked on the abscissa axis. Left column: healthy subjects (Group 1); middle column: IGT patients (Group 2); right column: patients with type 2 diabetes (Group 3). Upper row: endothelial range; middle string: neurogenic range; lower string: myogenic range. Crosses in the figures show the mean values, thick horizontal lines are the median values. Box boundaries 25 and 75, whiskers 1 and 99 percentages. Zero level of κ is shown by the horizontal dashed line.
The results for IGT patients (group 2) were similar to the results for group 3 (Table 3). After cessation of cold exposure, we obtained reliable difference between the amplitudes of the fluctuations during the cold test and the amplitudes observed within the first 3 min in the neurogenic range, and then, the temperature fluctuations reached their initial values. In the endothelial and myogenic ranges, the amplitudes of the fluctuations decreased, and their subsequent increase was of unreliable character compared to the amplitudes of the fluctuations during the cold test. Hence, the absence of a statistically significant difference in the amplitudes of the skin temperature fluctuations in the endothelial and myogenic ranges during and after the cold pressor test suggests that the impairments of the vasodilation mechanisms in patients with type 2 diabetes and IGT patients are of a similar character.
The wavelet spectrum analysis of the temperature records obtained in control group revealed the shift of myogenic frequency. The myogenic oscillation frequency was 0.097 ± 0.007 Hz during rest (time interval t0) and 0.090 ± 0.009 Hz in the cold test (р < 0.05). During the recovery period (t2), the myogenic frequency increased and became equal to 0.094 ± 0.008 Hz (differences in the pairs t0–t2 and t2–t1 are not significant), and in the time interval t3, this value was equal to 0.090 ± 0.010 Hz (differences are also not significant). These results are in qualitative agreement with the observations discussed in Sheppard et al. 15 However, some data sets do not contain distinct maxima in the energy spectra of temperature oscillations, which are required to define adequately the frequency shift; therefore, we investigated nine temperature records of control subjects, four records of the IGT group and six records of the diabetes group. The data showed that the myogenic frequency shift obtained for these groups was not significant. These are only preliminary results, which may be used as a basis for a more comprehensive investigation.
Discussion
One of the most significant functions of the endothelium is to provide adequate cardiovascular tone, which is affected by different internal and external factors. In this study, the cold test plays the role of a physiological pressor agent. A massive stimulation of thermoreceptors during exposure to cold leads to activation of the sympathetic tone and a moderate increase of catecholamines in the blood plasma, but does not increase the frequency of the heartbeat. These processes may cause vasoconstriction (in arteries, arterioles and arteriovenous anastomoses) and possibly raise the arterial blood pressure.27,32
Our investigation showed that vasoconstriction during the cold test in patients without obvious vascular and metabolic disorders is accompanied by a decrease in the amplitudes of the skin temperature fluctuations. After completion of cold exposure, the amplitudes regain their initial values in the myogenic, neurogenic and endothelial frequency ranges. This reaction can be considered to be an adequate response to the cold pressor test. The group of patients with type 2 diabetes was characterized by impaired reactions in the endothelial and myogenic frequency ranges. In the neurogenic frequency range, the amplitudes of oscillations decrease but to a lesser extent compared to the control group. We consider these changes to be due to an impairment of the vasodilator mechanisms in patients with endothelial dysfunction. Differences in body mass index (BMI), blood pressure and lipids could contribute to vascular reactions, but we did not observe a correlation of these parameters and the endothelial reaction to the cold pressor test because of rather small and heterogeneous groups for the statistically meaningful correlation analysis. Changes in lipid levels and arterial pressure were typical for diabetes, IGT and could certainly influence the endothelial dysfunction. However, most authors support the idea that hyperglycaemia (postprandial and fasting) is the major factor responsible for vascular dysfunction.33–35
Long-lasting hyperglycaemia stimulating a polyol pathway of the glucose exchange essentially reduces the amount of glutathione and nicotinamide adenine dinucleotide phosphate (NADPH) in endothelial cells. Moreover, hyperglycaemia intensifies the activity of diacylglycerol and protein kinase С, which inhibit NO synthase and reduce NO production. Chronic hyperglycaemia facilitates the creation of glycohaemoglobin and other products of final glycosylation, which lower NO activity, and is another additional factor in the impairment of the endothelial function. 36 When the endothelium is exposed to hyperglycaemia, an array of negative intracellular events facilitates its dysfunction. In diabetic patients, the exposure of coronary circulation to increasing amounts of ACh results in a paradoxical constriction instead of vasodilation. Contraction instead of vasodilation induced by ACh is mediated via the M3 subtype of muscarinic receptors in coronary arteries when endothelial integrity is lost. This response suggests that endothelial cells exposed to hyperglycaemia are involved in the apoptotic process, leading to intimal denudation. 37
However, diabetes mellitus is characterized by the development of complications such as autonomic neuropathy, which manifests as an impairment of vascular tone regulation by the parasympathetic and sympathetic nervous systems. Presumably, the high concentration of glucose in the blood plasma blocks the adrenoceptors in blood vessels, which reduces their ability to contract in response to the actions of catecholamines and other vasoconstrictors. 2 Indirect evidence for the impairment of thermoregulatory control of skin blood flow in patients with type 2 diabetes has been presented in a number of articles, which includes disorders of the sympathetic control of diaphoresis and arterial blood pressure. 28
Therefore impaired vasodilatation in patients with type 2 diabetes can be considered both as a reduction in the content of vasoactive substances (NO and prostacyclin) and the prevalent activity of the sympathetic nervous system dysfunction, which is associated with autonomic neuropathy in the skin. 38
IGT patients have diabetes-like changes in the amplitudes of skin temperature fluctuations in the endothelial frequency range while the physiological reaction in the neurogenic range remains invariant. These data suggest that the endothelial dysfunction has already developed in the preclinical diabetes stage, and the progression of glucose metabolism disorders aggravates the pathological process, which causes impairment of the endothelial and myogenic effects of vasodilation.
Possible causes of weakening the myogenic frequency pulsations during cooling are investigated in Sheppard et al. 15 There seems to be several reasons for the immediate decrease in the frequency of the myogenic oscillations in the skin blood flow due to cooling. First, the reduced perfusion slows down the metabolic activity in the smooth muscle fibres and thus causes a decrease in the rate of their spontaneous oscillations; second, the reduced frequency of oscillation is a homeostatic response to cooling, which tends to increase the effective vascular resistance and reduces blood flow. Another possible reason of this effect is that despite the fact that cyclic myogenic variations of blood flow are related to spontaneous changes in the tone of arterioles, they might be modulated by sympathetic nerve activity. 19 Therefore, the central nervous system can exert a certain action on the vasomotion frequency under in vivo conditions. This may possibly be of pathophysiological significance since the vascular dysfunction in diabetes is correlated with the development of diabetic neuropathy, and vasomotion disappears simultaneously with the appearance of neuropathy. 39 The differences in myogenic frequency changes obtained for the control group, IGT and diabetes subjects can serve as additional diagnostic criteria, but they require a more detailed investigation.
Study limitations
Special emphasis should be placed on the limitations inevitably occurring in our investigations. First, the sample size was relatively small. Second, the study was mainly done on female population; no gender differences were taken into account during the cold pressor test. However, as it is shown in Shiogai et al., 10 the blood flow dynamics and cardiovascular reactions such as endothelium-dependent vasodilation are related to gender differences.
Conclusion
We have developed a new technique for assessing endothelial dysfunction, which is based on the analysis of skin temperature fluctuations. The method has high sensitivity in detecting abnormal endothelial function, and thus, it should be developed further and verified in practical applications. Cold exposure in subjects without vascular pathology leads to a reduction of skin temperature fluctuation amplitudes in the endothelial, neurogenic and myogenic frequency ranges, which afterwards return to their initial values. In patients with type 2 diabetes and IGT patients, after termination of cold exposure, the amplitudes of skin temperature fluctuations in the endothelial and myogenic frequency ranges do not recover during testing. This can be thought of as an impairment of vasodilatation and a symptom of endothelial dysfunction.
The impaired response to the cold pressor test in the endothelial frequency range for skin temperature fluctuations is the evidence of progressive endothelial dysfunction and can be considered as the earliest manifestation of vascular disorders.
Footnotes
Appendix 1
Declaration of conflicting interests
The authors have no conflicts of interest to declare.
Funding
This work was supported by the Russian Foundation of Basic Research (RFBR-Ural 13-04-96022).