
Abstract
Background:
Serum uric acid has shown to be a predictor of renal disease progression in most but not all studies. This study aims to test whether renal function-normalized serum uric acid is superior to serum uric acid as the predictor of incident chronic kidney disease in type 2 diabetes mellitus patients.
Methods:
In this study, 1339 type 2 diabetes mellitus patients with estimated glomerular filtration rate ⩾60 mL/min/1.73 m2 and normouricemia were included. Renal function-normalized serum uric acid was calculated using serum uric acid/creatinine. Cox regression analysis was used to estimate the association between serum uric acid, renal function-normalized serum uric acid and incident chronic kidney disease.
Results:
In total, 74 (5.53%) patients developed to chronic kidney disease 3 or greater during a median follow-up of 4 years, with older ages, longer diabetes duration and lower estimated glomerular filtration rate at baseline. The decline rate of estimated glomerular filtration rate was positively correlated with serum uric acid/creatinine (r = 0.219, p < 0.001), but not serum uric acid (r = 0.005, p = 0.858). Moreover, multivariate analysis revealed that serum uric acid was not an independent risk factor for incident chronic kidney disease (p = 0.055), whereas serum uric acid to creatinine ratio was significantly associated with incident chronic kidney disease independently of potential confounders including baseline estimated glomerular filtration rate.
Conclusion:
serum uric acid to creatinine ratio might be a better predictor of incident chronic kidney disease in type 2 diabetes mellitus patients.
Introduction
Diabetes mellitus is the leading cause of chronic kidney disease (CKD) globally. 1 In recent years, increasing evidence shows that serum uric acid (SUA) is a predictor of renal injuries in both non-diabetic and diabetes patients.2–5 Elevated SUA level is associated with increased risks of incident CKD6,7 and end-stage renal disease (ESRD). 8 In patients with type 1 diabetes, SUA is associated with reduced glomerular filtration rate (GFR) and increases the risk of early progressive renal function loss.9,10 High SUA was also associated with impaired renal function in type 2 diabetes patients. 11 Both hyperuricemia and high-normal SUA predict the development and progress of CKD in patients with type 2 diabetes and preserved kidney function.4,5
More evidence comes from the results of randomized controlled trials (RCTs). In a post hoc analysis of the Reduction of End Points in Non-Insulin-Dependent Diabetes Mellitus With the Angiotensin II Antagonist Losartan (RENAAL) Trial, the risk of renal events was decreased by 6% per 0.5 mg/dL decrement in SUA treated with losartan. 12 Two other clinical trials also provided proof of lowering SUA may slow the progression of kidney disease, showing that patients treated with allopurinol had significant more stable renal function compared to placebo arms.13,14
However, debate still remains because some studies showed conflicted results. The Cardiovascular Health Study (CHS) reported no association between SUA and incident CKD, 15 and the Modification of Diet in Renal Disease (MDRD) Study also failed to find SUA as an independent predictor for progression of chronic renal failure after a 10-year follow-up in 840 individuals with stage 3–4 CKD. 16 One possible explanation for this inconsistence is that SUA usually increases in kidney disease and adjustment for measured GFR in MDRD study may offset the potential association. 17
Given the fact that renal clearance of SUA is often impaired during kidney injury, renal function is the major confounder in studies for the association between SUA levels and CKD progress. 18 Thus, we tried to generate new indexes using renal function-normalized SUA and tested whether they are superior to SUA as the predictor of incident CKD in type 2 diabetes patients with preserved kidney function.
Materials and methods
Patients
The present retrospective longitudinal study was conducted within the framework of the Staged Diabetes Targeting Management (SDTM) Study,19,20 which was started since 2005 as a continuous structured diabetes care programme for outpatient diabetes management in Jiangsu Province Official Hospital, aiming to document all the risk factors, medical interventions, complications and clinical outcomes of diabetes patients in the real-world practice in Nanjing, China. All patients were managed according to the Staged Diabetes Management protocol adopted from the International Diabetes Center (Minneapolis, USA), 21 and the clinical information at each visit was recorded online (www.chinasdtm.com). The study protocol has been approved by the Ethical Committee, Jiangsu Province Institute of Geriatrics, Nanjing. Informed consent was obtained from all patients at the time of first assessment to allow the use of their data for research purposes.
Until September 2014, a total of 3284 diabetic patients were included in the SDTM study. After excluding those who had a history of type 1 diabetes, cancer, haematological diseases, CKD of stage 3–5 (estimated glomerular filtration rate (eGFR) < 60 mL/min/1.73 m2) at baseline, hyperuricemia (SUA > 8 mg/dL), on uric acid–lowering medications or incomplete data for key variables (SUA and serum creatinine (Scr)) during the follow-up, 1339 patients with type 2 diabetes, preserved kidney function (eGFR ⩾ 60 mL/min/1.73 m2) and normouricemia were pooled for the final analysis.
Clinical and laboratory data
Simple physical examinations including body weight, height and blood pressure (BP) measurement were carried out by the diabetes nurses. Body mass index (BMI) was calculated by dividing weight (kg) by the square of height (m). BP was measured with a standard mercury manometer after at least 5 min of rest. Details on personal information, disease history and current use of medications were also obtained from all patients through interviews by the nurses.
Blood tests were carried out after an overnight fasting for plasma glucose (PG), lipid profiles, SUA, complete blood count, renal/liver functions and glycated haemoglobin (HbA1c). Fasting plasma glucose (FPG), total cholesterol (TC), triglycerides (TG), high-density lipoprotein cholesterol (HDL-C), low-density lipoprotein cholesterol (LDL-C), SUA and Scr were measured using Hitachi 7060 automated analyser (Hitachi Koki Co. Ltd., Hitachinaka City, Japan). HbA1c was measured by Bio-rad Diamat high-performance liquid chromatography analyser (Bio-Rad Labs, Brea, CA, USA).
Estimated GFR (eGFR) was calculated using the CKD-Epidemiology Collaboration (CKD-EPI) creatinine equation. 22 Renal function-normalized SUA were calculated using SUA/Scr or SUA*eGFR/100. Incident CKD was defined as the occurrence of an eGFR <60 mL/min/1.73 m2. The decline rate of eGFR per year was calculated as (eGFR at baseline − eGFR at last visit)/years of follow-up.
Statistical analysis
Statistical analysis was conducted using the SPSS (version 15.0) software. All data are expressed as mean ± standard deviation (SD), median (interquartile range) or percentage, where appropriate. Rates were compared using the χ2 test and means using Student’s t-test. Variables not normally distributed were analysed using non-parametric tests (Mann–Whitney’s U-test). Cox’s hazards regression analysis was used to evaluate the association between SUA, renal function-normalized SUA and incident CKD. All the variables included for multivariate Cox regression models are described in the ‘Results’ section.
Results
Of the 1339 subjects, there were 914 (68.3%) men and 425 (31.7%) women. Their mean age was 61.8 ± 11.5 years. During a median follow-up of 4 years (inter-quartile range: 28–62 months), 74 (5.53%) patients developed to CKD 3 or greater with an eGFR <60 mL/min/1.73 m2. During the follow-up, 32 (2.39%) patients died. All of them were evaluated for the progression of renal disease using the last available data in the clinic visits.
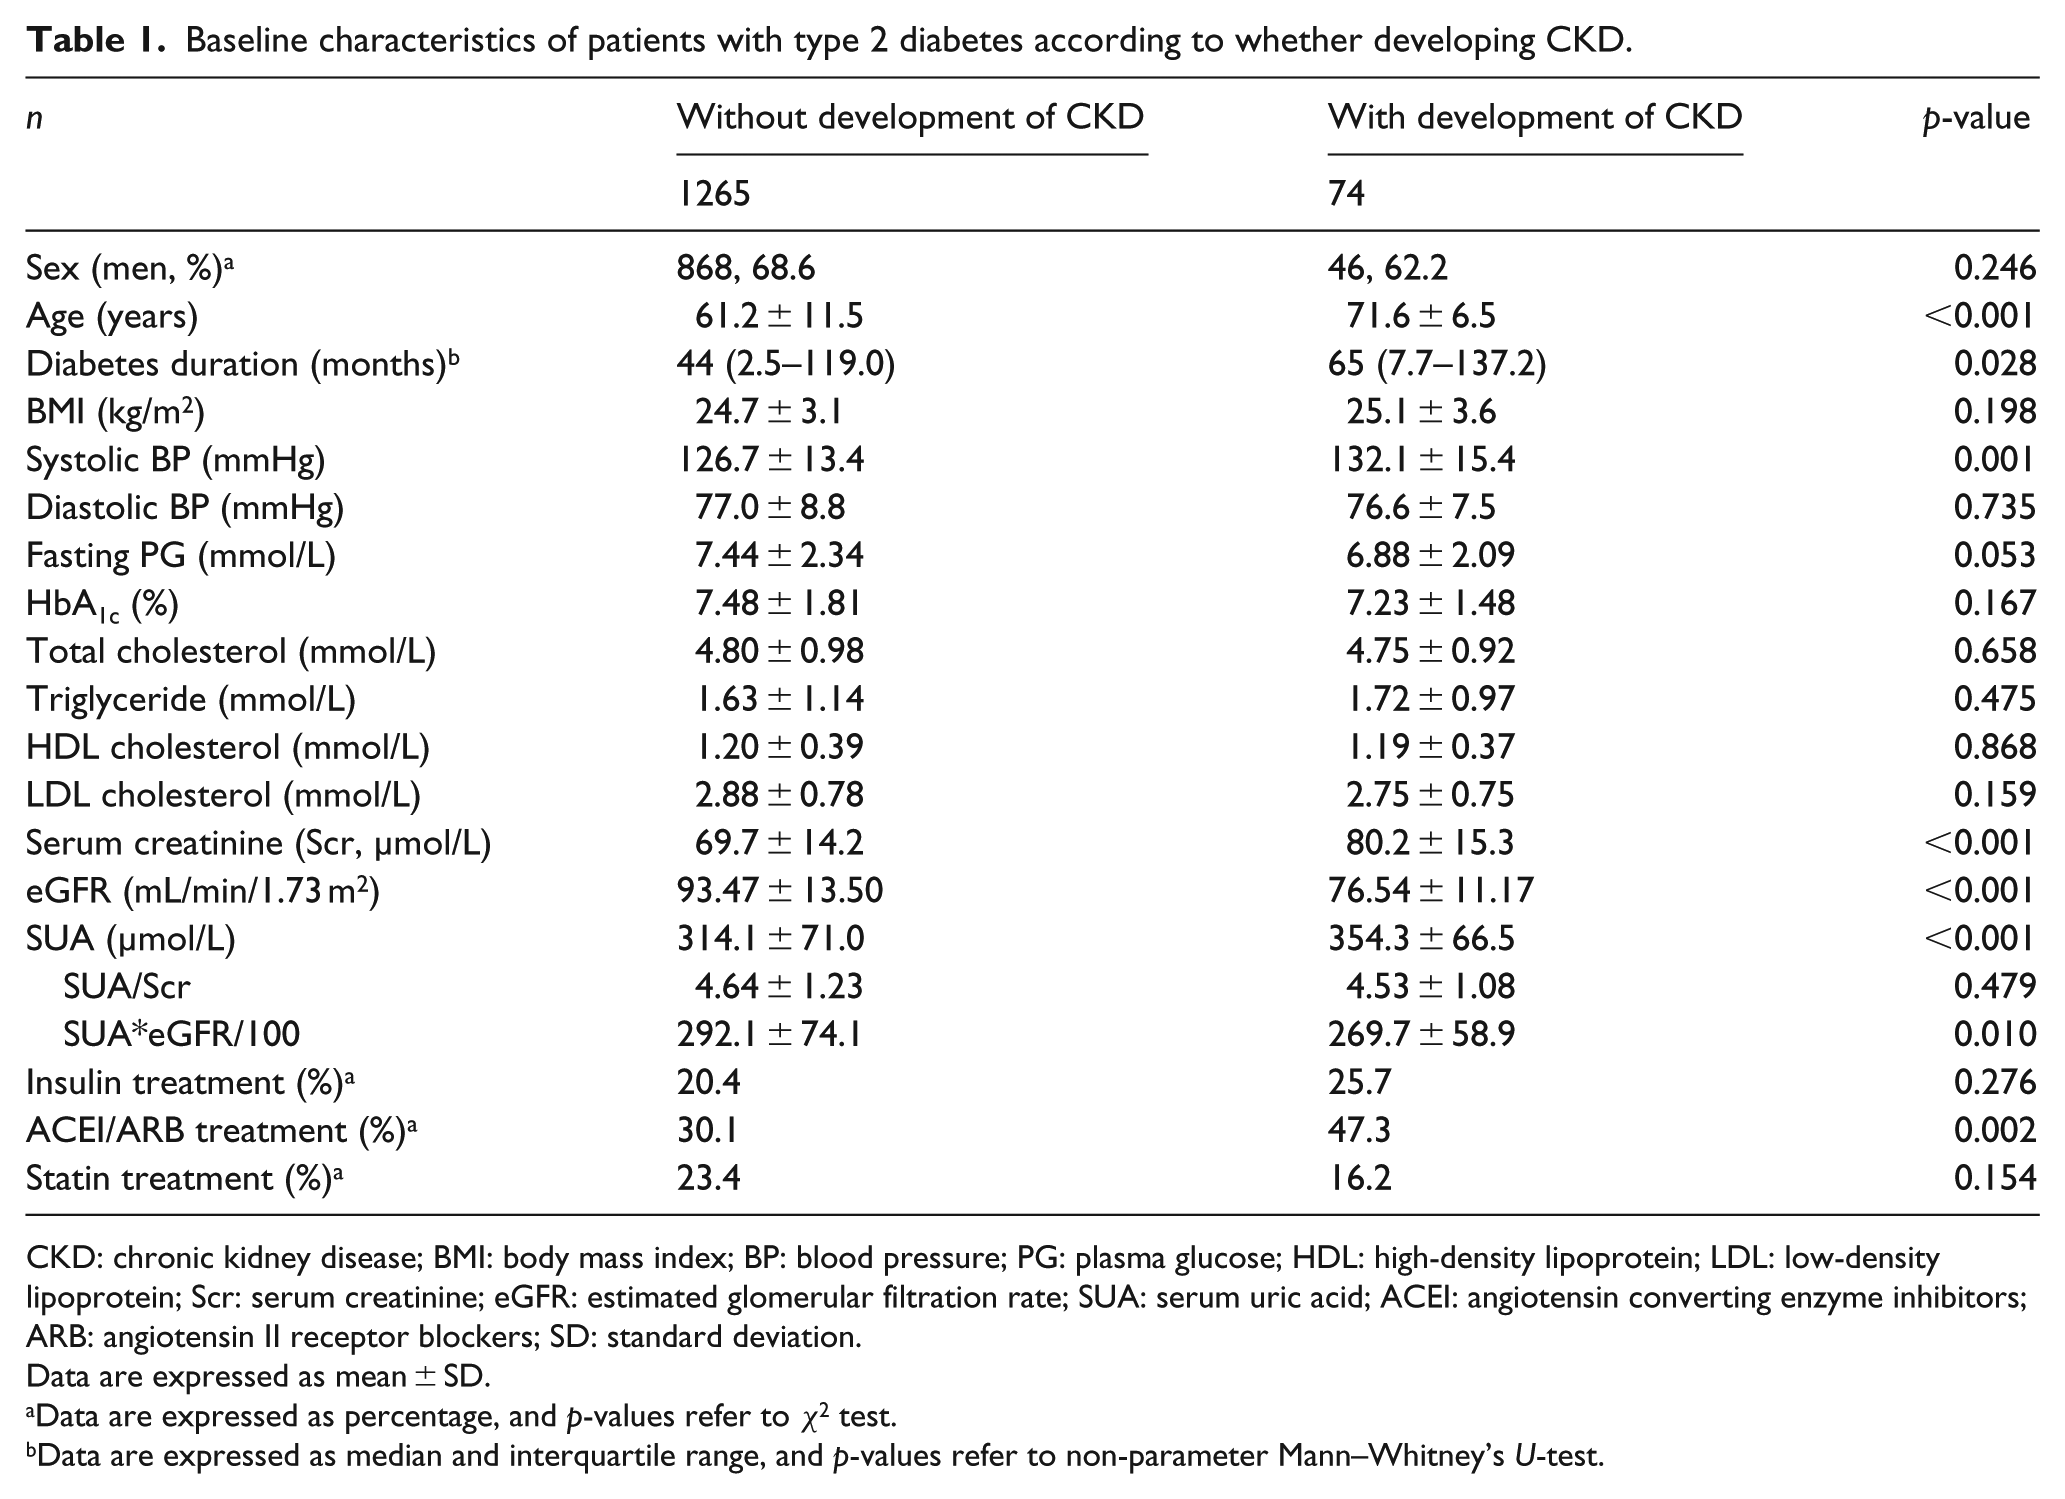
Table 1 summarizes the baseline characteristics of patients grouped by incidence of CKD. Compared with those without development of CKD, patients with incident CKD had higher systolic BP, lower eGFR but higher Scr and longer durations of diabetes at the baseline. There were more older-age patients in this group, and they were more likely to be treated with angiotensin converting enzyme inhibitors (ACEI) or angiotensin II receptor blockers (ARB). Interestingly, SUA levels were significantly higher in those developed to CKD 3 or greater (p < 0.001), but the difference became weaker as for renal function-normalized SUA (SUA/Scr, p = 0.479; and SUA*eGFR, p = 0.010). However, as shown in Figure 1, correlative analysis showed that there was no significant correlation between baseline SUA and decline rate of eGFR during the follow-up (r = 0.005, p = 0.858), whereas both renal function-normalized SUA indexes were positively correlated with the rate of eGFR decline (r = 0.219, p < 0.001; r = 0.138, p < 0.001, respectively).
Baseline characteristics of patients with type 2 diabetes according to whether developing CKD.
CKD: chronic kidney disease; BMI: body mass index; BP: blood pressure; PG: plasma glucose; HDL: high-density lipoprotein; LDL: low-density lipoprotein; Scr: serum creatinine; eGFR: estimated glomerular filtration rate; SUA: serum uric acid; ACEI: angiotensin converting enzyme inhibitors; ARB: angiotensin II receptor blockers; SD: standard deviation.
Data are expressed as mean ± SD.
Data are expressed as percentage, and p-values refer to χ2 test.
Data are expressed as median and interquartile range, and p-values refer to non-parameter Mann–Whitney’s U-test.
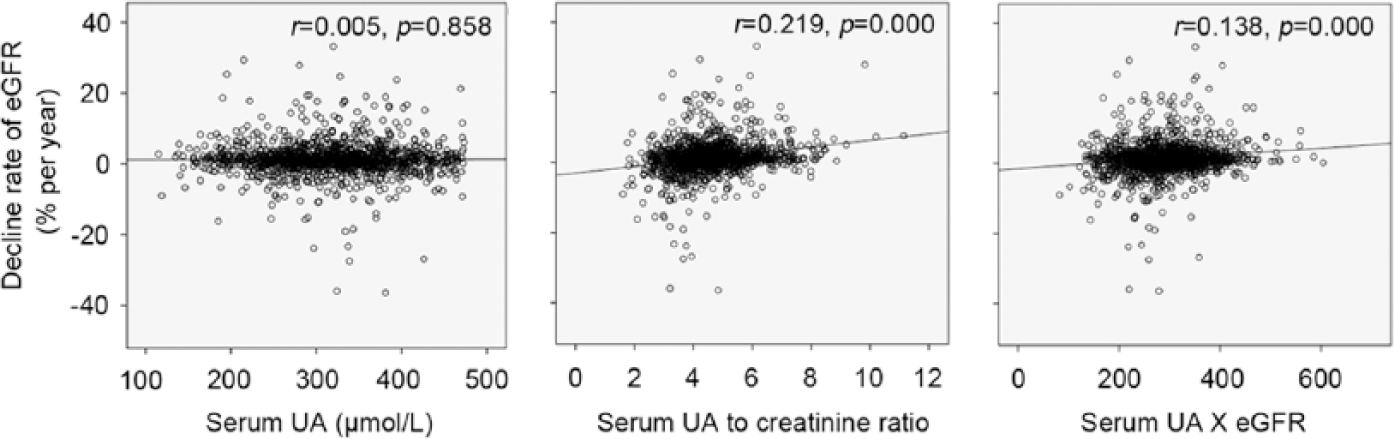
Correlation between decline rate of eGFR and SUA-related parameters.
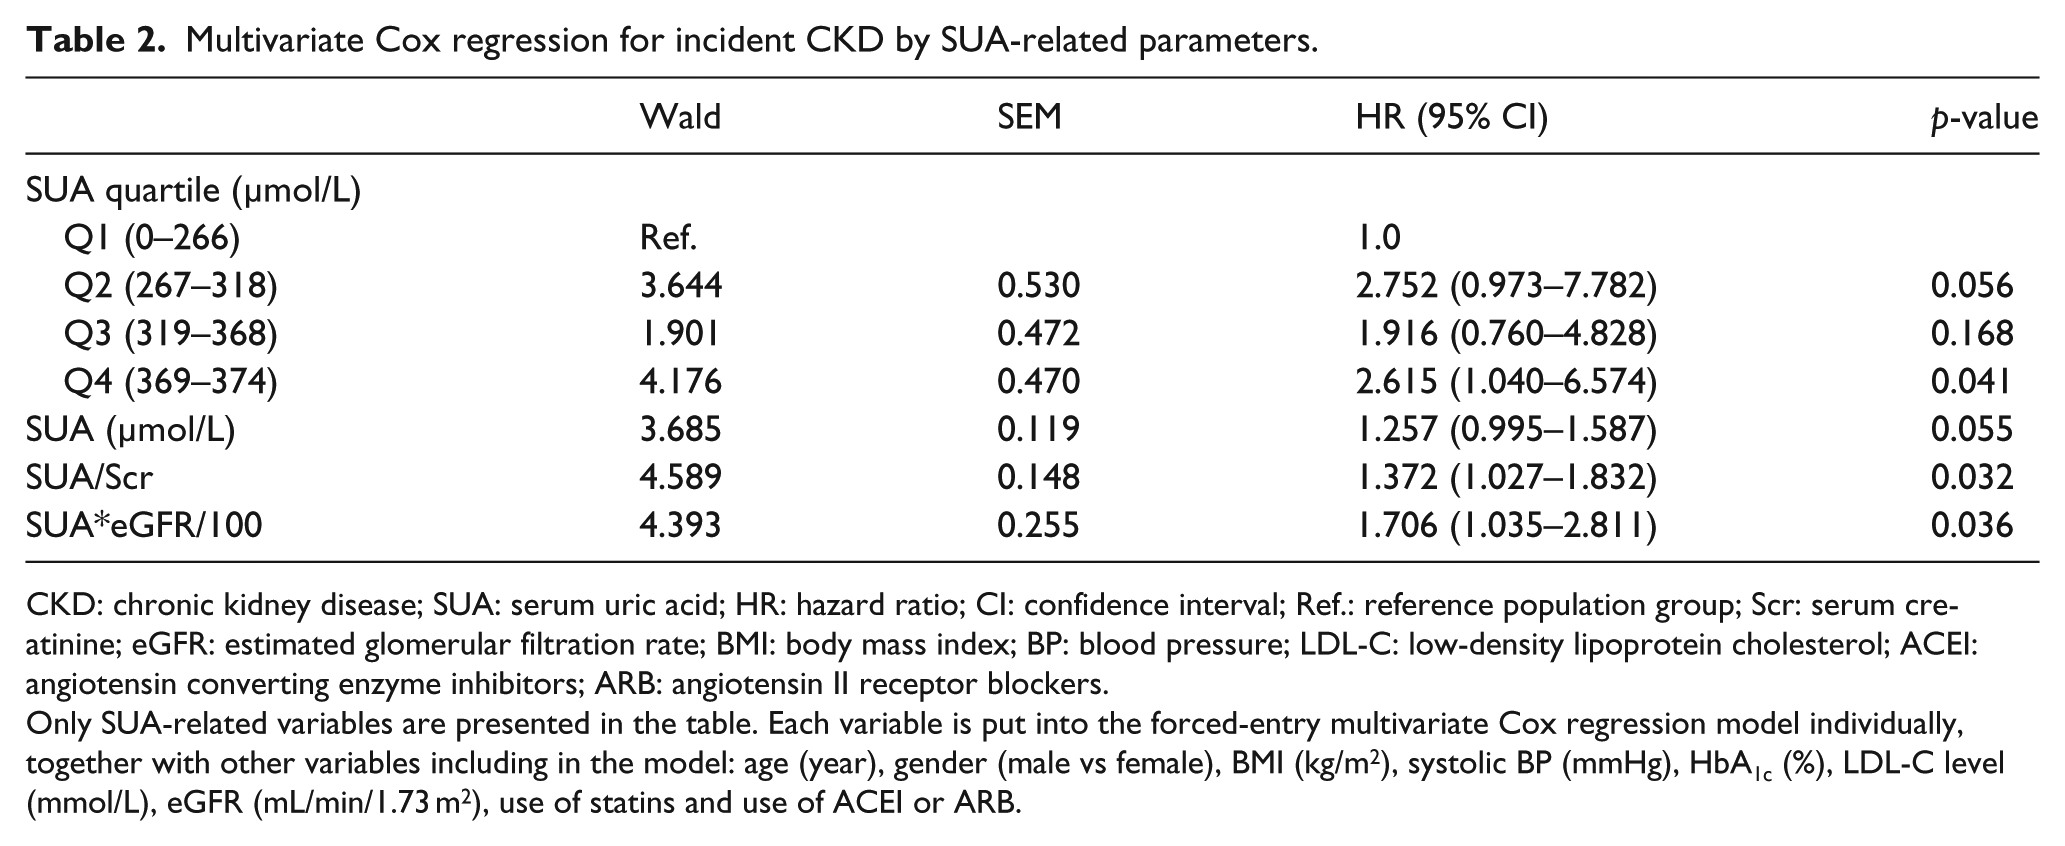
In multivariate Cox regression analysis, the highest-normal range of SUA (Q4) showed a higher cumulative incidence of CKD than Q1 [adjusted hazard ratio (HR): 2.615 (95% confidence interval (CI): 1.040–6.574), p = 0.041] after adjusting for age, sex and other potential confounders including baseline eGFR (Table 2). However, elevated levels of SUA showed no significance for predicting incidence of CKD as a continuous variable [adjusted HR: 1.004 (95% CI: 1.000–1.008), p = 0.055]. In contrast, both renal function-normalized SUA indexes were significantly associated with incident CKD even if they were included into the regression model as continuous variables. In these cases, elevated levels of SUA, either normalized by Scr [1.37 (1.027–1.832), p = 0.032] or by eGFR [1.706 (1.035–2.811), p = 0.036], were closely associated with an increased risk of development of CKD, independent of sex, age, BMI, systolic BP, LDL-C level, HbA1c, eGFR, use of statins and use of ACEI or ARB.
Multivariate Cox regression for incident CKD by SUA-related parameters.
CKD: chronic kidney disease; SUA: serum uric acid; HR: hazard ratio; CI: confidence interval; Ref.: reference population group; Scr: serum creatinine; eGFR: estimated glomerular filtration rate; BMI: body mass index; BP: blood pressure; LDL-C: low-density lipoprotein cholesterol; ACEI: angiotensin converting enzyme inhibitors; ARB: angiotensin II receptor blockers.
Only SUA-related variables are presented in the table. Each variable is put into the forced-entry multivariate Cox regression model individually, together with other variables including in the model: age (year), gender (male vs female), BMI (kg/m2), systolic BP (mmHg), HbA1c (%), LDL-C level (mmol/L), eGFR (mL/min/1.73 m2), use of statins and use of ACEI or ARB.
Discussions
The present single-centre longitudinal study described two new indexes of renal function-normalized SUA and demonstrated that they are superior to SUA as the predictor of incident CKD in a clinic-based cohort of Chinese type 2 diabetes patients with preserved kidney function. To our knowledge, this is the first time to raise the possibility of using renal function-normalized SUA as risk factors for development of CKD.
SUA has shown to be a predictor for renal disease progression in most but not all studies.15,16,23 This was probably because of the strong interaction between SUA and eGFR. 17 UA is the final product of purine metabolism and mainly eliminated in the urine, so it is reasonable that SUA level will increase in kidney disease due to the impaired UA clearance. 24 As impaired renal function itself is an independent and strong predictor for renal disease progression and increased SUA often occurs as a consequence of CKD, those patients with lower eGFR are more likely to have higher SUA levels and have higher risks of renal disease progression. Thus, if SUA is really a risk factor of renal disease progress, the baseline renal function-normalized SUA, which may reflect the net production of UA, will be better than SUA as the predictor of incident CKD.
In fact, the rate of decline in eGFR was positively correlated with both renal function-normalized SUA indexes, but not SUA in the present study, which is consistent to our finding that SUA, as a continuous variable, was not a risk factor for renal disease progression. Consistently, both indexes of renal function-normalized SUA were independently associated with an increased risk of renal disease progression, indicating they are superior predictors of incident CKD than SUA in type 2 diabetes patients with preserved kidney function.
There are several limitations in this study. First, only 1339 subjects from the original database were included in the analysis. Many patients were excluded because of lack of SUA or Scr during the follow-up periods. This situation reflects the shortage of our database establishment. Given the out-patient management system in China, in general, is still relatively immature, we are keen to make efforts to continuously improve the quality of our system. Second, there is a possible selection bias because our cohort may contain patients who are better adherence to treatments. Indeed, the relatively good BP (Table 1), as well as the relative low incidence (5.53%) of CKD during the follow-up period, was observed in our study. Finally, this study was carried out in a cohort which only comprises Chinese type 2 diabetic patients who were managed at a single outpatient clinic in Nanjing. Our results may not be generalizable to the entire diabetic populations. Nevertheless, the sample scale and the event rates occurred in this study should be statistically sufficient to support our results. More studies are expected to confirm our finding.
In summary, this study demonstrated that renal function-normalized SUA indexes, for example, SUA to creatinine ratio, have stronger associations with the risk of incident CKD than SUA alone, independent of several potential confounders including baseline eGFR. Our study provided new information for the understanding of the association between SUA, diabetes and renal disease progression. Additional studies are needed to test the reproducibility of our results and to further elucidate the association among these three conditions.
Footnotes
Acknowledgements
L.G. and L.H. contributed equally to this work.
Declaration of conflicting interests
The author(s) declared no potential conflicts of interest with respect to the research, authorship and/or publication of this article.
Funding
This research was supported by grants 71373132 from the National Natural Science Foundation of China.