
Abstract
Objective:
To reveal the effect of hyperuricaemia on endothelial function in normoglycaemic first-degree relatives of type 2 diabetes mellitus.
Methods:
In all, 40 first-degree relatives of type 2 diabetes mellitus with hyperuricaemia, 40 first-degree relatives of type 2 diabetes mellitus with normouricaemia and 35 healthy subjects without diabetic family history were recruited in this study. Anthropometric parameters as well as blood pressure, blood lipids, fasting blood glucose, fasting insulin, C-reactive protein, tumour necrosis factor-α and interleukin-6 were measured. Insulin resistance was assessed with homoeostasis model assessment index-insulin resistance index. To assess endothelial function, high-resolution ultrasonography was used for measuring flow- and nitroglycerine-mediated brachial artery vasodilation.
Results:
When compared with control, flow-mediated dilation was lower in first-degree relatives with or without hyperuricaemia (both p < 0.001). When compared with first-degree relative subjects with normouricaemia, there were lower flow-mediated dilation (p < 0.001) and higher levels of uric acid (p < 0.001), fasting blood glucose (p < 0.001), C-reactive protein (p = 0.001), tumour necrosis factor-α (p < 0.001) and interleukin-6 (p < 0.001) in first-degree relative subjects with hyperuricaemia. Flow-mediated dilation was found to be negatively related to uric acid (r = −0.597, p < 0.001). Stepwise multiple regressions demonstrated that uric acid was a significant determinant of flow-mediated dilation independent of other variables in first-degree relatives of type 2 diabetes mellitus (β = −0.677, p < 0.001; confidence interval: −0.010 to −0.006).
Conclusion:
Further endothelial dysfunction is found in normoglycaemic first-degree relatives of type 2 diabetes mellitus complicated with hyperuricaemia.
Introduction
First-degree relatives (FDRs) of type 2 diabetes mellitus (T2DM) are predisposed for the development of diabetes. 1 The increased prevalence of cardiovascular diseases is observed both in pre-diabetes and clinically overt diabetes. Multiple evidences demonstrate that FDRs of diabetes are associated with a high risk of atherosclerotic disease later on in their life. Endothelial dysfunction is commonly considered as an early marker for cardiovascular disease. Impaired endothelial function is also a major contributor to the pathogenesis of atherogenesis.2,3 It was reported by Iellamo et al. 4 that impairment in endothelial function existed in healthy and normoglycaemic FDR. In line with this finding, several other studies have also shown that endothelial function attenuates in FDRs of T2DM in healthy subjects with normal glucose metabolism state.5,6
Epidemiological and experimental studies have suggested that hyperuricaemia is involved in the occurrence and development of cardiovascular diseases.7,8 Several recent reports have demonstrated that the elevated serum uric acid levels may contribute to endothelial dysfunction in patients with asymptomatic hyperuricaemia. Endothelium-dependent flow-mediated dilation (FMD) was found to be reduced significantly in patients with hyperuricaemia. 9 Another study showed that endothelial-dependent FMD attenuated even in patients with hyperuricaemia without any overt cardiovascular disease. 10 Moreover, it is well established that hyperuricaemia is related to impaired endothelial function in patients with diabetes. Matheus et al. 11 reported that elevated serum uric acid might be a new potential marker of microvascular endothelial dysfunction in type 1 diabetes. A clinical trial revealed that endothelium-dependent FMD increased after urate-lowering therapy with allopurinol in diabetic patients. 12
As mentioned above, both FDRs of T2DM and hyperuricaemia are implicated in endothelial dysfunction. However, hitherto, few data are available on the association between elevated serum uric acid and endothelial function in FDRs. Accordingly, this study was designed to test the hypothesis that further deterioration of endothelial function may be attributed to elevated serum uric acid levels in normoglycaemic FDRs of type 2 diabetic subjects. Relationship between FMD and other cardiovascular risk factors was also investigated.
Material and methods
Subjects
A total of 80 FDRs of T2DM were recruited in this study, at least one of whose parents was diagnosed as T2DM. According to serum uric acid levels, they were divided into hyperuricaemia (HUA) subgroup and normouricaemia (NUA) subgroup. In all, 35 age- and sex-matched healthy subjects without diabetic family history served as controls. All the 115 subjects underwent 75-g oral glucose tolerance test (OGTT) to verify the normal glucose tolerance status. Those with history or clinical evidence of pre-diabetes, diabetes, hypertension, coronary arterial disease, congestive heart failure, peripheral vascular disease, liver or renal dysfunction, malignant neoplasms and infectious diseases were excluded from the study. Also, subjects were excluded if they were taking any medications. Ethical approval for the study was obtained from the ethics committee of our hospital, and informed consent forms were signed by each subject.
Normal glucose metabolism status was defined as both fasting glucose <6.1 mmol/L and post-challenge glucose <7.8 mmol/L according to the 1999 World Health Organization (WHO) criteria. Normotension was defined as systolic blood pressure (SBP) <140 and diastolic blood pressure (DBP) <90 mmHg. Subjects with serum uric acid levels ⩾420 µmol/L were considered as hyperuricaemia. Questionnaires were sent to each participant to identify some details, including family history, disease history, situation of smoking and drinking and medication use. Cigarette smokers were defined as participants smoking more than one cigarette daily for at least 1 year. Alcohol intake of each subject was recorded as standard drinks per week. One standard drink is equivalent to 10 mL of ethanol.
Anthropometry and serum parameters
The anthropometry parameters, including weight, height and waist circumference, were measured by a specially assigned nurse using a normative protocol. Body mass index (BMI) was calculated as weight (in kilograms) divided by the square of height (in metres). In order to assess blood pressure state, SBP and DBP were measured three times using a mercury sphygmomanometer during two different visits.
After an overnight fasting, venous blood samples were collected for measurement of biochemical indexes, fasting insulin (FINS) levels and inflammatory markers concentrations. Serum uric acid, triglycerides (TG), total cholesterol (TC), high-density lipoprotein (HDL)-cholesterol and low-density lipoprotein (LDL)-cholesterol were determined with standard enzymatic methods using an automatic analyser (Olympus AU 5400, Japan). Fasting blood glucose (FBG) was measured with a glucose oxidase method. Ultrasensitive C-reactive protein (CRP) was measured with particle-enhanced immunoturbidimetric assay. Intra- and inter-assay coefficients of variation (CVs) for all these assays were less than 5%. FINS was evaluated using radioimmunoassay (Atom High-tech Istope Pharmaceutical Co., Ltd, Guangzhou, China). The intra- and inter-assay CVs for FINS were below 10% and 15%, respectively. Insulin resistance (IR) index was assessed with the homoeostasis model assessment index [(HOMA)-IR]. It was calculated as FBG (mmol/L) × FINS (mIU/L)/22.5. Both tumour necrosis factor-α (TNF-α) and interleukin-6 (IL-6) were detected with enzyme linked immunosorbent assay (ELISA) method (Hushang Biotechnology, Shanghai, China) with a lower limit of detection of 3 and 2 ng/mL, respectively. The intra- and inter-assay CVs for TNF-α and IL-6 were about 10%–15%.
Endothelial function
Endothelium-dependent and -independent vasodilation function were determined using high-resolution ultrasonography (128XP/10 with a 7.0-MHz linear array transducer; Acuson, Mountain View, CA, USA) as reported previously. 13 The changes in right brachial artery diameter in response to reactive hyperaemia and nitroglycerine were measured by two different observers, who were unclear about the experimental design. The intra- and inter-operator variations in artery diameter were 0.09 ± 0.10 and 0.08 ± 0.13 mm, respectively. The CV for the artery diameter measurements was less than 8%.
Briefly, subjects rested in the supine position on a bed for 10 min. Blood pressure was measured before commencing the scanning procedure. Then, a sphygmomanometric cuff was placed on the right brachial artery, which was inflated at 300 mmHg for 5 min. Baseline diameter and post-stimulus diameter were measured from the anterior to the posterior endothelial–lumen interface at end diastole, coincident with the R wave on the electrocardiogram. FMD was calculated as the increase in post-stimulus diameter as a percentage of the baseline diameter. A second baseline scan was recorded after at least 15 min rest. Finally, the artery was scanned again after nitroglycerine (400-µg spray) was administered sublingually for 5 min. Nitroglycerine-mediated dilation (NMD) was calculated as an increase in post-stimulus diameter as a percentage of the baseline diameter.
Statistical analysis
The Kolmogorov–Smirnov test was used to assess data distribution. Continuous variables are presented as means ± standard deviation (SD). Categorical variables are presented as numbers and percentages. The differences in the parameters among the three subgroups were compared using one-way analysis of variance (ANOVA), followed by post hoc Bonferroni test. Partial correlation analysis with correction for age, sex, smoking and alcohol intake was used to determine the association between FMD and other variables. A stepwise multiple regression analysis was performed to identify the independent association of serum uric acid with FMD in FDRs of T2DM. A p value <0.05 was considered statistically significant. All analyses were performed using SPSS statistical package (Version 17.0).
Results
Patient characteristics
The baseline characteristics and clinical details of all the subjects are shown in Table 1. There was no significant difference in age (p = 0.961), sex constituent ratio (p = 0.974), ratio of smoking (p = 0.970), alcohol consumption (p = 0.724), SBP (p = 0.059) and DBP (p = 0.169) among the three subgroups. Also, there was no significant difference in BMI [(24.02 ± 3.33 vs 22.88 ± 2.98) kg/m2, p = 0.106] and waist circumference [(84.27 ± 7.62 vs 81.94 ± 8.22) cm, p = 0.201] between NUA subgroup and control subgroup. However, both BMI [(25.12 ± 3.40 vs 22.88 ± 2.98) kg/m2, p = 0.005] and waist circumference [(87.75 ± 9.09 vs 81.94 ± 8.22) cm, p = 0.004] were significantly higher in HUA group compared with that in control subgroup.
Baseline characteristics of the study subjects.
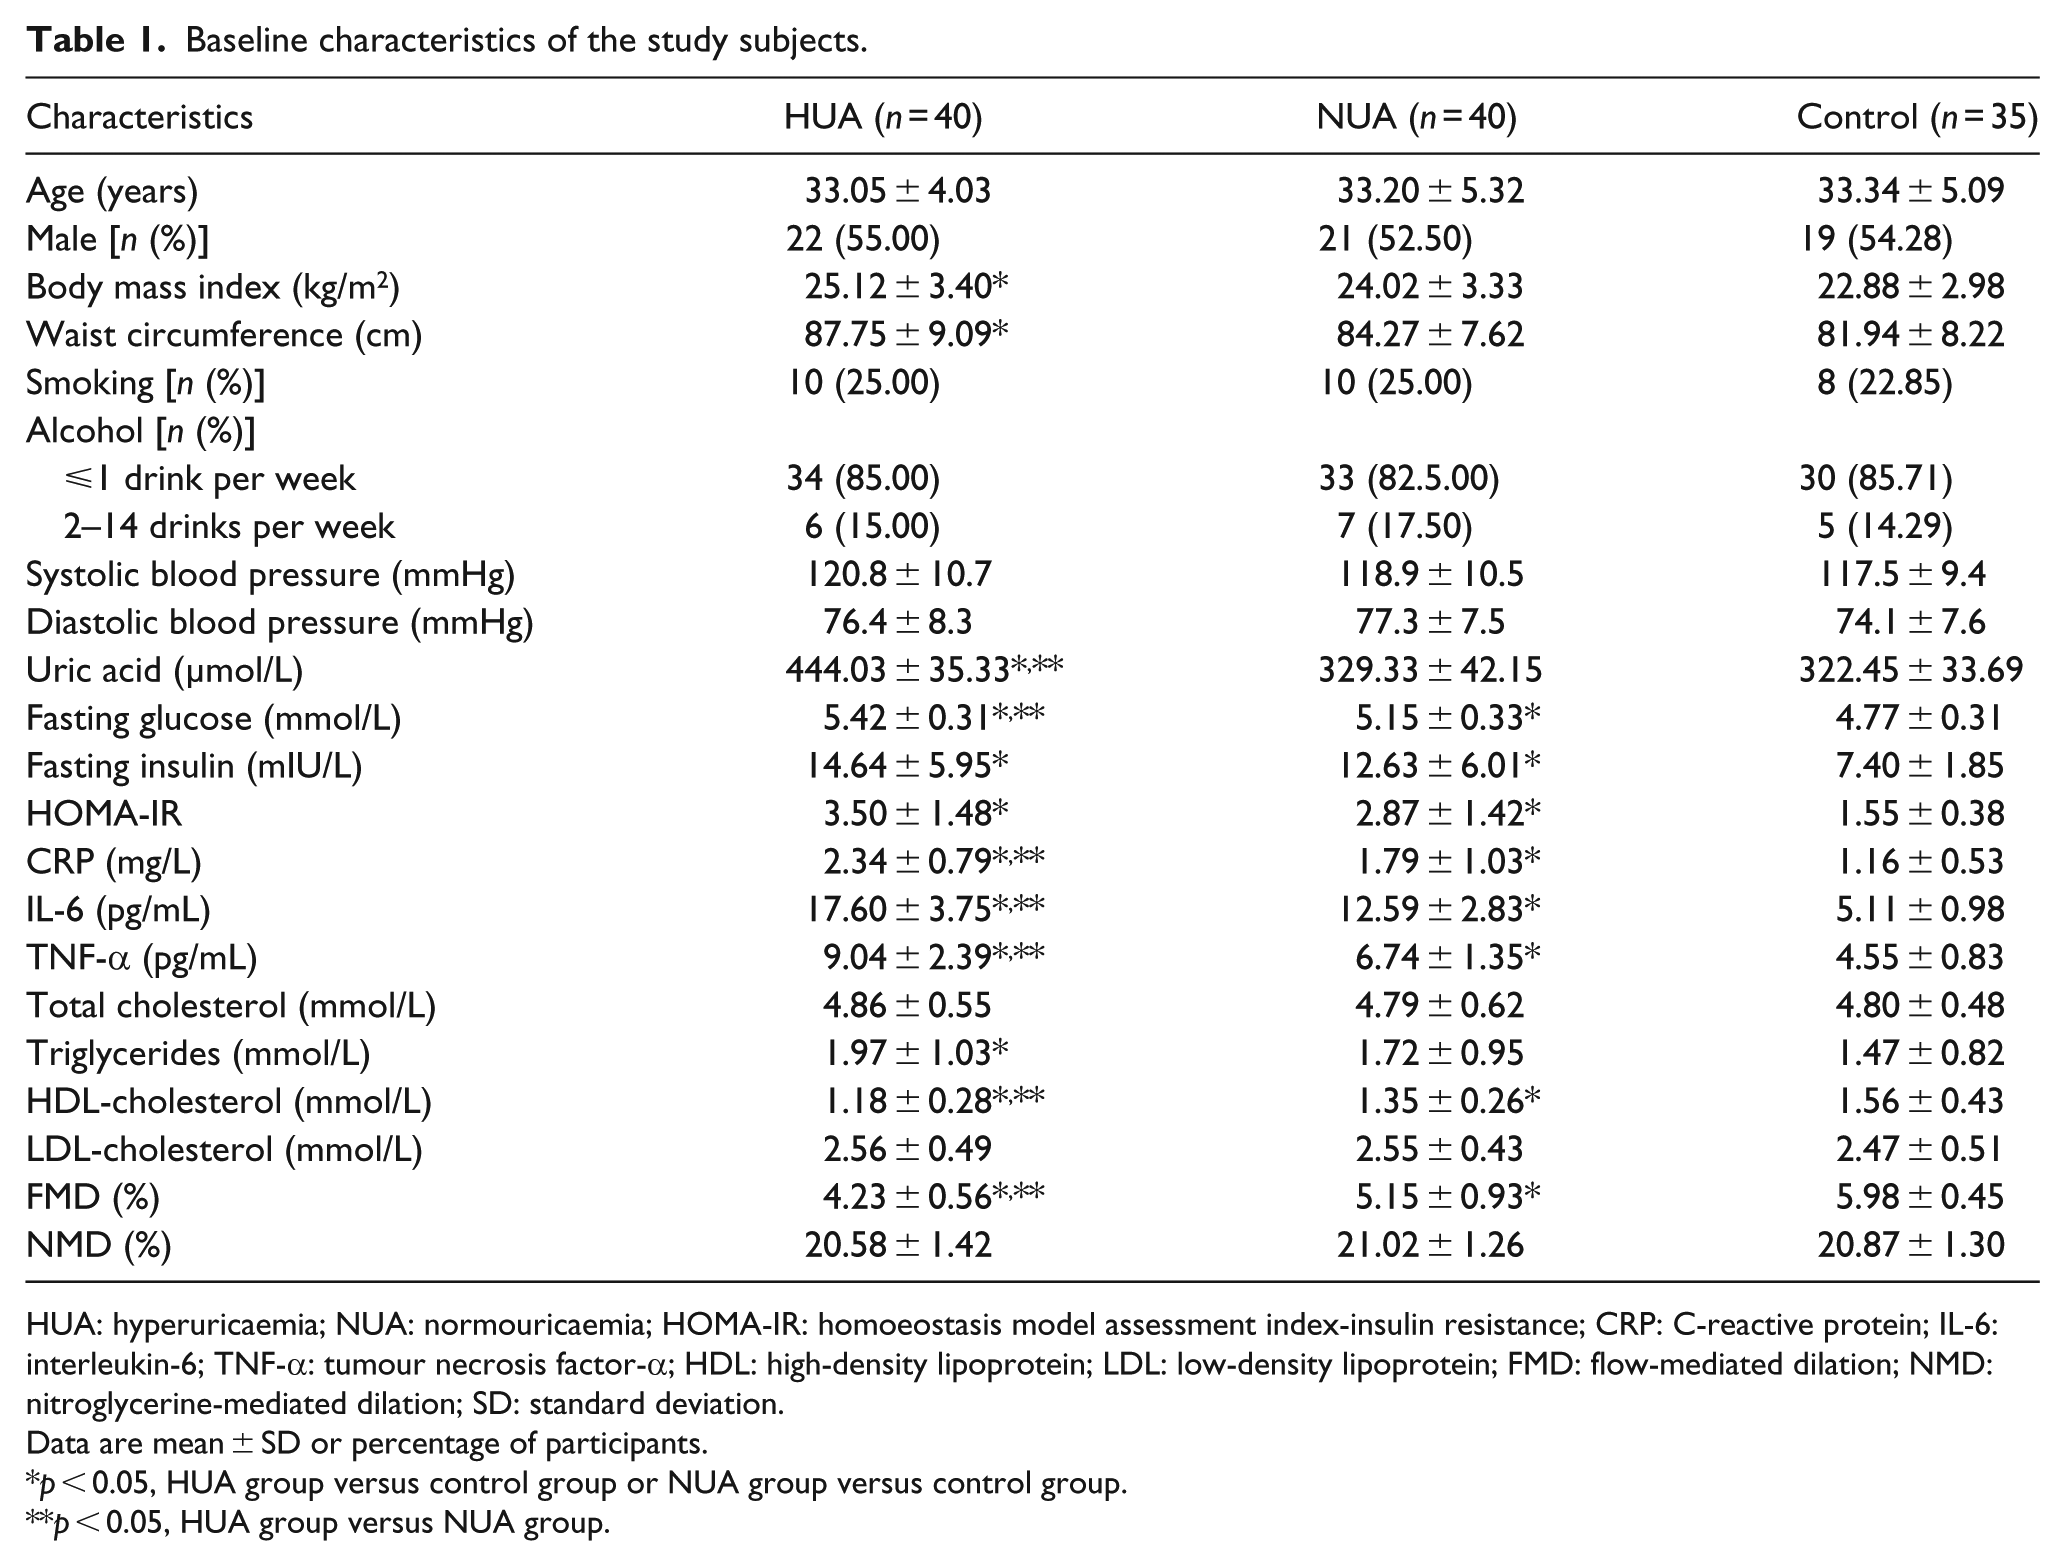
HUA: hyperuricaemia; NUA: normouricaemia; HOMA-IR: homoeostasis model assessment index-insulin resistance; CRP: C-reactive protein; IL-6: interleukin-6; TNF-α: tumour necrosis factor-α; HDL: high-density lipoprotein; LDL: low-density lipoprotein; FMD: flow-mediated dilation; NMD: nitroglycerine-mediated dilation; SD: standard deviation.
Data are mean ± SD or percentage of participants.
p < 0.05, HUA group versus control group or NUA group versus control group.
p < 0.05, HUA group versus NUA group.
Endothelial function
When compared with control, the levels of FMD were relatively lower in FDRs with or without hyperuri-caemia [(4.23% ± 0.56% vs 5.98% ± 0.45%), p < 0.001; (5.15% ± 0.93% vs 5.98% ± 0.45%), p < 0.001]. Further-more, for FDR subgroups, participants with hyperuricaemia showed lower FMD [(4.23% ± 0.56% vs 5.15% ± 0.93%), p < 0.001] compared with participants with normouricaemia. However, there was no significant difference in NMD (p = 0.161) among the three subgroups.
Metabolic parameters
When compared with control, normouricaemia FDRs exhibited higher FBG [(5.15 ± 0.33 vs 4.77 ± 0.31) mmol/L, p < 0.001], FINS [(12.63 ± 6.01 vs 7.40 ± 1.85) mIU/L, p < 0.001] and HOMA-IR (2.87 ± 1.42 vs 1.55 ± 0.38, p < 0.001). However, levels of HDL-cholesterol were relatively lower in normouricaemia FDRs compared with control [(1.35 ± 0.26 vs 1.56 ± 0.43) mmol/L, p = 0.008)]. When compared with control, the following indexes were significantly increased in hyperuricaemia FDR subgroup, including serum uric acid [(444.03 ± 35.33 vs 322.45 ± 33.69) µmol/L, p < 0.001], FBG [(5.42 ± 0.31 vs 4.77 ± 0.31) mmol/L, p < 0.001], FINS [(14.64 ± 5.95 vs 7.40 ± 1.85) mIU/L, p < 0.001], HOMA-IR (3.50 ± 1.48 vs 1.55 ± 0.38, p < 0.001) and TG [(1.97 ± 1.03 vs 1.47 ± 0.82) mmol/L, p = 0.022]. In contrast, HDL-cholesterol decreased significantly in FDR subjects with hyperuricaemia compared with control [(1.18 ± 0.28 vs 1.56 ± 0.43) mmol/L, p < 0.001].
Furthermore, for FDR subgroups, participants with hyperuricaemia showed higher serum uric acid [(444.03 ± 35.33 vs 329.33 ± 42.15) µmol/L, p < 0.001] and FBG [(5.42 ± 0.31 vs 5.15 ± 0.33) mmol/L, p < 0.001)] compared with participants with normouricaemia. The levels of HDL-cholesterol were relatively lower in HUA subgroup compared with NUA subgroup [(1.18 ± 0.28 vs 1.35 ± 0.26) mmol/L, p < 0.001]. However, there was no significant difference in TC (p = 0.853) and LDL-cholesterol (p = 0.733) among the three subgroups.
Inflammatory markers
When compared with control, inflammatory markers, including CRP [(1.79 ± 1.03 vs 1.16 ± 0.53) mg/L, p = 0.001], TNF-α [(6.74 ± 1.35 vs 4.55 ± 0.83) pg/mL, p < 0.001] and IL-6 [(12.59 ± 2.83 vs 5.11 ± 0.98) pg/mL, p < 0.001), were significantly higher in normouricaemia FDR subgroup. Also, subjects in hyperuricaemia FDR subgroup showed higher levels of CRP [(2.34 ± 0.79 vs 1.16 ± 0.53) mg/L, p < 0.001], TNF-α [(9.04 ± 2.39 vs 4.55 ± 0.83) pg/mL, p < 0.001] as well as IL-6 [(17.60 ± 3.75 vs 5.11 ± 0.98) pg/mL, p < 0.001] compared with control. Moreover, when compared with normouricaemia FDR subgroup, CRP [(2.34 ± 0.79 vs 1.79 ± 1.03) mg/L, p = 0.001], TNF-α [(9.04 ± 2.39 vs 6.74 ± 1.35) pg/mL, p < 0.001] and IL-6 [(17.60 ± 3.75 vs 12.59 ± 2.83) pg/mL, p < 0.001) were significantly higher in hyperuricaemia FDR subgroup.
Correlation and multiple regression analysis
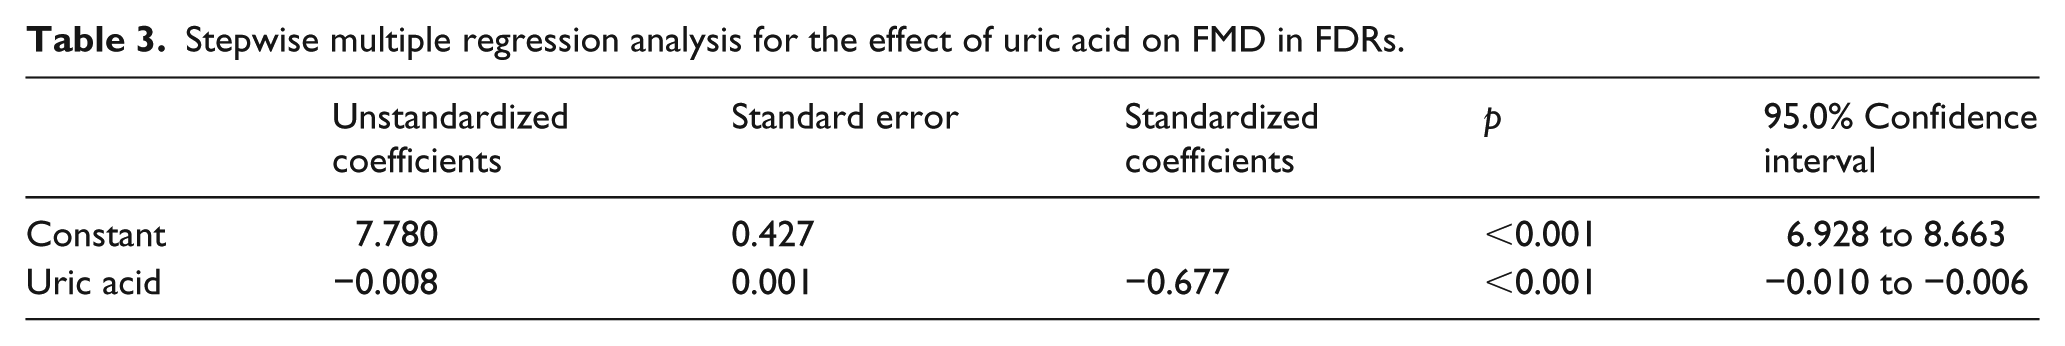
As shown in Table 2, partial correlation analysis demonstrated that FMD negatively correlated with serum uric acid (r = −0.597, p < 0.001), TG (r = −0.330, p = 0.004), FINS (r = −0.292, p = 0.011), HOMA-IR (r = −0.189, p = 0.041), CRP (r = −0.306, p = 0.007), TNF-α (r = −0.512, p < 0.001) and IL-6 (r = −0.552, p < 0.001) and positively correlated with HDL-cholesterol (r = 0.270, p = 0.026) in FDR subgroups. Then, a stepwise multiple regression model was built to further reveal the association between serum uric acid levels and FMD in FDRs of T2DM. Defining FMD as the dependent variable and all other variables, which associated with FMD including age, BMI, SBP, DBP, TG, HDL-cholesterol, serum uric acid, HOMA-IR, CRP, TNF-α, IL-6, smoking status and alcohol consumption, as the independent variables in this model, the outcomes showed that serum uric acid levels (β = −0.677, p < 0.001) were independent determinants of FMD in FDR cohort (Table 3). In other words, serum uric acid was a significant negative contributor of FMD independent of other variables in FDRs of diabetes.
Correlation analysis between FMD and other variables in FDRs (n = 80).
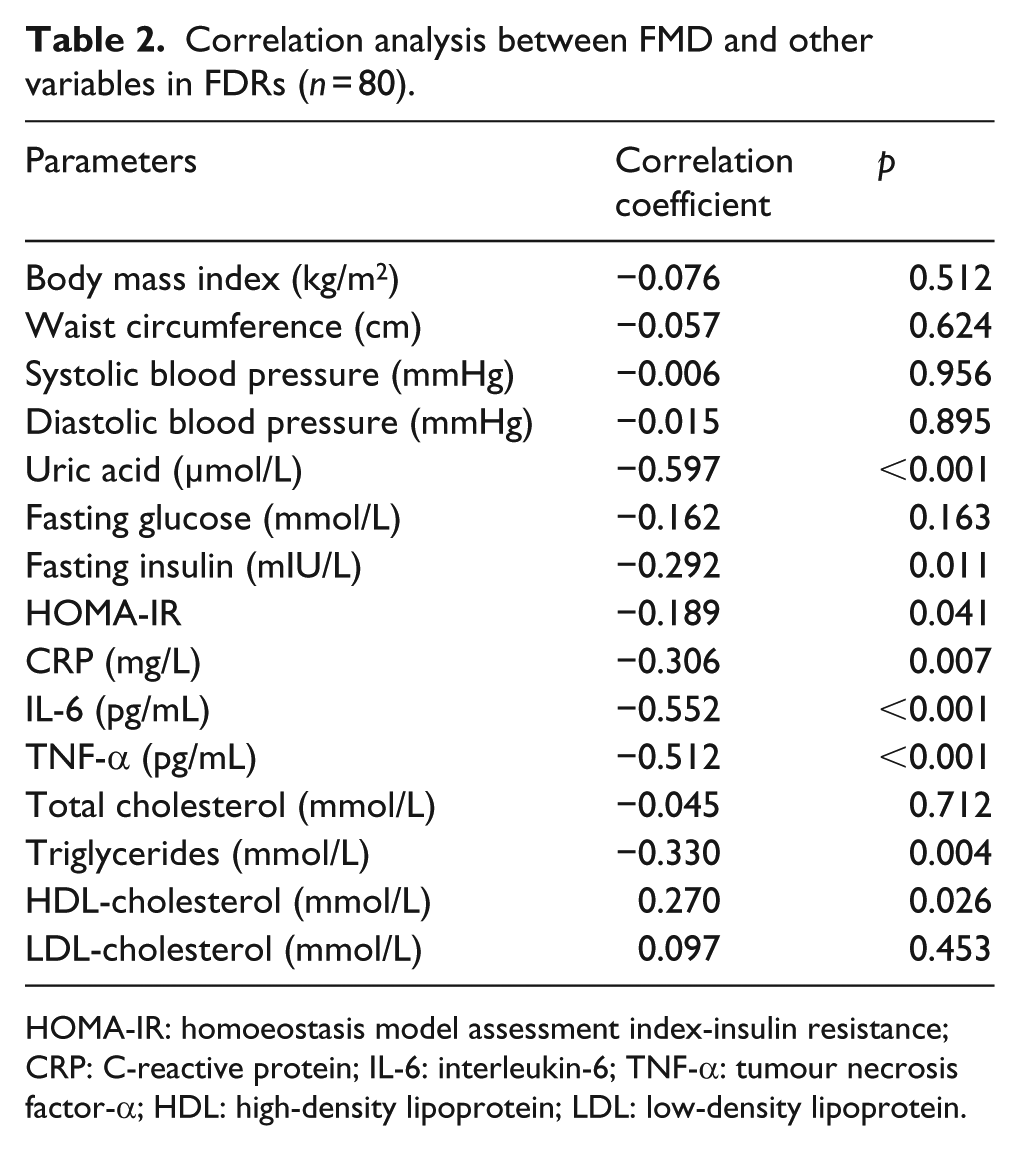
HOMA-IR: homoeostasis model assessment index-insulin resistance; CRP: C-reactive protein; IL-6: interleukin-6; TNF-α: tumour necrosis factor-α; HDL: high-density lipoprotein; LDL: low-density lipoprotein.
Stepwise multiple regression analysis for the effect of uric acid on FMD in FDRs.
Discussion
In this study, we verified that endothelium-dependent FMD decreased in FDRs of T2DM. We also found that endothelium-dependent FMD further reduced in normoglycaemic FDRs with hyperuricaemia. The results have suggested that elevated serum uric acid may further damage endothelial function in FDRs of T2DM. In addition, FMD was also found to be related to other cardiovascular risk factors, including inflammatory markers, dyslipidaemia as well as IR.
One of the main findings was that whether serum uric acid levels are normal or not, endothelial function was decreased in normoglycaemic FDR subjects compared with healthy persons without family history of diabetes in our study. Although the mechanisms of this finding have remained largely unknown, genetic background may be one of the plausible explanations. It was demonstrated that nondiabetic offspring of two diabetic parents showed impaired endothelial function. 6 Family history was reported to be an independent contributor to reduced FDM, indicating that a strong genetic background of T2DM may be implicated in endothelial dysfunction in FDRs. 6
Low-grade chronic inflammation seems to be one of the important contributors to impaired endothelial function in FDRs of T2DM. Both Scuteri et al. 14 and Amudha et al. 15 reported that FDR subjects presented lower endothelium-dependent FDM than controls, combined with increased circulating inflammatory markers (CRP, IL-1β, IL-6 and TNF-α). A study from Iellamo et al. 4 demonstrated that FDR subjects showed a reduction in FMD and had normal but markedly higher levels of high-sensitive CRP. In good agreement with others, FDR subjects showed higher levels of inflammatory markers, including CRP, TNF-α and IL-6 when compared with healthy controls in our study. Moreover, FMD negatively correlated with CRP, TNF-α and IL-6 in FDR subgroups.
Moreover, several other factors, such as disturbance in the lipid and glucose metabolism and IR, may be involved in endothelial dysfunction in FDRs. Previous investigations have suggested that FDRs with endothelial dysfunction showed raising blood glucose, elevated insulin levels, higher TG and reduction in insulin sensitivity.4,14 Another study by Ikonomidis et al. 16 demonstrated that there was an impairment in arterial wall properties and coronary flow reserve in healthy FDRs of diabetic patients, accompanied by elevated FINS levels and reduced insulin sensitivity. In this study, we also found that although in normal range, FDR subjects exhibited lower HDL-cholesterol concentrations and higher levels of FBG, FINS and HOMA-IR when compared with healthy controls. In addition, FMD was negatively related to TG, FINS and HOMA-IR in FDR subgroups. In contrast, a positive association presented between FMD and HDL-cholesterol.
Another main finding in our study was that there was a further decrease in endothelium-dependent FMD of hyperuricaemic FDR subjects compared with that of age- and sex-matched normouricaemic FDRs. In FDR cohorts, serum uric acid levels were found to be negatively correlated with FMD. Moreover, multiple regression analysis showed that serum uric acid levels might be a strong influencing factor for reduced FMD of normoglycaemic FDR. Here, we demonstrated for the first time that endothelial function was further damaged if FDRs of type 2 diabetic subjects suffered from hyperuricaemia.
Although the underlying mechanisms of the strong association between uric acid and impaired endothelial function remain not fully understood, several plausible explanations should be concerned, including low-grade chronic inflammation, IR, oxidative stress as well as a reduction in nitric oxide (NO) production. 17 Among these factors, inflammatory reaction induced by elevated serum uric acid may be an important explanation for this correlation. CRP is considered as one of the most powerful independent predictors of atherosclerotic vascular disease. In vitro study, it was reported that uric acid with physiologic concentration (6–12 mg/dL) could inhibit cell migration via upregulation of CRP expression in human umbilical vein endothelial cells (HUVECs). 18 Another study also found that, in HUVECs stimulated with high concentrations of uric acid, there was an increase in expression of chemoattractant protein-1 (MCP-1), IL-8 and several kinds of adhesion molecules. 19 In vivo experiments, rat models with hyperuricaemia also presented higher expression of inflammatory factors and adhesion molecules. 19 Our previous study demonstrated that arterial stiffness was increased in newly diagnosed T2DM with hyperuricaemia. 20 Moreover, serum uric acid positively related to CRP levels. 20 Consistent with these findings, this study showed that inflammatory markers, including CRP, IL-6, and TNF-α, dramatically increased in FDRs with hyperuricaemia compared with normouricaemic FDRs.
Our study has several limitations. One is the cross-sectional design, which makes it difficult to infer the causative effect of uric acid on endothelial function in FDRs of type 2 diabetes. Another one is the relatively small sample size. Investigation of larger subject number may provide more definitive information. However, despite of these shortcomings, our data suggest that uric acid may play a key role in endothelial dysfunction, thus contributing to an increased risk of atherosclerotic disease in FDRs of T2DM. This provides important information for understanding the reasons why FDR subjects with hyperuricaemia have further reduced endothelium-dependent FMD.
In summary, our findings demonstrate that serum uric acid contributes to further impaired endothelial function in normoglycaemic FDRs of type 2 diabetes at a young age. In the future, prospective intervention trials are needed to determine whether FDR subjects of type 2 diabetes may benefit from therapy strategies targeting the elevated serum uric acid levels.
Footnotes
Acknowledgements
The authors are thankful to all the persons who took an active part in our study.
Declaration of conflicting interests
The author(s) declared no potential conflicts of interest with respect to the research, authorship and/or publication of this article.
Funding
This study was supported by grants from the National Natural Science Foundation of China (NSFC no. 81500654).