
Abstract
Cardiovascular disease is the leading cause of morbidity and mortality in type 2 diabetes mellitus. We evaluated the predictive ability of the recently developed body adiposity index for aortic stiffness, an intermediate endpoint of cardiovascular disease, in a cross-sectional multi-ethnic Asian type 2 diabetes mellitus cohort (N = 1408). AS was estimated using carotid–femoral pulse wave velocity measured by applanation tonometry. Body adiposity index was computed as hip circumference/(height)1.5 – 18. Compared to body mass index, waist circumference and visceral fat area, body adiposity index displayed the weakest association with pulse wave velocity (r = 0.077, 0.096, 0.134 and 0.058, respectively; all p < 0.05). Interestingly, the relationship between measurements of obesity and pulse wave velocity was ethnic dependent − body mass index, body adiposity index, waist circumference and visceral fat area consistently predicted pulse wave velocity only in Indians but not others. In multi-variable analysis, body mass index was a significant determinant of pulse wave velocity in all ethnicities. In conclusion, body adiposity index is a weak predictor of aortic stiffness (when compared with body mass index) in Asians with type 2 diabetes mellitus.
Introduction
The leading cause of morbidity and mortality in type 2 diabetes mellitus (T2DM) is cardiovascular disease (CVD). 1 Obesity predisposes individuals to develop CVD, particularly in those with T2DM. 2 The prevalence of obesity and obesity-related diseases including T2DM and CVD is rapidly rising in many Asian countries. Given that Asians are more susceptible to T2DM and CVD because of their higher body fat percentage (BF%) at the same body mass index (BMI) compared to Caucasians,3,4 it is important to identify appropriate risk factors for a more accurate prediction of CVD risk in the Asian population.
Aortic stiffness (AS) is regarded as the intermediate endpoint of CVD. Stiffening of arteries increases with ageing and is aggravated by diseases such as T2DM, thereby resulting in greater cardiovascular risk. Carotid–femoral pulse wave velocity (PWV) is a direct measurement of AS and is considered to be the gold standard measurement for AS.5–8 Significant correlation has been observed between AS and obesity, particularly among the Western population.6,9 However, there remains a longstanding debate as to which adiposity indices strongly associate with AS. While measures of global obesity (BMI) have been demonstrated to independently associate with PWV, measures of central obesity have gained recognition as better indicators of increased risk of AS.10,11
In 2011, Bergman et al. reported a new measure of obesity known as the body adiposity index (BAI) that is calculated based on hip circumference (HC) and height measurements. BAI was devised and validated in Mexican-American and African-American population studies and was demonstrated to be better correlated with BF% as determined by dual-energy X-ray absorptiometry than BMI with BF%. 12 Because the index was developed in samples of Mexican-American and African-American individuals, the effectiveness of BAI as an alternative measure for BF% and the strength of BAI in predicting risk of T2DM and CVD in other ethnicities need further investigations.
Studies exploring the association of adiposity markers with AS in the Asian context are few. The relationship between the new adiposity measure BAI and AS has not been studied. Therefore, this cross-sectional study aims to evaluate the predictive value of BAI, in comparison to conventional measures of obesity, for AS in a multi-ethnic Asian cohort of individuals with T2DM.
Methods
Participants
This cross-sectional study involved 2058 adult patients aged between 21 and 89 years with T2DM and attended the Diabetes Mellitus Centre or a primary-care polyclinic in the Northern region of Singapore between August 2011 and April 2014. Study protocol to capture waist circumference (WC) and HC was set up about 6 months after study initiation. Therefore, WC and HC were available in 1408 out of the 2058 subjects and formed the study population comprising the three major ethnic groups of Chinese, Malay and Indian. Exclusion criteria included fasting plasma glucose (FPG) levels <4.5 or >15 mmol/L and glycated haemoglobin (HbA1c) >12%. Participants were instructed to fast for at least 6 h before examination. A questionnaire was used to record participants’ medical history, lifestyle and medications in use. The study conformed to the Declaration of Helsinki and was approved by our institution’s domain-specific Ethics Review Board. All the participants provided written informed consent.
Anthropometric measurements
Weight and height were measured without shoes. Measures of WC, HC, BF% and visceral fat area (VFA) were determined by tetrapolar bioelectrical impedance analysis (InBody-S20; BioSpace, Los Angeles, CA, USA). VFA measured by multi-frequency bio-impedence method has been found to correlate well with that measured by computed tomography among individuals with diabetes. 13 BMI was calculated as weight (in kg) divided by height (in m)2. BAI was calculated as HC (in cm) divided by height (in m)1.5 – 18.
PWV measurement
Carotid–femoral PWV was measured by applanation tonometry (SphygmoCor; AtCor Medical, Sydney, NSW, Australia) according to the manufacturer’s protocol. Participants were placed in supine position and measurements were taken after a 5-min rest. Pulse waves were obtained sequentially from the carotid and femoral arteries. PWV was calculated using the distance and transit time between the two arterial sites. The average reading of two measurements was used in the analyses.
Blood pressure and laboratory measurements
Systolic blood pressure (SBP) and diastolic blood pressure (DBP) were measured in a seated position with a mercury sphygmomanometer. Blood was collected from participants by venipuncture on the day of clinical examination. Total cholesterol (TC), high-density lipoprotein (HDL), low-density lipoprotein (LDL) and total triglycerides (TG) were measured by enzymatic assays using Ektachem clinical chemistry slides (Eastman Kodak, Rochester, NY, USA). FPG was determined and HbA1c was quantified using immunoturbidimetric assay on the COBAS Integra 800 Chemistry Analyzer (Roche, Basel, Switzerland). Spot urine sample was used to measure the urinary albumin-to-creatinine ratio (ACR). Urinary albumin concentration was quantified by a solid phase competitive chemiluminescent enzymatic immunoassay (Immulite; DPC, Gwynedd, UK). Estimated glomerular filtration rate (eGFR) was derived based on the Modified Diet in Renal Disease (MDRD) formula. 14
Statistics
Statistical analyses were performed using Statistical Package for Social Sciences (SPSS) version 21 (SPSS, Chicago, IL, USA). Continuous data were presented as mean ± standard deviation (SD) or median (interquartile range); and categorical data were shown as n (%). Analysis of variance (ANOVA) or Kruskal–Wallis test was used for comparison of continuous variables between ethnicities. Chi-square test was used to compare categorical variables. Non-normally distributed variables including TC, TG and ACR were log-transformed to obtain approximately normal distribution. Pearson’s correlation was used to assess the association between PWV and clinical parameters. Variables that significantly correlated with PWV were included in the multiple linear regression models to identify independent predictors of PWV. Regression models were tested for collinearity by using the variance inflation factor (VIF). The cut-off value for VIF was 10. Interactions between gender or ethnicity and the measures of adiposity were assessed to determine whether stratification by gender and/or ethnicity was necessary; p < 0.05 indicated statistical significance.
Results
A multi-ethnic Asian cohort of 1408 participants with T2DM participated in this study. Demographic characteristics, body composition and cardiovascular risk factors in relation to ethnicity category are summarized in Table 1. The total cohort (age: 57 ± 11 years; male: 51.8%) comprised the three major ethnic groups of Chinese (55.0%), Malay (22.2%) and Indian (22.8%). Majority of the subjects were non-smokers. The BMI, BAI, WC and VFA were 27.6 ± 5.1 kg/m2, 30.7% ± 5.5%, 96.8 ± 13.5 cm and 133.6 ± 40.2 cm2, respectively. The participants had suboptimal HDL (1.3 ± 0.4 mM) and LDL (2.8 ± 0.8 mM) levels. Of them, 75.1% were hypertensive, either treated with oral anti-hypertensive medications [angiotensin-converting enzyme (ACE) inhibitors and/or angiotensin II receptor blockers (ARBs)] or had an SBP ⩾140 mmHg or DBP ⩾90 mmHg. The mean PWV was 9.7 ± 2.8 m/s. Preserved kidney function was observed as reflected by ACR and eGFR. Among the different ethnicities, Chinese displayed the lowest body fat content compared to Malays and Indians. The Malay population had the poorest metabolic and renal profile and highest PWV value.
Demographic, body composition, metabolic and clinical profiles of study population.
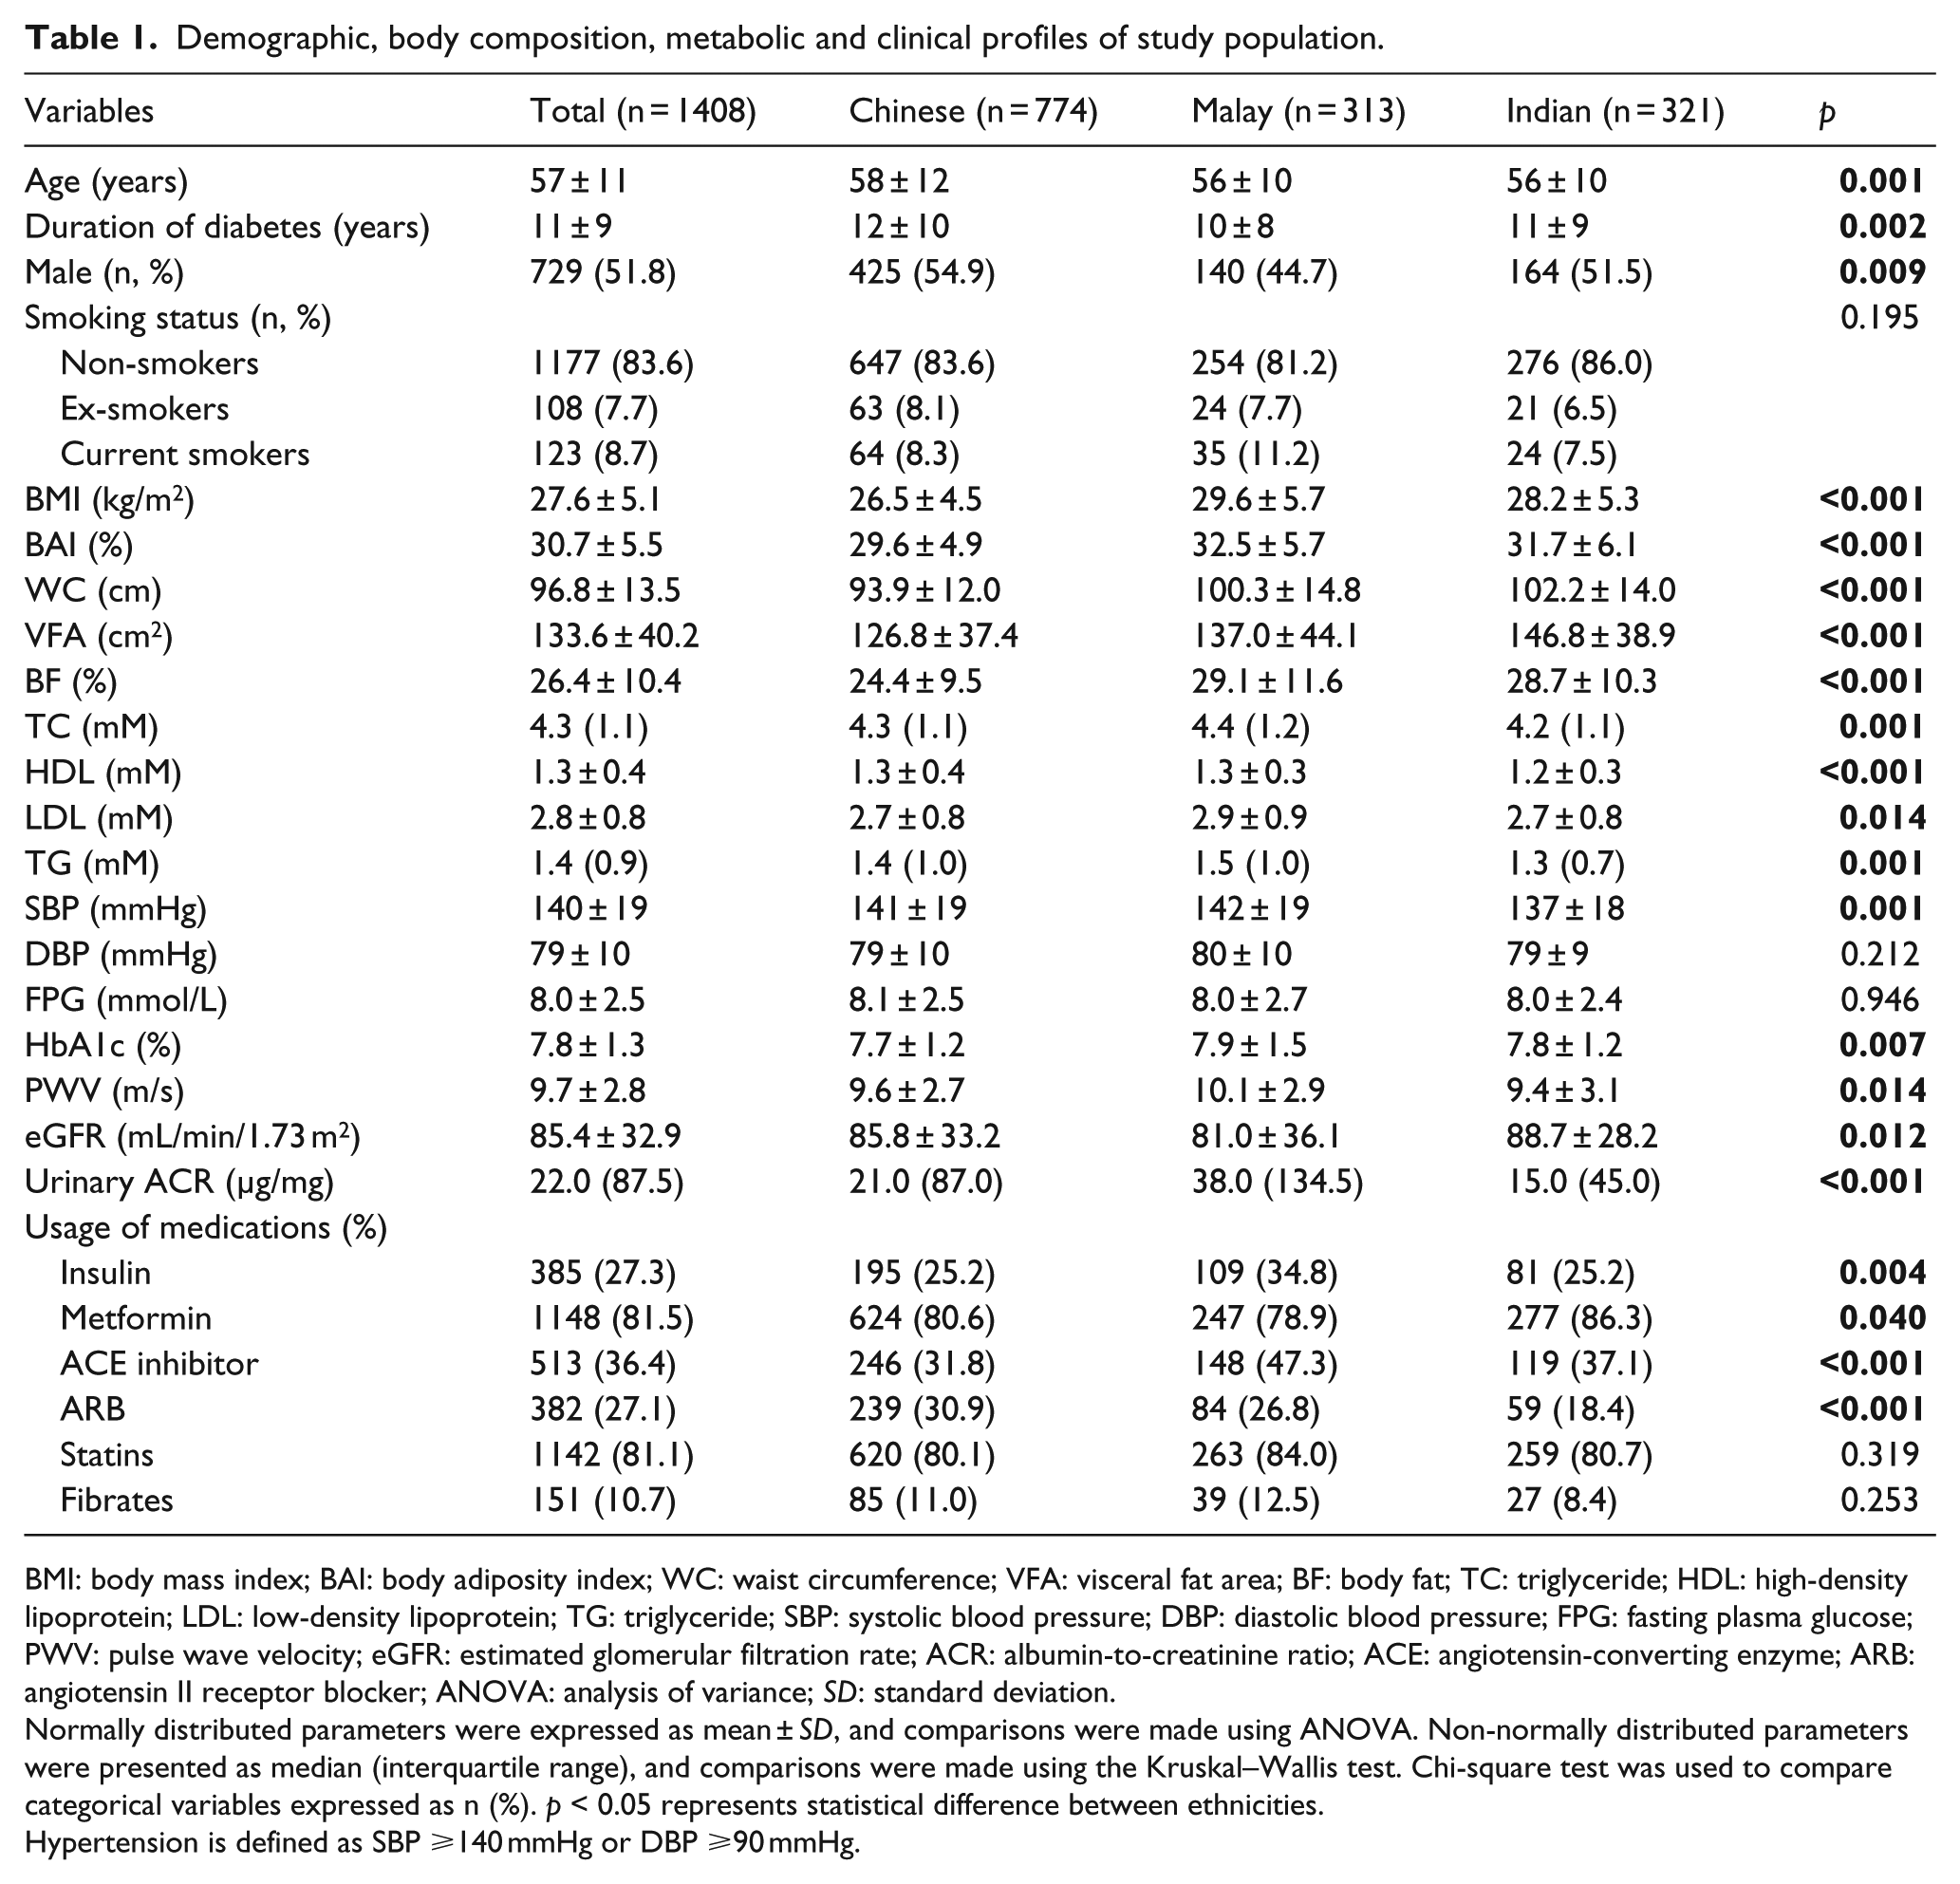
BMI: body mass index; BAI: body adiposity index; WC: waist circumference; VFA: visceral fat area; BF: body fat; TC: triglyceride; HDL: high-density lipoprotein; LDL: low-density lipoprotein; TG: triglyceride; SBP: systolic blood pressure; DBP: diastolic blood pressure; FPG: fasting plasma glucose; PWV: pulse wave velocity; eGFR: estimated glomerular filtration rate; ACR: albumin-to-creatinine ratio; ACE: angiotensin-converting enzyme; ARB: angiotensin II receptor blocker; ANOVA: analysis of variance; SD: standard deviation.
Normally distributed parameters were expressed as mean ± SD, and comparisons were made using ANOVA. Non-normally distributed parameters were presented as median (interquartile range), and comparisons were made using the Kruskal–Wallis test. Chi-square test was used to compare categorical variables expressed as n (%). p < 0.05 represents statistical difference between ethnicities.
Hypertension is defined as SBP ⩾140 mmHg or DBP ⩾90 mmHg.
Pearson’s correlation analysis revealed significant association of PWV with measures of body composition − BMI (r = 0.077, p = 0.004), BAI (r = 0.058, p = 0.030), WC (r = 0.096, p < 0.001) and VFA (r = 0.134, p < 0.001). In addition, factors including age, duration of diabetes, SBP, DBP, FPG, HbA1c and logACR positively correlated with PWV, while logTC, HDL, LDL and eGFR negatively correlated with PWV. We speculated that the unexpected, albeit modest, inverse relationship between logTC or LDL and PWV was probably attributable to intensive lipid lowering therapy. Analysis of the anthropometric measures showed that BAI least correlated with BF% (r = 0.736, p < 0.001) than BMI, WC and VFA. WC had the strongest association with BMI (r = 0.917, p < 0.001), followed by VFA (r = 0.835, p < 0.001) and BAI (r = 0.790, p < 0.001). Correlation was high between BAI and BMI (r = 0.759, p < 0.001), but moderate between BAI and VFA (r = 0.579, p < 0.001). Significant association was detected between BMI and VFA (r = 0.713, p < 0.001) (Table 2).
Pearson’s correlation analyses between PWV, demographic, body composition and metabolic parameters.
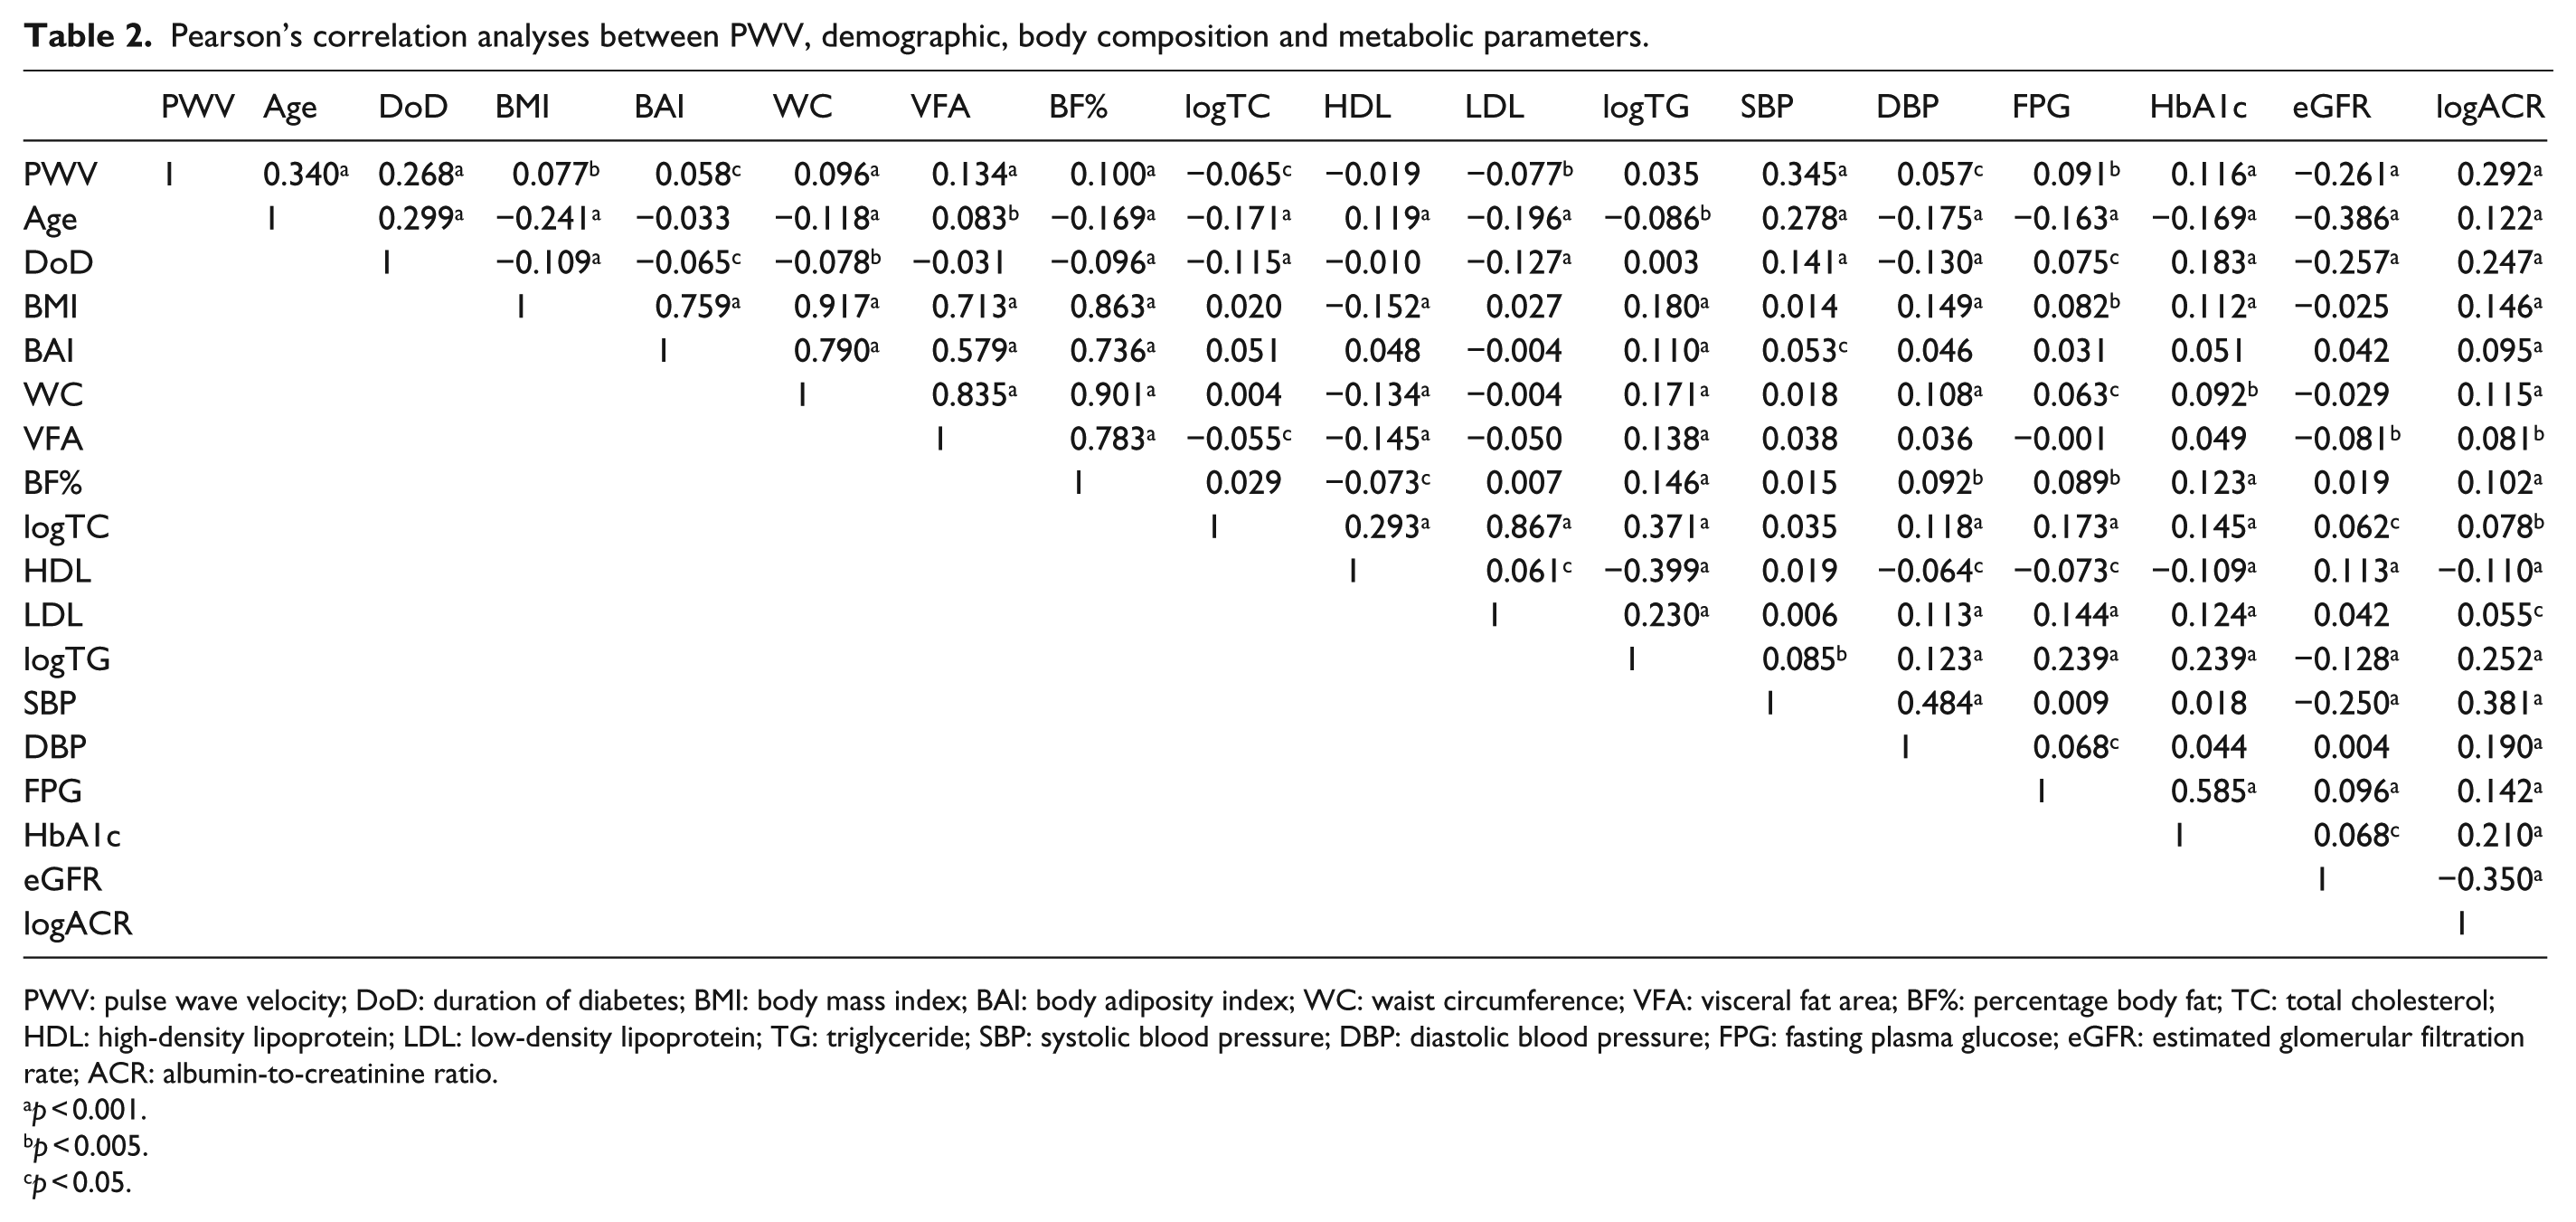
PWV: pulse wave velocity; DoD: duration of diabetes; BMI: body mass index; BAI: body adiposity index; WC: waist circumference; VFA: visceral fat area; BF%: percentage body fat; TC: total cholesterol; HDL: high-density lipoprotein; LDL: low-density lipoprotein; TG: triglyceride; SBP: systolic blood pressure; DBP: diastolic blood pressure; FPG: fasting plasma glucose; eGFR: estimated glomerular filtration rate; ACR: albumin-to-creatinine ratio.
p < 0.001.
p < 0.005.
p < 0.05.
Multiple linear regression analyses with different levels of adjustment were performed to observe the association of the adiposity variables with PWV. When all the obesity-related measures were included into the same multi-variate model, multicollinearity was a problem (data not shown). Therefore, these variables were analysed as independent predictors in separate models adjusted for factors that significantly correlated with PWV including age, duration of diabetes, logTC, LDL, SBP, DBP, HbA1c, logACR and eGFR. The regression models were also controlled for gender, ethnicity and usage of medications unless otherwise stated. As shown in Table 3, the measures of adiposity independently predicted PWV at all levels of adjustment in the total cohort. The fully adjusted model with BMI had the best predictive performance (R2 = 0.256) in contrast to the model with BAI with the poorest prediction ability (R2 = 0.247). The final model with WC and VFA explained 25.4% and 25.0% of the variance in PWV, respectively. In a second analysis, we incorporated BMI, WC or VFA into the fully adjusted BAI-based model to compare the predictive strength of BAI with each of the other adiposity parameters for PWV (data not shown). Coupling BAI with BMI, WC or VFA in the model rendered BAI’s relationship with PWV either less significant (when adjusted for BMI) or nonsignificant (when adjusted for WC or VFA), while BMI, WC and VFA emerged as significant predictors of PWV.
Linear regression analysis for PWV for overall cohort.
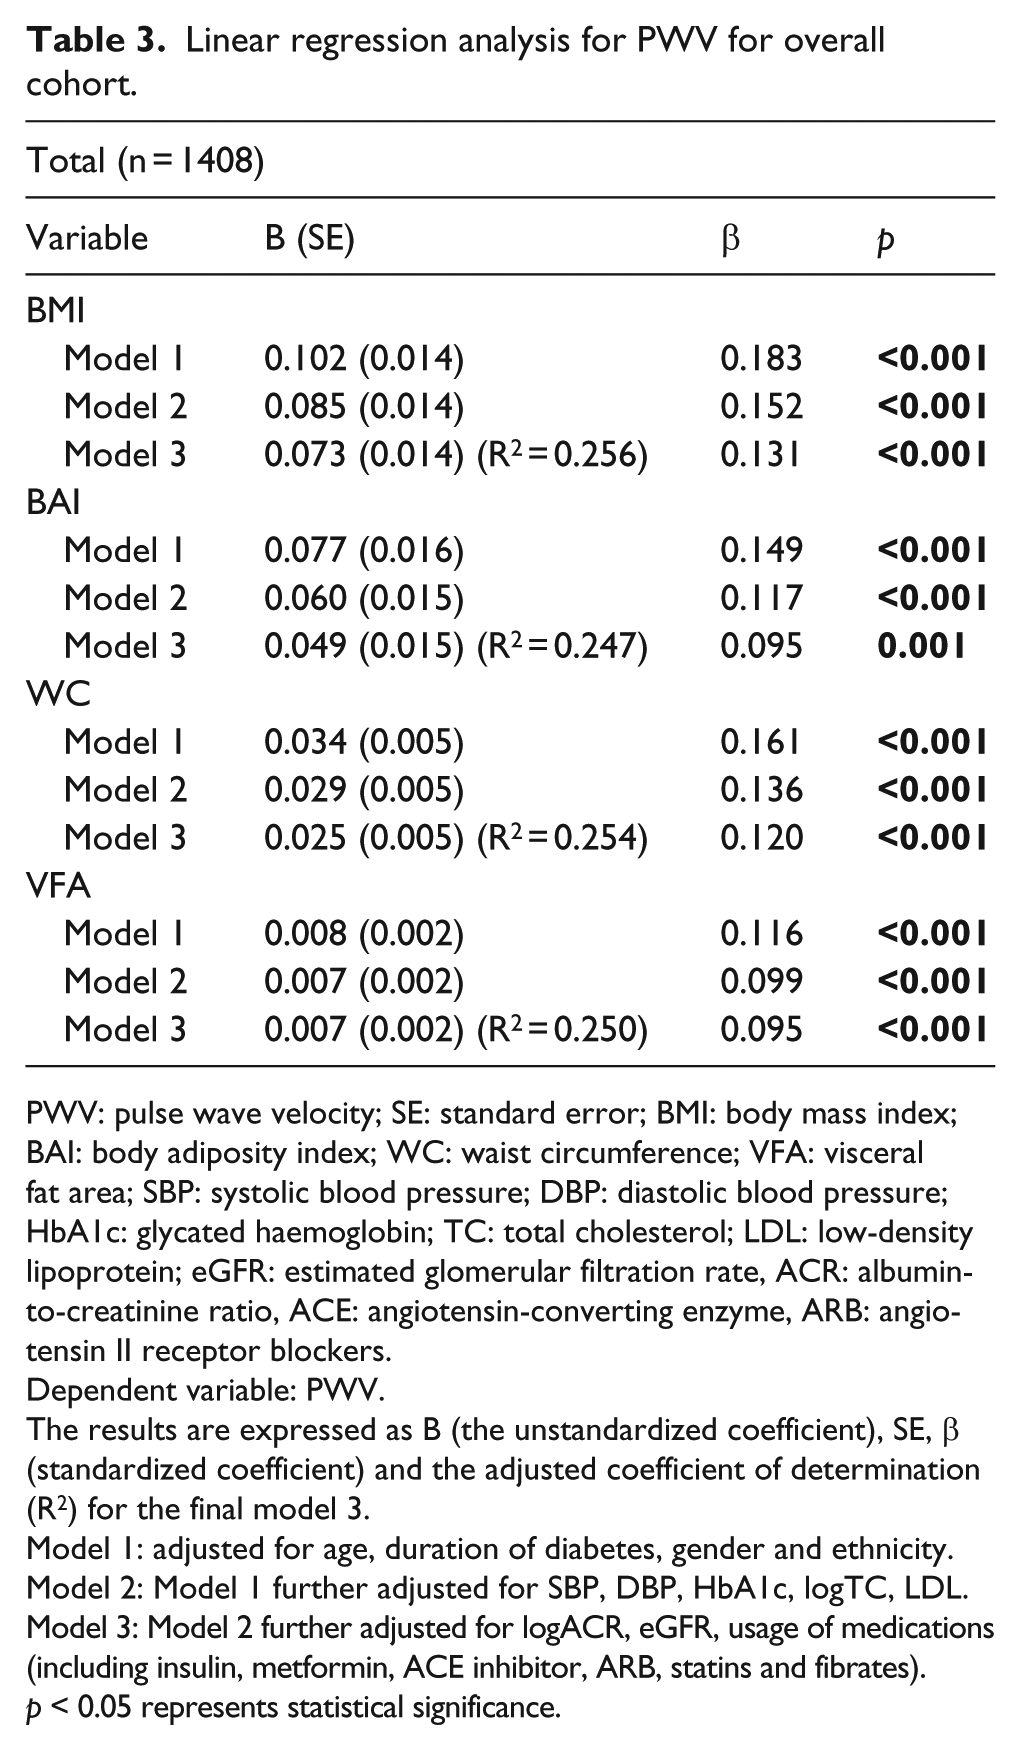
PWV: pulse wave velocity; SE: standard error; BMI: body mass index; BAI: body adiposity index; WC: waist circumference; VFA: visceral fat area; SBP: systolic blood pressure; DBP: diastolic blood pressure; HbA1c: glycated haemoglobin; TC: total cholesterol; LDL: low-density lipoprotein; eGFR: estimated glomerular filtration rate, ACR: albumin-to-creatinine ratio, ACE: angiotensin-converting enzyme, ARB: angiotensin II receptor blockers.
Dependent variable: PWV.
The results are expressed as B (the unstandardized coefficient), SE, β (standardized coefficient) and the adjusted coefficient of determination (R2) for the final model 3.
Model 1: adjusted for age, duration of diabetes, gender and ethnicity.
Model 2: Model 1 further adjusted for SBP, DBP, HbA1c, logTC, LDL.
Model 3: Model 2 further adjusted for logACR, eGFR, usage of medications (including insulin, metformin, ACE inhibitor, ARB, statins and fibrates).
p < 0.05 represents statistical significance.
No interaction between gender and measures of obesity on PWV was detected. However, a significant interaction was found between ethnicity and BAI on PWV (p = 0.014; data not shown), thus supporting data stratification by ethnicity. Interestingly, in contrast to BMI, WC and VFA, BAI failed to independently predict PWV in Chinese (Table 4). VFA had limited effect on PWV in Chinese because their association was attenuated after controlling for renal function and medications in model 3. In the Malay population, BMI and BAI, but not WC and VFA, were predictive of PWV after adjusting for confounding parameters. All adiposity indices were associated with PWV in the Indian subgroup, with the BAI-based model having the lowest R2 value. BMI consistently predicted PWV in all ethnicities.
Linear regression analysis for PWV stratified by ethnicity.
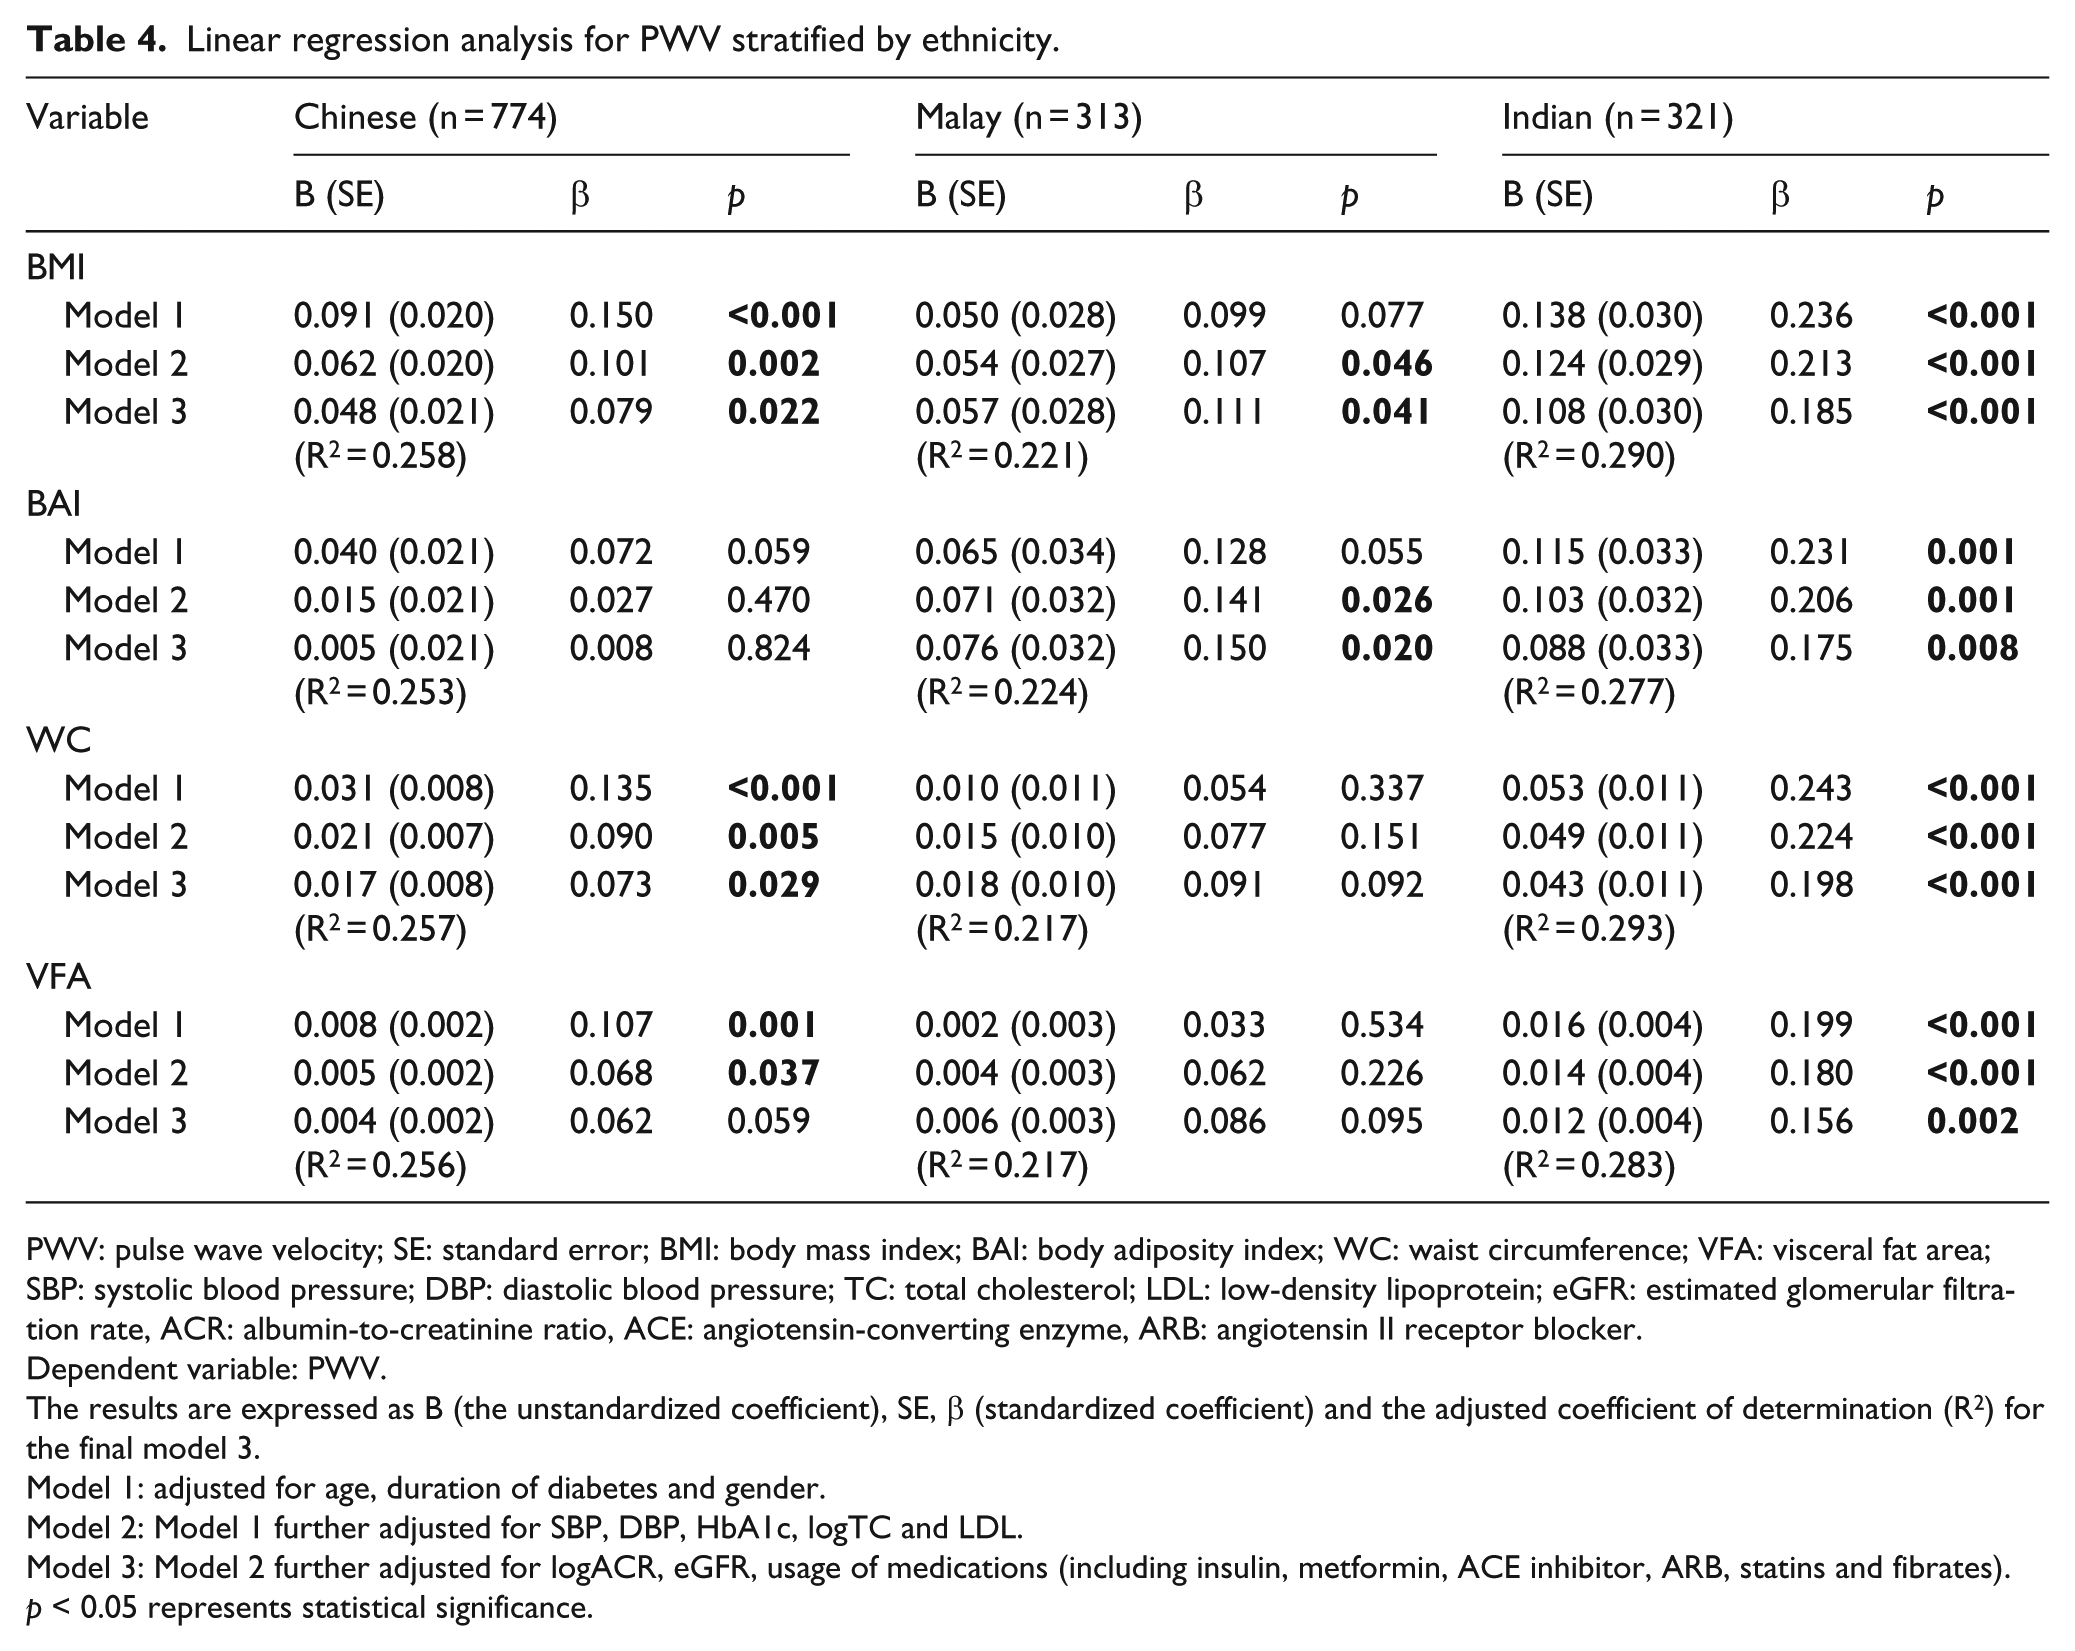
PWV: pulse wave velocity; SE: standard error; BMI: body mass index; BAI: body adiposity index; WC: waist circumference; VFA: visceral fat area; SBP: systolic blood pressure; DBP: diastolic blood pressure; TC: total cholesterol; LDL: low-density lipoprotein; eGFR: estimated glomerular filtration rate, ACR: albumin-to-creatinine ratio, ACE: angiotensin-converting enzyme, ARB: angiotensin II receptor blocker.
Dependent variable: PWV.
The results are expressed as B (the unstandardized coefficient), SE, β (standardized coefficient) and the adjusted coefficient of determination (R2) for the final model 3.
Model 1: adjusted for age, duration of diabetes and gender.
Model 2: Model 1 further adjusted for SBP, DBP, HbA1c, logTC and LDL.
Model 3: Model 2 further adjusted for logACR, eGFR, usage of medications (including insulin, metformin, ACE inhibitor, ARB, statins and fibrates).
p < 0.05 represents statistical significance.
Discussion
Previous studies have evaluated the association of BAI with metabolic and cardiovascular risk factors (but not AS) focused mainly on Caucasian populations.15–17 To the best of our knowledge, this is the first study that assessed the effectiveness of BAI as a predictor of AS, as reflected by carotid–femoral PWV, in a multi-ethnic Asian T2DM cohort. The key findings of this work are that anthropometric measures of both global (BMI and BAI) and regional (WC and VFA) adiposity predicted AS. However, BAI displayed the weakest association with PWV. Second, the pattern of association between these adiposity indices and AS appeared ethnic dependent as exemplified by BMI which predicted PWV in all the three major Asian ethnicities, whereas BAI was not a significant predictor of PWV in Chinese.
Increased AS is characteristic of patients with T2DM, especially in obese individuals. 6 Accumulating evidence indicates that weight loss reduces AS.9,18–20 Various measures of adiposity have been found to be associated with AS.10,11,21 Here, we showed that BMI, BAI, WC and VFA correlated with PWV. These obesity measures remained significantly associated with PWV after adjusting for potential risk factors. However, several lines of evidence suggest that the relationship between BAI and AS is inferior to BMI, WC and VFA. In contrast to the conventional measures of adiposity, BAI presented the weakest correlation with PWV, albeit significant. After adjusting for confounding variables, the BAI-based model explained the least observed variance in PWV when compared to models with BMI, WC and VFA. Moreover, the effect of BAI on PWV was diminished after inclusion of BMI, WC or VFA into the same model. On the other hand, BMI, WC and VFA remained significantly related to PWV after controlling for BAI and potential risk factors.
The weak association of BAI with AS is perhaps not unexpected. Although no known previous study has assessed the contribution of BAI to AS, several studies have investigated the association of BAI with CVD. A cross-sectional study conducted on Spanish Caucasian workers revealed lesser correlation of BAI with cardiovascular risk factors including TG, HDL, glucose and blood pressure than other conventionally used indices such as BMI, WC and waist-to-height ratio (WHtR). 17 Among Mexican Americans, BMI and WC was found to outperform BAI in their strength of correlation with cardiometabolic risk variables including LDL, HDL, TG, carotid intima-media thickness, insulin, FPG, SBP and DBP. 15 More recently, BAI was shown to lack predictive ability for CVD mortality after age and risk factor adjustments in Australian men. 16 Among Asians, BAI was described to be an inappropriate biomarker for screening hypertension, dyslipidemia, metabolic syndrome and carotid intima-media thickening in the Chinese population compared with WC and BMI. 22
Our study also showed that BAI is an ineffective determinant of body fatness for Asians. We demonstrated in our multi-ethnic cohort that BAI, when compared with BMI, WC and VFA, least correlated with BF%. This result is in contrast to the observation that BAI highly predicted BF% in Mexican-American and African-American subjects. 12 In support of our finding, Freedman et al. 23 presented BAI as an ineffective predictor of BF% in various ethnicities (White, Black, Hispanic, Asian and Others) − BAI overestimated BF% among men and underestimated BF% among women. BAI was also found to underestimate adiposity in a Chinese population in Singapore. 24 Despite BAI displaying stronger correlation with dual-energy X-ray absorption (DEXA)-derived BF% than BMI in the total cohort, this effect was reversed upon stratification by gender. Additionally, gender-adjusted models confirmed that BAI, in comparison to BMI, was not a better predictor of DEXA-derived BF%. Overall, the performance of BAI as an estimate of BF% seems to be ethnic dependent and is confounded by gender, suggesting limited generalizability of BAI. Although initially designed as a surrogate for BF% to overcome the limitations of BMI, the performance of BAI in estimating BF% in Asian population appears to be inferior to the traditional measures of obesity. The inadequateness of BAI could be attributed to its origin. 12 BAI was initially developed and validated on Mexican Americans and African Americans, 12 who have different distributions of body fat compared to Asians. Inaccurate measurement of HC in individuals who are severely obese may also contribute to the inaccuracy of BAI. Large variations in BAI scores have also been observed in very lean subjects with less than 10% of body fat. 12 Moreover, BAI is not a reliable marker of adiposity for people with excess abdominal fat but narrow hips.
Studies have often shown that regional obesity, rather than global obesity, is more closely linked to increased AS.10,25 Indices of central obesity including WC and WHtR consistently present higher level of correlation with PWV than BMI, a measure of general obesity, in healthy, diabetic and hypertensive subjects. 10 Similarly in our work, we observed a better correlation between measures of central obesity (WC and VFA) rather than general obesity (BMI and BAI) and PWV. However, after adjusting for potential confounders, no great difference in the strength of PWV prediction between central and global adiposity measures was detected, although regression models containing BMI and WC explained a slightly higher variance in PWV than models with VFA and BAI. Therefore, there is no obvious advantage of using regional adiposity indicators in AS prediction in our Asian T2DM cohort, in spite of their stronger correlation with PWV.
Stratification of our cohort by ethnicity revealed several interesting findings. While all measures of obesity independently predicted AS in Indians, disparity in the predictive ability of these measures existed in the Chinese and Malay subgroups. BAI, and to a less extent VFA, ineffectively predicted PWV in Chinese. Strikingly, measures of central obesity failed to contribute to the prediction of PWV in our Malay population. Conversely, both BMI and BAI showed significant association with PWV in this ethnic subgroup. Among the indicators of adiposity, BMI remained as the most useful obesity-related variable for estimating AS in our cohort because of its consistent ability to predict PWV across the different ethnic subgroups. It remains unclear why the regression model of Malays produced a poorer prediction performance compared to those of Chinese and Indians despite including the same combination of risk factors into the analyses. One possible explanation is the existence of other medical conditions that might increase PWV, given that the Malays displayed the poorest metabolic and renal profiles among the ethnic groups.
The strength of our study is the involvement of a large multi-ethnic Asian cohort with T2DM and the measurement of PWV using ‘gold standard’ method. The limitations include the cross-sectional design which precludes causal inference between the anthropometric measures and PWV, and not using the computed tomography scan to assess the amount of visceral fat. It is interesting to note that all the regression models constructed in this study accounted for less than 30% of variance in PWV. The suboptimal results may be attributed in part to the limitations of methodology used. For instance, bioelectrical impedance analysis for VFA has limited accuracy. WC is unable to distinguish between excess abdominal subcutaneous fat and visceral fat. BMI does not distinguish muscle and adipose tissue.
In conclusion, BAI fails to outperform the more widely used measures of adiposity in predicting AS. Measures of central obesity (WC and VFA) are not better determinants of AS than those of global obesity (BMI and BAI). BMI remains as the most reliable independent predictor of AS in multi-ethnic Asians with T2DM.
Footnotes
Acknowledgements
We thank staff from the Singapore Clinical Research Institute (SCRI) for their contribution to the study protocol and database design. Study data were collected and managed using REDCap electronic data capture tools hosted at the SCRI.
Declaration of conflicting interests
The authors declare that there is no conflict of interest.
Funding
This work was supported by the Singapore National Medical Research Council Grant [PPG/AH(KTPH)/2011].