
Abstract
Objective:
Although reported to be independent of obesity, the longitudinal changes of left ventricular structure and function have not been well characterized in normal-weight individuals with type 2 diabetes compared with overweight/obese individuals with type 2 diabetes.
Methods:
A total of 558 participants in the Korean Genome and Epidemiology Study who underwent tissue Doppler echocardiography at baseline (cycle 4) and after 8 years (cycle 8) were classified into three groups based on body mass index and diabetes status: (1) normal-weight individuals without type 2 diabetes, (2) normal-weight individuals with type 2 diabetes and (3) overweight/obese individuals with type 2 diabetes.
Results:
Only overweight/obese individuals with type 2 diabetes group had higher adjusted left ventricular mass index and lower tissue Doppler imaging early diastolic velocity and E/Em ratio compared with the normal-weight individuals without type 2 diabetes group at baseline and after 8 years. Participants in overweight/obese individuals with type 2 diabetes group also showed the higher prevalence and odds of left ventricular hypertrophy (16.0%; adjusted odds ratio: 2.24; 95% confidence interval: 1.22–5.06) and left ventricular diastolic dysfunction (49.1%; 3.45; 1.01–4.32). Among participants with normal left ventricular structure and function at baseline, only overweight/obese individuals with type 2 diabetes group was associated with greater incidence of left ventricular hypertrophy (relative risk: 2.28; 1.04–4.98) over 8 years but not diastolic dysfunction.
Conclusion:
Cross-sectional and longitudinal observations suggest that increasing body mass index category and its associated metabolic abnormalities at baseline are associated with an increased risk for left ventricular hypertrophy and greater impairment in left ventricular diastolic parameters.
Introduction
Diabetic cardiomyopathy refers to the presence of myocardial dysfunction in the absence of cardiac risk factors, such as coronary artery disease or hypertension, in patients with type 2 diabetes (T2D).1,2 Diabetic cardiomyopathy is initially characterized by diastolic dysfunction, followed later by systolic dysfunction and eventually by clinical heart failure. 3 Thus, diastolic abnormalities represent the first manifestation of diabetic cardiomyopathy.
As adults with T2D generally present with multiple risk factors for heart failure, the presence of a distinct primary ‘diabetic’ cardiomyopathy has been difficult to prove. 4 Obesity, for example, is an important confounder, as it is common in individuals with T2D and also increases risk for diastolic dysfunction. 5 Prior studies that have suggested an independent role of T2D on diastolic dysfunction have predominately studied obese individuals based on the body mass index (BMI).6,7 As majority of individuals with T2D are overweight or obese, normal-weight individuals with T2D (N-T2D) are generally underrepresented in studies, and the effects of T2D on cardiac structure and function in this group are less clear. However, evaluating individuals with N-T2D is needed to clarify cardiac effects of glycaemia independent of obesity.
The Ansan cohort represents a unique population of Korean adults who have been prospectively followed for 8 years with tissue Doppler imaging (TDI) technique. The primary aim of the current study was to evaluate the prevalence and the incidence of diastolic dysfunction in normotensive N-T2D versus overweight/obese individuals with type 2 diabetes (O-T2D). We hypothesize that only O-T2D will be at significantly greater risk for diastolic dysfunction when compared with normal-weight individuals without T2D (non-T2D).
Methods
Study population
Study participants were selected from the Ansan cohort, which is one of the population-based cohorts included in the Korean Genome Epidemiology Study (KoGES). 8 Briefly, at the baseline examination (cycle 1), which occurred between 2001 and 2002, 5012 individuals between the ages of 40 and 69 years were enrolled. They have been followed biennially for 8 years. At every visit, participants had a complete physical examination and completed interviewer-administered questionnaires about their medical history and cardiovascular disease (CVD) risk factors. At cycle 4 (2007–2008), the evaluation included a comprehensive echocardiographic study, which was conducted in 3255 individuals. Current analysis includes 558 individuals (339 non-T2D and 219 T2D) from this subset (Figure 1).
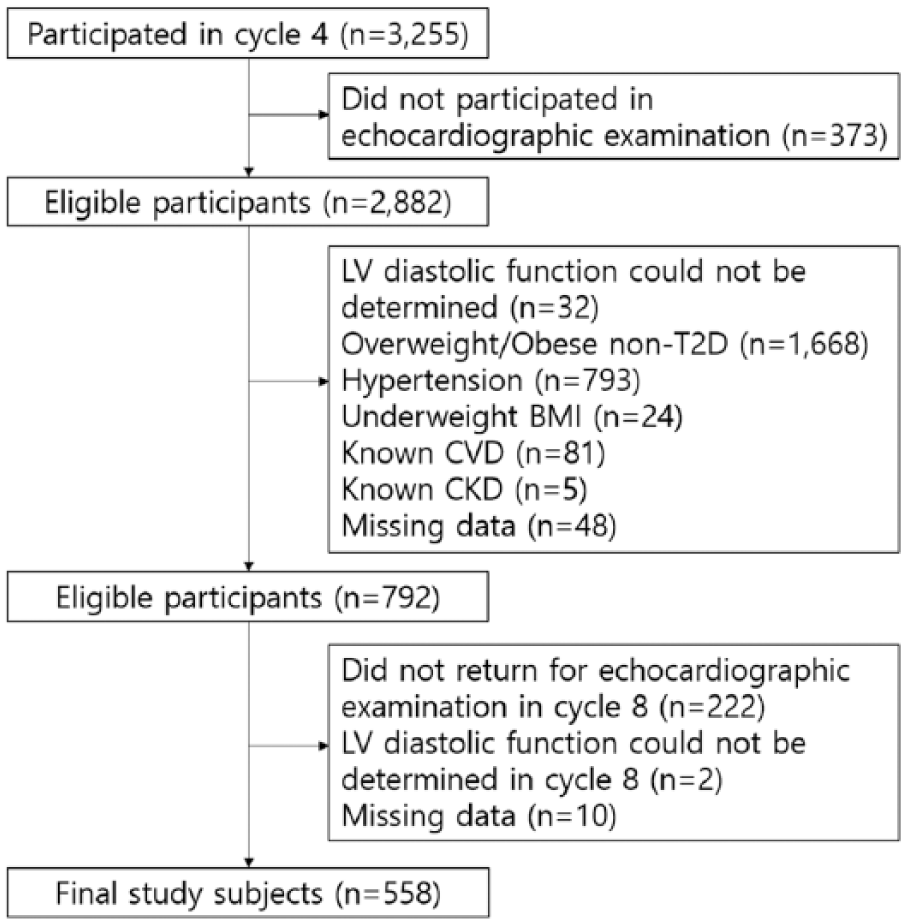
Flowchart for participants in the study.
To be included, individuals had to have an echocardiographic study at cycle 4 (considered baseline for the current analysis) and cycle 8 (2015–2016). Individuals were required to be normotensive [systolic blood pressure (BP) < 140 mmHg, diastolic BP < 90 mmHg, and taking no antihypertensive medication]. The non-T2D group had no diabetes based on medical history, haemoglobin A1c (HbA1c < 6.5%), and 75-g oral glucose tolerance test (OGTT) (fasting glucose < 126 mg/dL and 2 h glucose < 200 mg/dL); they were also normal weight (BMI: 18.5–22.9 kg/m2). Adults with T2D were subdivided into normal-weight (N-T2D, BMI: 18.5–22.9 kg/m2) and overweight/obese (O-T2D, BMI ⩾ 23 kg/m2) groups. 9 Diagnosis of T2D was determined based on HbA1c, OGTT or self-reported use of oral hypoglycaemic drugs or insulin according to the American Diabetes Association guidelines. 10 Exclusion criteria included the following: no OGTT with no history of T2D; underweight (BMI < 18.5 kg/m2); use of antihypertensive medications; depressed left ventricular (LV) ejection fraction (⩽ 52% for male and ⩽ 54% for female); 11 presence of regional LV wall motion abnormalities; known CVD including the previous history of myocardial infarction, coronary artery disease, congestive heart failure, valvular heart disease, stroke, cardiomyopathy, congenital heart disease, and arrhythmia; and a serum creatinine level ⩾ 2.0 mg/dL.
The Human Subjects Review Committee of the Korea University Ansan Hospital approved the study protocols. All participants provided written informed consent.
Clinical and laboratory measurements
At all visits, weight and height were measured to calculate the BMI. BP was measured twice using a standardized protocol and averaged. Individuals fasted for at least 8 h prior to blood draws. All participants without known T2D had an OGTT at inclusion (cycle 4). They also had measurement of HbA1c, fasting insulin, creatinine, high-sensitivity C-reactive protein (hsCRP) and lipid profile. All measurements were performed at the Seoul Clinical Laboratories (Seoul, Korea).
Echocardiographic assessment
All participants underwent a Doppler echocardiography and 2-D guided M-mode echocardiography using the Vivid 7 system (GE Vingmed, Horton, Norway) equipped with a 4 MHz transducer in accordance with standard recommendations. 11 Cardiac chamber diameters and wall thickness were determined by M-mode echocardiography. Left atrial (LA) volume and LV mass were calculated using the area-length method and Devereux formula, respectively, and normalized for body surface area to achieve the LA volume index and LV mass index. LV hypertrophy was defined as an LV mass index > 95 g/m2 in women and > 115 g/m2 in men. A modified biplane Simpson’s method was used to measure LV ejection fraction. Early (peak E wave) and late (peak A wave) mitral inflow filling velocities were obtained at the tips of the mitral valve leaflets from the apical four-chamber view. Pulsed-wave tissue Doppler was recorded in the septal side of the mitral annulus to assess both peak systolic (Sm) and early diastolic (Em) velocities. Subsequently, the mitral E/Em ratio was calculated as an index of LV diastolic filling pressure. Clinically relevant LV diastolic dysfunction was defined based on a reduced septal TDI Em velocity, septal E/Em ratio > 15 or LA volume index ⩾ 34 mL/m2. 12 As TDI Em velocity is highly dependent on age, an age-specific abnormal value for septal TDI Em velocity was calculated as a value greater than one standard deviation below the mean reference value.12,13
Statistical analysis
Baseline characteristics and echocardiographic data were presented as means ± standard deviations for continuous variables or as percentages for categorical variables. Differences between groups were compared by analysis of variance and χ2 test. We compared least-square means of echocardiographic variables at baseline and after 8 years using general linear models after adjusting for age, sex, mean BP, heart rate, current smoking, alcohol consumption, physical activity, creatinine, total cholesterol and triglyceride/high-density lipoprotein-cholesterol (TG/HDL) ratio as potential confounders. Furthermore, we performed mixed-effects modelling to assess the effect of the covariation between echocardiographic parameters that were observed at different time points on the same individuals as well as the fixed effect of group and time on the change in echocardiographic data. Multivariate mixed-effects logistic regression analysis was performed to estimate covariate-adjusted odds ratios (ORs) for the prevalence of LV hypertrophy and LV diastolic dysfunction. Covariates for the multivariate model were selected on the basis of univariate analyses and known risk factors for CVDs. To calculate relative risks for incident LV hypertrophy and LV diastolic dysfunction, proportional-hazards models were performed in participants with normal LV structure and function at baseline. A p value < 0.05 was considered significant for all analyses. SAS version 9.4 (SAS institute, Cary, NC, USA) was used for all analyses.
Results
Age and sex distribution were similar among the three groups (Table 1). Per design, the O-T2D group had a higher BMI compared with the other two groups, but the two normal-weight groups (non-T2D and N-T2D) had similar BMI. Also, the two T2D groups had higher fasting glucose and HbA1c compared with the non-T2D group. Although individuals were selected to be normotensive at baseline, systolic and diastolic BPs were significantly higher in O-T2D than non-T2D group. In addition, compared with non-T2D, O-T2D also had higher heart rate and worse metabolic profile (higher insulin and triglyceride, and lower high-density lipoprotein cholesterol (HDL-C) concentration). O-T2D also had worse lifestyle habits and was more likely to smoke and consume alcohol; they, however, reported increased physical activity compared with the non-T2D group. In contrast to the O-T2D group, N-T2D was similar to non-T2D group, except for higher heart rate and insulin concentration.
Baseline characteristics.
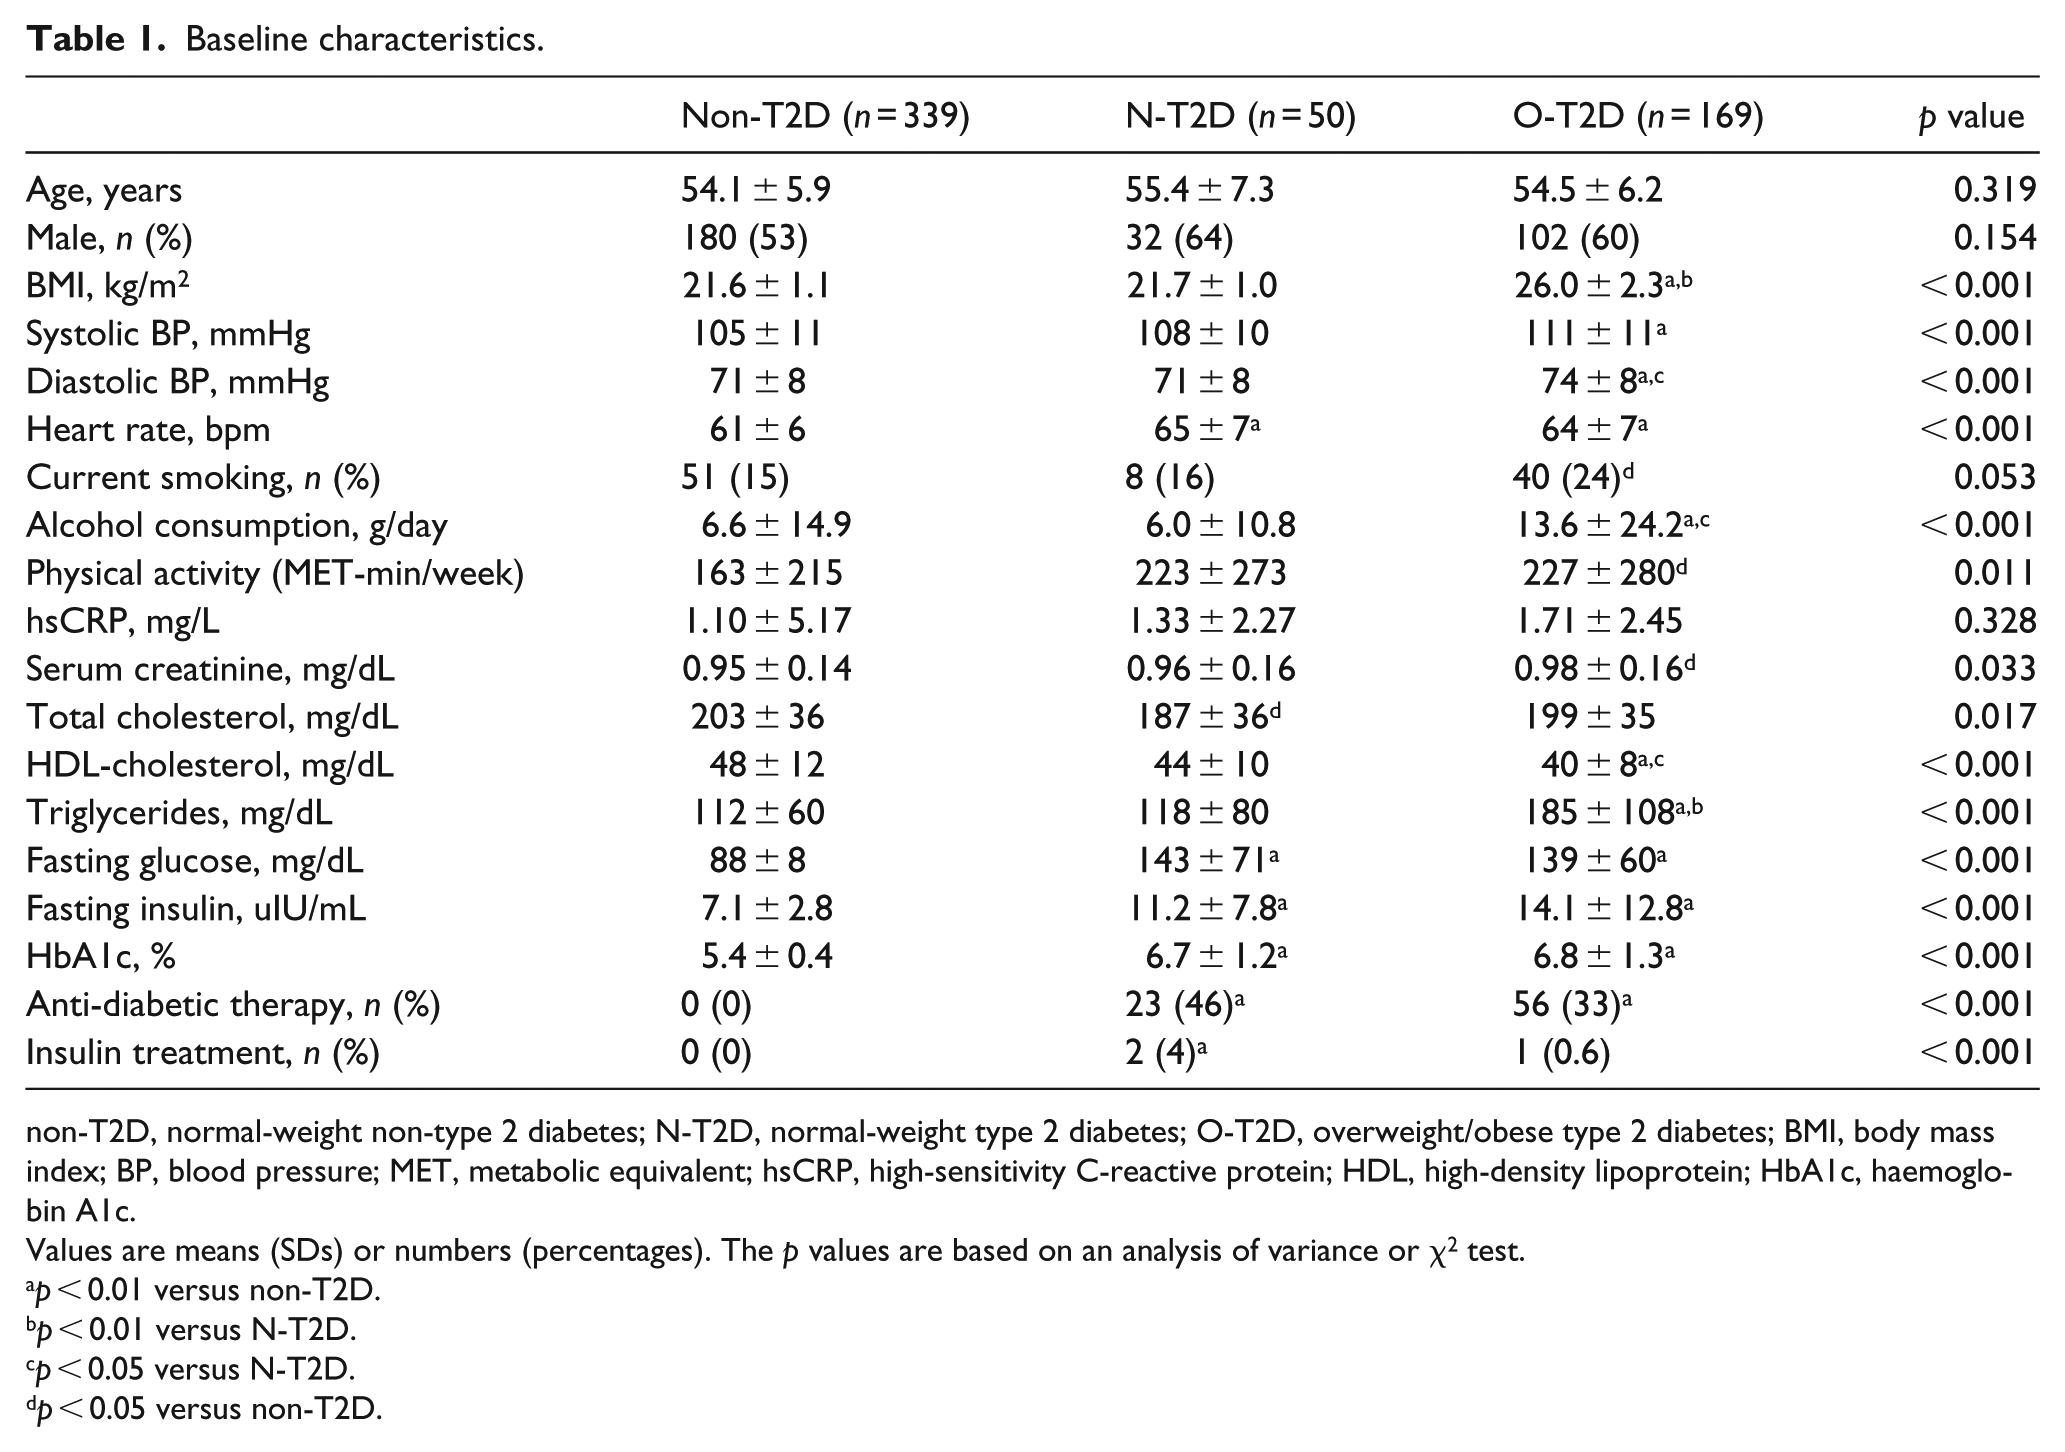
non-T2D, normal-weight non-type 2 diabetes; N-T2D, normal-weight type 2 diabetes; O-T2D, overweight/obese type 2 diabetes; BMI, body mass index; BP, blood pressure; MET, metabolic equivalent; hsCRP, high-sensitivity C-reactive protein; HDL, high-density lipoprotein; HbA1c, haemoglobin A1c.
Values are means (SDs) or numbers (percentages). The p values are based on an analysis of variance or χ2 test.
p < 0.01 versus non-T2D.
p < 0.01 versus N-T2D.
p < 0.05 versus N-T2D.
p < 0.05 versus non-T2D.
LV structure and function at baseline
As seen in Table 2, the O-T2D group had the highest LV mass index and the worst LV diastolic parameters, including mitral E/A ratio, TDI Em velocity and E/Em ratio. These differences persisted after adjustment for covariates. In the N-T2D group, there were no significant differences with the non-T2D group after adjustment. Accordingly, as seen in Table 3, the O-T2D group had the highest baseline prevalence of LV hypertrophy and LV diastolic dysfunction compared with the other two groups. After adjustment for baseline covariates, O-T2D showed a 2.2 and 3.5 increased ORs for LV hypertrophy and LV diastolic dysfunction, respectively, compared with the non-T2D group.
Cardiac structure and function at baseline.
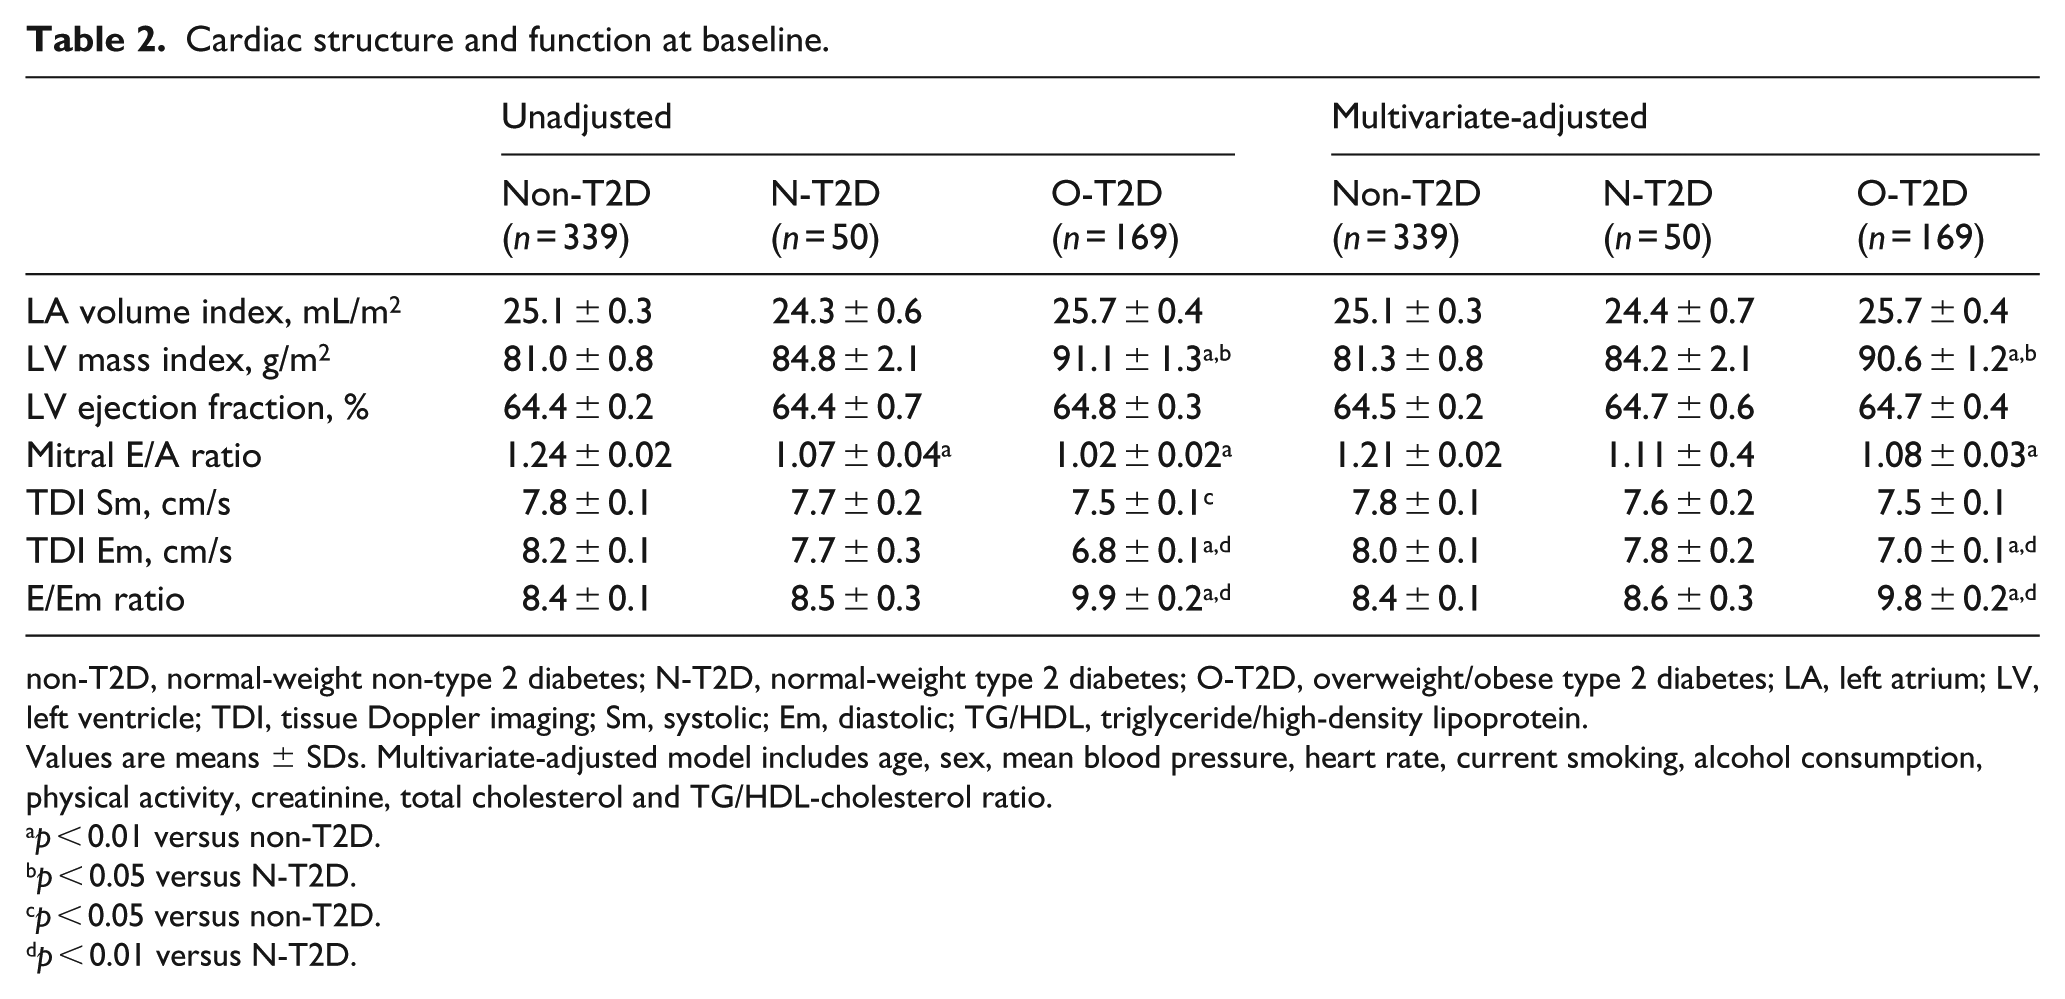
non-T2D, normal-weight non-type 2 diabetes; N-T2D, normal-weight type 2 diabetes; O-T2D, overweight/obese type 2 diabetes; LA, left atrium; LV, left ventricle; TDI, tissue Doppler imaging; Sm, systolic; Em, diastolic; TG/HDL, triglyceride/high-density lipoprotein.
Values are means ± SDs. Multivariate-adjusted model includes age, sex, mean blood pressure, heart rate, current smoking, alcohol consumption, physical activity, creatinine, total cholesterol and TG/HDL-cholesterol ratio.
p < 0.01 versus non-T2D.
p < 0.05 versus N-T2D.
p < 0.05 versus non-T2D.
p < 0.01 versus N-T2D.
Adjusted ORs of LV hypertrophy and LV diastolic dysfunction at baseline.
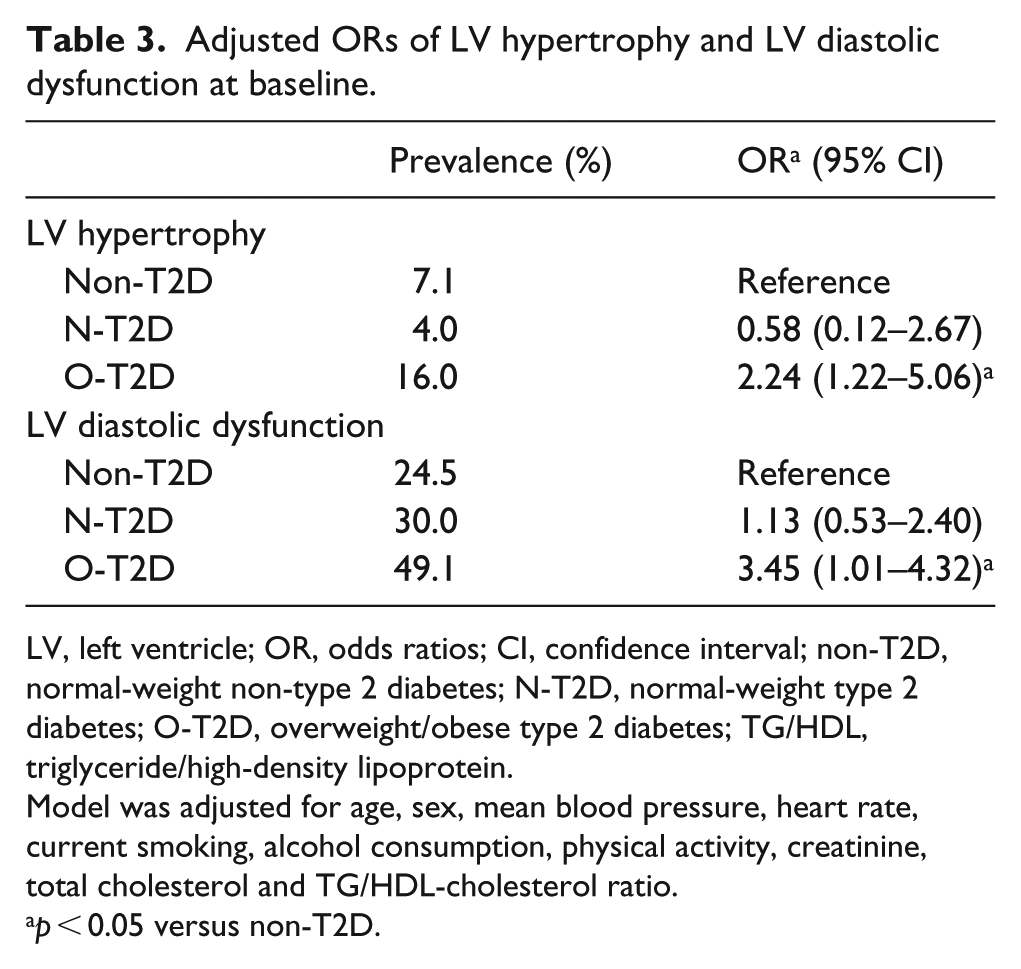
LV, left ventricle; OR, odds ratios; CI, confidence interval; non-T2D, normal-weight non-type 2 diabetes; N-T2D, normal-weight type 2 diabetes; O-T2D, overweight/obese type 2 diabetes; TG/HDL, triglyceride/high-density lipoprotein.
Model was adjusted for age, sex, mean blood pressure, heart rate, current smoking, alcohol consumption, physical activity, creatinine, total cholesterol and TG/HDL-cholesterol ratio.
p < 0.05 versus non-T2D.
Prospective changes in LV structure and function
Figure 2 displays the changes in multivariate-adjusted mean values of LV mass index (A), septal TDI Em velocity (B), and E/Em ratio (C) over 8 years in the three groups. LV mass index increased with time in all three groups (ptime < 0.001). O-T2D had significantly higher LV mass index compared with both non-T2D and N-T2D groups at baseline and follow-up, and there were no significant group interactions.
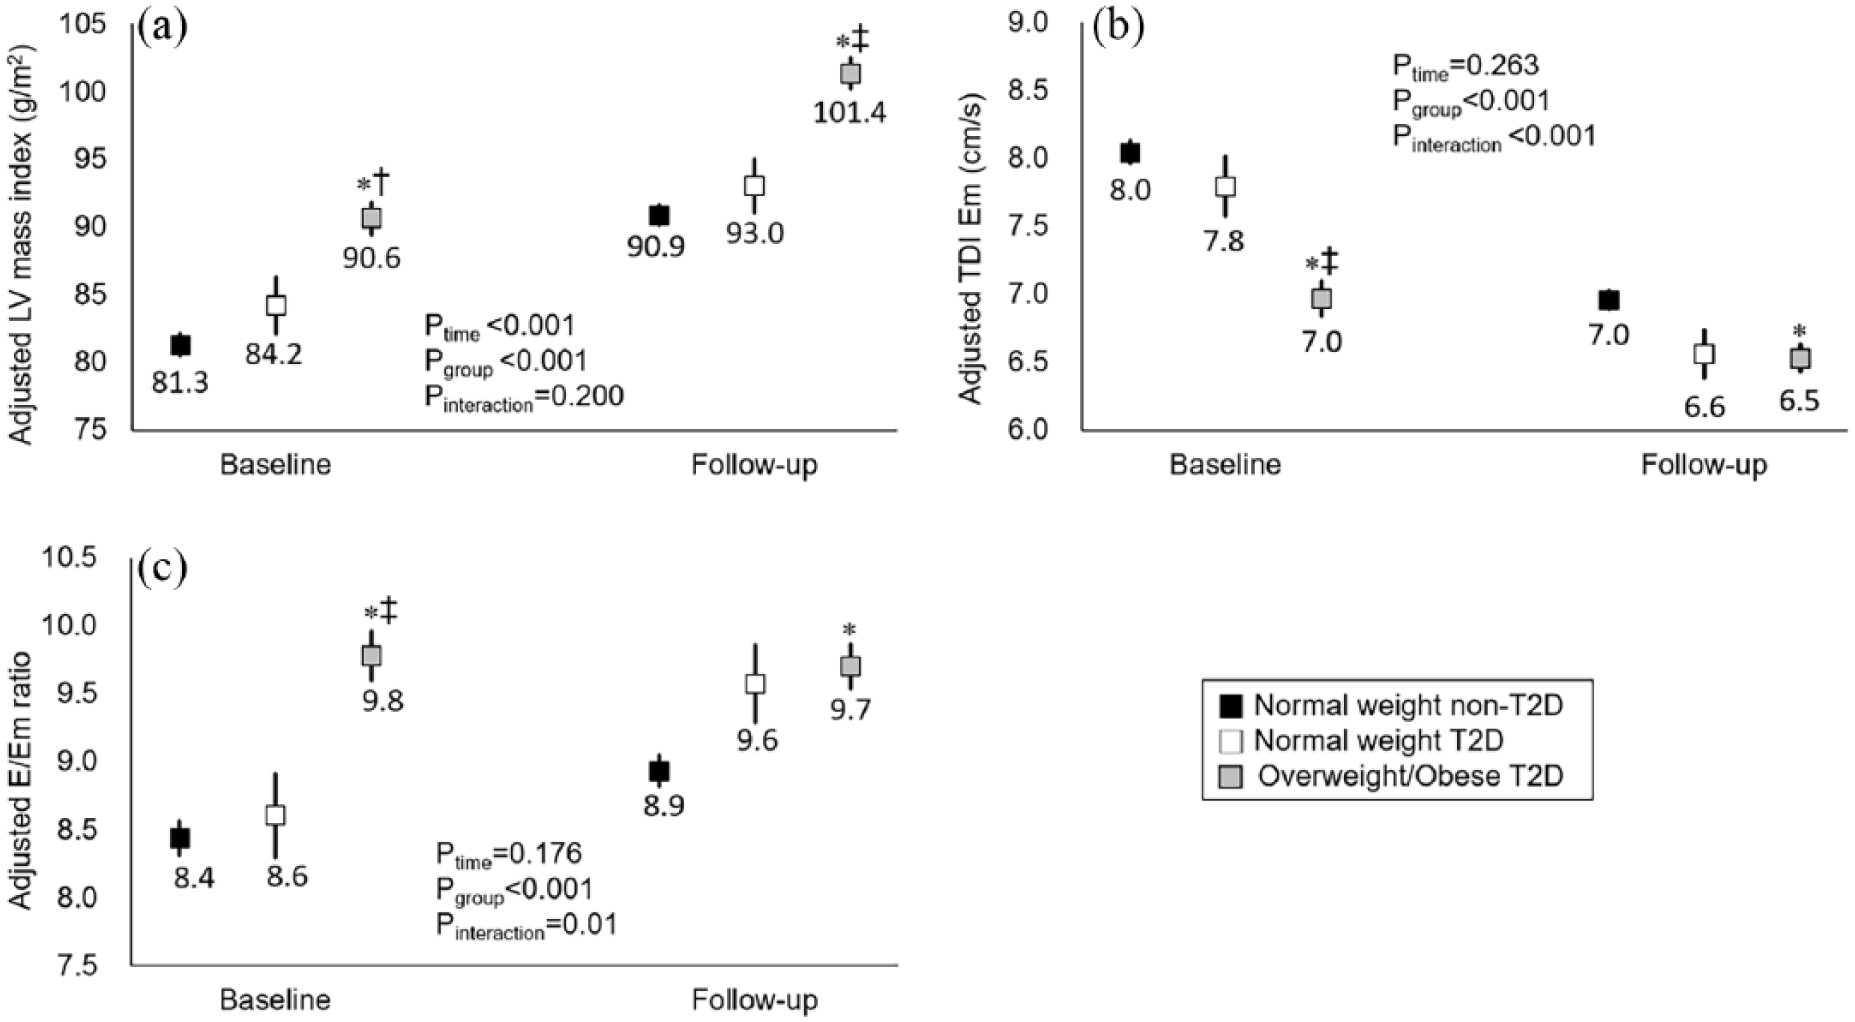
(a) Changes in LV mass index, (b) TDI Em velocity and (c) E/Em ratio. Multivariate mixed-effect linear regression models were used. The ptime indicates the effect of time on the changes in each parameter over 8 years. The pgroup reflects the effect of study group on each parameter across time. The pinteraction indicates the significance of whether the changes in each parameter over time differ by study groups. Each parameter was adjusted for age, sex, mean blood pressure, heart rate, current smoking, alcohol consumption, physical activity, creatinine, total cholesterol and TG/HDL-cholesterol ratio. Data represented as mean ± SE.
At baseline, O-T2D group had significantly lower Em velocity and higher E/Em ratio compared with the non-T2D and N-T2D groups. In contrast to LV mass index, the pattern of change in TDI Em (Figure 2(b)) and E/Em ratio (Figure 2(c)) varied by group. Thus, there was no significant effect of time but a significant interaction among groups due to the accelerated decline in Em and increase in E/Em ratio in the N-T2D group and more modest changes in the O-T2D group.
In Table 4, we also evaluated incident LV hypertrophy and LV diastolic dysfunction in those with normal LV structure (n = 315 in non-T2D, n = 48 in N-T2D and n = 142 in O-T2D) and function (n = 256 in non-T2D, n = 35 in N-T2D and n = 86 in O-T2D) at baseline. The O-T2D group, but not the N-T2D, had significantly increased incidence of LV hypertrophy compared with the non-T2D group. There was no significant increase in incident LV diastolic dysfunction in either the O-T2D group or N-T2D group.
Relative risk of incident LV hypertrophy and LV diastolic dysfunction in individuals with normal LV structure and function at baseline after adjustment for potential risk factors using proportional-hazard model.
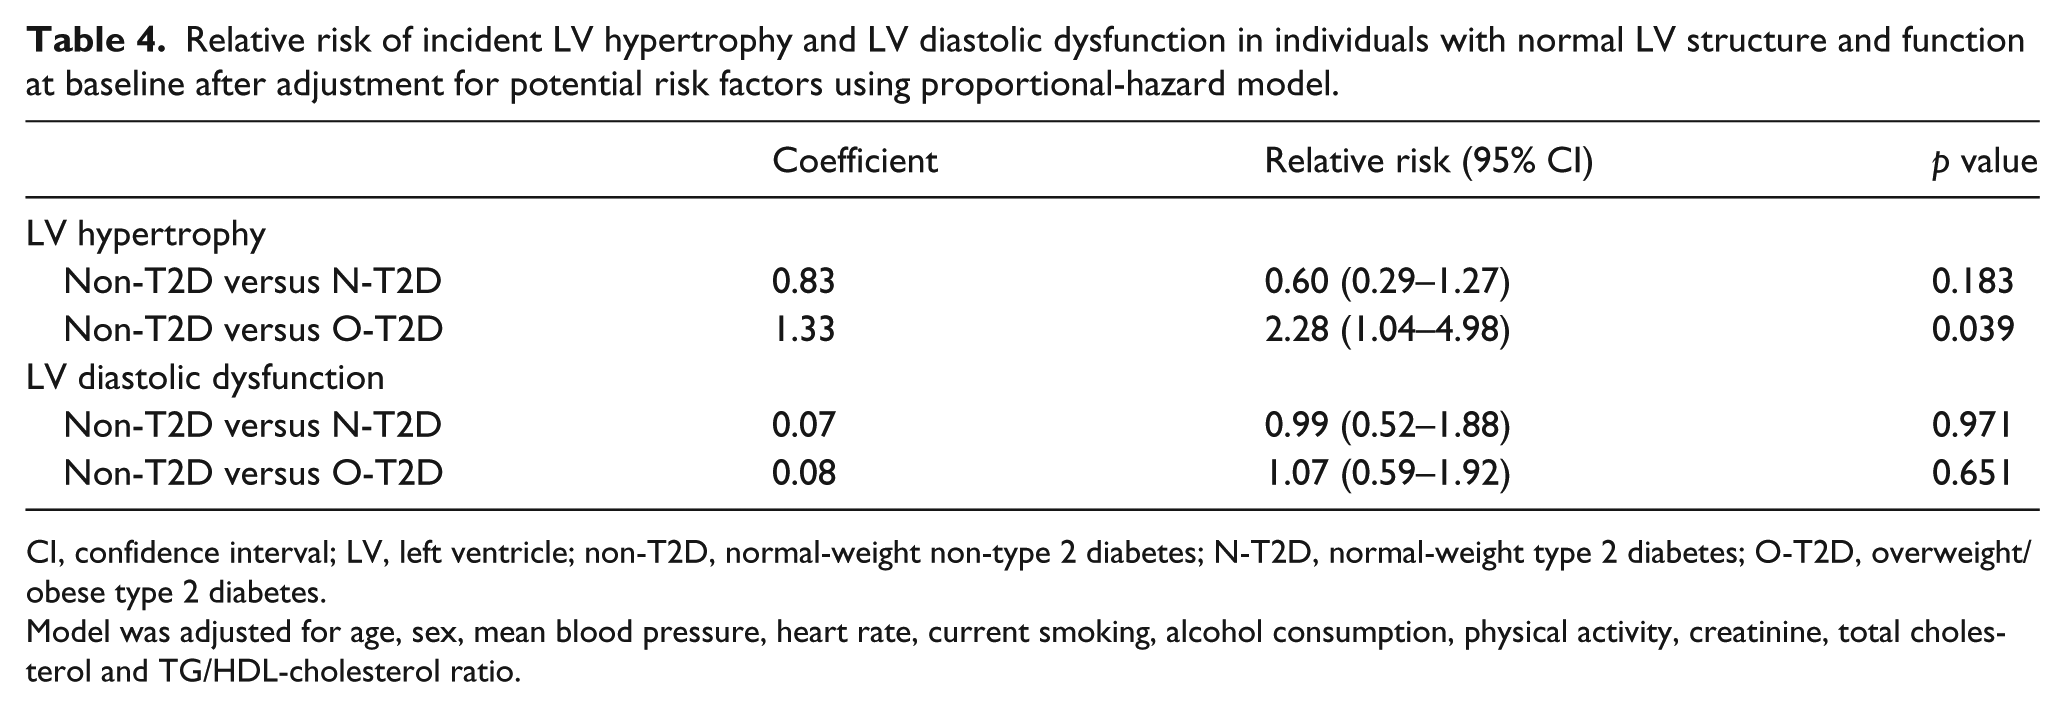
CI, confidence interval; LV, left ventricle; non-T2D, normal-weight non-type 2 diabetes; N-T2D, normal-weight type 2 diabetes; O-T2D, overweight/obese type 2 diabetes.
Model was adjusted for age, sex, mean blood pressure, heart rate, current smoking, alcohol consumption, physical activity, creatinine, total cholesterol and TG/HDL-cholesterol ratio.
Changes in risk factor management
Supplemental Table 1 shows changes in CVD risk factors and medication usage at follow-up in the three groups. In the two T2D groups, BMI decreased slightly, whereas it increased in the non-T2D group. Systolic BP significantly increased in all the three groups. Although a proportion in all groups initiated antihypertensive drugs, only the O-T2D group had a significant decline in diastolic BP. The use of statin therapy also increased at follow-up, but only significantly in the O-T2D and non-T2D groups. Thus, total cholesterol significantly decreased in all groups, and HDL increased significantly only in the O-T2D and non-T2D groups. Glucose indices increased significantly in all groups but the use of anti-diabetic drugs increased only in the O-T2D group.
Discussion
The purpose of this study was to compare baseline and prospective changes in LV structure and function in N-T2D versus O-T2D groups. The O-T2D group had higher prevalence and incidence of LV hypertrophy and higher prevalence of diastolic dysfunction at baseline compared with the non-T2D group. In contrast, the N-T2D group had no increased risk of LV hypertrophy or LV diastolic dysfunction compared with non-T2D. Thus, as hypothesized, only the O-T2D manifested greater risk for higher LV mass and impaired diastolic function compared with normal-weight individuals, suggesting a greater effect of baseline obesity on LV structure and function in T2D with moderate hyperglycaemia.
We are not aware of other studies that have evaluated baseline and prospective changes in LV diastolic function in adults with T2D stratified by obesity. Prior studies have predominately studied obese (BMI > 30 kg/m2) individuals with T2D6,7 and suggested a role for both T2D and obesity. In our study, only the O-T2D group had a higher prevalence for diastolic dysfunction at baseline compared with the non-T2D group, suggesting a greater role of obesity than T2D. Both our T2D groups had relatively good glucose control with average HbA1c of < 7% at baseline. Thus, the glycaemic effects on LV function may have been less evident compared with populations with higher HbA1c. 14
Although individuals with T2D are characterized by insulin resistance, 15 obesity accentuates the complications associated with insulin resistance. Thus, at a given degree of insulin resistance, increase in BMI is associated with higher systolic BP, triglyceride and lower HDL-C–components of the metabolic syndrome. 16 In the current study, the O-T2D group had higher BP, despite selecting for individuals who were normotensive, and higher triglyceride and lower HDL-C compared with the non-T2D and N-T2D groups. Although the O-T2D group had higher prevalence of diastolic dysfunction despite adjusting for these variables, the risk for diastolic dysfunction likely relate to a compilation of changes associated with insulin resistance, irrespective of T2D. In support, a recent study showed increase in risk of diastolic dysfunction in those with metabolic syndrome regardless of the diagnosis of T2D. 17
At follow-up, the N-T2D group had a stepper decline in TDI Em velocity and increase in E/Em ratio. Reasons are unclear, but the O-T2D group was more aggressively treated with medications to lower BP, lipids and glucose. These results could have led to more equalization of metabolic abnormalities between O-T2D and N-T2D (Supplemental Table 1), especially for BP. Unfortunately, we did not have classes of medications used by individuals, but medication choices may have attenuated worsening in cardiac function in the O-T2D compared with N-T2D group. For example, both glucagon-like protein 1 receptor agonists and sodium-glucose cotransporter-2 inhibitors have shown cardiac benefits with reduction in cardiac deaths18,19 and reduction in heart failure. 19 Consequently, medication choices or other interventions could have tempered the risk of incident LV diastolic dysfunction in O-T2D after 8 years of follow-up, although a significant impairment of diastolic indexes was still observed. Nevertheless, the reasons for an increased risk of incident LV hypertrophy in O-T2D group are not fully explained. Based on previous studies, antihypertensive medications were less effective for the reduction of LV mass in T2D than in non-T2D. 20 In addition, a potential interactive effect of obesity and high BP in O-T2D group might have contributed to the increased LV mass. 21
Study limitations
Although our study has several strengths, including a prospectively followed cohort who were normotensives at baseline, we had some limitations. First, study participants did not have stress testing or coronary angiogram at baseline; thus, some individuals in our cohort may have had subtle coronary artery disease that could have affected LV diastolic function. Second, we did not screen for type 1 diabetes (T1D), especially in the N-T2D group; therefore, some individuals identified with T2D may have had T1D. However, the prevalence of T1D in Korea is reported to be extremely low–0.017%–0.021% of the Korean population 22 –and T1D has also been associated with increased risk of LV diastolic dysfunction. 23 Interestingly, BMI appears to be an independent predictor of LV diastolic dysfunction in individuals with T1D. 23 Third, because additional analysis including overweight/obese individuals without T2D was not performed, LV alterations in O-T2D group may have been caused by a multifactorial process and not by a single risk factor. And being normal weight or having overweight/obesity was not analysed as a continuous variable in assessing the alterations of LV. Fifth, B-type natriuretic peptide levels were not measured in this cohort, which are objective indicators for assessing LV dysfunction. Lastly, as mentioned, our cohort had relatively well-controlled T2D, and we cannot exclude effects of higher degree of glycaemia on cardiac structure and function. However, both N-T2D and O-T2D had similar glycaemic control, which was significantly greater than the non-T2D group and allowed comparison of the two groups independent of glycaemic differences.
Conclusion
In summary, only the O-T2D group, and not the N-T2D, had increased LV hypertrophy and LV diastolic dysfunction. Thus, we suggest that targeting weight loss could provide cardiac benefits in patients with T2D because the pathologic LV remodelling relates to baseline obesity and its associated metabolic abnormalities.
Supplemental Material
Supplementary_Table – Supplemental material for Longitudinal changes in left ventricular structure and function in patients with type 2 diabetes: Normal weight versus overweight/obesity
Supplemental material, Supplementary_Table for Longitudinal changes in left ventricular structure and function in patients with type 2 diabetes: Normal weight versus overweight/obesity by Seong Hwan Kim, Ki-Chul Sung, Seung Ku Lee, Juri Park, Nan Hee Kim, Sun H Kim and Chol Shin in Diabetes & Vascular Disease Research
Footnotes
Author’s contribution
Seong H.K. and Sun H.K. contributed to design and conception, acquisition of data, interpretation of data and writing of the first and final drafts of the article. C.S. is the principal investigator of the Ansan cohort study and interpreted the results and edited the article. S.K.L. contributed to data management and statistical analyses. K.C.S. J.P. and N.H.K. critically reviewed and edited the article. All authors approved the article for publication. Seong H.K., Seung H.K. and C.S. are responsible for the integrity of the work as a whole.
Declaration of conflicting interests
The author(s) declared no potential conflicts of interest with respect to the research, authorship, and/or publication of this article.
Funding
The author(s) disclosed receipt of the following financial support for the research, authorship, and/or publication of this article: This study was supported by grants (2007-E71001-00, 2008-E71001-00, 2015-P71001-00 and 2016-E71003-00) from the Korean Centres for Disease Control and Prevention.
Supplemental material
Supplemental material for this article is available online.
References
Supplementary Material
Please find the following supplemental material available below.
For Open Access articles published under a Creative Commons License, all supplemental material carries the same license as the article it is associated with.
For non-Open Access articles published, all supplemental material carries a non-exclusive license, and permission requests for re-use of supplemental material or any part of supplemental material shall be sent directly to the copyright owner as specified in the copyright notice associated with the article.