
Abstract
Peripheral nerve blood flow (NBF) does not autoregulate but, instead, responds passively to changes in mean arterial pressure (MAP). How this relationship is impacted by insulin-treated experimental diabetes (ITED) is unknown. We tested the hypothesis that ITED will reduce NBF across a range of MAP in Sprague Dawley rats. Following 10 weeks of control or ITED conditions, conscious MAP (tail-cuff) was measured, and under anaesthesia, the MAP (carotid artery catheter, pressure transducer) and NBF (Doppler ultrasound, 40 MHz) responses to sodium nitroprusside (60 µg/kg) and phenylephrine (12 µg/kg) infusion were recorded (regression equations for MAP vs NBF were created for each rodent). Thereafter, motor nerve conduction velocity (MNCV) and nerve vascularization (haematoxylin and eosin stain) were determined. Conscious MAP was higher and MNCV was lower in the ITED group (p < 0.01). In response to drug infusions, the ΔMAP and ΔNBF were similar between groups (p ≥ 0.18). Estimated conscious NBF (based on substituting conscious MAP values into each individual regression equation) was greater in the ITED group (p < 0.01). Sciatic nerve vascularization was similar between groups (p ≥ 0.50). In contrast to the hypothesis, NBF was not reduced across a range of MAP. In spite of increased estimated conscious NBF values, MNCV was reduced in rats with ITED.
Introduction
The aetiology of diabetic peripheral neuropathy (DPN) may be explained partially by declining peripheral vascular function. 1 In rats with experimental diabetes, deficits in motor nerve conduction velocity (MNCV) are often linked with reduced basal nerve blood flow (NBF).2–6 The mechanism responsible for reducing NBF is multifactorial and may include abnormalities in autonomic function, calcium handling, endothelial function, lipid/glucose metabolism or the renin–angiotensin system; for review, see Zochodne. 7 Reduced NBF is believed to contribute to neural ischaemia resulting in nerve dysfunction and DPN.1–3 However, decrements in NBF do not always precede DPN.8–10 Indeed, some authors have documented no change 8 or increased9,11,12 NBF following diabetes induction. The relationship between basal NBF and nerve function remains to be elucidated fully. However, it appears that diabetes-induced nerve dysfunction may occur independent of reduced NBF.
Hypertension is an independent risk factor for DPN. 13 Theoretically, because NBF does not autoregulate but, instead, responds passively to changes in blood pressure,14–19 elevated blood pressure should result in augmented NBF. However, Gregory et al. 6 documented that rats with diabetes had low NBF in the presence of normal and high blood pressure. These observations were associated with peripheral nerve microangiopathy and suggest that the non-autoregulatory relationship between blood pressure and NBF is altered in a diabetic state.
In a recent study, patients defined as having poorly controlled type 1 diabetes presented with ~9% glycosylated haemoglobin values. 20 This corresponds to a blood glucose concentration of ~13.5 mmol/L 21 and contrasts with values obtained during experimental diabetes (blood glucose = 27–43 mmol/L)2–4 emphasizing the problem that chronic, severe hyperglycaemia may not reflect a moderately hyperglycaemic insulin-treated, type 1 diabetes state. In rats with experimental diabetes, insulin treatment partially restores resting NBF,4,22 improves vasa nervorum reactivity 23 and enhances nerve function.4,24–26 How insulin treatment impacts microangiopathy remains unclear,26–28 and whether it alters the relationship between blood pressure and NBF is unknown.
The purpose of this study was to examine the effect of chronic, moderate hyperglycaemia (i.e. more clinically relevant blood glucose concentrations) on the relationship between blood pressure and NBF. We tested the hypothesis that moderately hyperglycaemic insulin-treated experimental diabetes (ITED) would reduce basal sciatic NBF and also alter the non-autoregulatory relationship such that NBF would be reduced across a range of mean arterial pressures (MAP).
Methods
Moderately hyperglycaemic ITED rat model 29
Over five consecutive days, 8-week-old male Sprague Dawley rats (Charles River Laboratories, Saint-Constant, QC, Canada) were injected with 20 mg/kg streptozotocin (STZ; Sigma–Aldrich, St Louis, MO, USA; citrate buffer pH 4.5). Post confirmation of two blood glucose readings ≥18 mmol/L, rats received a surgically implanted subcutaneous insulin pellet (Linplant; LinShin, Toronto, ON, Canada; release rate 1 IU/12 h; one pellet per 150 g mass and one pellet for each additional 100 g). To maintain moderate hyperglycaemia and replicate blood glucose values observed in humans with poorly controlled type 1 diabetes, 20 blood glucose was monitored daily during the first week of insulin therapy and weekly thereafter, and pellet size was adjusted accordingly. Experimental testing occurred at 10 weeks post implantation of the first insulin pellet.
Experimental design
All procedures complied with the Animal Care Guidelines and Ethics Approval Board of the University of Western Ontario. Rats were housed in pairs at a constant temperature of 20°C ± 1°C with a 12-h light/dark cycle and had ad libitum access to commercial chow (Prolab RMH 3000; LabDiet, St Louis, MO, USA) and water. Rats were randomly divided into two groups: control (n = 8, mass = 560 ± 31 g) and ITED (n = 9, mass = 456 ± 33 g). Saphenous vein blood samples were collected weekly during the fed state, and blood glucose was measured (data presented as average blood glucose throughout the study). At the end of the 10th week, blood pressure in the conscious animal was measured. Subsequently, under anaesthesia, nerve arterial vasomotor control and MNCV were assessed. Thereafter, sciatic nerves were harvested for histological analyses.
Conscious blood pressure testing (control, n = 7; ITED, n = 9)
MAP, systolic blood pressure (SBP) and diastolic blood pressure (DBP) as well as heart rate were measured using the tail-cuff method (CODA; Kent Scientific Co., Torrington, CT, USA) in conscious rats. Prior to data collection, all rats were familiarized with the CODA system on multiple occasions.
Surgical procedures
Rats inhaled isoflurane gas (4%) and received an intra-peritoneal injection of urethane (25 mg/kg) and α-chloralose (4 mg/kg) prior to the onset of surgery. After ~20 min, the gas was removed and the urethane α-chloralose mixture alone maintained surgical depth. A warming blanket was used to maintain rat body temperature at 37°C (rectal probe). A catheter inserted into the right jugular vein facilitated all anaesthetic and drug infusions. A catheter inserted into the right carotid artery was connected to a pressure transducer (PX272; Edwards Lifesciences, Irvine, CA, USA) and enabled continuous blood pressure recordings. Thereafter, the left sciatic nerve was exposed via blunt dissection. 30
NBF-velocity protocol (control, n = 6; ITED, n = 6)
After surgery, following 1 h of stabilization, MAP and nerve blood velocity (NBV; Vevo 2100 ultrasound system; VisualSonics, Toronto, ON, Canada) were measured at baseline 1 (pre-sodium nitroprusside; SNP), during SNP (60 µg/kg, 110 µg/mL) infusion (early and late), baseline 2 (pre-phenylephrine; PE) and during PE (12 µg/kg, 10 µg/mL) infusion (early and late).
Vascular conductance and estimated conscious NBV
Sciatic NBV and MAP values were used to calculate the index of vascular conductance (VC = BV/MAP). Sciatic NBV was plotted as a function of MAP for the time points: baseline 1, baseline 2, SNPearly, SNPlate, PEearly and PElate; and regression equations for each animal were created, averaged and plotted separately for each group. Conscious MAP values were substituted into the appropriate individual regression equations to estimate conscious NBV values for each rodent, in both groups.
MNCV protocol (control, n = 7; ITED, n = 6)
Following the pharmacological intervention, MNCV was determined in the sciatic–tibial nerve. The left sciatic nerve was stimulated first at the sciatic notch and then at the popliteal fossa. Using a constant-voltage clinical electrical stimulator (Neuroscan Comperio; Compumedics Medical Systems, El Paso, TX, USA), nerve stimulation consisted of a series of single 100 µs, supramaximal pulses delivered through a bipolar stimulating electrode that was held over the exposed nerve. Supramaximal stimulation was achieved at ~20 mA. The evoked compound muscle action potentials (CMAP) were recorded from the tibialis anterior muscle using intramuscular, tungsten recording electrodes inserted into the muscle.
Sciatic nerve harvesting (control, n = 6; ITED, n = 6)
After the MNCV experiment, rats were euthanized and their sciatic nerves were harvested, fixed in 4% paraformaldehyde for 72 h and embedded in paraffin blocks for histological analysis. Tissue blocks were transversely sectioned 8 µm thick, mounted on positively charged slides (VWR Superfrost Plus; VWR, Batavia, IL, USA) and stained with a routine haematoxylin (H) and eosin (E) protocol. The H&E stain was used to expose blood vessels and quantify total sciatic nerve fascicular blood vessel number. 31
Data acquisition and analysis
The analog blood pressure signal sampling occurred at 1000 Hz (PowerLab; ADInstruments, Colorado Springs, CO, USA). Pulsatile blood pressure over five beats (corresponding to the same five NBV waveforms) was averaged to calculate MAP.
NBV was measured using Doppler ultrasound and a 40-MHz linear array probe (MS550D) transducer placed over an artery lying superficially along the sciatic nerve. Power Doppler was used to locate the superficial nerve artery. This arterial segment was studied using the duplex imaging mode (frequency of 32 MHz with 100% power, pulse repetition frequency (PRF) between 4 and 5 kHz and wall filter of 40–50 Hz) with the pulsed wave Doppler gate (~0.12 mm width) positioned over the site of the high-power Doppler signal (insonation angle of 60°). This ultrasound system did not have sufficient resolution to measure changes in the sciatic nerve supply artery diameter in B-mode images. Thus, peak NBV (outer envelope of the flow-velocity waveform) represents a surrogate for NBF rate.
CMAP were displayed and stored on a digital electromyography (EMG) acquisition system (Neuroscan Comperio; Compumedics Medical Systems). EMG signals were sampled at 10 kHz and band-pass filtered at 10 Hz–10 kHz. MNCV was calculated by subtracting the distal from the proximal latency (measured in milliseconds) from the stimulus artefact of the initial inflection of the evoked CMAP waveforms, and the difference was divided into the distance between the two stimulation sites (measured in millimetres). The MNCV was reported in metres per second.
The number of nerve blood vessels in the largest fascicle was counted independently by two observers blinded to the experimental condition. Images were taken on an Axiovert S100 brightfield microscope at 40× magnification, using Northern Eclipse imaging software (EMPIX Imaging Inc., Mississauga, ON, Canada). To determine the total vessel count, the nerve fascicle of interest was visually sectioned into quadrants. The aggregate of each quadrant represented the total vessel count for the individual nerve fascicle. The measurements from the two observers were averaged for each nerve, and the average value was used for analysis. The nerve fascicle area and blood vessel diameters were measured using Image J software (http://imagej.nih.gov/ij/).
Statistics
Independent two-tailed t-tests were used to test the effect of group (control vs ITED) for the animal characteristics (Table 1). A mixed-model analysis of variance (ANOVA) assessed the effect of group and time on MAP, NBV (Table 2) and the index of VC during the study phases which included in sequence baseline 1, SNPearly, SNPlate, baseline 2, PEearly and PElate time periods (SigmaStat for Windows, version 8.0). The same analysis was completed on the ΔMAP and ΔNBV responses to SNP and PE infusions (Figures 1 and 2). For each animal, NBV versus MAP was plotted and the slope and y-intercept values were averaged for each group. Independent two-tailed t-tests were used to test the effect of group (control vs ITED) on the average slope and y-intercept values (Figure 3), as well as for MNCV (Table 1) and the number of sciatic nerve fascicle blood vessels (Table 3). Finally, an independent two-tailed t-test was used to test the effect of group (control vs ITED) on estimated NBV in the conscious rat (Figure 4). The significance level was set at p ≤ 0.05, and data are presented as mean ± standard deviation (SD).
Animal characteristics.
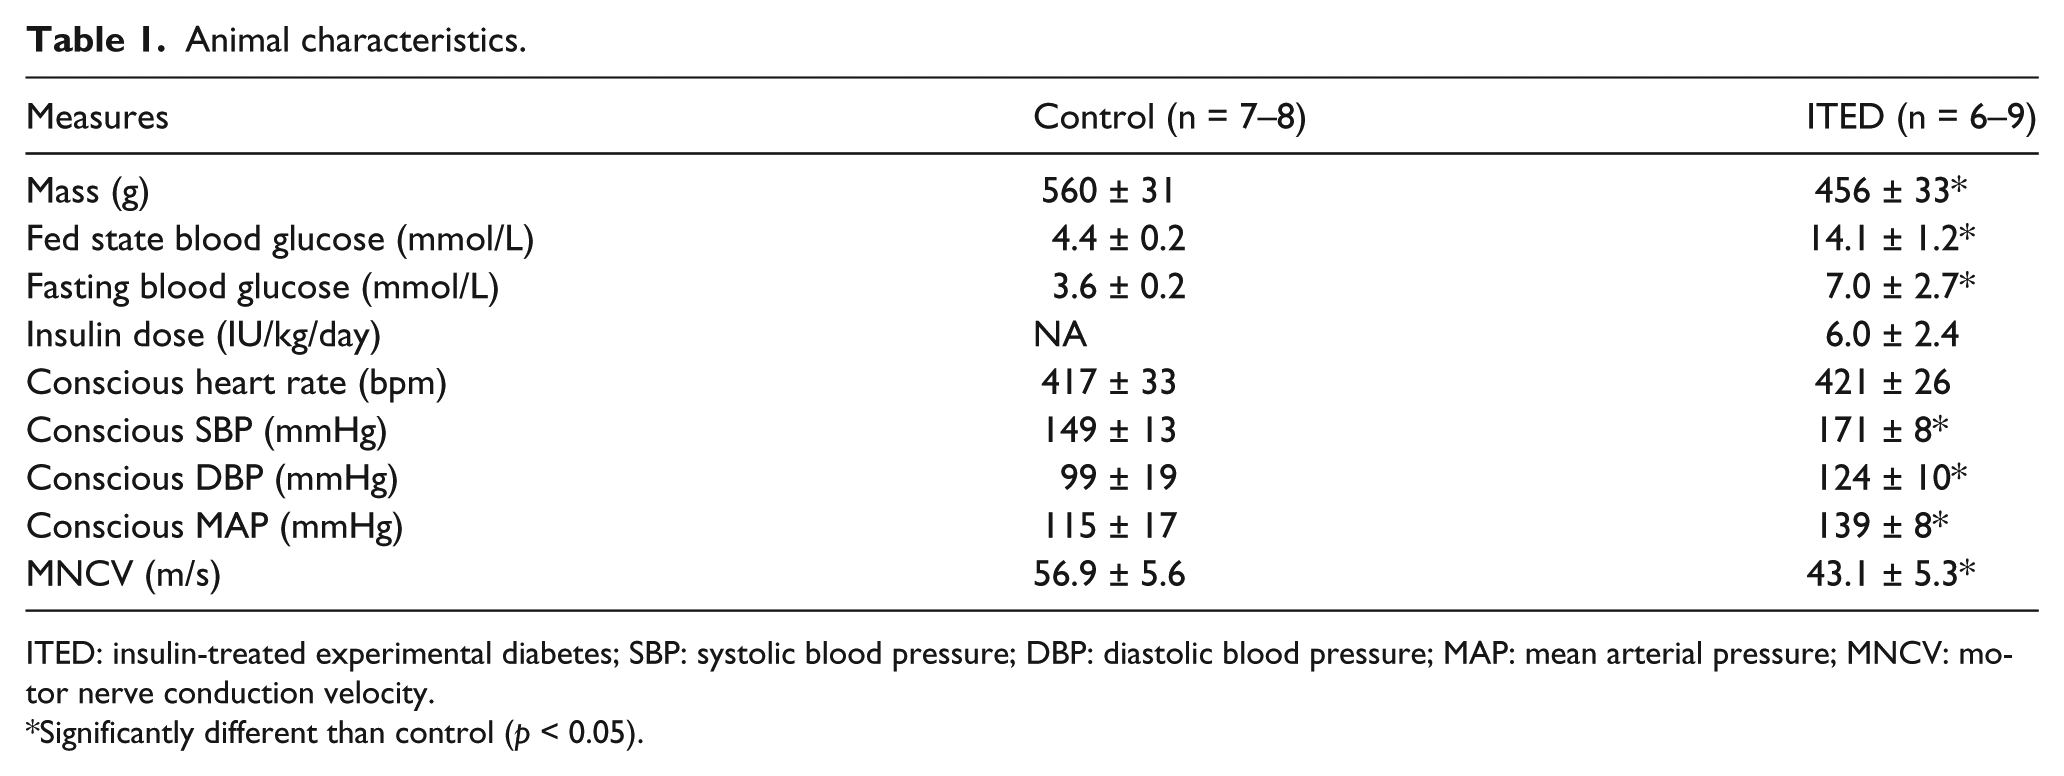
ITED: insulin-treated experimental diabetes; SBP: systolic blood pressure; DBP: diastolic blood pressure; MAP: mean arterial pressure; MNCV: motor nerve conduction velocity.
Significantly different than control (p < 0.05).
Raw data: MAP and NBV.
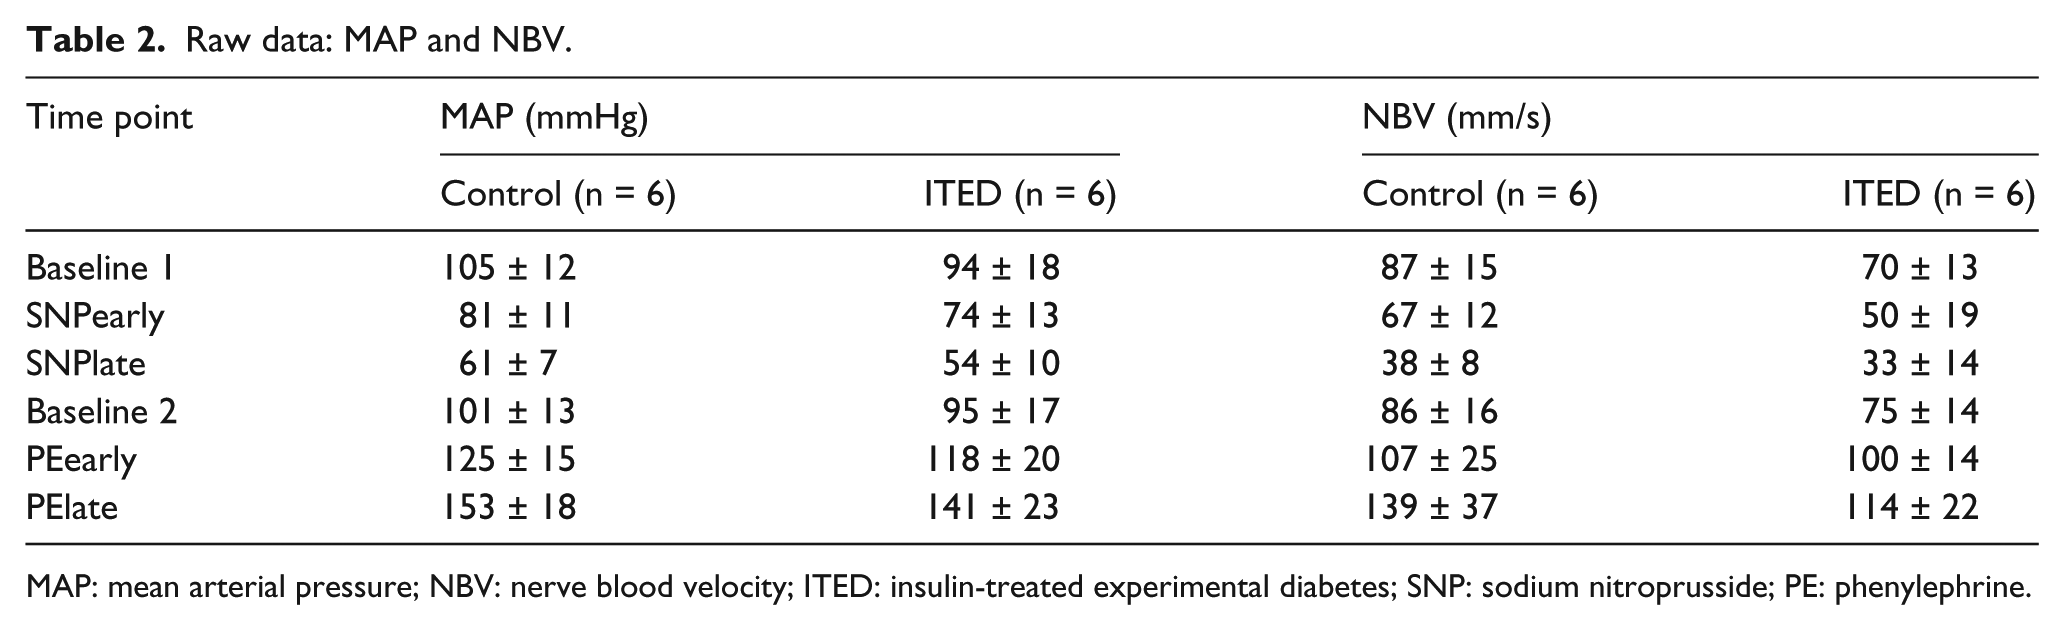
MAP: mean arterial pressure; NBV: nerve blood velocity; ITED: insulin-treated experimental diabetes; SNP: sodium nitroprusside; PE: phenylephrine.
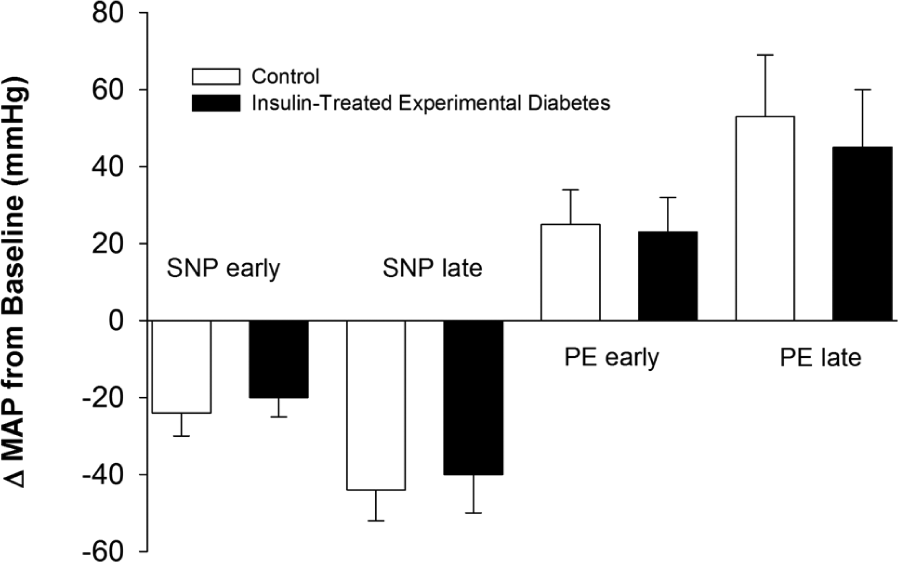
ΔMAP (mmHg) from baseline in the control (□) and insulin-treated experimental diabetes (■) group during SNP and PE infusion. Early and late responses reflect ~50% and 100% of the peak effect of the drug.
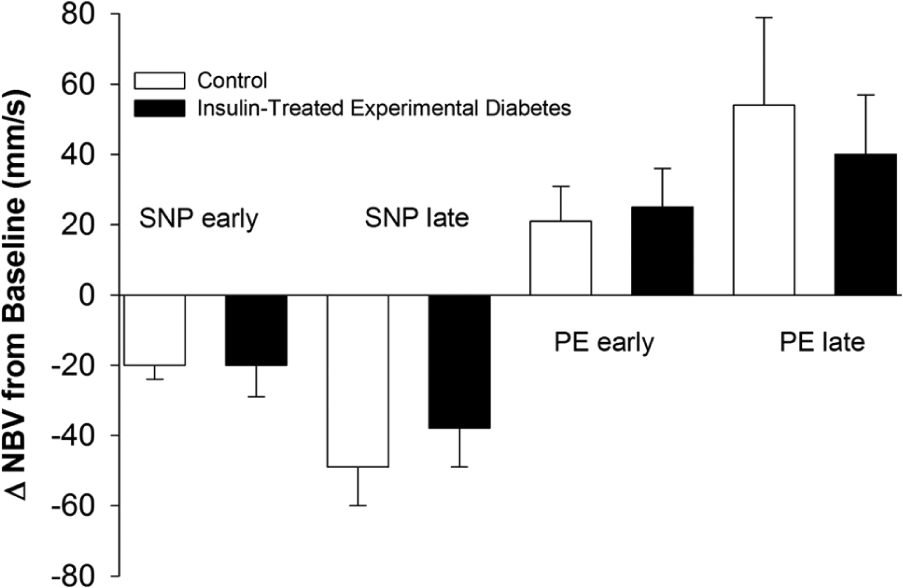
ΔNBV (mm/s) from baseline in the control (□) and insulin-treated experimental diabetes (■) group during SNP and PE infusion. Early and late responses reflect ~50% and 100% of the peak effect of the drug.
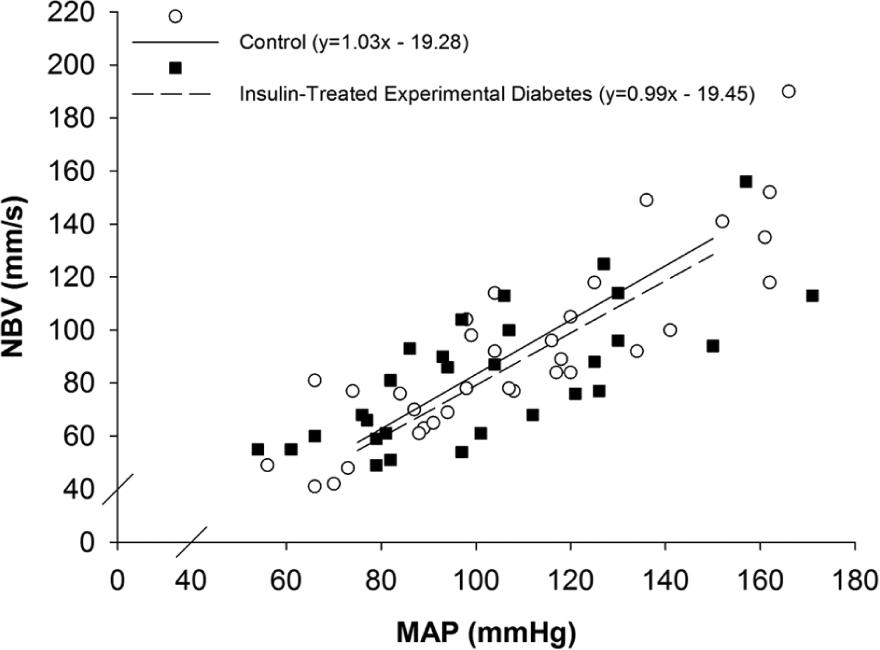
NBV (mm/s) at a given MAP (mmHg) in the control (◌, ―l) and insulin-treated experimental diabetes (■, …⁞) group.
Blood vessel count.
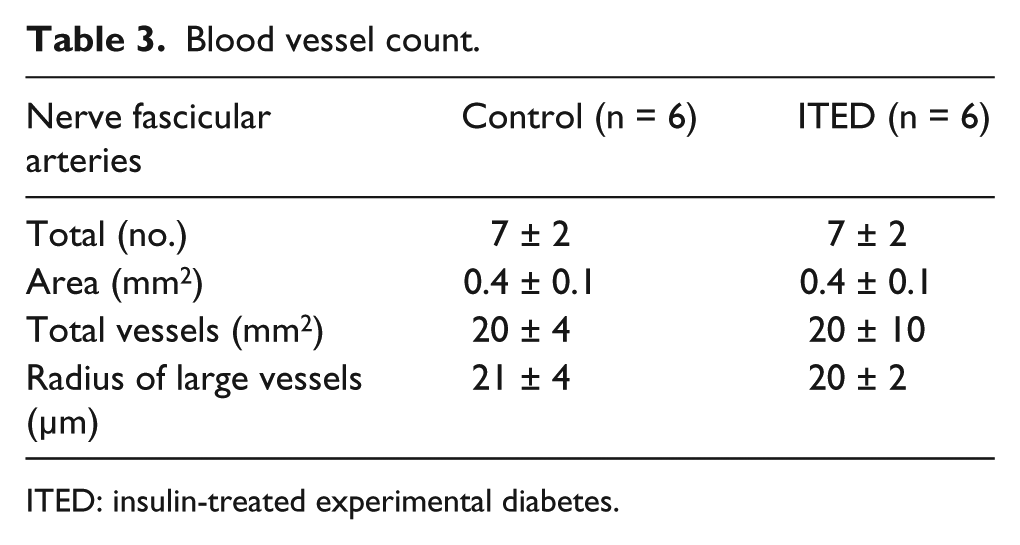
ITED: insulin-treated experimental diabetes.
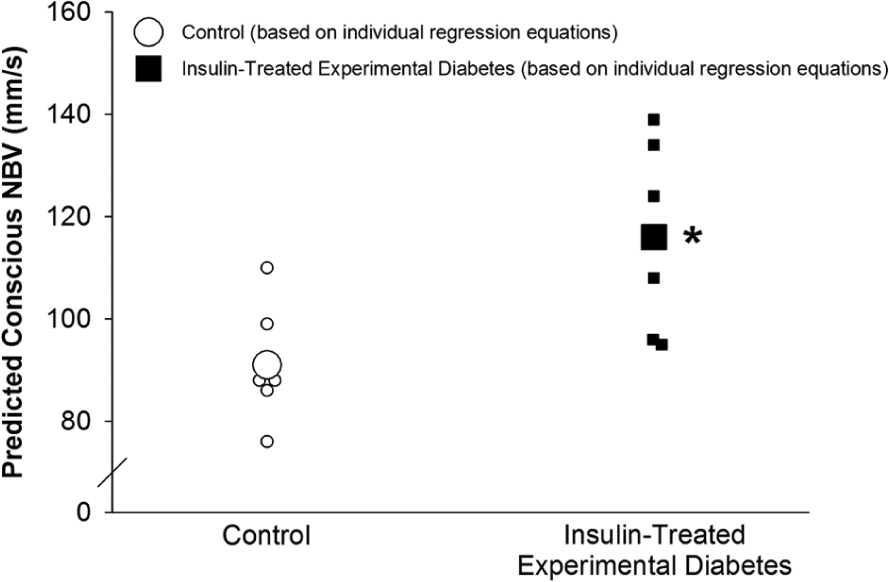
Estimated NBV (mm/s) based on the appropriate individual linear regression equations in the control (◌; larger circle denotes the mean) and insulin-treated experimental diabetes (■; larger box denotes the mean) group.
Results
General characteristics
Relative to the control group, body mass was lower (Table 1; p < 0.01), and fasting and fed state blood glucose concentrations were greater (Table 1; p < 0.01) in rats with ITED. There were no differences in conscious heart rate between groups (Table 1; p = 0.85). Compared with control rats, conscious SBP, DBP and MAP were greater (Table 1; p < 0.01), while MNCV was lower (Table 1; p < 0.01) in the ITED group.
MAP and NBF-velocity
In the anaesthetized state, no group or interaction effects were observed for MAP or NBV (Table 2; p ≥ 0.16). A main effect of time was observed for MAP and NBV (Table 2; p < 0.01). Subsequent pairwise comparisons indicated that baseline 1 and 2 were similar (Table 2; p ≥ 0.60); relative to baseline 1, SNP reduced MAP and NBV (Table 2; p < 0.01), and relative to baseline 2, PE increased MAP and NBV (Table 2; p < 0.01).
No group or interaction effects were observed for the index of VC (p ≥ 0.47). A main effect of time was observed for the index of VC (p < 0.01), where all time points were significantly greater than SNPlate (p < 0.01; data not shown).
No group or interaction effects were observed for ΔMAP and ΔNBV (p ≥ 0.20). A main effect of time was observed for ΔMAP and ΔNBV (p < 0.01). Subsequent pairwise comparisons indicated that ΔMAP and ΔNBV measured during SNPlate were greater than SNPearly (p < 0.01) and those measured during PElate were greater than PEearly (p < 0.01; Figures 1 and 2).
Regression equation and estimated conscious NBF-velocity
The average slope of the regression between MAP and NBV (control = 1.03 ± 0.16 vs ITED = 0.99 ± 0.27; p = 0.77) and the corresponding y-intercept (control = −19.28 ± 9.15 vs ITED = −19.45 ± 19.83; p = 0.99) were similar between groups (Figure 3). Estimated NBV for a conscious rat was significantly (p = 0.02) greater in the ITED group (Figure 4).
Blood vessel counting
The total number of vessels as well as the total area and number of vessels per square millimetre were similar (p ≥ 0.73; Table 3) between groups (Figure 5). There appeared to be two sizes of blood vessels with one or three layers of smooth muscle. The proportion of smaller (~70%) and larger (~30%) blood vessels was similar (p ≥ 0.68) between groups. The estimated radius of the larger blood vessels was similar between groups (p = 0.50).
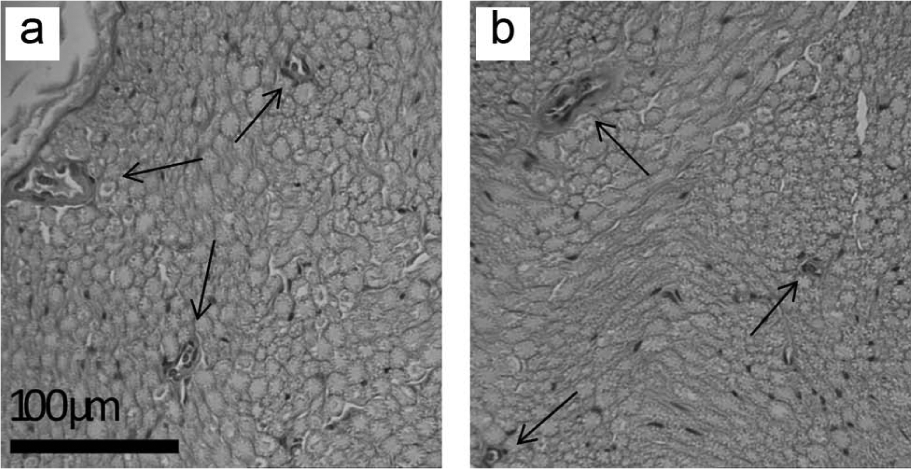
Representative cross-sectional images of the sciatic nerve in the (a) control and (b) insulin-treated experimental diabetes group. Sections were stained with haematoxylin and eosin.
Discussion
This study employed a rodent model of ITED that resulted in similar blood glucose values as humans with poorly controlled type 1 diabetes. The novel finding of this study was that sciatic nerve vascularization and NBF-velocity responses to changes in MAP remained unchanged in rats with ITED. Therefore, NBF-velocity would have been similar or possibly elevated in rats with ITED because conscious blood pressure was elevated. In spite of these findings, MNCV was lower in the rats with ITED. In contrast to the stated hypothesis, NBV was not reduced across a range of MAP. These data suggest that decrements in basal NBF do not precede nerve dysfunction in rats with ITED.
Moderately hyperglycaemic ITED model
Unlike previous studies,2–6 experimental diabetes did not reduce NBF in this study, confirming earlier observations.8,9,11,12 Notably, in this study, rats were chronically exposed to insulin. Insulin exposure dilates healthy nerve arterioles,32,33 and insulin treatment attenuates decrements in NBF following diabetes induction.4,22 Also, unlike previous studies that document no change2,3,12 or reduced8,34 MAP in rats with chronic severe hyperglycaemia, the rats with ITED in this study had similar anaesthetized and higher conscious blood pressures. The levels of hyperglycaemia and insulinaemia appear to be important modulators of the blood pressure response to STZ, as insulin treatment has been documented to augment blood pressure in rats with experimental diabetes.35,36 In this study, insulin treatment prevented severe hyperglycaemia and likely altered the severity and pathophysiology of disease.
Perspectives
This study was the first to our knowledge to examine NBF-velocity across a range of MAP in rats with ITED. There was no evidence of frank microangiopathy, and because the relationship between MAP and NBF-velocity was the same between groups, NBF-velocity was similar and potentially elevated in conscious rats with ITED. Furthermore, because MNCV was lower in rats with ITED, these data support previous observations that diabetes-related nerve dysfunction can occur independent of reductions in NBF.8–12 These data imply that in the absence of microangiopathy, basal NBF may be elevated in humans with combined poorly controlled type 1 diabetes and hypertension who are at risk of DPN.
Poor glycaemic control increases blood pressure in rats with ITED, 36 and given the lack of autoregulatory control in the vasa nervorum, the ultimate impact of diabetes on NBF would be determined by the balance of microvascular damage, should it occur, and perfusion pressure. While this study did not address neuronal glucotoxicity or ischaemia-induced DPN, it does raise the possibility that heightened blood pressure and NBF may exacerbate metabolic complications associated with DPN.11,12,37 Specifically, in rats with diabetes, increased NBF is associated with elevated neuronal fructose and sorbitol concentrations and results in deficits in MNCV. 9 In humans with insulin-treated diabetes, nerve sorbitol content is inversely related to the number of myelinated fibres. 38 Therefore, increased NBF and glucose metabolism in the nerve may contribute to nerve fibre degeneration and compromise nerve function.
The current data contrast with those from Gregory et al., 6 who observed low NBF values in the presence of normal and high blood pressure, in rats with diabetes. However, they did not examine NBF across a range of MAP in the same rodents. Also, their rodent model of diabetes did not include insulin treatment, and their rats had approximately twofold higher blood glucose concentrations and expressed sciatic nerve microangiopathy. The presence of microangiopathy in the sciatic nerve may alter the relationship between MAP and NBF and help explain the divergent findings between studies. 6
Doppler ultrasound
This study employed high-frequency Doppler ultrasound to assess NBF-velocity. Recent developments in high-frequency ultrasound technology have enabled the measurement of blood flow velocity lower than 5 mm/s, in superficial arteries as small as 20 µm.39,40 In previous tests using tissue-mimicking phantoms, arteries as small as 140 µm could be resolved accurately using B-mode images acquired with a 40 MHz transducer. 41 However, in this study, the nerve artery was too small to measure its diameter using B-mode images with 40 MHz ultrasound technology. Thus, epi- or endoneurial flow could only be assessed indirectly using NBF-velocity and indices of VC. In humans with poorly controlled diabetes, epineurial blood vessels may be tortuous and subject to arteriovenous shunting,27,42 resulting in a redistribution of NBF towards the epineurial vasculature. Although endoneurial flow relies on epineurial flow, 43 Doppler ultrasound may not capture all reductions in endoneurial flow. However, the sciatic nerve vasculature contains feed arteries arising from multiple locations, does not express a typical capillary plexus and has been described an anastomotic vascular network.43–46 This pattern of tissue perfusion limits the interpretation of gross flow measurements and underlines a benefit of quantifying exclusive arterial inflow responses.
In the current experiment, failure to detect changes in arterial diameter may result in underestimated NBF during SNP infusion and overestimated NBF during PE infusion. This may occur as topical application of SNP causes vasa nervorum dilation 47 and local delivery of PE causes vasa nervorum constriction. 48 However, in this study, drugs were infused systemically and MAP, rather than SNP or PE, appeared to modulate NBF. Furthermore, because the index of VC was similar at all time points (except SNPlate), any potential effects of SNP or PE on the vasa nervorum were minimal. In the case of SNPlate, it is unlikely that SNP constricted the vasa nervorum. A more plausible explanation would be that the reduction in the index of VC during SNPlate may have been caused by a sympathetic reflex pressor response to defend against the ~40 mmHg drop in MAP.
The current data are the first of our knowledge to use Doppler ultrasound to assess sciatic NBF/autoregulation in a rodent model of diabetes, rendering it difficult to form direct comparisons. In accordance with previous works,14–19 using a variety of techniques, we did confirm the absence of autoregulation, suggesting that the results obtained using Doppler ultrasound are comparable with other methods. It is important to note that conflicting results among techniques have been documented with laser Doppler flowmetry,4,10 hydrogen clearance2,8 as well as other methods,9,11,12,37 regarding the impact of diabetes on NBF control. Nevertheless, the current data support previous observations that diabetes is associated with either no change8,10 or potentially increased9,11,12 NBF.
Limitations
Sciatic NBF may be influenced by temperature. The relationship between limb temperature and NBF may be positive 49 or negative 50 and may have less of an effect on rats with diabetes. 43 In this study, although rat body temperature was maintained at 37°C, rat sciatic nerve temperature was not monitored. However, room and rat core temperature were constant, and NBV at baseline 1 and 2 was similar across conditions in each experiment, suggesting little impact of non-intervention factors, such as changes in nerve temperature.
In this study, blood pressure in the conscious state was elevated and by extension so was estimated NBF-velocity in rats with ITED. However, experimental diabetes often lowers blood pressure,8,34 and the current blood pressure values collected using the tail-cuff method were not validated using an arterial catheter in the same conscious rodents. This issue has been discussed with speculation that severe hyperglycaemia may cause emaciation of the tail and result in artefactually high tail-cuff blood pressure recordings.51,52 However, using direct methods, it has been established that the insulin treatment augments blood pressure in rats with experimental diabetes.35,36 More importantly, in this study, the rats were not severely hyperglycaemic and their tails were not emaciated. Also, such issues do not alter the overall conclusion that the relationship between MAP and NBV remains intact in rats with ITED and reductions in NBF do not always precede diabetes-induced nerve dysfunction.8–12
Conclusion
The novel findings of this study demonstrated that the absence of autoregulation persisted in a rat model of ITED where moderate hyperglycaemia (blood glucose values similar to those observed in humans with poorly controlled type 1 diabetes) 20 and elevated blood pressure co-existed. Therefore, elevated blood pressure in conscious rats with ITED may result in increased NBF values. Nonetheless, rats with ITED exhibited lower MNCV values. Therefore, reduced NBF cannot be the sole determinant of DPN. Potentially, elevated NBF may increase glucose delivery to the nerve, exacerbating neuronal glucotoxicity and impairing nerve function. However, to date, the relationship between NBF and glucose uptake in the nerve remains to be elucidated fully. Overall, this study supports the link between poorly controlled insulin-treated type 1 diabetes, hypertension and nerve dysfunction. However, these data highlight that reduced NBF does not necessarily precede decrements in MNCV. Therefore, in people with insulin-treated type 1 diabetes, maintaining normal blood pressure may be important not only for cardiovascular health but for peripheral nerve health as well.
Footnotes
Acknowledgements
T Dylan Olver contributed to study design, data collection, data analyses and writing; Kenneth N Grisé, Matthew W McDonald, Adwitia Dey and Matti D Allen contributed to study design, data collection and editing; Charles L Rice contributed to study design and editing; James C Lacefield contributed to data collection and editing; CW James Melling contributed to study design and editing; Earl G Noble contributed to study design and editing and J Kevin Shoemaker contributed to study design, data analysis and writing. Dr Shoemaker is a Canada Research Chair in Integrative Physiology of Exercise and Health.
Declaration of conflicting interests
None.
Funding
This study was funded by the Canadian Institutes of Health Research (CIHR) Team Grant in Physical Activity, Mobility and Neural Health (no. 217532) (J Kevin Shoemaker, Nominated Principal Investigator).