
Abstract
Objectives:
Assess the effect of risk factors changes on risk for cardiovascular disease and mortality in patients with type 2 diabetes selected from the Swedish National Diabetes Register.
Methods:
Observational study of 13,477 females and males aged 30–75 years, with baseline HbA1c 41–67 mmol/mol, systolic blood pressure 122–154 mmHg and ratio non-HDL:HDL 1.7–4.1, followed for mean 6.5 years until 2012. Four groups were created: a reference group (n = 6757) with increasing final versus baseline HbA1c, systolic blood pressure and non-HDL:HDL cholesterol during the study period, and three groups with decreasing HbA1c (n = 1925), HbA1c and systolic blood pressure (n = 2050) or HbA1c and systolic blood pressure and non-HDL:HDL (n = 2745).
Results:
Relative risk reduction for fatal/nonfatal cardiovascular disease was 35% with decrease in HbA1c only (mean 6 to final 49 mmol/mol), 56% with decrease in HbA1c and systolic blood pressure (mean 12 to final 128 mmHg) and 75% with combined decreases in HbA1c, systolic blood pressure and non-HDL:HDL (mean 0.8 to final 2.1), all p < 0.001 adjusting for clinical characteristics, other risk factors, treatments and previous cardiovascular disease. Similar risk reductions were found for fatal/nonfatal coronary heart disease, fatal cardiovascular disease, all-cause mortality and also in a subgroup of 3038 patients with albuminuria.
Conclusion:
Considerable risk reductions for cardiovascular disease and mortality were seen with combined long-term risk factor improvement.
Introduction
Multifactorial approaches for optimizing levels of metabolic risk factors are regarded as the best treatment of diabetes mellitus to achieve a decrease in its burden of cardiovascular diseases (CVDs) and mortality. Additive effects in treatment of HbA1c and blood pressure have been shown in several previous studies of patients with type 2 diabetes.1–8 A recent Swedish National Diabetes Register (NDR) study showed additive effects for the combination of hyperglycaemia and hyperlipidaemia on risk for CVD in type 2 diabetes [although less than additive for coronary heart disease (CHD)]. 4 The lipid variable was the stronger effect predictor, although HbA1c also was a strong risk factor. The Steno-2 study, analysing patients with type 2 diabetes and baseline presence of albuminuria, found that intensive intervention on life-style changes and use of multiple drug combinations demonstrated the proportionate importance of glycaemic control, blood pressure lowering and lipid management, and this intervention was associated with significantly lower risk of CVD events and mortality.6,7 However, no attempt was made to ascertain the independent contribution of each treated risk factor to the CVD risk reduction. One previous observational study from Kaiser Permanente in type 2 diabetes has analysed the concomitant long-term control of three cardiovascular risk factors, HbA1c, systolic blood pressure (SBP) and low-density lipoprotein (LDL) cholesterol, each of them alone or in various combinations, for the beneficial effects on risk for nonfatal CVD hospitalization, showing reduced CVD risk with several of the targets achieved compared to none achieved. 8
It was the aim of this study to analyse the effect of change in HbA1c, SBP and the ratio non-HDL-to HDL (non-HDL:HDL) on risks for CHD, CVD and mortality in an observational study on patients with type 2 diabetes recruited from the Swedish NDR. We also aimed to analyse a subgroup of patients with type 2 diabetes and albuminuria at baseline of the study, suggestive as a parallel to the Steno-2 study.
Subjects and methods
The Swedish NDR
The NDR was initiated in 1996 as a tool for local quality assurance and feedback in diabetes care. Annual reporting to the NDR is carried out by trained physicians and nurses via the Internet or via clinical record databases, with information collected during patient visits at hospitals’ outpatient clinics and primary health care centres nationwide. All included patients have agreed by informed consent to register before inclusion. The Regional Ethics Review Board at the University of Gothenburg approved this study. The structure and further details on NDR have been reported in detail elsewhere.9,10
Patients
The following inclusion criteria were applied for all patients included in the study: age 30–75 years, body mass index (BMI) ⩾18.5 kg/m2, plasma creatinine <150 µmol/L and data available for all analysed variables. Exclusion criteria were a history of heart failure [defined as International Classification of Diseases, 10th Revision (ICD-10 I48)] or a history of bariatic surgery. The definition of type 2 diabetes was treatment with diet only, oral hypoglycaemic agents only, or onset age of diabetes ⩾40 years and insulin only or combined with oral agents. Only 0.4% of patients had an onset age <30 years, and 2% had onset age <40 years. Among female and male patients with type 2 diabetes registered in the NDR at baseline in 2005–2007 and followed-up until December 2012, all patients included in this study had baseline HbA1c, SBP and non-HDL:HDL values within the limits of mean ±1 standard deviation (SD) for each variable among registered patients: 41 mmol/mol ⩾ HbA1c ⩽ 67 mmol/mol (5.9–8.3%); 122 mmHg ⩾ SBP ⩽ 154 mmHg; 1.7 ⩾ non-HDL:HDL ⩽ 4.1. Furthermore, in each of these patients, we estimated both the baseline value and the updated final value during the study period for each of the three variables HbA1c, SBP and non-HDL:HDL. In case of an event during follow-up, the final value was that of the year before this event occurred. Otherwise, the final value was that of the censor year. Last observation carried forward (LOCF) was applied in case of missing follow-up data. Based on the estimated values for change in these three variables, four groups of totally 13,477 patients were selected for the analyses in this study, and these groups were defined as follows: Group 1 (n = 6757): increase in all three variables, during follow-up of the study; Group 2 (n = 1925): decrease in HbA1c, but increase in SBP and non-HDL:HDL; Group 3 (n = 2050): decrease in HbA1c and SBP, but increase in non-HDL:HDL; and Group 4 (n = 2745): decrease in all three variables HbA1c, SBP and non-HDL:HDL.
Examinations at baseline
Clinical characteristics at baseline in 2005–2007 were as follows: age, gender, diabetes duration, weight, height, smoking, education score (levels 1–3), HbA1c, SBP, total cholesterol, high-density lipoprotein (HDL)-, and LDL cholesterol, triglycerides, albuminuria, plasma creatinine, type of hypoglycaemic treatment, use of antihypertensive drugs and lipid-lowering drugs. BMI (kg/m2) was calculated as weight/height.2 A smoker was defined as a patient smoking one or more cigarettes per day, smoking tobacco, or who had stopped smoking within the past 3 months. The Swedish standard for blood pressure recording, used in the NDR, is the mean value (mmHg) of two supine readings (Korotkoff 1–5) with a cuff of appropriate size, after at least 5 min of rest. HbA1c analyses were quality assured nationwide by regular calibration with the high-perfomance liquid chromatography (HPLC) Mono-S method, and then converted to mmol/mol [International Federation of Clinical Chemistry (IFCC)], 11 and also converted to the diabetes control and complications trial (DCCT) standard using the formula: HbA1c (DCCT) = 0.923 × HbA1c (Mono-S) + 1.345; R2 = 0.998. 12 Non-HDL cholesterol (mmol/L) was total cholesterol – HDL cholesterol, and the ratio non-HDL-to-HDL cholesterol (Non-HDL:HDL) was estimated. Albuminuria was defined as cumulative, urine albumin excretion >20 µg/min in two out of three consecutive tests (micro- or macroalbuminuria).
Follow-up, definition of endpoints
All patients were followed from the baseline examination until a first cardiovascular event or death or otherwise until censor date 31 December 2012. Mean follow-up was 5.7 years. The endpoints used in this study were nonfatal or fatal CHD, nonfatal or fatal CVD, fatal CVD and total mortality. Non-fatal CHD was defined as nonfatal myocardial infarction (ICD-10 code I21), unstable angina (ICD-10 code I20.0), percutaneous coronary intervention and/or coronary artery bypass grafting. Fatal CHD was defined as ICD-10 codes I20-I25. Stroke was defined as nonfatal or fatal cerebral infarction, intracerebral haemorrhage or unspecified stroke (ICD-10 codes I61, I63, I64, I67.9). A CVD event was defined as CHD or stroke whichever came first, and the same definition was used for a history of CVD before baseline. Atrial fibrillation diagnosed before or at baseline was defined as ICD-10 code I48. A history of heart failure was defined as ICD-10 code I50. All events were retrieved by data linkage with the Swedish Cause of Death and Hospital Discharge Registers, which is a reliable validated alternative to revised hospital discharge and death certificates.13–15
Statistical methods
Baseline characteristics in all groups, as well as baseline and final values for HbA1c, SBP and non-HDL:HDL, and also difference between final and baseline values, are given in Tables 1 and 2, with significance for trends across all groups estimated with general linear model (GLM) or logistic regression.
Baseline characteristics in 13,477 patients with type 2 diabetes, divided in four groups, followed for 7 years until 2012.
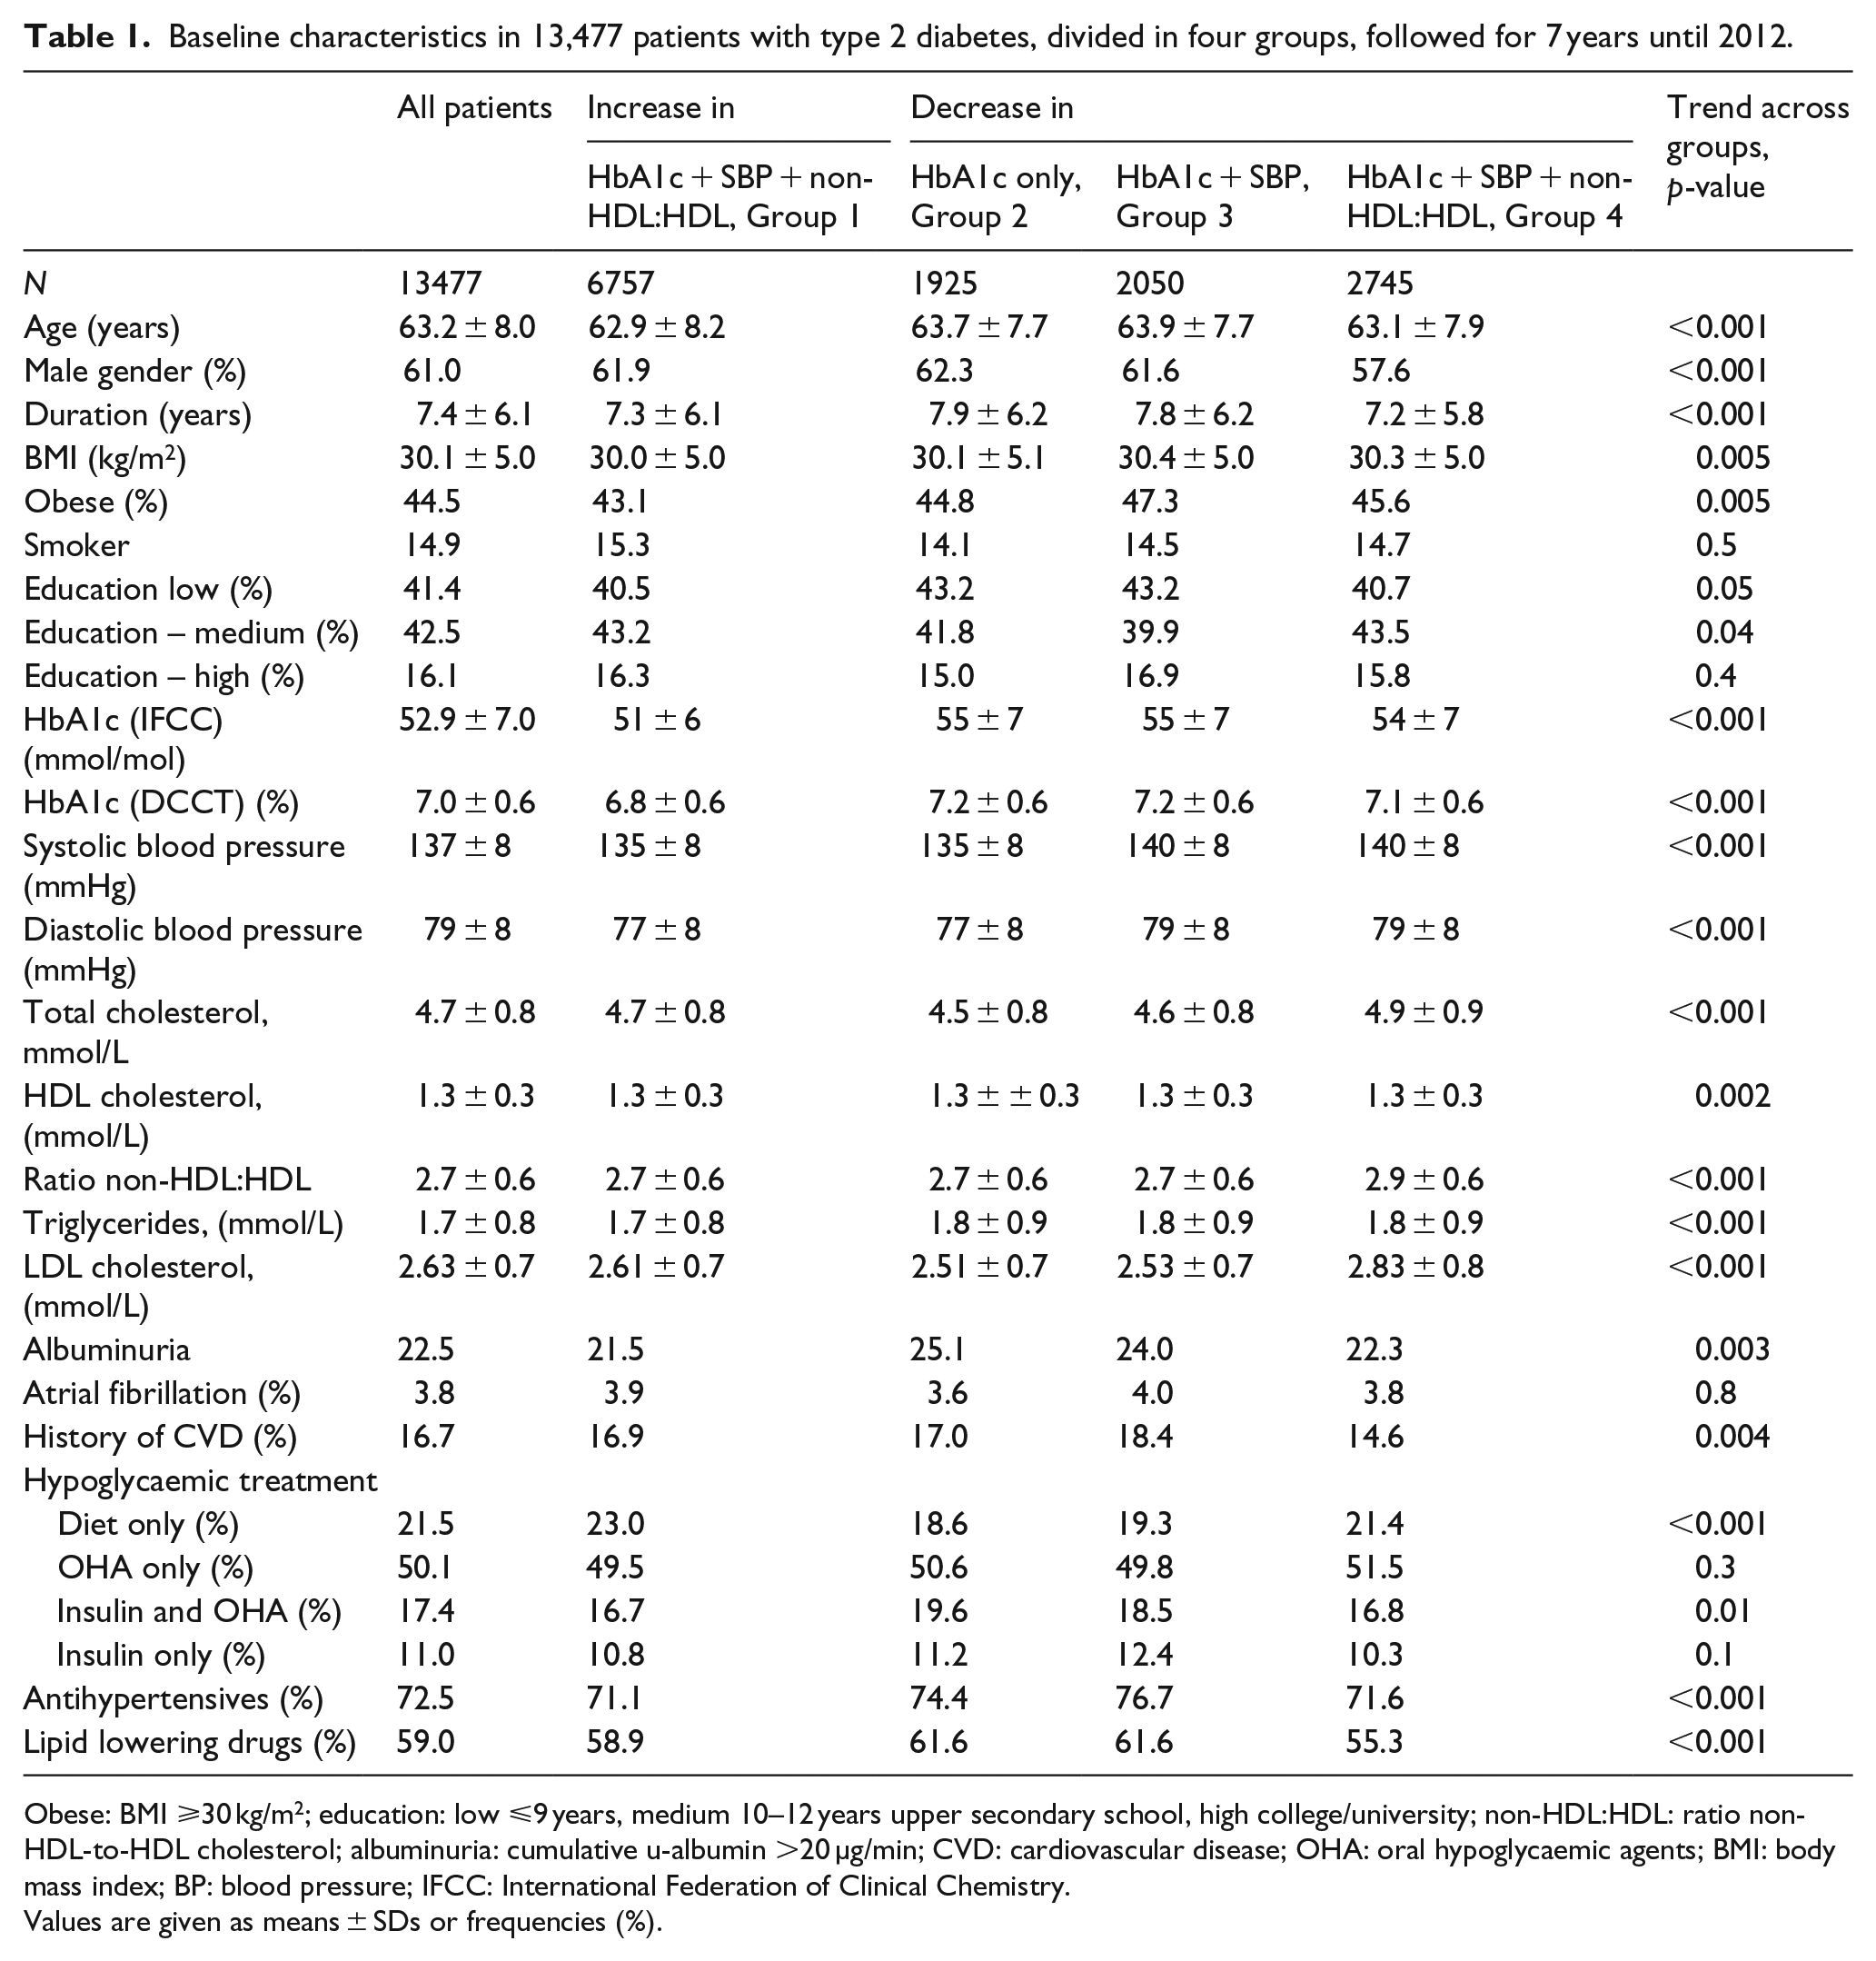
Obese: BMI ⩾30 kg/m2; education: low ⩽9 years, medium 10–12 years upper secondary school, high college/university; non-HDL:HDL: ratio non-HDL-to-HDL cholesterol; albuminuria: cumulative u-albumin >20 µg/min; CVD: cardiovascular disease; OHA: oral hypoglycaemic agents; BMI: body mass index; BP: blood pressure; IFCC: International Federation of Clinical Chemistry.
Values are given as means ± SDs or frequencies (%).
Baseline and final values, with differences, in HbA1c, systolic blood pressure the ratio non-HDL-to-HDL cholesterol and LDL cholesterol, in 13,477 patients with type 2 diabetes followed for 7 years until 2012.
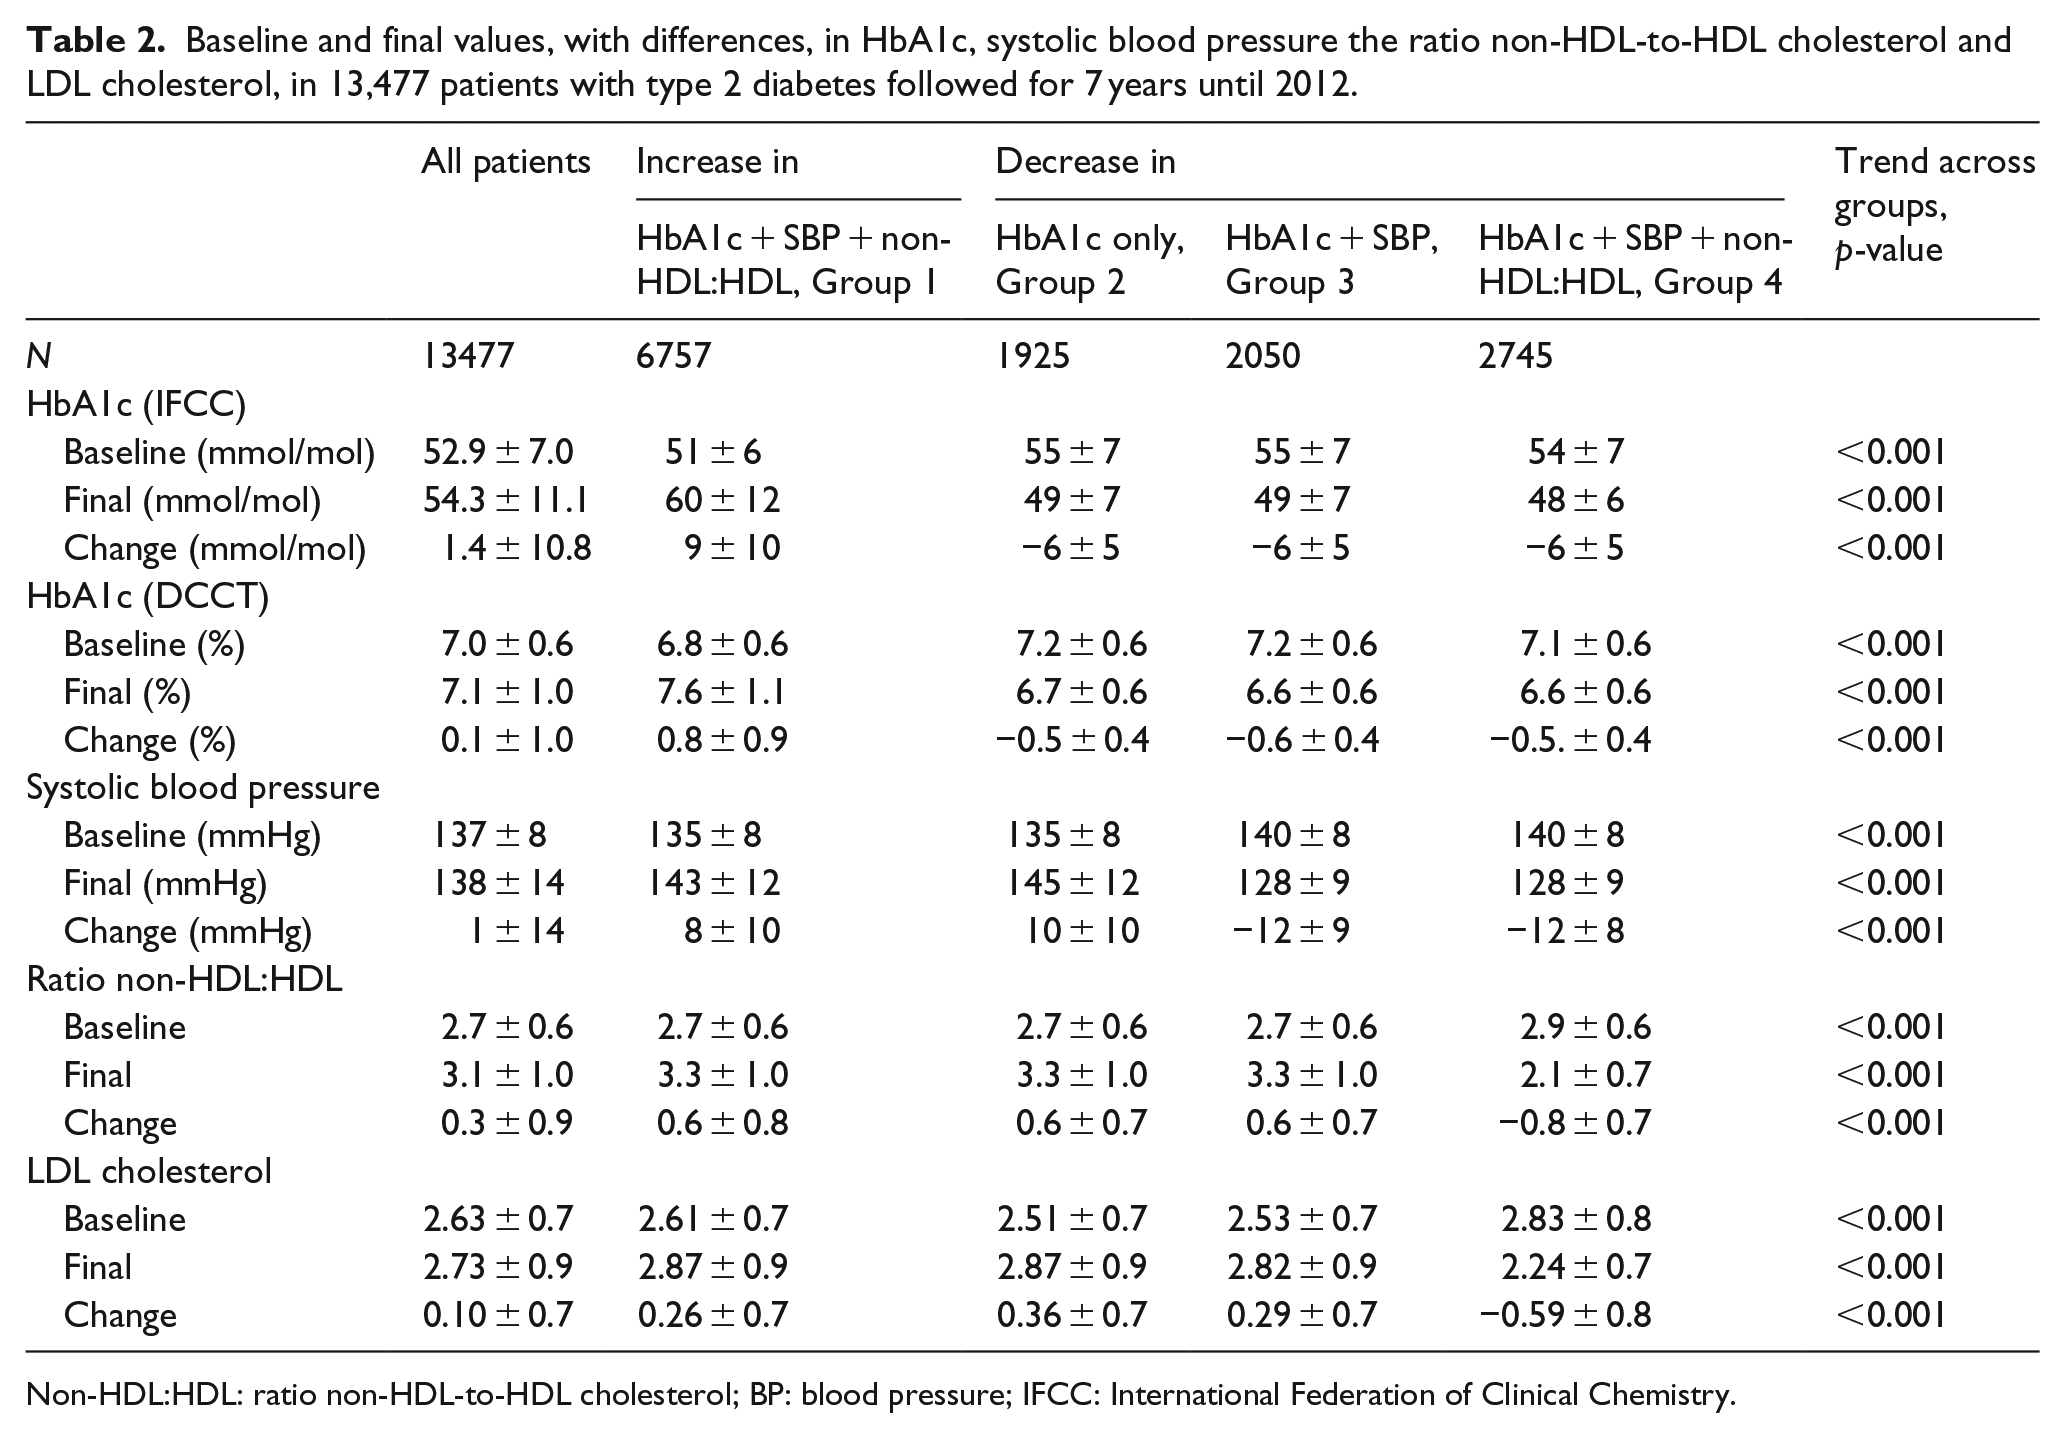
Non-HDL:HDL: ratio non-HDL-to-HDL cholesterol; BP: blood pressure; IFCC: International Federation of Clinical Chemistry.
Incidence rates per 1000 person-years of the outcomes in each of the four groups were estimated with Poisson’s regression, in all patients and in a subgroup of patients with albuminuria at baseline (Figure 1). Adjustments were made for age, gender, diabetes duration, education, baseline HbA1c, SBP, Non-HDL:HDL, BMI, smoker, albuminuria, triglycerides, type of hypoglycaemic treatment, antihypertensive drugs, lipid-lowering drugs, and also atrial fibrillation and a history of CVD.
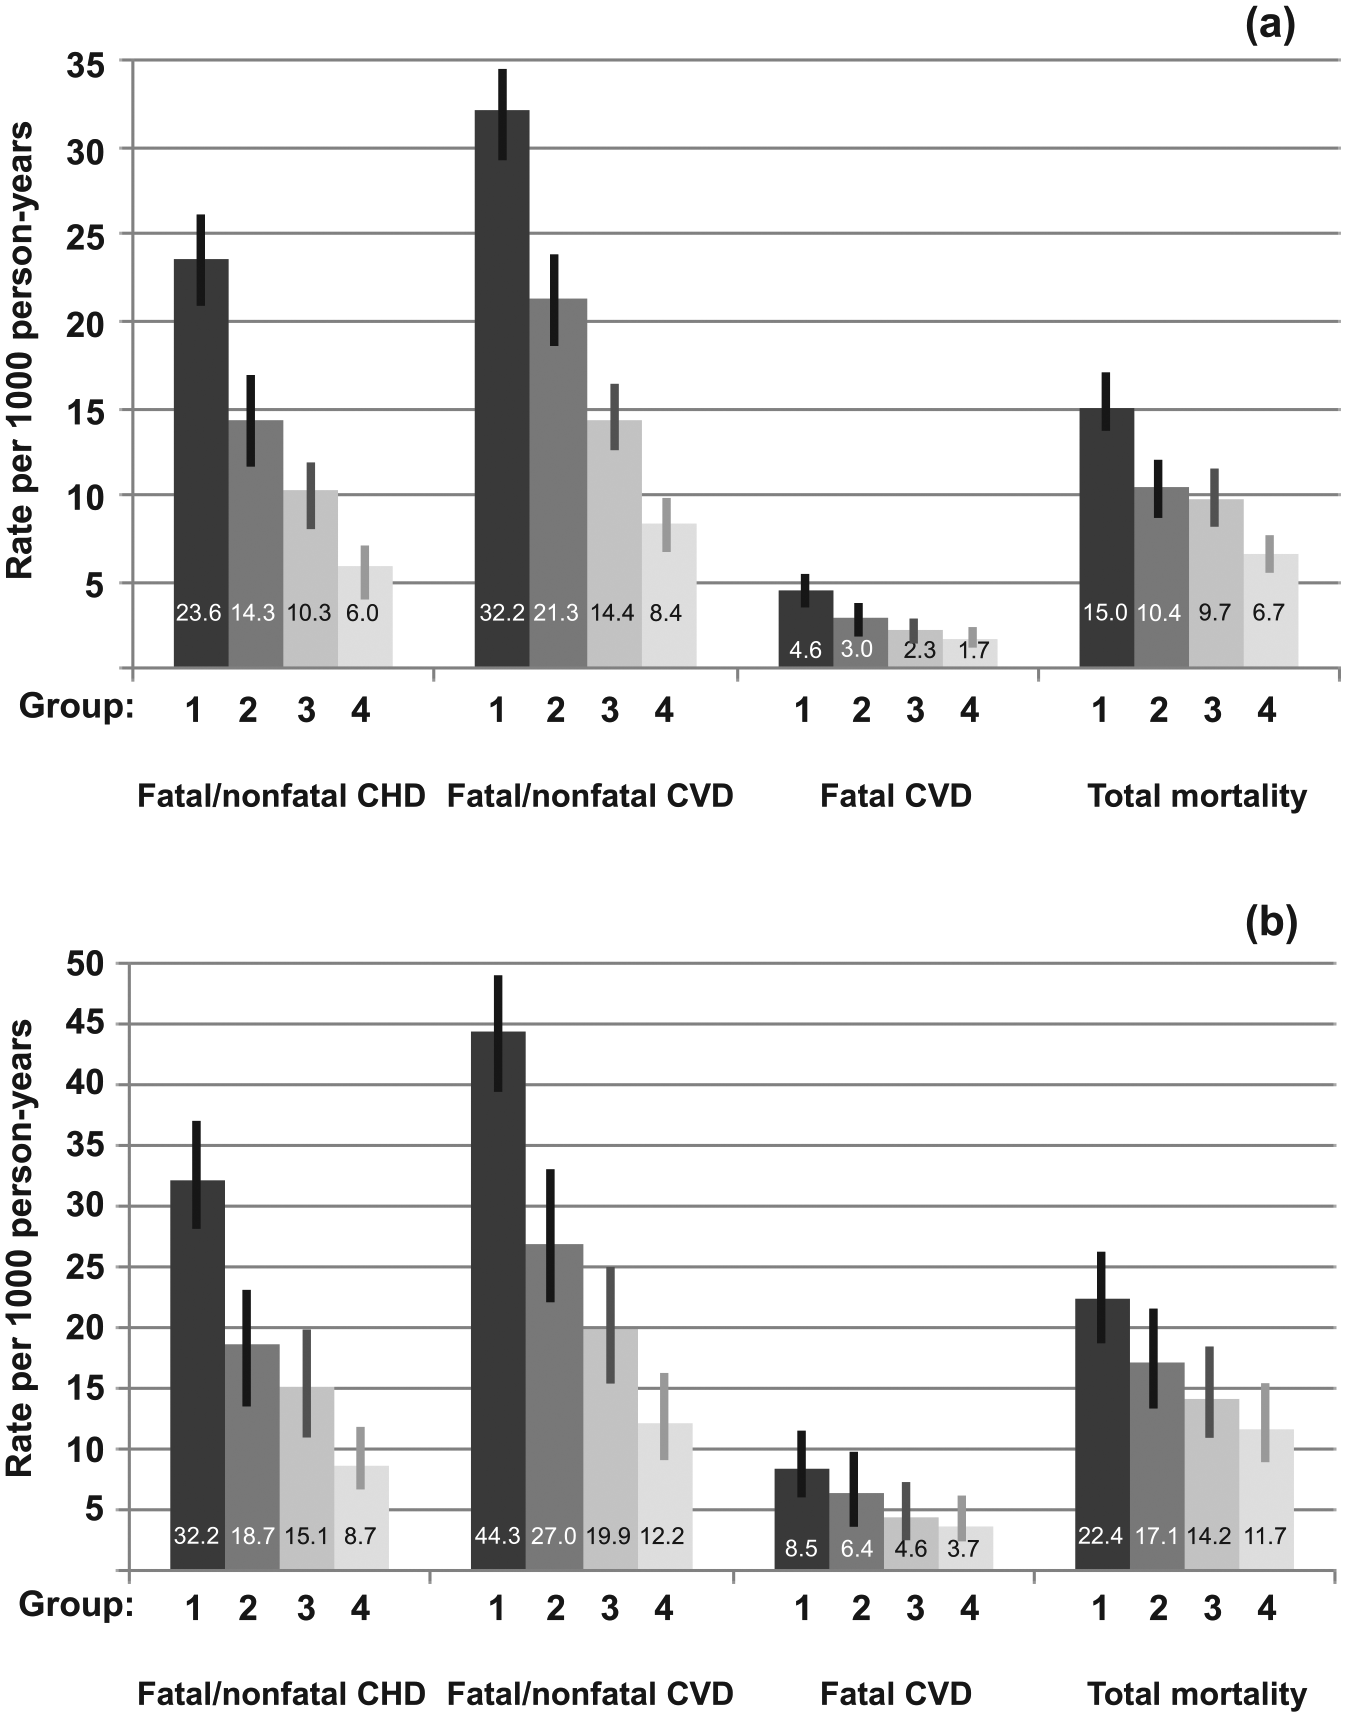
Incidence rates per 1000 person-years for cardiovascular diseases and total mortality during 7 years of follow-up, adjusted as in Table 3. The error bars represent 95% confidence intervals for the incidence rates: (a) all patients and (b) subgroup of patients with albuminuria at baseline. Group 1: all risk factors increasing; Group 2: HbA1c only decreasing; Group 3: HbA1c and systolic BP decreasing; and Group 4: HbA1c, systolic BP and ratio non-HDL:HDL decreasing.
Parametric Weibull regression analysis was performed to create hazard ratios (HRs) with 95% confidence intervals (CIs), with the same adjustment as at the Poisson’s regression in Figure 1, based on the estimates and the scale parameter for fatal/nonfatal CHD, fatal/nonfatal CVD, fatal CVD and total mortality as outcomes, with Groups 2, 3 and 4 compared to Group 1 as reference, in all patients and in the subgroup of patients with albuminuria (Table 3).
Hazard ratios for outcomes by combinations of increase or decrease in risk factors followed for 7 years at Weibull regression, in all 13,477 patients and in a subgroup of 3038 patients with albuminuria at baseline.
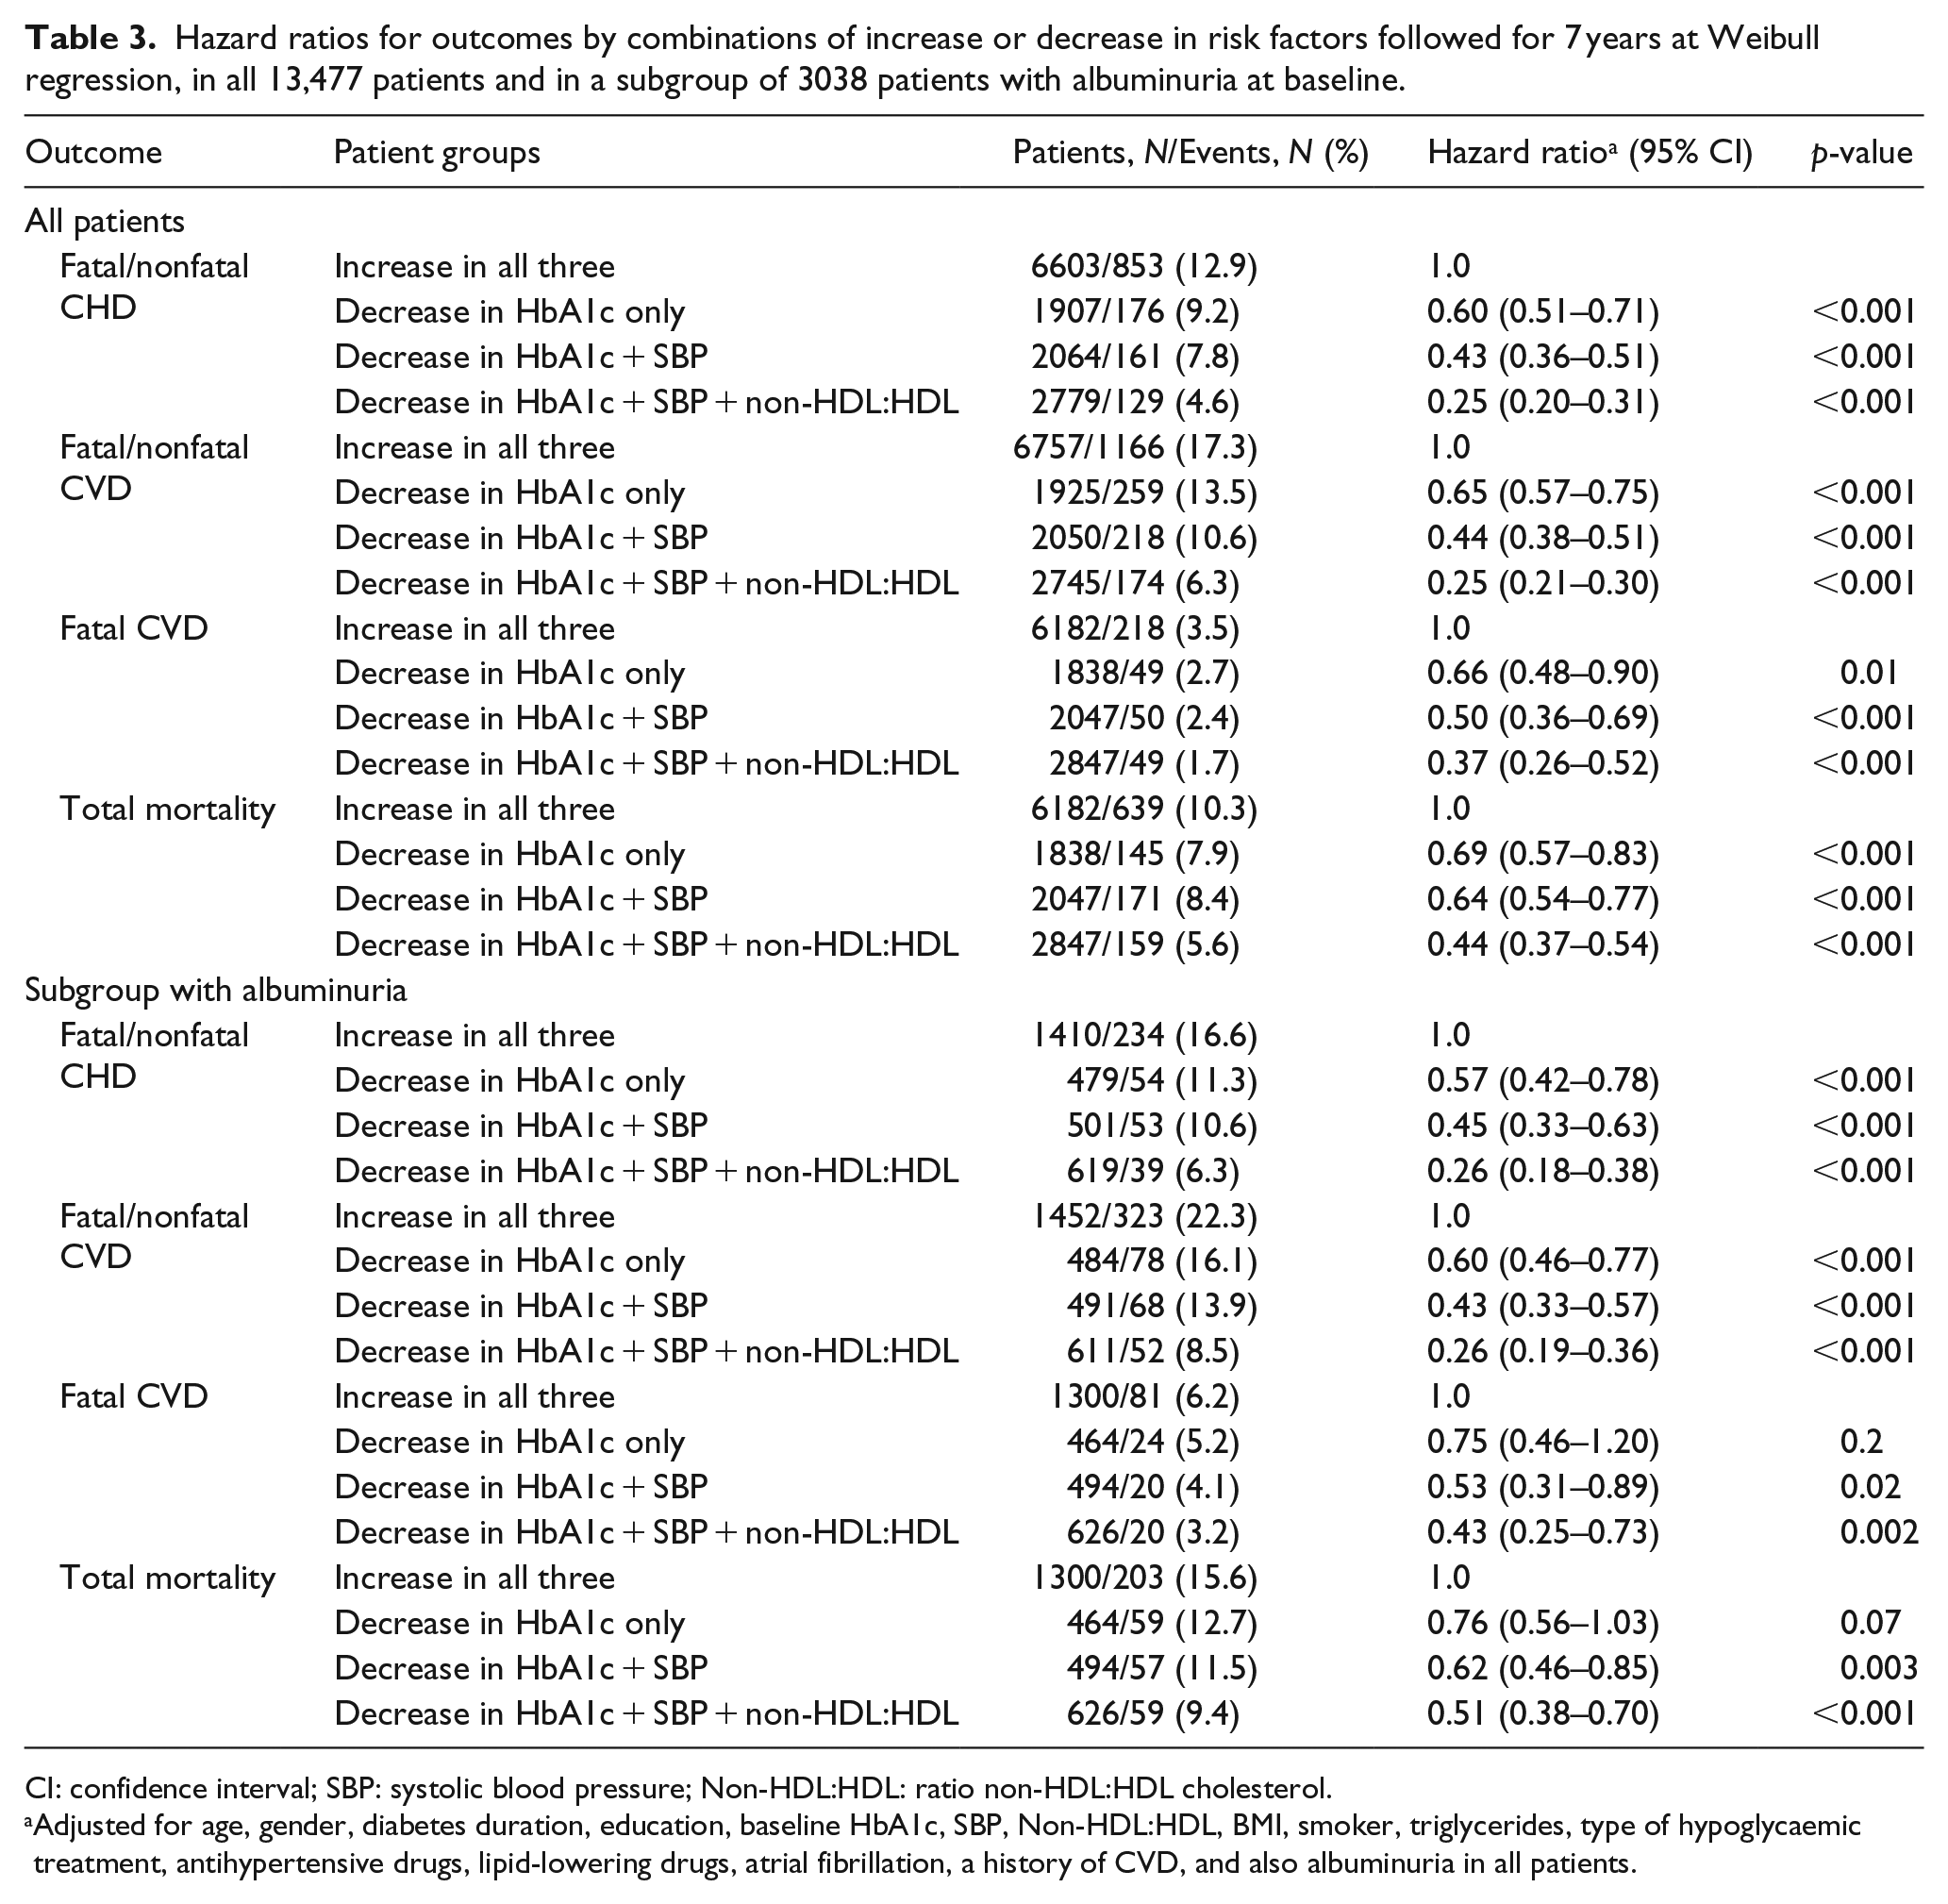
CI: confidence interval; SBP: systolic blood pressure; Non-HDL:HDL: ratio non-HDL:HDL cholesterol.
Adjusted for age, gender, diabetes duration, education, baseline HbA1c, SBP, Non-HDL:HDL, BMI, smoker, triglycerides, type of hypoglycaemic treatment, antihypertensive drugs, lipid-lowering drugs, atrial fibrillation, a history of CVD, and also albuminuria in all patients.
The Weibull distribution assumption was checked and found to be adequate and reliable, with use of log-log survival plots at Kaplan–Meier analysis, and also with use of graph showing events related to the probability plot with the Probplot command at Weibull regression. Interactions between the four groups were analysed with maximum likelihood estimation, with no significant interaction found.
Sensitivity analyses, in all patients and in the subgroup with albuminuria, were performed with use of propensity scores assessed for all four groups.16,17 The three scores representing Groups 2, 3 and 4 were estimated at multivariate logistic regression, including all covariates used in Figure 1 and Table 3 as independent predictors of the groups, and using Group 1 as reference. Means and frequencies of the baseline covariates, after adjustment with the propensity scores, are compared across all four groups with significance levels estimated with use of PROC GENMOD for continuous (id link) and categorical (logit link) data, as shown in Supplementary Table 1. All three scores were applied as continuous covariates at the Weibull regressions to estimate adjusted HRs for the outcomes, as shown in Supplementary Figure 1.
All statistical analyses were performed with SAS version 9.3 (SAS Institute, USA). A two-sided p-value < 0.05 was considered statistically significant.
Results
Table 1 gives baseline characteristics in all 13,477 participants and separated in the four groups based on change in the three risk factors. In all participants, mean age and diabetes duration were 63 ± 8 years and 7 ± 6 years, respectively, and 61% were men. Mean baseline HbA1c was 53 ± 7 mmol/mol (7.0 ± 0.6%) in all, mean baseline SBP 137 ± 8 mmHg and mean baseline ratio non-HDL-to-HDL 2.7 ± 0.6 units. Patients with a history of CVD were 16.7% of all, and those with atrial fibrillation 3.8% of all.
In all 13,477 patients, based on 71,703 person-years during mean 6.5 years of follow-up, there were 1319 cases of fatal/nonfatal CHD, 1817 fatal/nonfatal CVD, 366 fatal CVD and 1114 total mortality, and the total incidence rate of CVD was 2.1% per year.
Change in risk factors
Group 1 with all three risk factor values increasing had an increase in mean HbA1c from 51 to 60 mmol/mol with increase 9 mmol/mol (6.8% to 7.6%, increase 0.8%), mean SBP increased from 135 to 143 mmHg (increase 8 mmHg) and mean non-HDL:HDL increased from 2.7 to 3.3 (increase 0.6) units (see Table 2).
Group 2 with decrease in HbA1c only showed a decrease in HbA1c from mean 55 to 49 mmol/mol with decrease −6 mmol/mol (7.2% to 6.7%, decrease −0.5%), while mean SBP and non-HDL:HDL increased similarly as in Group 1. Group 3 with decrease in both HbA1c and SBP showed a decrease in mean HbA1c from mean 55 to 49 mmol/mol with decrease −6 mmol/mol (7.2% to 6.7%, decrease −0.5%) and a decrease in mean SBP from 140 to 128 mmHg (decrease −12 mmHg), while non-HDL:HDL increased similarly as in Group 1. Finally, Group 4 with decrease in both HbA1c, SBP and non-HDL:HDL had a decrease in mean HbA1c from 54 to 48 mmol/mol with decrease −6 mmol/mol (7.1% to 6.6%, decrease −0.5%), a decrease in SBP from 140 to 128 mmHg (mean −12 mmHg) and a mean decrease in non-HDL:HDL from 2.9 to 2.1 (−0.8) units.
Incidence rates at Poisson’s regression
Figure 1(a) displays incidence rates per 1000 person-years for outcomes with each of the four groups, adjusted for age, gender, diabetes duration, education, baseline HbA1c, SBP, Non-HDL:HDL, BMI, smoker, albuminuria, triglycerides, type of hypoglycaemic treatment, antihypertensive drugs, lipid-lowering drugs, atrial fibrillation and a history of CVD. Group 1 had the highest incidence rates for fatal/nonfatal CHD, CVD, fatal CVD and total mortality. The adjusted incidence rates decreased progressively with Groups 2, 3 and 4: from 24 to 6 cases per 1000 person-years for fatal/nonfatal CHD and from 32 to 8 cases per 1000 person-years for fatal/nonfatal CVD, respectively.
HRs at Weibull regression
Table 3 shows HRs for the endpoints in all 13,477 patients, using Group 1 as reference, and compared to each of the three other groups of decreasing risk factor values, after adjustment for the same covariates as in Figure 1. Adjusted HR for fatal/nonfatal CHD was 0.60 with Group 2, 0.43 with Group 3 and 0.25 with Group 4, all ps < 0.001. Corresponding HR for fatal/nonfatal CVD were 0.65 with Group 2, 0.44 with Group 3 and 0.25 with Group 4, all ps < 0.001.
The adjusted HR for fatal CVD were 0.66 (p = 0.01) with Group 2, 0.50 (p < 0.001) with Group 3 and 0.37 (p < 0.001) with Group 4, while corresponding HR for total mortality were 0.69, 0.64 and 0.44, all ps < 0.001.
Subgroup with albuminuria
Data on the subgroup of 3038 patients with cumulative albuminuria at baseline are shown in Figure 1(b), displaying the adjusted incidence rates per 1000 person-years for the outcomes with each of the four groups, showing rates from Group 1 to Group 4 of 32.2, 18.7, 15.1 and 8.7 for fatal/nonfatal CHD, respectively, and rates of 44.3, 27.0, 19.9 and 12.2 for fatal/nonfatal CVD, respectively.
Table 3 shows adjusted HR for fatal/nonfatal CHD and CVD, which was 0.57–0.60 with Group 2, 0.43–0.45 with Group 3, and 0.26 with Group 4, using Group 1 as reference, all ps < 0.001. The adjusted HR for fatal CVD was 0.75 (n.s.) with Group 2, 0.53 (p = 0.02) with Group 3 and 0.43 (p = 0.002) with Group 4, while corresponding HR for total mortality was 0.76 (n.s.), 0.62 (p = 0.003) and 0.51 (p < 0.001).
Sensitivity analyses with propensity scores
Propensity scores for each of Groups 2, 3 and 4 were estimated at multivariate logistic regression, including all covariates used in Figure 1 and Table 3 as independent predictors and using Group 1 as dependent reference. Supplementary Table 1 shows that adjusted means and frequencies for all included baseline covariates were similar with non-significant trends across the groups, and all standardized differences considerably below 10% as acceptable upper limit, except for total and HDL cholesterol in some of the comparisons. Applying these scores as continuous covariates at the Weibull regressions, and also adding total and HDL cholesterol as separate covariates, showed similar HRs for all outcomes as in Table 3 (see Supplementary Figure 1). This concerned analyses both in all patients and in the subgroup with albuminuria. In all patients, adjusted HR for fatal/nonfatal CHD and CVD was 0.61 and 0.66 with Group 2 compared to Group 1, 0.44 and 0.46 with Group 3 and 0.26 and 0.26 with Group 4, respectively, all ps < 0.001. Corresponding adjusted HR in the subgroup with albuminuria was 0.57–0.60, 0.45–0.43 and 0.26–0.26, respectively, all ps < 0.001.
Discussion
This large prospective observational study of patients with type 2 diabetes followed for mean 6.5 years has demonstrated relative risk reductions for fatal/nonfatal CHD or CVD of around 35%–40% with a decrease in HbA1c, reductions of 56%–57% with a combined decrease in both HbA1c and SBP, and reduction of 75% with a combined decrease in all three risk factors HbA1c, SBP and the lipid ratio non-HDL:HDL, compared to a reference group with increasing values of all these risk factors. Corresponding relative risk reductions for fatal CVD and all-cause fatality were 31%–34%, 46%–50% and 56%–63%, respectively. All these findings were after adjustment for clinical characteristics, baseline values of the analysed and other cardiovascular risk factors, treatments, social data, history of CVD and previous atrial fibrillation.
This observational study had several inclusion criteria in order to achieve similar baseline values for the three risk factors across the groups, and also allowed for selection of groups with additionally decreasing risk factors during the study period. A similar method has been applied in a recent study of progressively increasing life-style risk factors and risk for myocardial infarction. 18 Fulfilment of the Weibull distribution assumption allowed for estimation of reliable HRs, while the proportional hazard assumption for Cox regression was not entirely fulfilled. Additional use of propensity scores including all available covariates did not change the HRs.
The CVD risk reduction was considerable with decrease in HbA1c only (Group 2) of mean 6 mmol/mol to final mean HbA1c 49 mmol/mol (mean decrease 0.5% to final 6.7%), below the treatment target of 53 mmol/mol (7.0%). The adjusted incidence rate for fatal/nonfatal CVD was 32 per 1000 person-years in Group 1 and 25 in Group 2. Comparatively in the Kaiser Permanente study of 26,636 patients with type 2 diabetes (mean age 60 years), those achieving updated mean HbA1c below 53 mmol/mol (7%) during 6 years of follow-up had an nonfatal CVD incidence rate of 16.9 per 1000 person-years versus 18.2 in subjects with no control of HbA1c, SBP or LDL cholesterol during the study period. 8 These authors propose that as 90% of their patients already had HbA1c levels well below 75 mmol/mol (9%), a benefit of additional glycaemic control to below 53 mmol/mol (7%) should be difficult to detect. In contrast, our study estimated the effect of HbA1c change, with a large difference in change of 15 mmol/mol (1.3%) between Groups 1 and 2.
The United Kingdom prospective diabetes survey (UKPDS) found that reduction in HbA1c was associated with a reduced risk of myocardial infarction, with no threshold below which risk reduction could not be obtained. 19 More recent observational studies conducted on a large NDR sample in Sweden and from New Zealand have reported similar findings on CHD and CVD,20,21 while the post hoc analysis of the ADVANCE study found decreasing risks of fatal/nonfatal CVD with HbA1c down to 53 mmol/mol (7%), but with a flattened risk effect with HbA1c levels lower than 53 mmol/mol (7%). 22
The mean SBP decrease in Group 3 was considerable, 12 mmHg, with a baseline of 140 mmHg above the present treatment target <140 mmHg, and a final mean SBP of 128 mmHg well below the treatment target. Comparatively, Group 1 had an increase of 8 mmHg to final mean 143 mmHg above the treatment target, with a difference in change of 22 mmHg between these two groups. This corresponded to a CVD risk reduction of 56% in Group 3. Previous observational studies have found a considerably increased CVD risk with SBP 140 mmHg or more,23–25 and a lower CVD risk with SBP well below 140 mmHg, although no significant difference in risk effect was seen with SBP levels 119–129 mmHg versus 130–139 mmHg.23–26 The findings in this study underline the strong effect on CVD risk reduction with a decrease in SBP far below 140 mmHg down to around 130 mmHg, compared to a rise above 140 mmHg.
Previous guidelines for patients with type 2 diabetes have recommended a treatment target for LDL cholesterol of <1.8 mmol/L at very high risk and of <2.5 mmol/L at high risk (no CVD risk factor). 27 This study showed that Group 4 had 20% decrease in LDL cholesterol, while the ratio non-HDL:HDL decreased with 30%. Non-HDL:HDL (always one unit lower than the ratio total-to-HDL cholesterol) has been demonstrated to have a stronger effect on risk for CHD and CVD than LDL cholesterol in both type 2 diabetes and the general population.28–30 A considerable decrease in this lipid ratio non-HDL:HDL of 0.8 units down to a final mean ratio of 2.1 was seen in Group 4 (decrease in the lipid ratio as well as in HbA1c and SBP), corresponding to a further CVD risk reduction of 75% with Group 4 compared to Group 1. This underlines the strong effect for CVD risk reduction with a decrease to low levels of this lipid ratio. The crude total CVD incidence rate was 11 per 1000 person-years in Group 4, compared to 34 in Group 1. Comparably in the Kaiser Permanente study, the combined achievement of target control for HbA1c, SBP and LDL cholesterol during follow-up showed an incidence rate in nonfatal CVD of 7 per 1000 person-years, while 18 per 1000 person-years in those with no target control of these risk factors. 8
The subgroup of patients with albuminuria at baseline was added here for comparison with the Steno study of patients with type 2 diabetes and albuminuria at baseline, which has reported a relative risk decrease of 67% for fatal CVD and 56% for total mortality after an intervention period achieving superior effect on risk factors with intensive treatment, regarding HbA1c, total and LDL cholesterol, SBP and rate of urine albumin excretion.6,7 Comparatively, the combined decrease in HbA1c, SBP and non-HDL:HDL achieved in Group 4 of our patients with albuminuria was associated with a relative risk reduction of around 57% (p = 0.002) for fatal CVD and 49% (p < 0.001) for total mortality, compared to our reference Group 1.
The main strengths of this study are the large number of participants, including patients from a diabetes register containing data from daily clinical practice representing real life. HbA1c values were quality assured nationwide by regular calibration. Follow-up of outcomes was assured for all patients with the use of data linkage to outcome registers, which is a proven reliable and validated method. As often recommended for observational epidemiological analyses, we applied stratification of the analysed risk factor predictors by use of our four groups of increasing or decreasing risk factors levels. A limitation of the study was that other possible combinations of risk factor changes, for example, decrease in blood pressure and blood lipids only could not be included in this study, as that would imply too many groups to make the analysis of effect of combined risk factors impossible. Other limitations of this study were that unknown covariates could not be excluded, although extensive adjustment was performed for clinical characteristics, traditional risk factors and treatment, including albuminuria as a marker of microangiopathy and a strong risk factor for CHD. Our sensitivity analysis with propensity scores also showed similar HR as in the main analyses. Although this was not a randomized trial, such studies often have limitations due to strongly selective inclusion or exclusion criteria and noncompliance. Thus, well-designed observational studies on risk factors have complementary strengths and limitations that should be equally robust as trials, and the implementation of prevention strategies in evidence-based medicine should be based on the breadth and consistency of evidence across multiple research paradigms, incorporating all evidence based on strengths and limitations of different research designs.
In summary, compared to a reference group with increasing values of three traditional risk factors HbA1c, SBP and the ratio non-HDL:HDL during 7 years of follow-up, decreases in each of HbA1c only, or HbA1c combined with SBP and non-HDL:HDL, were associated with considerable reductions in risks for CHD, CVD and total mortality. Similar findings were found in a subgroup of patients with baseline albuminuria, used here as a suggestive parallel to the Steno study of patients with type 2 diabetes and albuminuria at baseline. This observational study of change in relevant cardiovascular risk factors should be regarded as additional evidence and complement to findings in previous randomized trials in type 2 diabetes on the importance of intensive treatment of the individual risk factors glucose, blood pressure and blood lipids,26,31,32 and also on the effect of combined treatment of these risk factors.5–7
Footnotes
Acknowledgements
The authors would like to thank the regional NDR coordinators, all participating nurses, physicians and other staff who have contributed to the NDR. Most of all, the authors would like to thank the patients who support the NDR, both individually and collectively through their patient organization, the Swedish Diabetes Federation. Results and views of this study represent the authors and not necessarily any official views of the Medical Products Agency where one author is employed (B.Z.).
Author contribution
K.E.-O. and J.C. researched the data. J.C. performed the statistical analyses. K.E.-O. and J.C. wrote the manuscript. All authors designed the study, revised and reviewed the article and contributed to the discussion and gave final approval of the manuscript to be submitted.
Declaration of conflicting interests
The author(s) declared no potential conflicts of interest with respect to the research, authorship and/or publication of this article.
Funding
The Swedish Association of Local Authorities and Regions funds the NDR.
References
Supplementary Material
Please find the following supplemental material available below.
For Open Access articles published under a Creative Commons License, all supplemental material carries the same license as the article it is associated with.
For non-Open Access articles published, all supplemental material carries a non-exclusive license, and permission requests for re-use of supplemental material or any part of supplemental material shall be sent directly to the copyright owner as specified in the copyright notice associated with the article.