
Abstract
Purpose:
In diabetes, generalised microvascular disease and coronary artery disease (CAD) are likely to occur in parallel. We used a sidestream dark field (SDF) handheld imaging device to determine the relation between the labial microcirculation parameters and CAD in asymptomatic patients with diabetes.
Methods:
SDF imaging was validated for assessment of labial capillary density and tortuosity. Thereafter, mean labial capillary density and tortuosity were evaluated and compared in non-diabetic controls, and in asymptomatic patients with type 1 and type 2 diabetes. In diabetic patients, mean capillary density and tortuosity were compared according to the presence of CAD.
Results:
Both type 1 and type 2 diabetes were associated with increased capillary density and tortuosity. In diabetes, mean capillary density was an independent predictor of elevated coronary artery calcium (CAC) (p = 0.03) and obstructive CAD on computed tomography angiography (p = 0.01). Using a cut-off mean capillary density of 24.9 (per 0.63 mm2) the negative predictive value was 84% and 89% for elevated CAC and obstructive CAD. Likewise, capillary tortuosity was an independent predictor of increased CAC (p = 0.01) and obstructive CAD (p = 0.04).
Conclusion:
Assessment of labial microcirculation parameters using SDF imaging is feasible and conveys the potential to estimate vascular morbidity in patients with diabetes, at bedside.
Introduction
Cardiovascular disease, especially coronary artery disease (CAD), is a predominant cause of morbidity and mortality in diabetes. 1 As a result, recent research has aimed to determine additional risk factors and markers, to distinguish high risk diabetic patients.2,3 Likewise, the presence of microvascular co-morbidities, in the form of nephropathy, retinopathy and neuropathy, has been previously associated with an increased risk of CAD as well as its worse prognosis in diabetes.4–7 Generalised microvascular disease and CAD may occur in parallel due to common pathogenic mechanisms initiated by hyperglycaemia. 8 However, microvascular disease has also been suggested to contribute to CAD directly through angiogenesis of microvessels in the atherosclerotic plaque. 9 As a consequence, a measure to quantify and qualify microvascular disease in diabetes may convey the potential to predict vascular morbidity and CAD more accurately than the traditional risk factors.
The orthogonal polarisation spectral (OPS) and the more novel sidestream dark field (SDF) handheld imaging device allow direct visualisation of blood in the microcirculation.10,11 Thereby, the microcirculatory network of arterioles and capillaries can be investigated non-invasively. In particular, the technique is suitable for the study of easily accessible tissues with a superficial microcirculatory network of the skin and mucous membranes. Accordingly, OPS and SDF imaging have been applied to assess the characteristics of the microcirculation and monitor its alterations in the nail fold as well as in sublingual and labial tissue of patients with heart failure, rheumatic diseases and sepsis.12,13 However, to our knowledge no previous studies have been performed in patients with diabetes.
In the current study we first sought to validate the assessment of labial microcirculation parameters, consisting of capillary density and tortuosity, using the SDF imaging device. Secondly, the labial capillary density and tortuosity were compared in non-diabetic controls and patients with diabetes. Finally, the relation between labial capillary density and tortuosity with CAD was evaluated in the sub-population of patients with diabetes.
Methods
Study design and population
One hundred and thirty-one consecutive asymptomatic patients with diabetes were referred to the cardiology outpatient clinic for cardiovascular screening. The American Diabetes Association criteria were used to define diabetes and for further stratification in type 1 or 2. 14 Patients were considered as having type 1 diabetes if laboratory analysis demonstrated auto-antibodies to islet cells, insulin and glutamic acid decarboxylase. Otherwise, patients were considered to have type 2 diabetes. Further cardiovascular risk factors were assessed according to the following criteria: positive family history of CAD (defined as presence of CAD in first degree family members younger than 55 (males) or 65 (females) years of age), smoking (defined as current smoking or smoking in the last two years), hypertension (defined as a blood pressure >140/90 mmHg or treatment with antihypertensive medication), hypercholesterolaemia (defined as a total cholesterol level > 5.0 mmol/L or use of cholesterol lowering medication), degree of obesity (estimated by body mass index (BMI = kg/m2)), level of gly caemic control defined by plasma glycated-haemoglobin (mmol/L) and presence of micro-albuminuria (defined by a urine albumin/creatinine ratio ≥ 3.5 mg/mmol). Second, non-invasive multi-slice computed tomography (MSCT), including coronary artery calcium (CAC) scoring and coronary angiography, were performed as part of clinical work-up. Also, all patients underwent non-invasive assessment of the labial microcirculation using SDF imaging, to determine capillary density and tortuosity. The latter was performed in a study setting, performed according to the Declaration of Helsinki and approved by the institutional review committee of the Leiden University Medical Centre, Leiden. All patients gave written informed consent.
In addition, as part of the study setting, 50 asymptomatic healthy individuals constituting the non-diabetic control group underwent a similar non-invasive assessment of the labial microcirculation using SDF. The healthy individuals constituting this control group had no history of diabetes or cardiovascular disease and were not known to be with related risk factors (hypertension, hypercholesterolaemia, smoking or micro-albuminuria).
Validation study of the microcirculation parameters as assessed by SDF
The intra- and interobserver variability of the labial capillary density and structure was determined in the non-diabetic control group (N = 50). For this sub-population, SDF imaging of the four inner lip quadrants was performed by two experienced observers. SDF imaging was performed twice by each observer, on two different occasions. Each observer independently performed processing of their own recordings followed by assessment of the capillary density and tortuosity.
Assessment of labial microcirculation
Data acquisition by sidestream dark field imaging
Imaging of the capillaries was performed with SDF imaging with a handheld MicroScan Video Microscope (MicroVision Medical, Amsterdam, Netherlands). The SDF device was fitted with a sterile disposable 5× magnification lens. Video output was visualised on a monitor and connected to a computer via a signal converter (Canopus, ADVC110).
Measurements were performed by two trained physicians blinded to clinical data. All subjects (patients with diabetes and non-diabetic controls) were instructed to refrain from consuming caffeine-containing substances 2 h prior to the evaluation. Subjects were in supine position, in a temperature controlled room with a temperature of approximately 22°C. The tip of the SDF probe was placed on the inner lip. To prevent microcirculatory perfusion disturbance due to application of pressure on the imaging area, the probe was first placed on the labial tissue and then retracted to an extent which minimised contact but enabled visualisation of the capillary bed. Illumination intensity and depth of focus were modulated to fine-tune image quality.
Continuous digital image recordings (duration 1 min) were captured in four quadrants of the inner lip: upper right quadrant, upper left quadrant, lower right quadrant and lower left quadrant. Per quadrant, digital image recordings were saved on a hard drive as DV-AVI files to enable off-line analysis.
Assessment of microcirculation
For further assessment of capillary density and structure, three frozen microcirculatory imaging areas were selected from the digital image recordings for each quadrant. Microcirculatory imaging areas were selected to meet the following criteria: 1) representative capillary density and structure for the studied quadrant, 2) longitudinal axis view with full-length capillaries enabling structural as well as quantitative assessment of the capillaries, 3) clear, well-focused view of the capillaries. Each microcirculatory imaging area visualised by SDF corresponded with a tissue area of 0.63 mm2 (0.9 mm × 0.7 mm) (Figure 1).
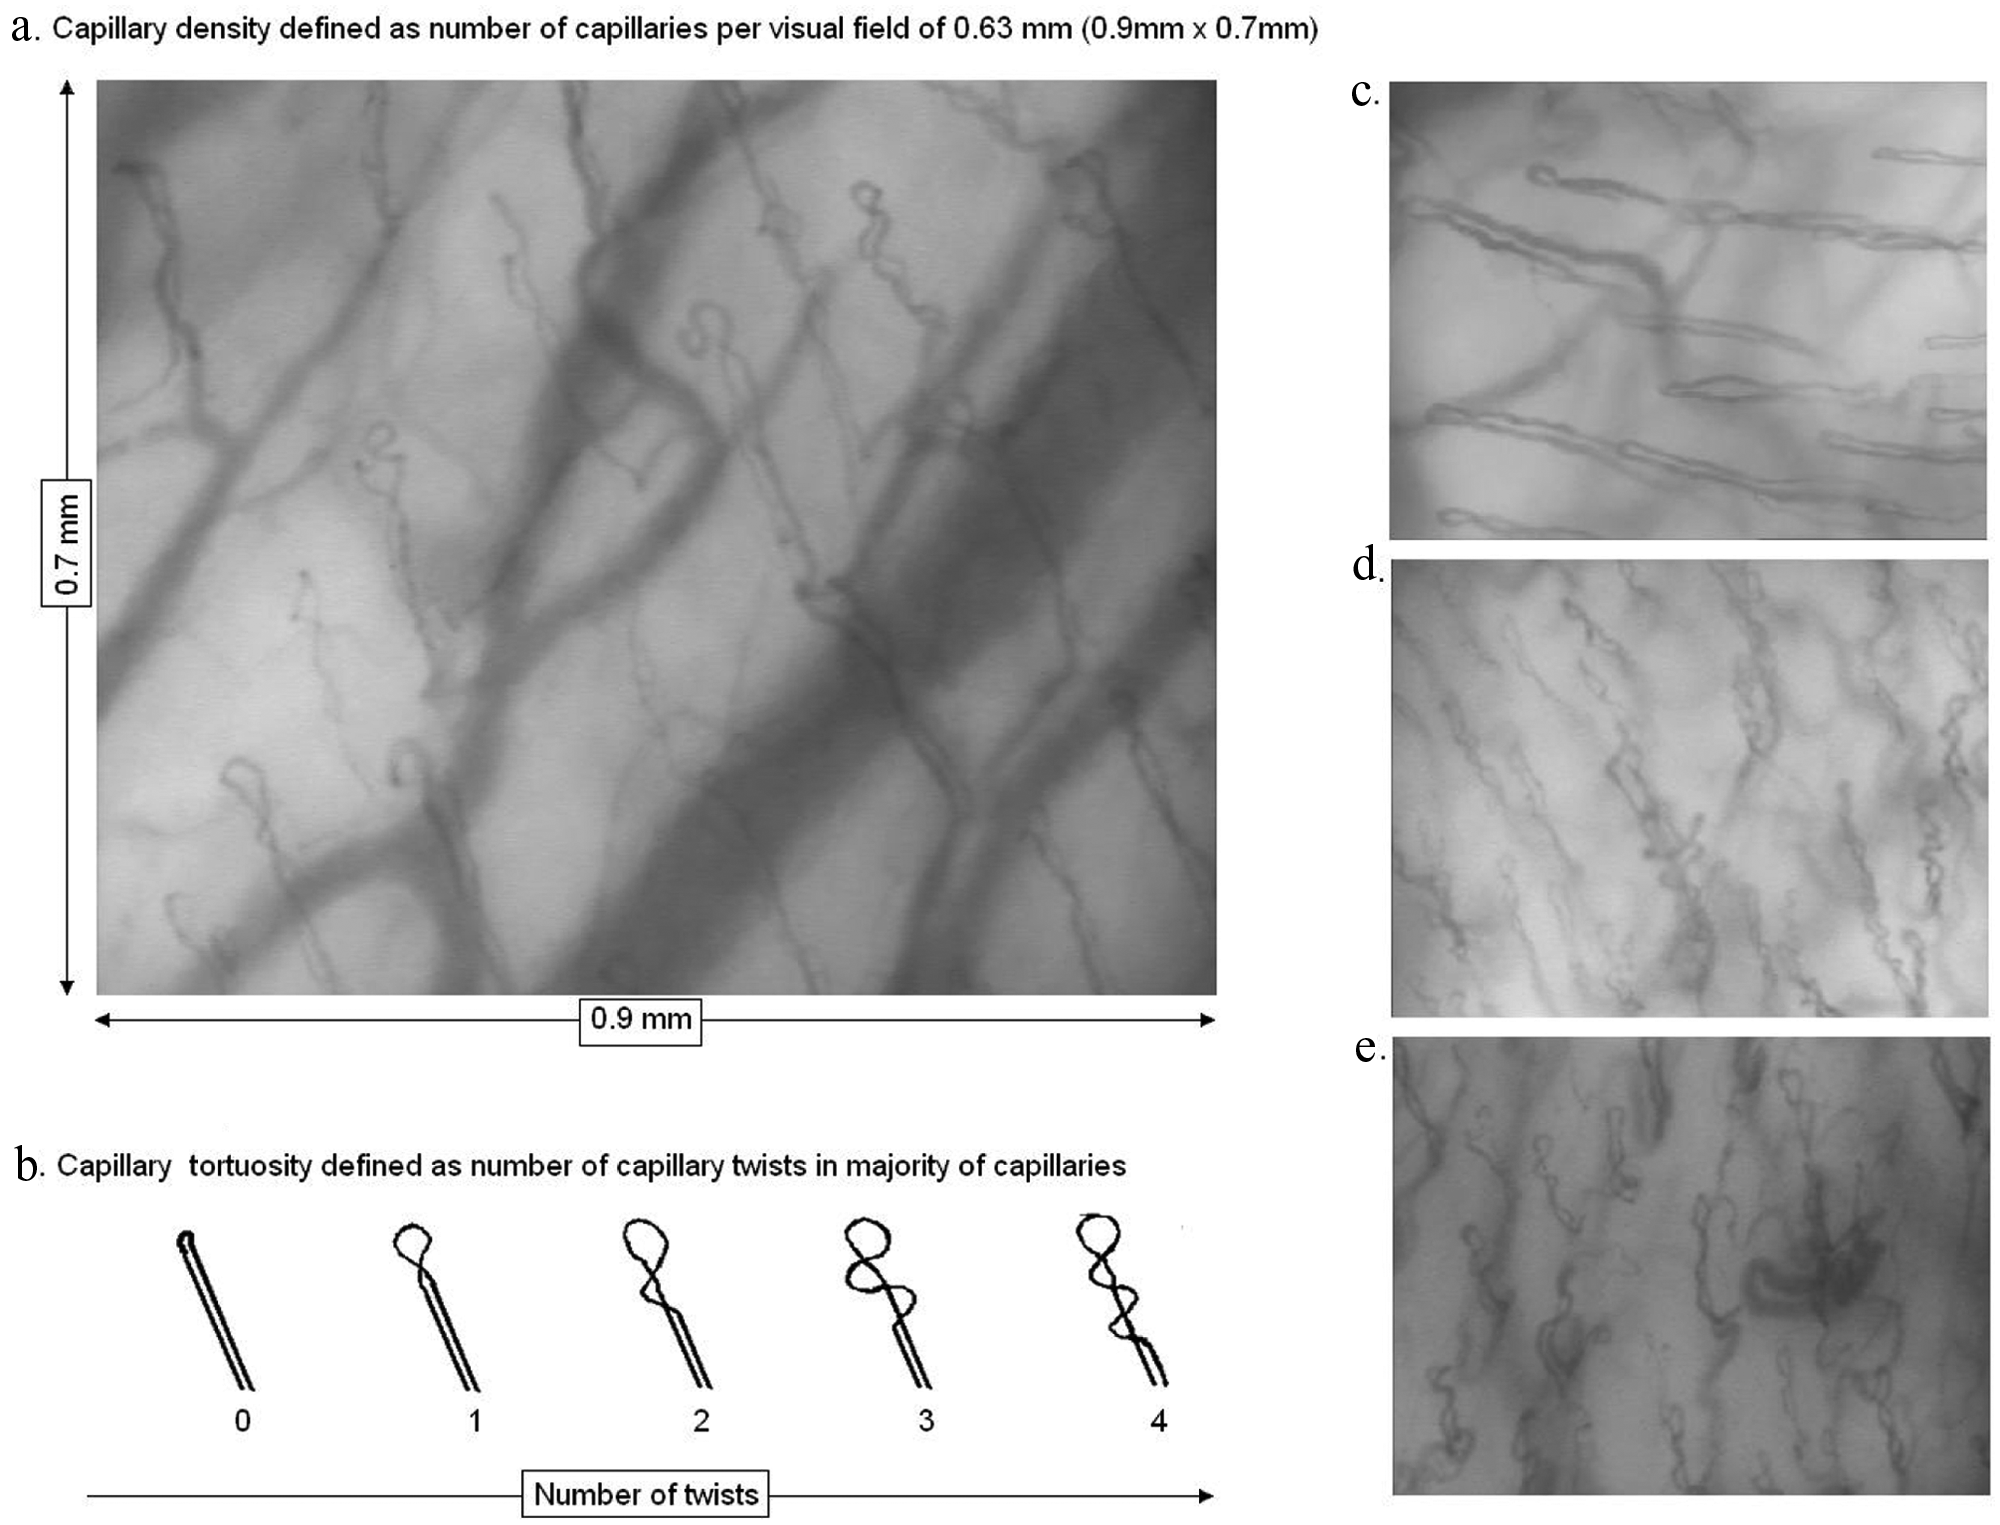
Visualisation of the labial micro-vasculature by sidestream dark field. Capillaries are identified as loops emerging from the wider arterioles in the background (a, c–e). To assess capillary density the number of capillaries was determined in a visual field of 0.63 mm2 (a). To assess capillary tortuosity, the number of twists per capillary in the majority of capillaries was evaluated for each patient. Number of twists was stratified as 0: no twists (or pinhead capillaries) to 4: four or more twists (b). A relatively low capillary density and tortuosity score was observed in non-diabetic controls (c). In contrast, a higher capillary density and tortuosity score was observed in patients with diabetes (d), often accompanied by dilation, branching and malformation of the capillaries (e).
Capillary density
To determine capillary density, the number of capillaries was counted manually on each selected microcirculatory imaging area, on the monitor. All vessels identified as capillaries were included. Partially visible capillaries were included if the observer was certain that the vessel was a capillary due to its morphology. Capillary density was defined as the number of counted capillaries per microcirculatory image area (capillaries per 0.63 mm2) (Figure 1). Finally, capillary density of the 12 microcirculatory imaging areas (three microcirculatory imaging areas per quadrant) were averaged to obtain the mean capillary density per subject.
Capillary tortuosity
To assess the capillary tortuosity score, the number of twists per capillary in the majority of capillaries was evaluated, on each selected microcirculatory imaging area. The number of twists was stratified as 0: no twists (or pinhead capillaries) to 4: four or more twists (Figure 1). Subsequently, the overall tortuosity score per subject was determined by selecting the most frequent tortuosity score in the 12 studied microcirculatory imaging areas.
Assessment of coronary artery disease by MSCT in patients with diabetes
MSCT data acquisition
Imaging was performed with a 64-slice MSCT scanner (Aquilion64, Toshiba Medical Systems, Japan). If necessary and tolerated, oral beta-blockers (metoprolol 50 mg or 100 mg) were provided 1 h preceding the scan to achieve a heart rate < 65 beats per minute. Initially, a non-enhanced prospective electrocardiographically gated scan, triggered at 75% of the R-R interval with 4 × 3.0 mm collimation was obtained to measure CAC score and determine the start and end position of the helical scan.
Thereafter, MSCT angiography was performed using the following parameters: collimation 64 × 0.5 mm, tube rotation time 400, 450 or 500 ms depending on the heart rate, tube current 300 or 350 mA, tube voltage 120 kV. Non-ionic contrast material was administered in the antecubital vein at a flow rate of 5 ml/L and the amount of 90–105 ml (depending on the total scan time), followed by 50 ml of saline solution flush. Automated bolus-tracking in the aortic root was used for the timing of the scan. Images were acquired with simultaneous ECG registration during a single breath hold of approximately 10 seconds. Segmental reconstruction algorithm was applied to generate a single image from the data of one, two or three consecutive heartbeats. Images were reconstructed in the cardiac phase showing least motion artefacts. In general, the end-diastolic phase was used. However, additional reconstructions were made throughout the entire cardiac cycle if necessary to improve image quality. Subsequently, the images were transferred to a remote workstation (Vitrea 2, Vital Images, Minnetonka, USA) for post-processing.
Assessment of CAD
Coronary artery calcium score
All data were evaluated with a remote workstation using dedicated software (Vitrea2, Vital Images, Minnetonka, USA). In each patient, coronary calcium was identified as a dense area in the coronary artery exceeding the threshold of 130 Hounsfield units. The total Agatston score was determined for each patient. Patients with a CAC score >100 were classified as having increased CAC.
Coronary atherosclerosis
MSCT coronary angiography images were interpreted by two experienced observers blinded to the patient characteristics. Discrepancies in interpretation were directly resolved in consensus. The presence of coronary atherosclerosis was visually evaluated on axial images and curved multiplanar reconstructions in at least two orthogonal planes. Obstructive coronary atherosclerosis was defined as the presence of luminal narrowing ≥ 50%.
Statistical analysis
Continuous variables were expressed as means ± standard deviation. Categorical variables were expressed as numbers (percentages).
First, for the validation of the mean labial capillary density assessment in non-diabetic controls, the interobserver for the first and second session, and the intraobserver for observer-1 as well as observer-2, were determined by calculating the Pearson coefficient of correlation (r). For the validation of the capillary tortuosity assessment in the control group, the interobserver for the first and second session, and the intraobserver for observer-1 as well as observer-2, were determined by calculating the agreement percentage and the kappa value.
Second, the mean capillary density was compared in non-diabetic controls and patients with type 1 and type 2 diabetes. For this purpose, the average capillary density and standard deviation were calculated in each group. The independent T-test was used to assess the difference in mean capillary density between the three groups. In addition, the relation between type 1 diabetes (versus non-diabetic controls as reference) and type 2 diabetes (versus non-diabetic controls as reference) with the capillary density was tested in a backward multivariate linear regression analysis, to correct for the influence of other cardiovascular risk factors.
Third, the distribution of capillary tortuosity was compared among healthy individuals and patients with type 1 and type 2 diabetes, by calculating the percentage of patients per tortuosity score for each group. Subsequently, the relation between type 1 diabetes (versus non-diabetic controls as reference) and type 2 diabetes (versus non-diabetic controls as reference) was also tested with the capillary tortuosity in a backward multivariate linear regression analysis.
Finally, in the sub-population of patients with diabetes, the relation of capillary density and tortuosity score with the presence of CAD was evaluated. Initially, patients with diabetes were stratified as having a CAC score 0–100 or as those with an elevated CAC score of >100. Average capillary density and standard deviation were calculated in each group. The independent T-test was used to assess the difference in mean capillary density between the two groups. A similar procedure was performed to compare the mean capillary density between diabetic patients with no obstructive CAD and those with obstructive CAD (luminal narrowing ≥ 50%).
To identify the potential predictors of an elevated CAC score in diabetes, a univariate logistic regression analysis of baseline cardiovascular risk factors, capillary density and capillary tortuosity was initially performed. Thereafter, all risk factors as well as capillary density and tortuosity were entered in a backward stepwise multiple logistic regression analysis model to identify the independent predictors of an elevated CAC score. Results of variables with a p value ≤ 0.25 are illustrated. A similar procedure was repeated to identify the predictors of obstructive CAD in patients with diabetes.
Statistical analyses were performed using SPSS software (version 12.0.1, Inc., Chicago, Illinois, USA). p values < 0.05 were considered statistically significant.
Results
Characteristics of non-diabetic controls and patients with diabetes
Characteristics of the sub-populations of non-diabetic controls and patients with type 1 and type 2 diabetes are provided in Table 1. No significant difference was observed among the gender distribution of patients with diabetes (type 1 and type 2) as compared with non-diabetic controls. Patients with type 1 diabetes were relatively younger than non-diabetic controls. In contrast, patients with type 2 diabetes were similar in age to non-diabetic controls. Patients with type 2 diabetes had a higher mean BMI than non-diabetic controls. As compared with non-diabetic controls, patients with diabetes (type 1 and type 2) were more often smokers, more often had a positive family history for CAD and were frequently treated with statins and anti-hypertensive medication.
Characteristics of non-diabetic controls and patients with type 1 and type 2 diabetes.
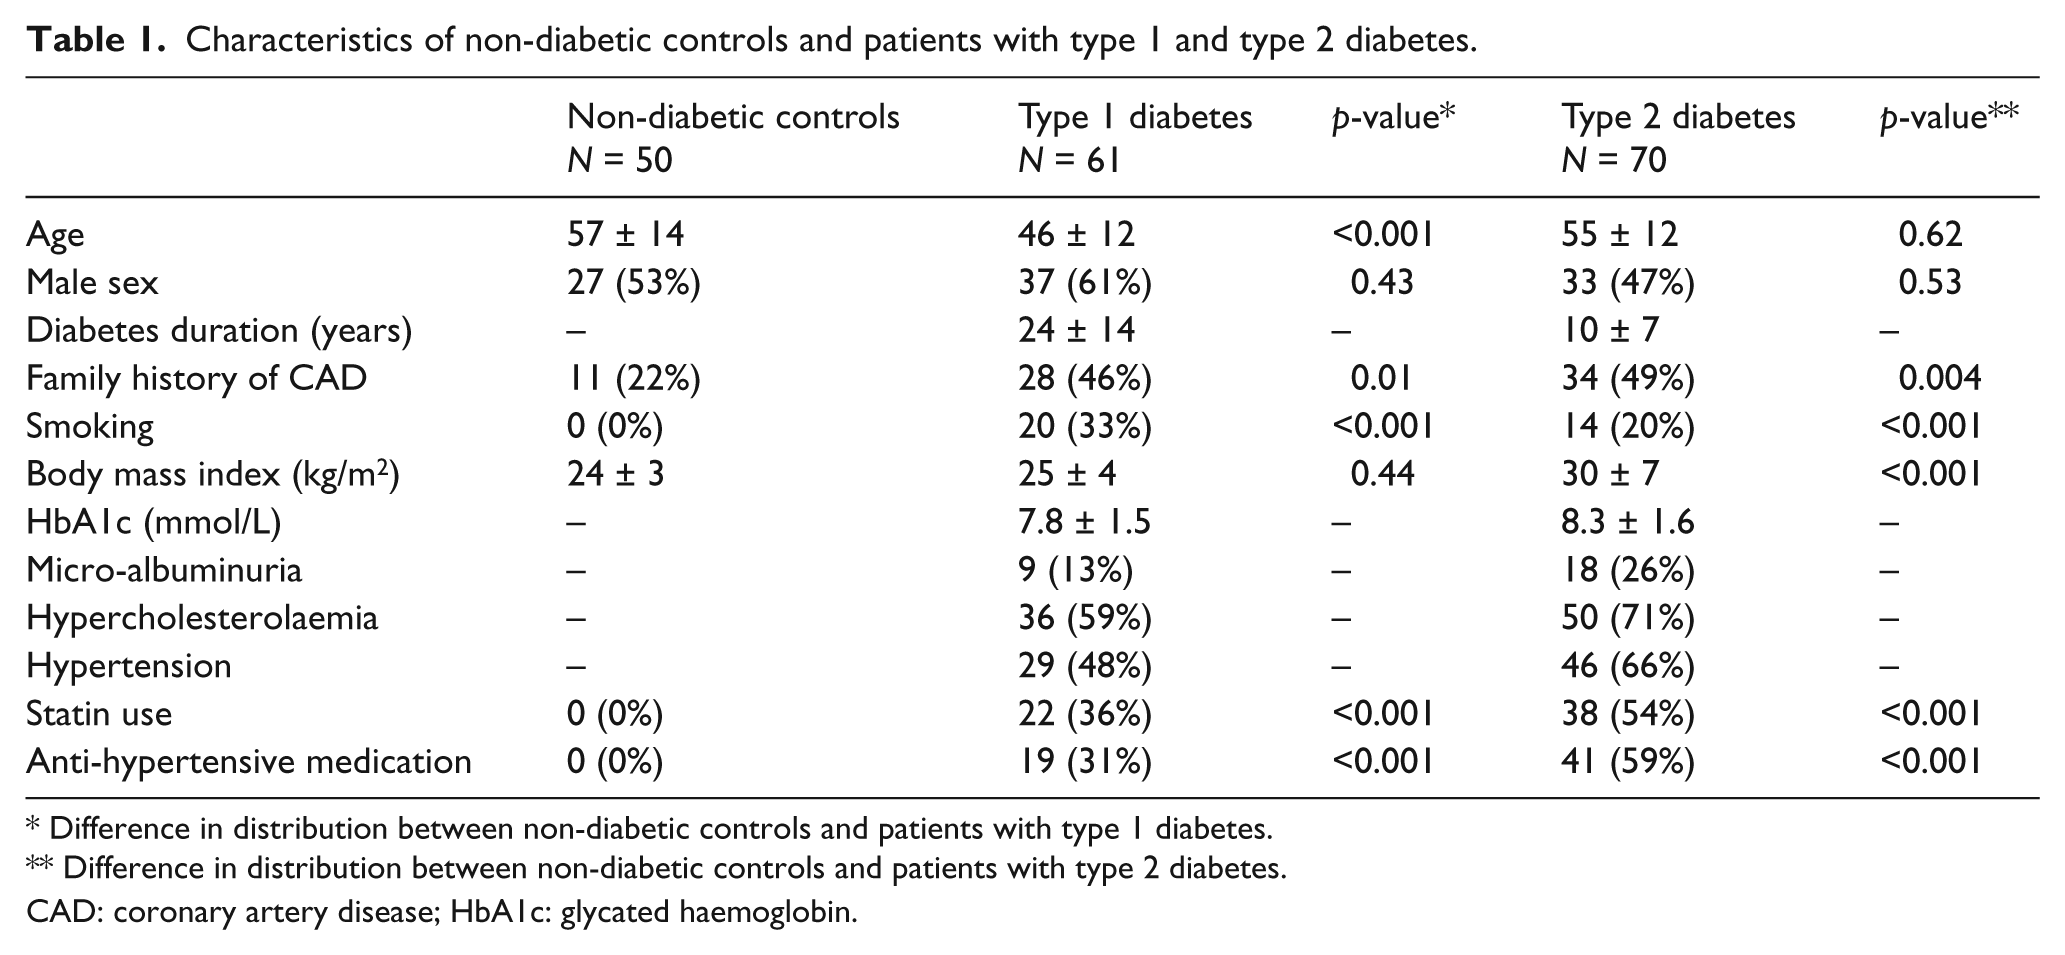
Difference in distribution between non-diabetic controls and patients with type 1 diabetes.
Difference in distribution between non-diabetic controls and patients with type 2 diabetes.
CAD: coronary artery disease; HbA1c: glycated haemoglobin.
Validation study
Capillary density
The interobserver correlation for the assessment of capillary density during the first session and second session were reasonable with a regression coefficient of 0.75 (p < 0.001) and 0.72 (p < 0.001) respectively. The intraobserver regression correlation coefficients for the assessment of capillary density were 0.80 (p < 0.001) and 0.72 (p < 0.001) for observer-1 and observer-2.
Capillary tortuosity
The interobserver values for the assessment of capillary tortuosity were excellent and similar for the first and second session with an agreement of 88% in tortuosity score (kappa 0.83). The intraobserver evaluation for tortuosity score revealed an agreement of 90% (kappa 0.85) for observer-1 and 88% (kappa 0.83) for observer-2.
Labial capillary density in patients with diabetes as compared with non-diabetic controls
Capillary density in type 1 diabetes
The mean capillary density in patients with type 1 diabetes (25 ± 4 per 0.63 mm2) was not significantly different as compared with non-diabetic controls (24 ± 3 per 0.63 mm2) (Figure 2). However, after correction for age and other cardiovascular risk factors in a backward multiple linear regression model, the presence of type 1 diabetes (with non-diabetic controls as reference) was found to be associated with an increased capillary density (Exp ß 2.4, 95% confidence interval (CI) 0.8–3.9; p = 0.003).
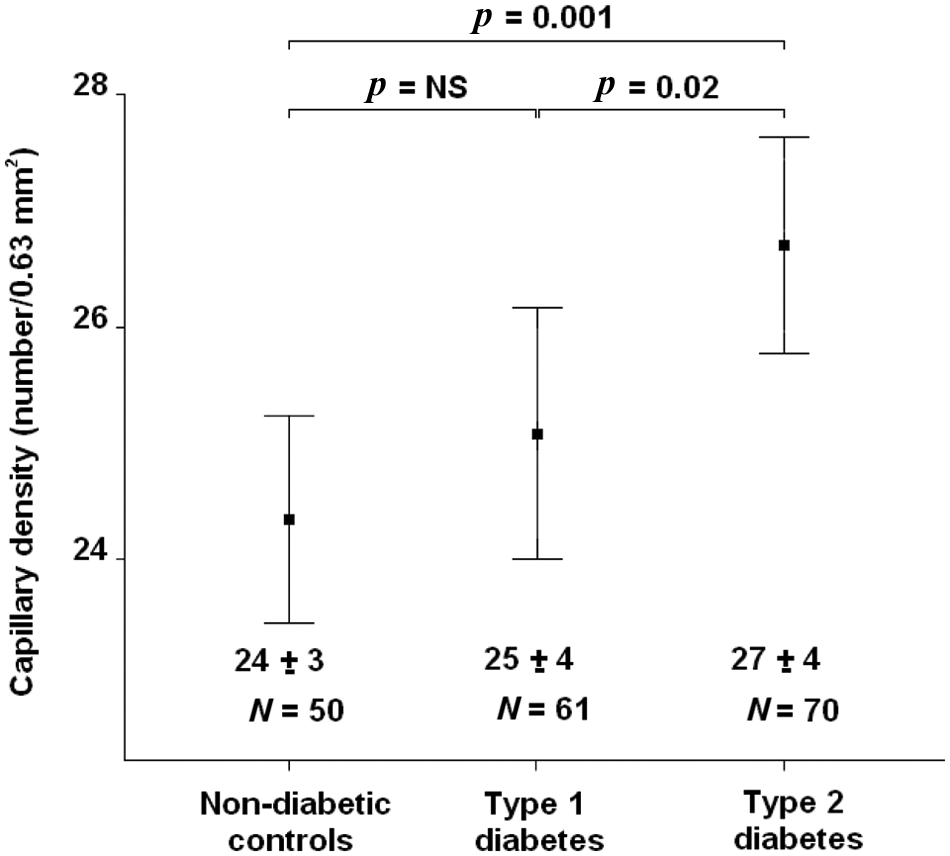
Mean capillary density in non-diabetic controls, versus type 1 diabetic patients, and type 2 diabetic patients. Mean capillary density was significantly higher in patients with type 2 diabetes. NS: not significant.
Capillary density in type 2 diabetes
The mean capillary density was significantly increased in patients with type 2 diabetes (27 ± 4 per 0.63 mm2) as compared with non-diabetic controls (p = 0.001) (Figure 2). Importantly, also after correction for age and other cardiovascular risk factors in a backward multiple linear regression model, the presence of type 2 diabetes (with non-diabetic controls as reference) maintained a significant association with capillary density (Exp ß 1.0, 95% CI 0.3–1.6; p = 0.01).
Labial capillary tortuosity in patients with diabetes as compared with non-diabetic controls
Capillary tortuosity in type 1 diabetes
Whereas in non-diabetic controls a high proportion of subjects had a low tortuosity score of 1 (45%), with a lower proportion of subjects in the tortuosity score of 2 and 3 category (20%) (Figure 3(a)), in type 1 diabetes, the patients were more evenly distributed among the tortuosity scores 1–3 (Figure 3(b)). In type 1 diabetes, a relatively higher proportion of patients was stratified as having a tortuosity score of 2 (27%) and of 3 (37%) (Figure 3(b)). Accordingly, after correction for age and other cardiovascular risk factors in a backward multiple linear regression model, presence of type 1 diabetes (with non-diabetic controls as reference) was found to be associated with capillary tortuosity (Exp ß 0.6, 95% CI 0.1–1.0; p = 0.02).
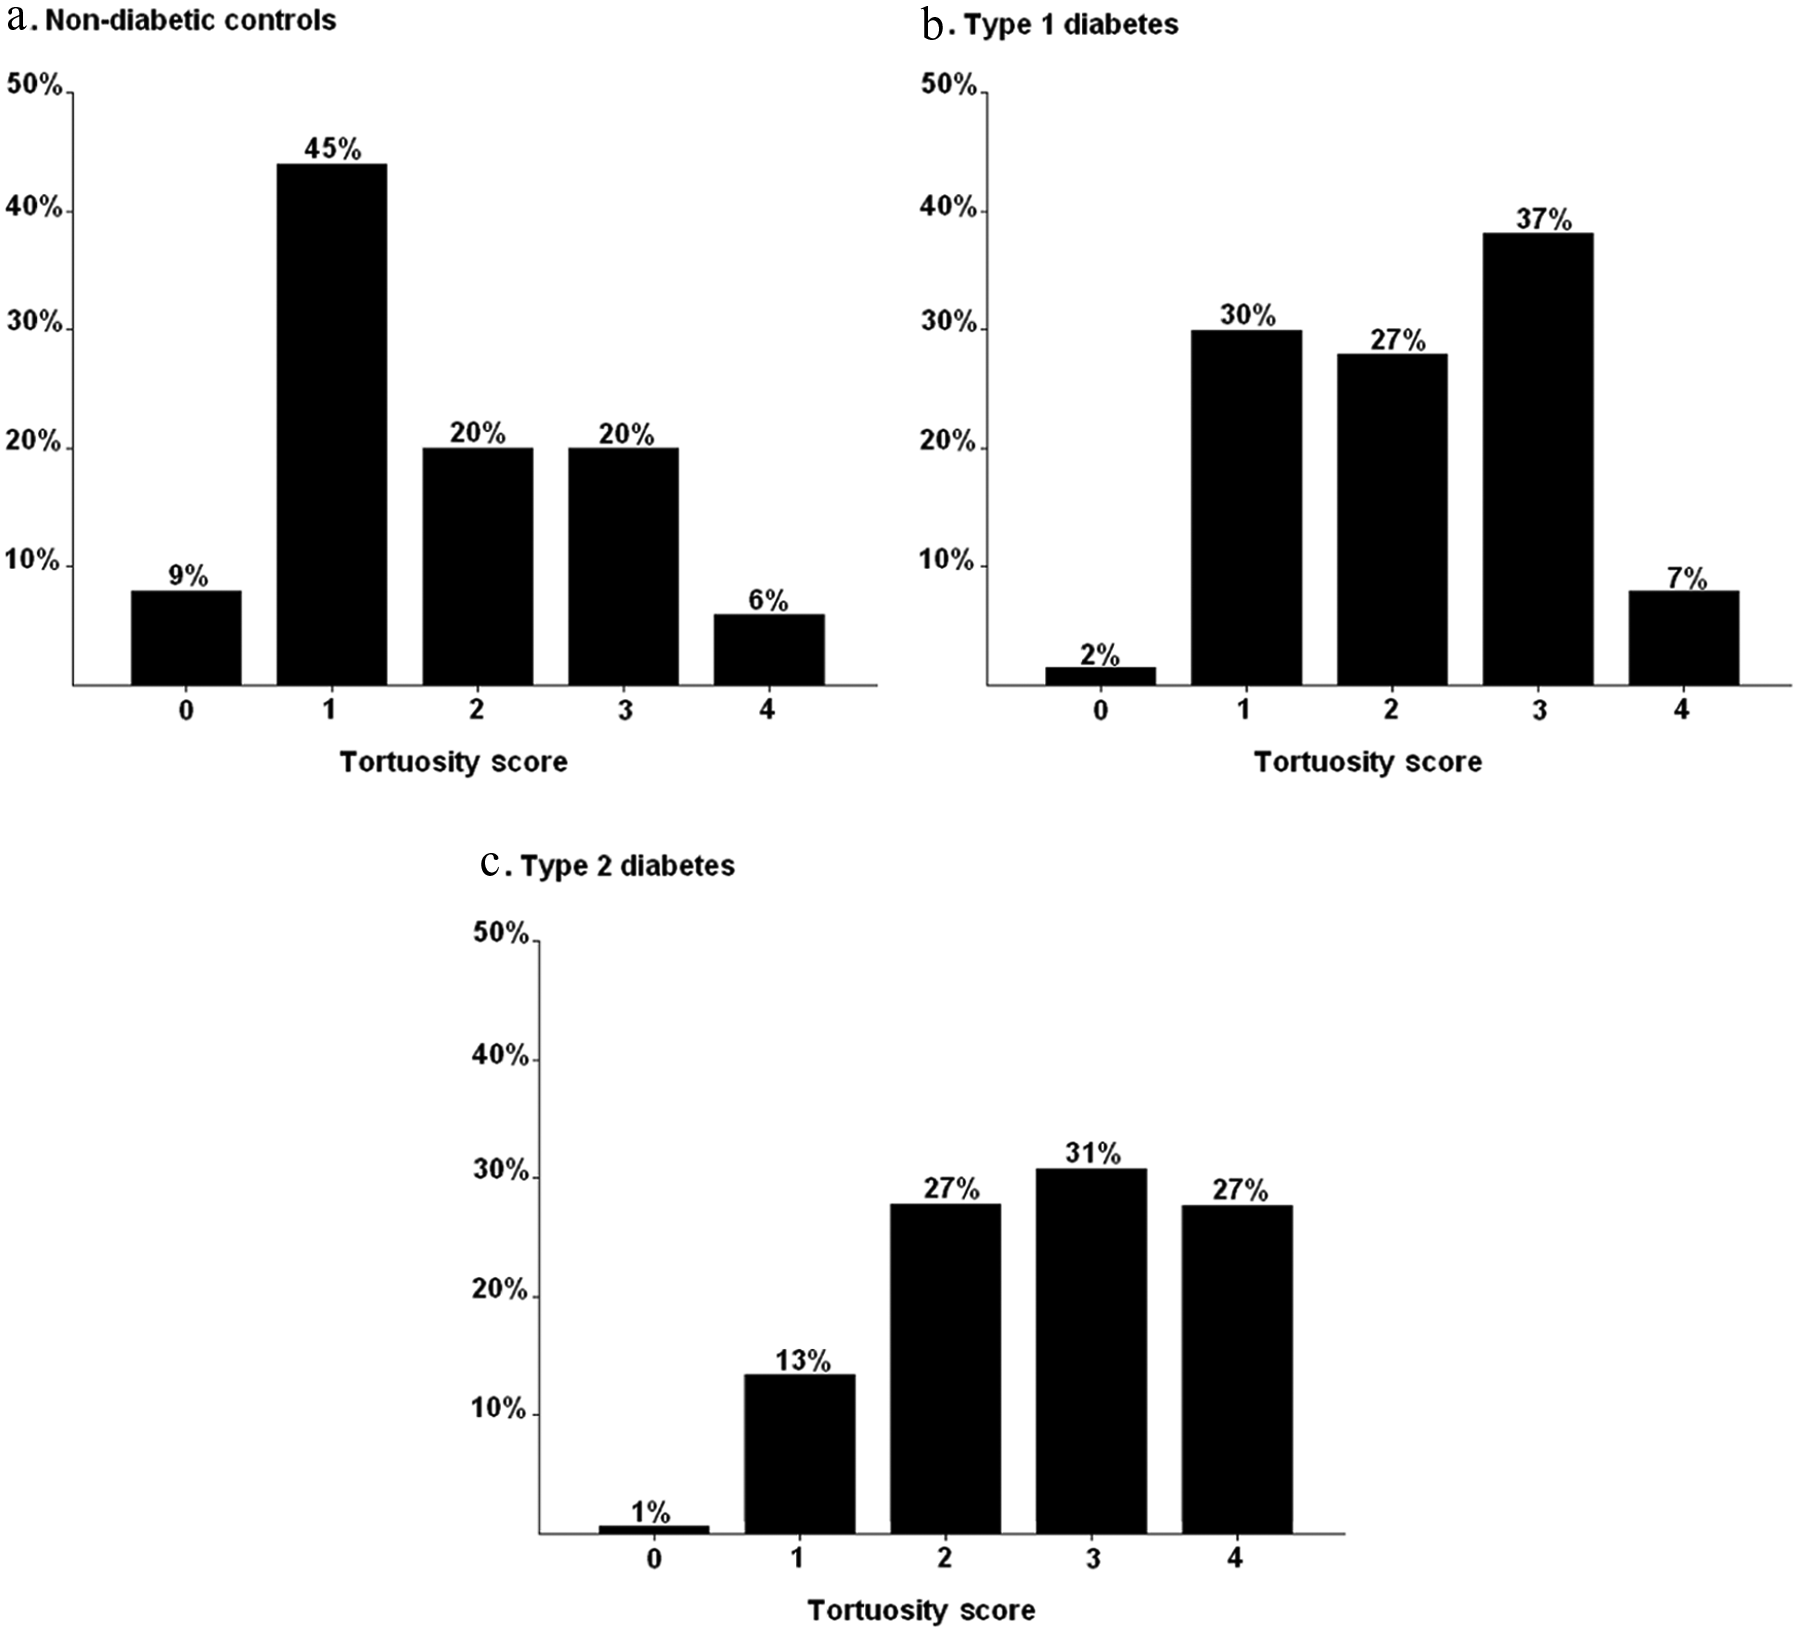
Distribution of patients according to capillary tortuosity score. A lower tortuosity score was observed in non-diabetic controls (a). In type 1 diabetes, patients were rather evenly distributed among a tortuosity score of 1–3 (b). In comparison, in type 2 diabetes a larger proportion of patients were shown to have a relatively high tortuosity score (c).
Capillary tortuosity in type 2 diabetes
In contrast with non-diabetic controls, a minor proportion of patients with type 2 diabetes were stratified as having a low tortuosity score of 0 (1%) or 1 (13%) (Figure 3(c)), whereas a relatively large proportion of these patients had a high tortuosity score of 4 (27%). Indeed, after correction for age and other cardiovascular risk factors in a backward multiple linear regression model, the presence of type 2 diabetes (with non-diabetic controls as reference) was found to be a predictor of capillary tortuosity (Exp ß 0.5, 95% CI 0.2–0.8; p = 0.001).
CAD as assessed by MSCT in patients with diabetes
In the total sub-population of patients with diabetes, the mean CAC score was 213 ± 451. Overall, 39 (30%) patients with diabetes had an elevated CAC score of >100. Using MSCT angiography, presence of obstructive CAD (luminal narrowing ≥ 50%) was revealed in 31 (24%) patients with diabetes.
Relation of labial microvascular parameters with CAD in diabetes
The mean capillary density was higher in diabetic patients with a CAC score >100 (27 ± 4 per 0.63 mm2) as compared with those with a CAC score in the range 0–100 (25 ± 4 er 0.63 mm2) (p = 0.04) (Figure 4(a)). Similarly, after stratification according to MSCT angiography results, a higher mean capillary density was observed in diabetic patients with obstructive CAD (27 ± 4 per 0.63 mm2) than in those without obstructive CAD (25 ± 4 per 0.63 mm2) (p = 0.02) (Figure 4(b)).
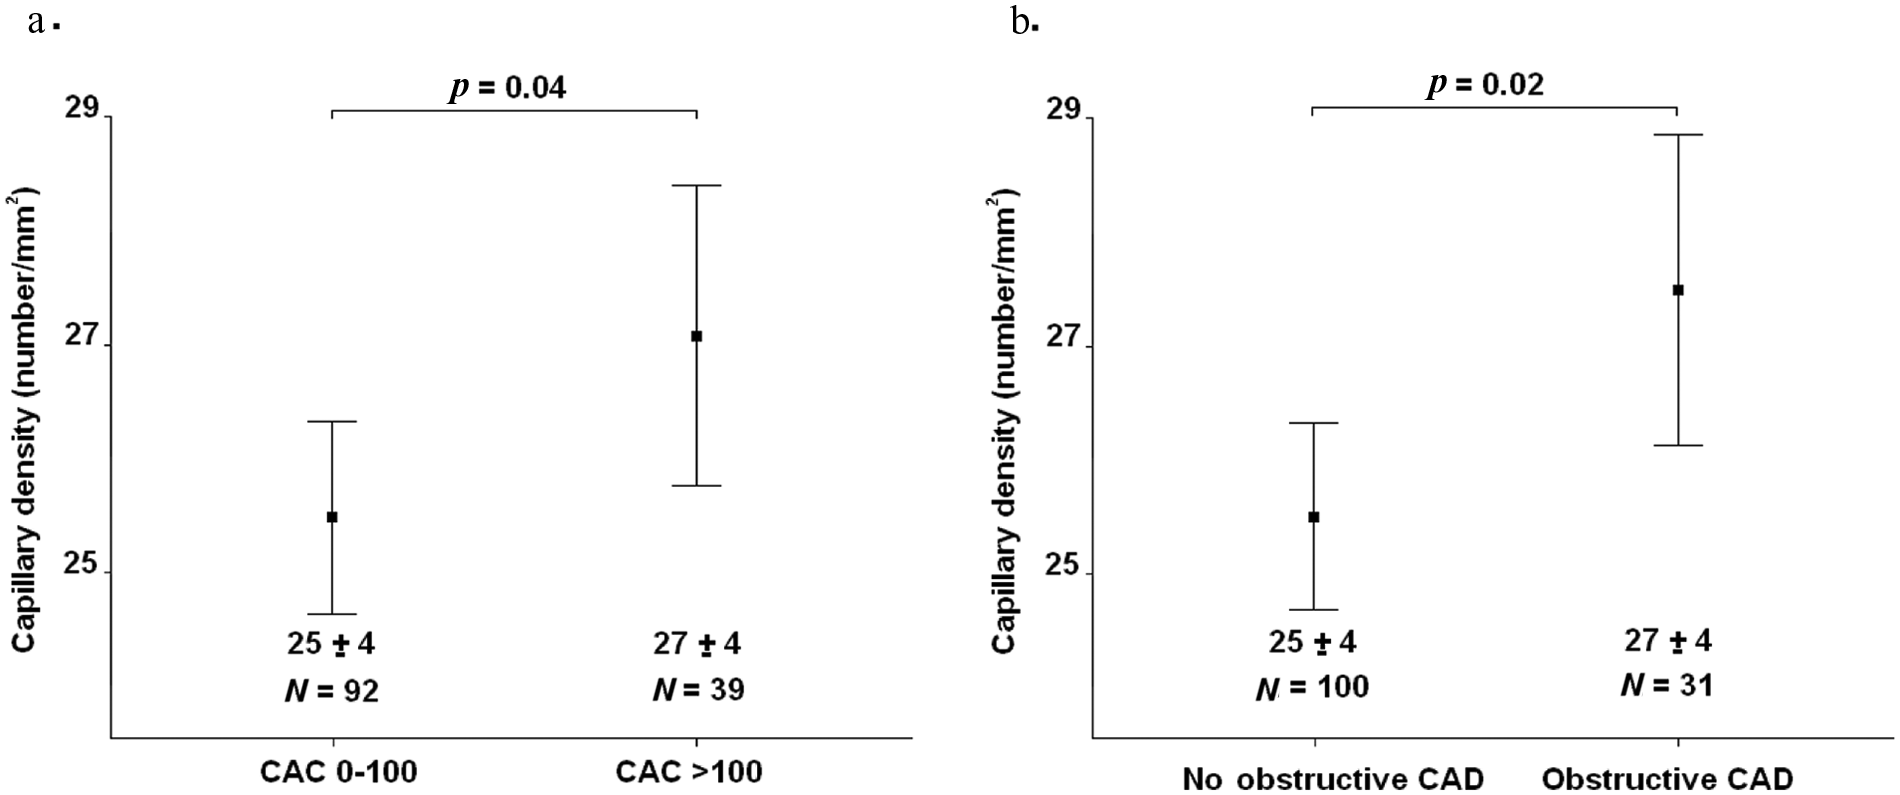
Relation of mean capillary density and coronary artery disease (CAD) in asymptomatic diabetic patients. Mean capillary density was higher in patients with an increased coronary artery calcium (CAC) score of >100 (a). Similarly, mean capillary density was higher in diabetic patients with obstructive CAD, as compared with those with no obstructive CAD (b).
As demonstrated in Figure 5(a), none of the diabetic patients with a tortuosity score of 0 (pinhead capillaries) had an elevated CAC score of >100. The prevalence of an elevated CAC score increased modestly to 11% and 14% with a tortuosity score of 1 and 2. The prevalence of an elevated CAC score increased further to 33% in those with a tortuosity score of 3. However, the most prominent increase in the prevalence of an elevated CAC score (74%) was observed in diabetic patients with highly tortuous capillaries (tortuosity score of 4).
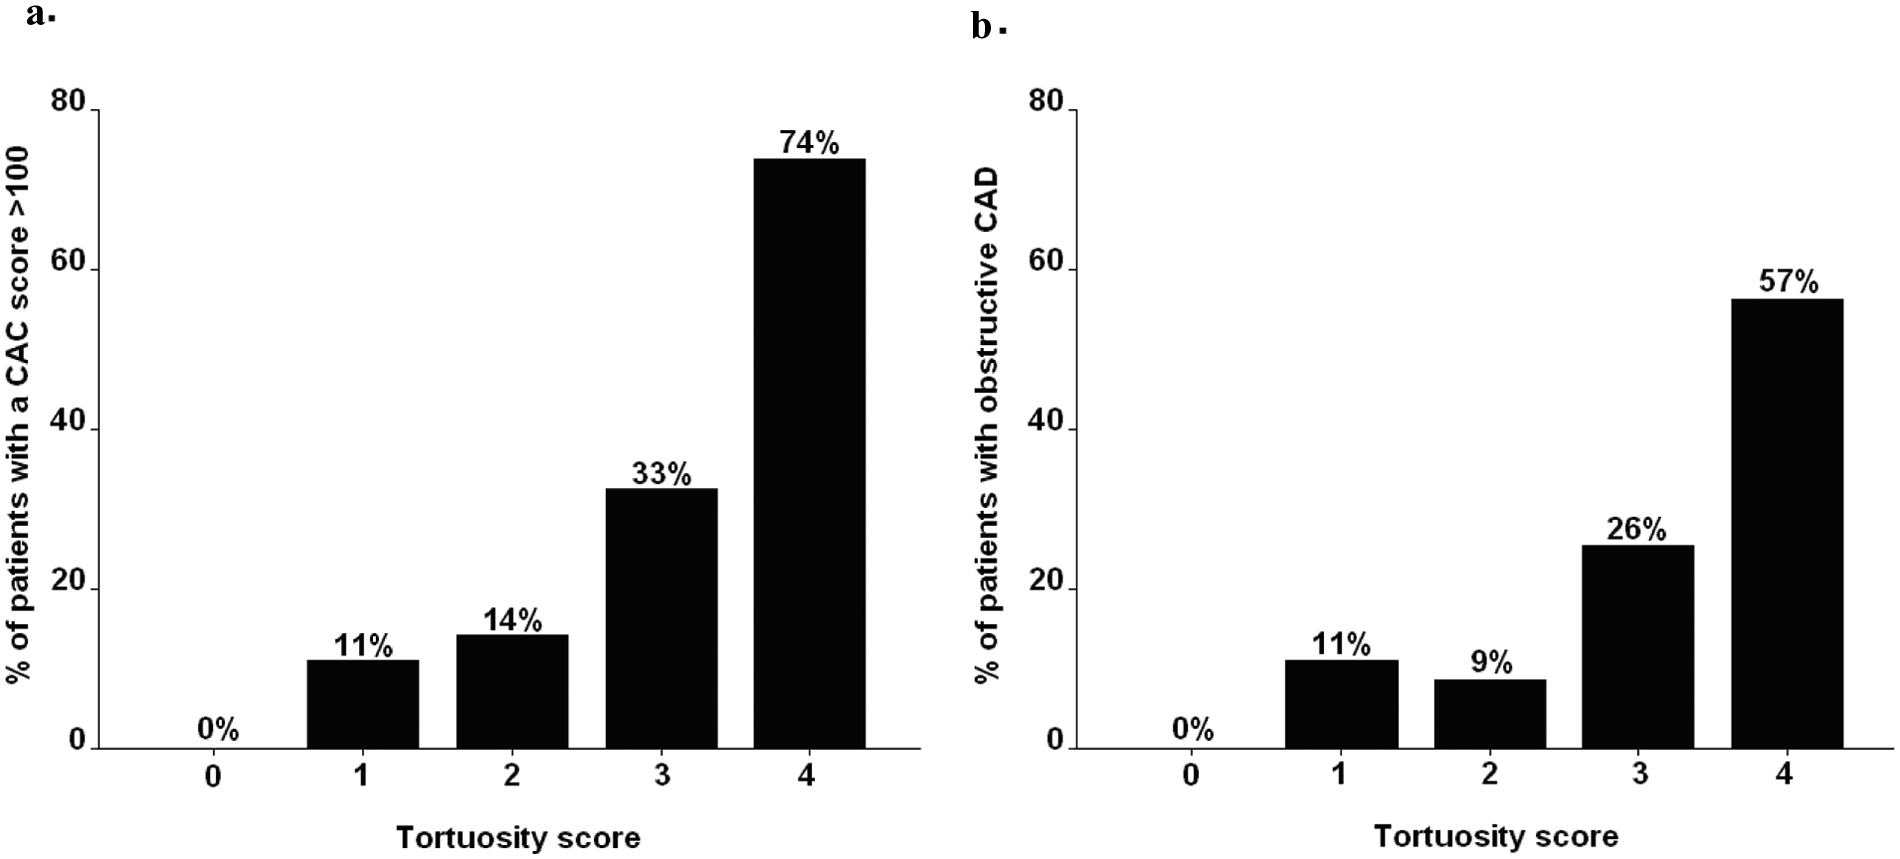
Relation of capillary tortuosity and coronary artery disease (CAD) in asymptomatic diabetic patients. Relatively low prevalence of increased coronary artery calcium (CAC) scores of >100 were observed in patients with low tortuosity scores. On the contrary, the majority of patients with a high tortuosity score of 4 were revealed to have an increased CAC score of >100 (a). A similar relation was observed between tortuosity score and the presence of obstructive CAD (b).
Likewise, a low tortuosity score of 0 excluded the presence of obstructive CAD in patients with diabetes (Figure 5(b)). A relatively low prevalence of obstructive CAD (11% and 9%) was observed in patients with a tortuosity score of 1 and 2. In contrast, the prevalence of obstructive CAD more than doubled (26%) in patients with a tortuosity score of 3. Importantly, a 57% majority of diabetic patients with a high tortuosity score of 4 were shown to have obstructive CAD.
Predictors of an elevated CAC score in diabetes
The results of binary logistic regression analysis for the evaluation of the risk factors associated with an elevated CAC score of >100 are provided in Table 2. Age, micro-albuminuria, hypercholesterolaemia, hypertension and both capillary density and tortuosity were identified as potential predictors of an elevated CAC score in patients with diabetes. Of note, after correction for other cardiovascular risk factors in a backward multiple logistic regression model, capillary density (Exp ß 1.2, 95% CI 1.0–1.4; p = 0.03) as well as capillary tortuosity (Exp ß 2.6, 95% CI 1.3–5.2; p = 0.01), were shown to maintain a significant association with the presence of elevated CAC.
Predictors of a coronary artery calcium score > 100 in patients with diabetes. Results of binary logistic regression analyses.
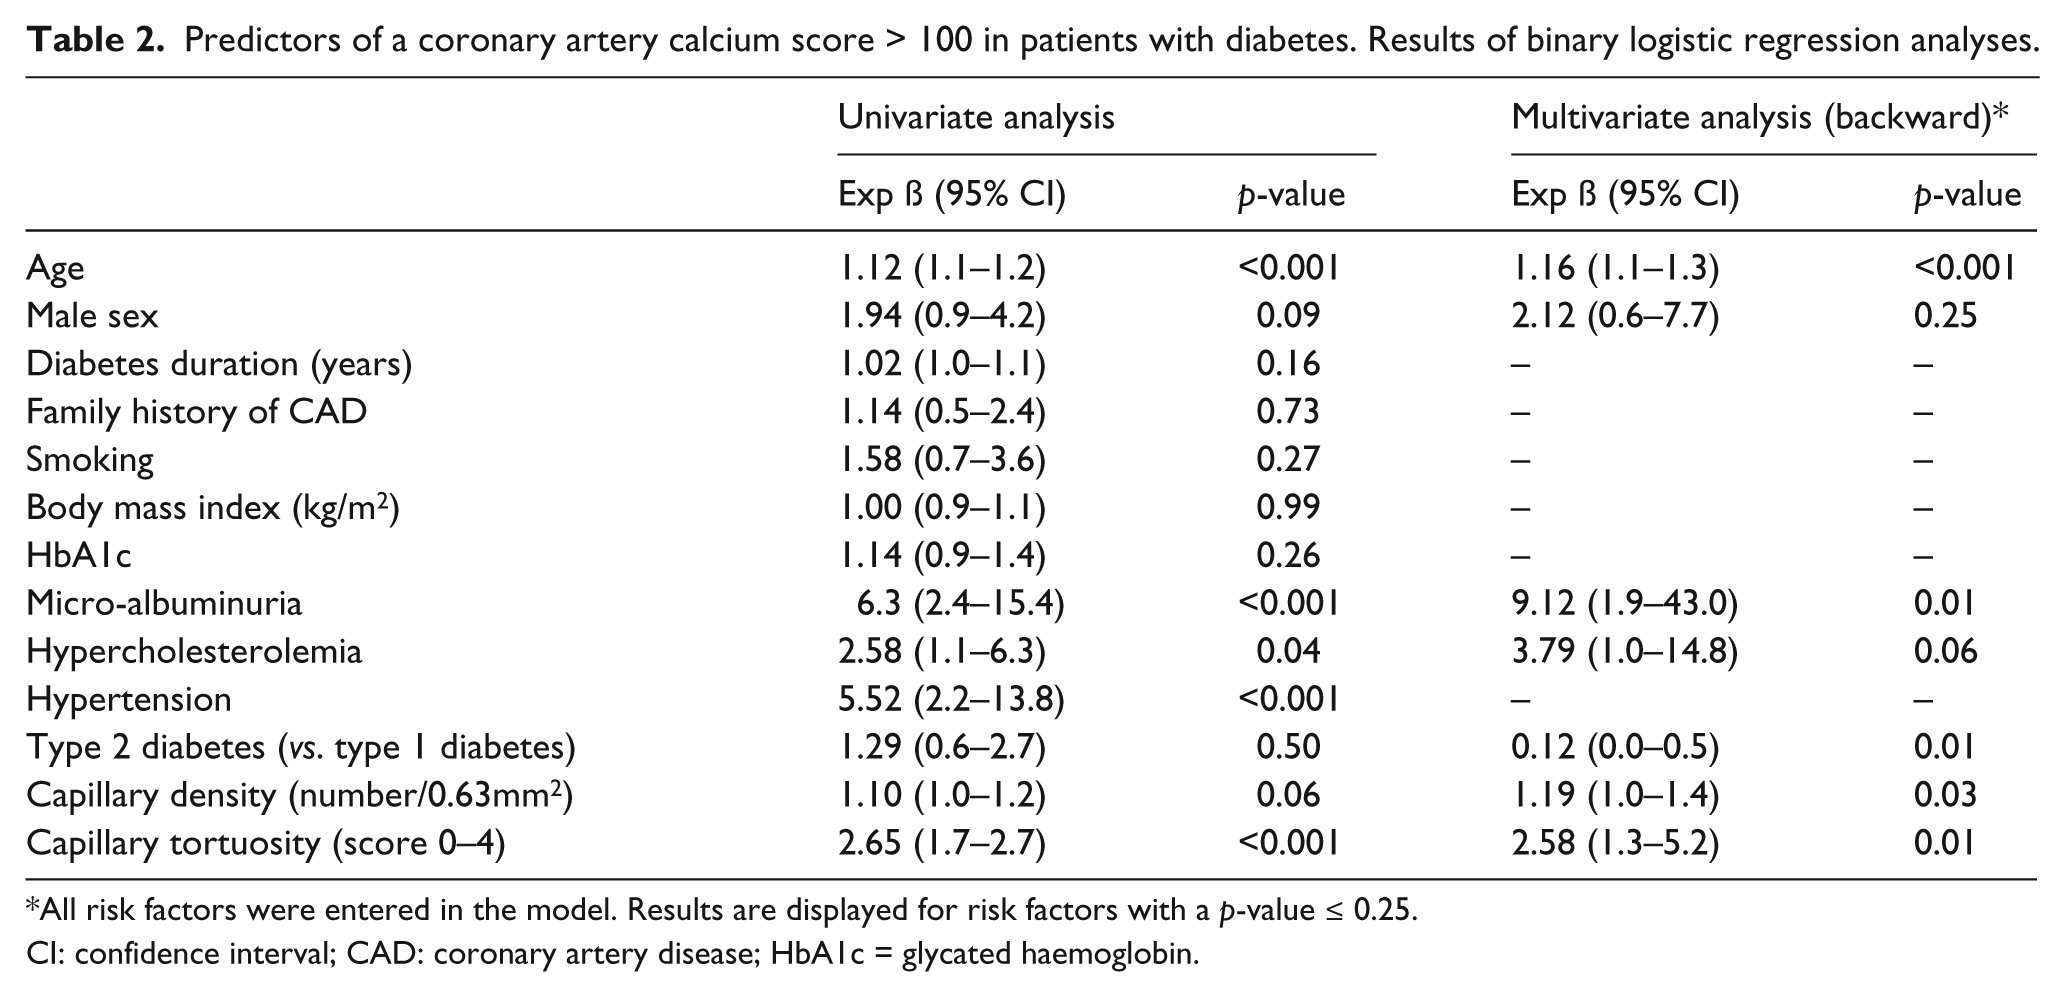
All risk factors were entered in the model. Results are displayed for risk factors with a p-value ≤ 0.25.
CI: confidence interval; CAD: coronary artery disease; HbA1c = glycated haemoglobin.
Using receiver operating characteristic (ROC) analysis a cut-off value of 24.9 per 0.63 mm2 was identified for capillary density. This cut-off value yielded a negative- and positive predictive value of, respectively, 84% and 39% for predicting a CAC score >100. Of note, the positive predictive value improved from 39% to 66% in the presence of a high tortuosity score of 4 besides a capillary density of ≥ 24.9 per mm2.
Predictors of obstructive CAD in diabetes
As illustrated in Table 3, age, micro-albuminuria, hypertension, capillary density and capillary tortuosity were found to be associated with obstructive CAD in patients with diabetes. Notably, analysis in a multivariate binary logistic model showed capillary density (Exp ß 1.3, 95% CI 1.1–1.5; p = 0.01) and capillary tortuosity (Exp ß 1.9, 95% CI 1.0–3.6; p = 0.04) to be independently associated with the presence of obstructive CAD (Table 3).
Predictors of obstructive coronary artery disease (CAD) in patients with diabetes. Results of binary logistic regression analyses.
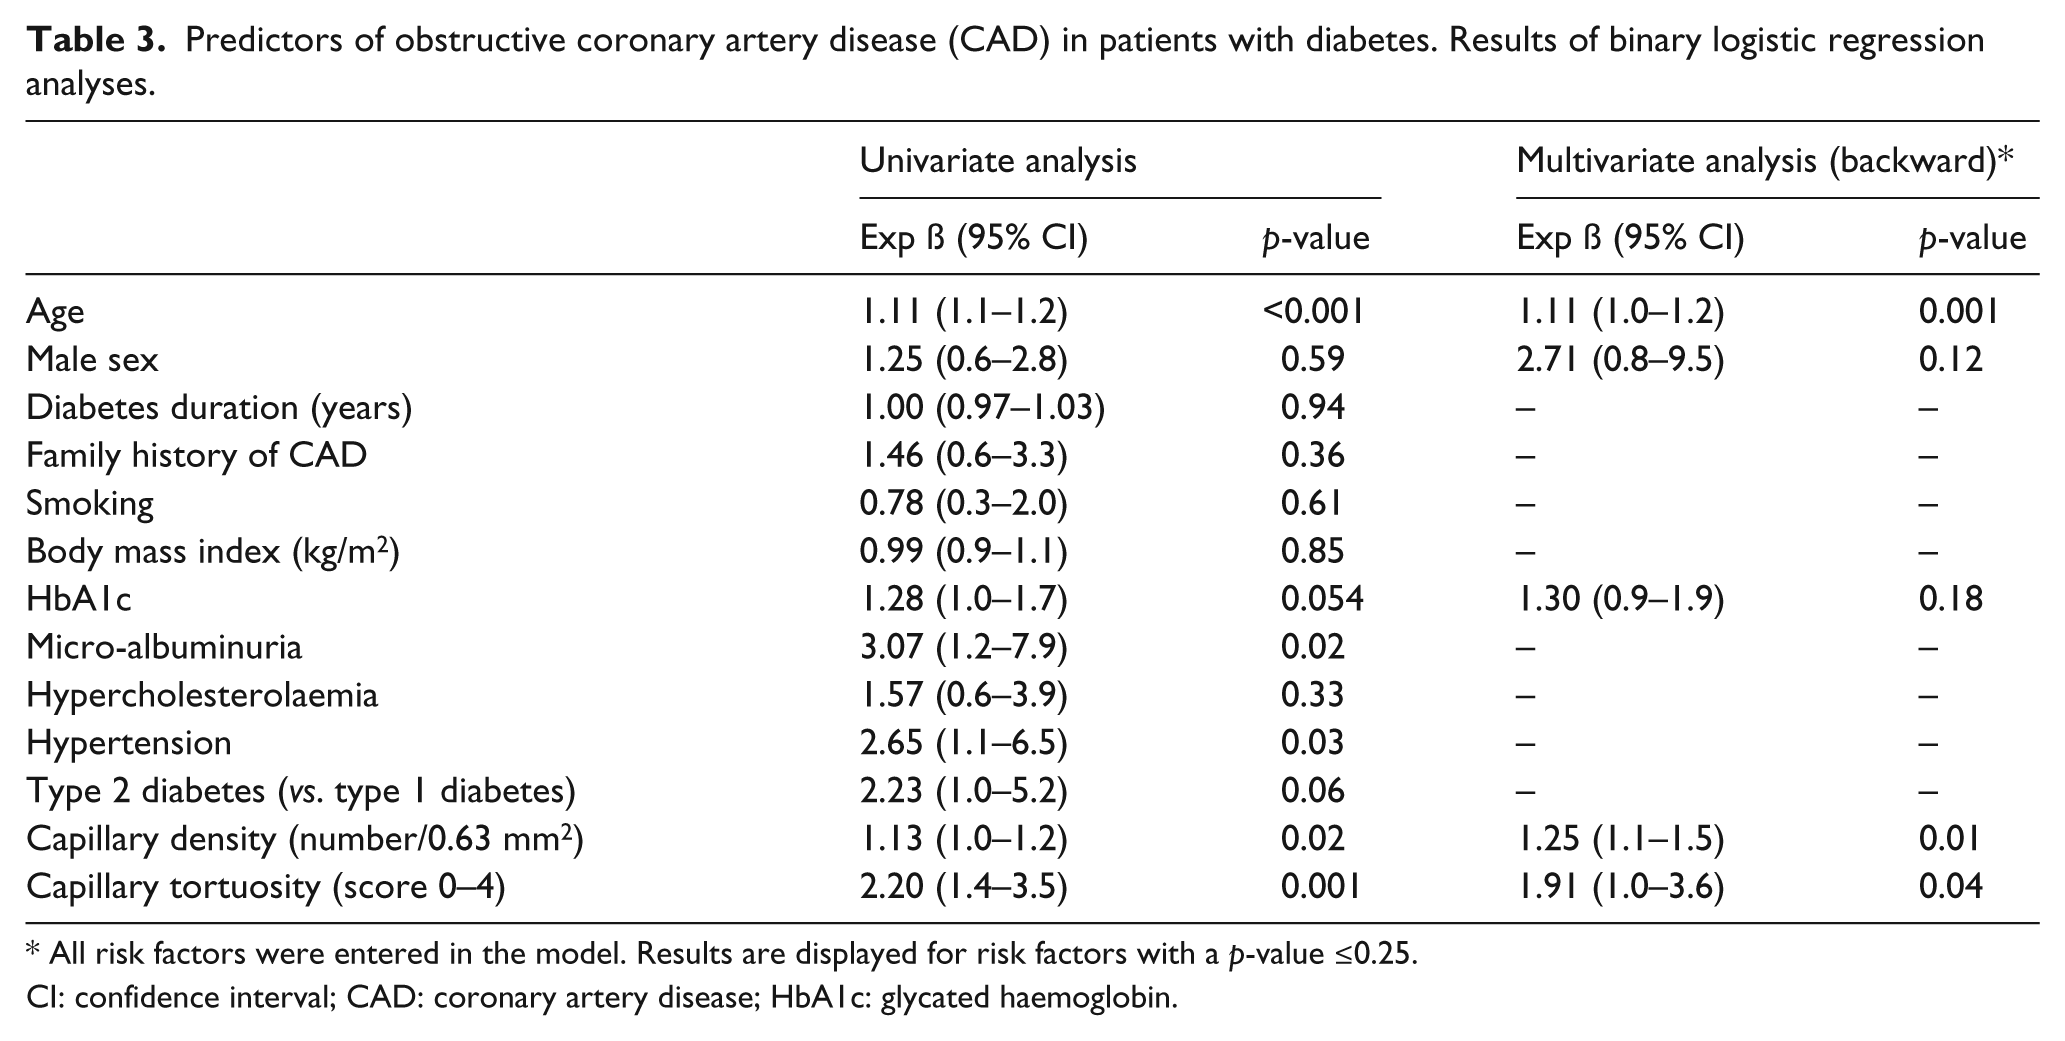
All risk factors were entered in the model. Results are displayed for risk factors with a p-value ≤0.25.
CI: confidence interval; CAD: coronary artery disease; HbA1c: glycated haemoglobin.
Using a cut-off value of 24.9 per 0.63 mm2 for capillary density yielded a negative- and positive predictive value of, respectively, 89% and 32% for predicting obstructive CAD in diabetes. The positive predictive value improved from 32% to 60% in the presence of a high tortuosity score of 4 in addition to a capillary density of ≥ 24.9 per mm2.
Video clip examples of labial microcirculation as assessed by SDF are provided in the Supplementary Files. Supplementary File 1 shows an example of the well ordered labial capillaries in the healthy. In comparison, the more tortuous and malformed capillaries often observed in diabetic patients with CAD are shown in Supplementary Files 2 and 3.
Discussion
The main findings of the current study were as follows: first, the interobserver (regression coefficients per observer 0.75 and 0.72) and intraobserver (regression coefficients per observer 0.80 and 0.72) values for the assessment of capillary density using SDF imaging were reasonable. Similarly, a good interobserver (agreement per observer 88%) and intraobserver (agreement per observer 90% and 88%) agreement was found for the assessment of capillary tortuosity using SDF imaging. Secondly, after correction for age, gender and other cardiovascular risk factors, the presence of both type 1 and type 2 diabetes was found to be associated with an increased capillary density and tortuosity. Most importantly, in the sub-population of asymptomatic patients with diabetes, the mean labial capillary density was significantly higher in the presence of an increased CAC of >100 (p = 0.04) and in obstructive CAD (p = 0.02). Moreover, after correction for other cardiovascular risk factors, mean capillary density was shown to be an independent predictor of increased CAC (p = 0.03) and obstructive CAD (p = 0.01), in diabetes. Likewise, the prevalence of increased CAC and obstructive CAD increased with capillary tortuosity. Indeed, the capillary tortuosity score was also found to be an independent predictor of increased CAC (p = 0.01) and obstructive CAD (p = 0.04) on MSCT of asymptomatic patients with diabetes.
Assessment of microcirculation by SDF
Past studies of vital microcirculation were restricted to the use of contrast microscopy and laser Doppler. Non-invasive imaging of the superficial skin and mucous microcirculation was initially implemented using the OPS device. 10 In OPS imaging the tissue embedding the microcirculation is illuminated with polarised green light. Illuminated light is absorbed by the haemoglobin in erythrocytes flowing through the tissue under investigation. As a result, the haemoglobin is used as the contrast agent, so that erythrocytes are imaged as dark globules in motion, against a white background. Consequently, the intravascular erythrocytes of perfused microvessels, rather than the microvessel walls, are visualised. The imaging technique has been further modified in the SDF device to provide better visualisation of the microcirculation at capillary level. 15 In SDF, stroboscopic imaging partially prevents smearing of moving features such as the flowing red blood cells due to short illumination intervals. The microcirculatory image is more restricted from contamination by tissue surface reflection. Also, as compared with OPS, imaging by SDF has a shallower focusing depth. Therefore, the structures underlying the microcirculatory image field interfere to a lower extent.
The OPS and SDF imaging devices have been previously validated10,16,17 and used to assess the functional anatomy of the sublingual, and nail fold microcirculation in critical care, and in patients with heart failure, sepsis and rheumatic diseases.12,13 In the present study the assessment of the quantity (capillary density) and structure (tortuosity) of the labial capillaries using SDF was validated. Evaluation of the labial microvascular network in non-diabetic controls and patients with diabetes showed the capillary density and tortuosity to increase with the presence of diabetes. The increased labial capillary density and tortuosity may be a marker of microvascular disease.
Microvascular disease in diabetes
In diabetes, abnormal microvascular patterns have been described in nephropathy, retinopathy and the myocardial capillaries.18,19 Early morphological changes in the kidney of humans and animals with diabetic nephropathy include an increase in the number of glomerular capillaries as well as elongation and intermittent dilation and occlusion of the microvessels.20–23 Alternatively, diabetic retinopathy can be classified as the early non-proliferative stage with microaneurysms and haemorrhages, or the later proliferative stage with formation of neovessels. 24 Furthermore, a study showed increased tortuosity of retinal vessels in presence of gestational diabetes. 25 Less information is available on the architecture of the myocardial microvessels in humans. However, in animal models, higher spatial capillary density and tortuosity have been observed in the myocardium in the presence of diabetes.26,27
Various mechanisms have been proposed for the distortion of the microvascular network and the subsequent microvascular complications in patients with diabetes.28,29 Hyperglycaemia is shown to promote exposure of endothelial cells to advanced glycation end products (AGEs), resulting in protein kinase C activation, abnormal endothelial nitric oxide synthase expression and induction of angiotensin-2 and vascular endothelial growth factor (VEGF).30–32 Experimental studies suggest that VEGF may in turn stimulate the expression of adhesion molecules by endothelial cells and promote vascular inflammation, causing more adverse endothelial perturbations.33,34 The overall molecular and functional changes result in the final sequelae of increased permeability of the microvessels and finally ischaemia that drives unregulated angiogenesis.
Relation of microvascular disease and CAD
Micro- and macrovascular complications of diabetes share a number of pathogenic mechanisms.8,30 Primarily, both processes include components of endothelial dysfunction and inflammation.35,36 In addition, hypoxia-induced angiogenesis is also increased in the vasa vasorum of the coronary arteries of patients with diabetes. 36 The corresponding neovasculature microangiopathy is suggested to accelerate atherosclerosis and predispose plaque rupture. 36 Thus, microvascular disease and CAD may be interconnected, with microvascular disease prompting atherosclerosis through hypoxia and changes in the vasa vasorum.
Accordingly, the majority of follow-up studies in patients with diabetes have found the presence of microvascular disease to increase risk of CAD irrespective of traditional cardiovascular risk factors.5–7 During five years’ follow-up, Gall and colleagues found albuminuria to be a strong predictor cardiovascular mortality in patients with type 2 diabetes (hazard ratio (HR) 2.5 (1.1–5.8)). 5 Similarly, in the EURODIAB Prospective Cohort Study of 2787 patients with type 1 diabetes, both albuminuria and peripheral neuropathy were shown to predict cardiovascular mortality, whereas retinopathy did not. 7 In contrast, in the Atherosclerosis Risk in Communities Study of patients with type 2 diabetes, the presence of diabetic retinopathy was found to be associated with a twofold risk of incident CAD and a threefold risk of fatal CAD, during an average follow-up of 7.8 years. 6 In line with these findings, we found a significant and independent relation between the labial parameters of microvascular disease, consisting of the capillary density and tortuosity, with increased CAC and obstructive CAD in patients with diabetes. In particular, a low capillary density of < 24.9 per 0.63 mm2 yielded a good negative predictive value for an increased CAC (84%) and obstructive CAD (89%). Also, labial capillary tortuosity score of 0 to 2 was associated with a low prevalence of an increased CAC (0–14%) or obstructive CAD (0–11%). In contrast, in diabetic patients with a capillary tortuosity score of 4, a relatively high prevalence of increased CAC (74%) and obstructive CAD (57%) was observed.
Study limitations
A number of limitations must be acknowledged. First, the parameters of the microcirculation as assessed by SDF imaging only reflect characteristics of perfused capillaries. In the current study, influence of external factors on capillary recruitment was limited by standardising the study environment. Also, flow alterations in the microcirculation due to external pressure were prevented by minimising probe contact with the labial tissue during image acquisition. Herewith a good inter-session reproducibility of parameters of the microcirculation was observed in healthy non-diabetic controls. However, perfusion of capillaries may be less consistent in diabetes as a consequence of functional and morphological changes. Secondly, the relation of labial capillary density and tortuosity with CAD could not be verified in the non-diabetic control group. As MSCT coronary angiography is accompanied by radiation exposure, it is not feasible to perform a similar assessment in asymptomatic subjects free of cardiovascular risk. Finally, the analysis was restricted to evaluation of the association between labial capillary density and tortuosity as assessed by SDF with traditional risk factors, as well as with the presence of CAD. However, the proatherogenic process which relates these microvascular parameters with CAD was not investigated.
Conclusion and future perspectives
The assessment of labial capillary density and tortuosity as markers of microvascular disease is feasible and reproducible using the SDF imaging device. The labial capillary density and tortuosity increased with several traditional cardiovascular risk factors, micro-albuminuria and the presence of diabetes. A yet further increase in labial capillary density and tortuosity was observed in diabetic patients with CAD. Assessment of the labial microvascular parameters using the non-invasive SDF handheld device may convey the potential to estimate the degree of vascular morbidity in patients with diabetes at bedside.
Footnotes
Acknowledgements
We thank EJ de Lange for her organisational work.
Funding
This work was supported by Medtronic (Minneapolis, USA), Biotronik (Berlin, Germany), Boston Scientific (Natick, USA) (to JJB and JWJ), BMS medical imaging (North Billerica, Massachusetts, USA), St Jude Medical (St. Paul, Minnesota, USA), GE Healthcare (Buckinghamshire, UK) and Edwards Lifesciences (Irvine, California, USA) (to JJB), Astra Zeneca (London, UK), Pfizer (New York, USA) and MSD (New Jersey, USA) (to JWJ).
Conflicts of interest statement
The authors declare that there are no conflicts of interest.