
Abstract
Objective:
To evaluate regional calf muscle microcirculation in people with diabetes mellitus (DM) with and without foot ulcers, compared to healthy control people without DM, using contrast-free magnetic resonance imaging methods.
Methods:
Three groups of subjects were recruited: non-DM controls, DM, and DM with foot ulcers (DM + ulcer), all with ankle brachial index (ABI) > 0.9. Skeletal muscle blood flow (SMBF) and oxygen extraction fraction (SMOEF) in calf muscle were measured at rest and during a 5-min isometric ankle plantarflexion exercise. Subjects completed the Yale physical activity survey.
Results:
The exercise SMBF (ml/min/100 g) of the medial gastrocnemius muscle were progressively impaired: 63.7 ± 18.9 for controls, 42.9 ± 6.7 for DM, and 36.2 ± 6.2 for DM + ulcer, p < 0.001. Corresponding exercise SMOEF was the lowest in DM + ulcers (0.48 ± 0.09). Exercise SMBF in the soleus muscle was correlated moderately with the Yale physical activity survey (r = 0.39, p < 0.01).
Conclusions:
Contrast-free MR imaging identified progressively impaired regional microcirculation in medial gastrocnemius muscles of people with DM with and without foot ulcers. Exercise SMBF in the medial gastrocnemius muscle was the most sensitive index and was associated with HbA1c. Lower exercise SMBF in the soleus muscle was associated with lower Yale score.
Keywords
Introduction
Chronic, poorly controlled diabetes mellitus (DM) is associated with an acceleration in calf and foot fatty muscle atrophy. 1 Lower extremity muscle deterioration in diabetes has been linked to physical mobility impairment, disability, and risk of foot deformity related ulceration and amputation.2–6 DM associated motor neuropathy has often been the pathway examined in the mechanistic research examining strength and muscle performance deficits. On the other hand, DM is uniquely associated with diffuse microvascular dysfunction within the capillary beds that is present very early in the disease process.7,8 Previous research has identified muscle perfusion impairments in the upper extremity of people with DM during a hand grip exercise. 9 Impaired perfusion in lower extremities has also been observed in patients with DM, with and without foot complications, by utilizing several image modalities.10–15 Insufficient tissue perfusion may be a critical factor limiting muscle hypertrophy and regeneration in response to exercise and injury stimulus and over all muscle performance.
A new contrast-free MRI-based approach was recently developed to quantify skeletal muscle microcirculation, including skeletal muscle blood flow (SMBF) and oxygen extraction fraction (SMOEF, i.e. the ratio of the oxygen removed from the blood by tissue within the capillary network). This unique approach has been studied in a very limited number of healthy volunteers and patients with DM using an exercise protocol within MRI systems, with moderate reproducibility (coefficient of variation was approximately 14%) for SMBF and SMOEF measured in the gastrocnemius muscle.16,17 MR measures of SMBF and SMOEF are muscle specific, providing local indications of microvascular deficits, an improvement over the standard and common macrovascular assessment, that is, the ankle brachial index (ABI) and/or toe brachial index (TBI). In addition, SMBF and SMOEF measures are taken at rest and with isometric exercise. This provides insight into the capacity of the vascular system to respond to an exercise stimulus, a potential factor that can limit physical activity in people with DM.
In this study we extended our previous studies to compare exercise associated increases in SMBF and SMOEF in calf muscle of control people without DM, people with DM, and people with DM and a foot ulcer. We hypothesized that the ability of the muscle to increase SMBF and SMOEF in response to an exercise stimulus would progressively worsen as DM disease complications increase. The contrast-free MRI would be able to differentiate these changes in the microcirculation of calf muscles of these people. Furthermore, physical daily activity level would be associated with calf muscle regional microcirculation in people with DM.
Methods
Subjects
The study protocol was approved by the Human Research Protection Office and all subjects provided written informed consent. To evaluate the impact of DM on local SMBF and SMOEF, 48 adult subjects (⩾18 years old) were prospectively recruited. The potential participants were first contacted by phone and the participants were further screened for study inclusion/exclusion criteria. Participant were then enrolled in the study if they met the enrollment criteria and were able and willing to participate in the study. Three groups of participants were recruited: (1) 16 non-DM control subjects (control), (2) 16 subjects with DM (DM), and (3) 16 subjects with DM and foot ulcers (DM + ulcer), for a total of 48 subjects. A power analysis was performed prior to this study. To help maintain an alpha (criterion for significance) of 0.05 for multiple comparisons, a familywise error rate of 0.005 was used. For our sample-size calculation, we used the means and standard deviations for SMOEF change in the soleus muscles in healthy volunteers. 16 With a total sample size of 42, we would have a power of 94% to yield a statistically significant result.
The control group had no symptomatology or documented evidence of DM, peripheral neuropathy, or underlying peripheral arterial disease (PAD). ABIs, TBIs, and arterial waveforms of patients were all evaluated as a clinical tool for the evaluation of PAD. Control participants were non-smokers without cardiovascular, metabolic, and/or musculoskeletal diseases. The DM and DM + ulcer groups had type 2 DM, ABI > 0.9, with no history of PAD. The DM + ulcer group had at least one ulcer below the malleoli within the last 12 months. The ulcer could be healed or unhealed at the time of testing. Exclusion criteria were ischemic rest pain (consistent with critical limb threatening ischemia), contraindications to MR scanning (intracranial vascular clips, pacemaker, or intraocular metal), use of oral nitroglycerin, pregnancy, and comorbidities that severely limited the patient’s ability to perform a modest calf-contraction test. Table 1 lists the demographics of these subjects.
Subject characteristics of demographics, clinical indexes (ABI and Yale score), risk factors, and medical history.
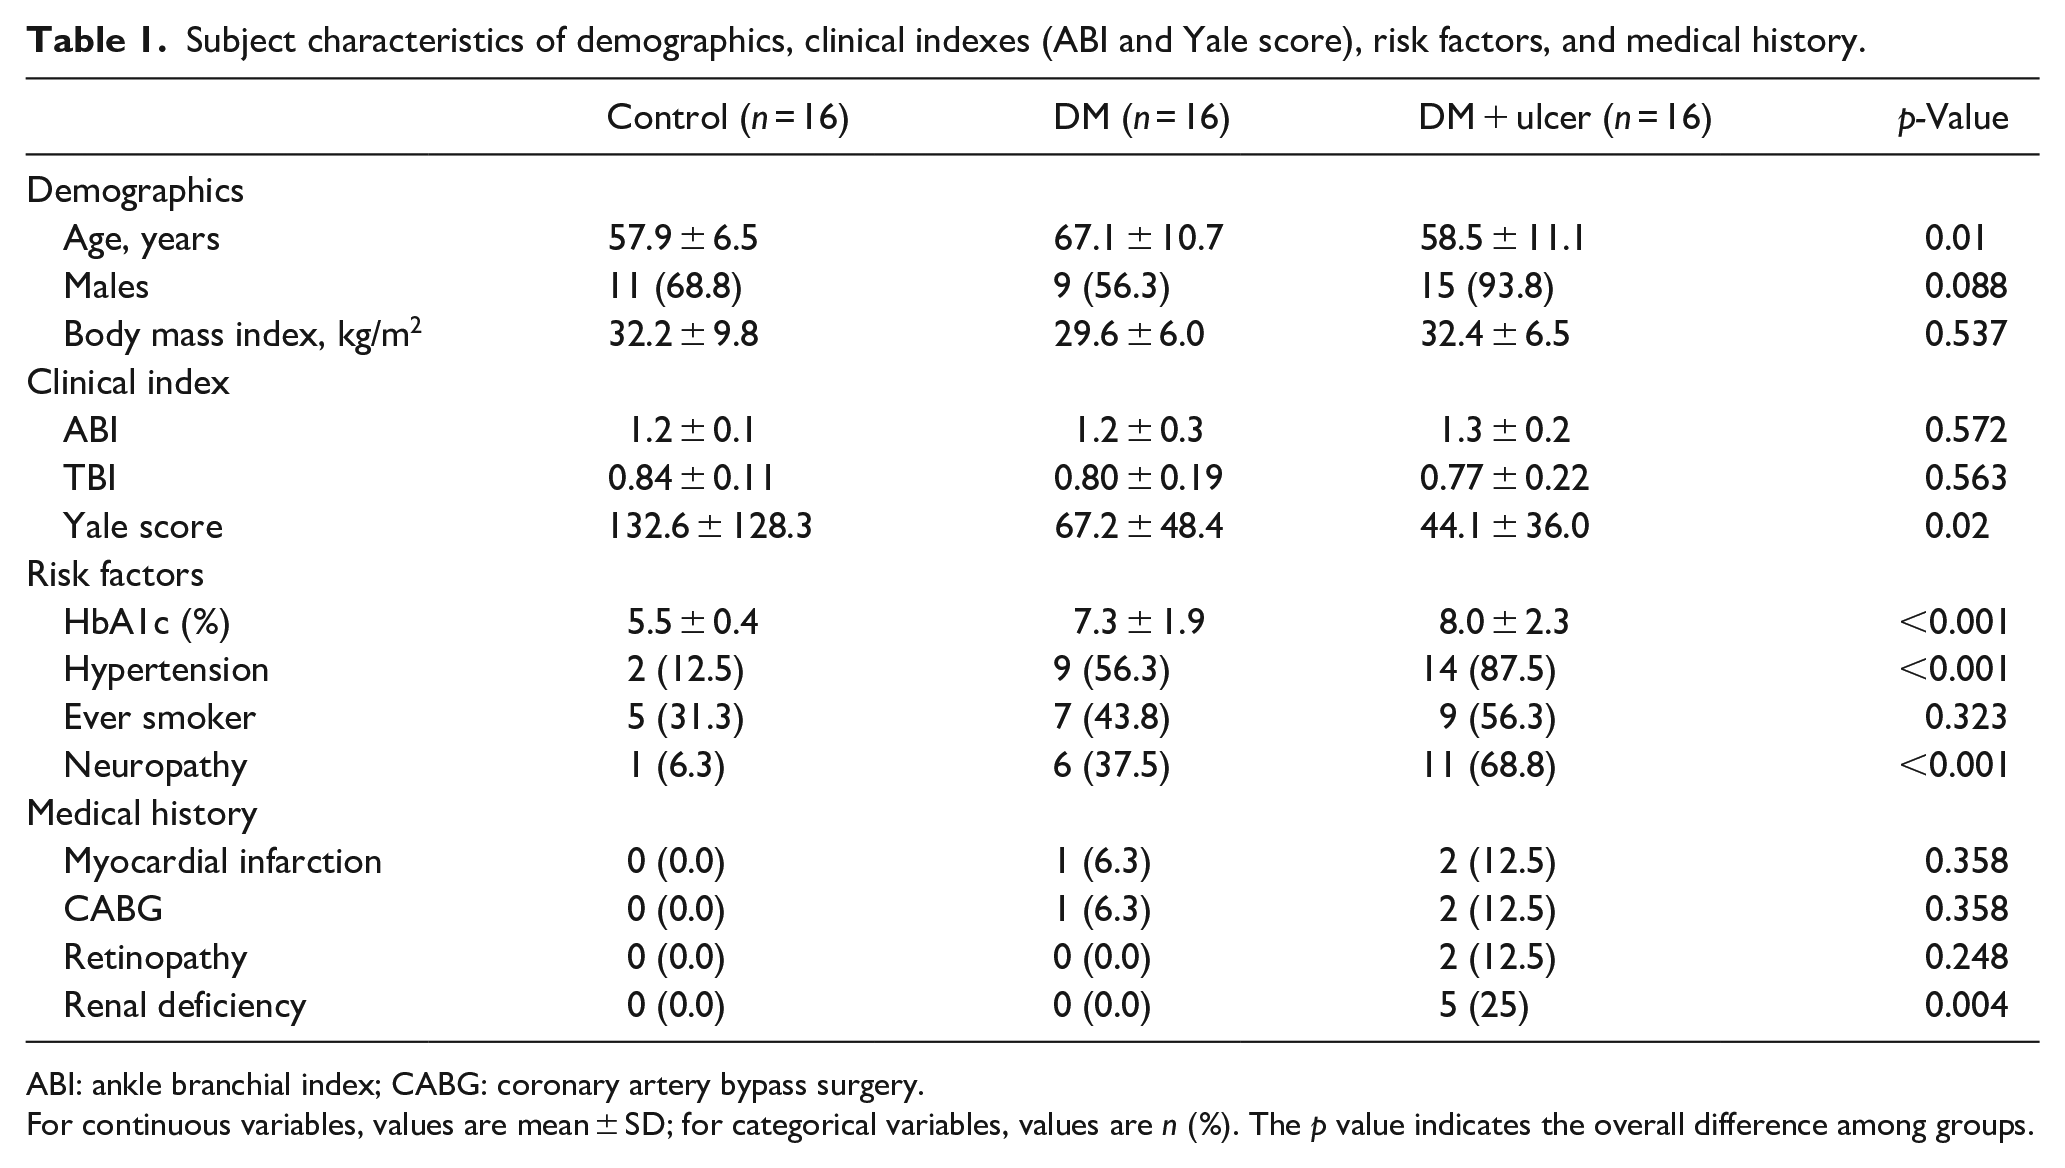
ABI: ankle branchial index; CABG: coronary artery bypass surgery.
For continuous variables, values are mean ± SD; for categorical variables, values are n (%). The p value indicates the overall difference among groups.
The medical history of study subjects were collected verbally and included information regarding age, smoking status, diabetes related retinopathy, renal deficiency, myocardial infarction, coronary artery bypass surgery, and peripheral arterial disease. Neuropathy was determined as present if a participant was unable to feel the 5.07 Semmes-Weinstein monofilament on at least 1 of 6 non-callused locations on the plantar surface of the foot (heel, metatarsal head 1, 3, and 5, or pad of the first or fifth toes) or vibration perception threshold ⩾25 Volts using a biothesiometery.
MRI perfusion and oxygenation measurements
Calf SMBF was measured using a contrast-free arterial spin labeling (ASL) method without injecting any contrast agent.18–21 The sequence parameters were: single-shot, gradient-echo acquisition, TR/TE = 5.3 ms/2.5 ms; fat saturation; flip angle = 5°; field of view (FOV) = 200 × 150 mm2; matrix = 128 × 96; slice thickness = 8 mm; average number = 4; total acquisition time = 75 s. The validity of similar method was demonstrated in the heart muscle. 22
Calf SMOEF was measured with another contrast-free MR technique derived from a model to measure tissue OEF with the magnetic susceptibility effect of deoxyhemoglobin.23–25 A multi-slice, 2D, triple-echo, asymmetric spin-echo sequence was employed to acquire images with TE1/TE2/TE3 = 44/79.6/114.8 ms. Other imaging parameters included: TR = 4 s; fat saturation; FOV = 200 × 150 mm2; matrix size = 64 × 48 and interpolated to 128 × 96; slice thickness = 8 mm; average number = 1; total acquisition time = 3 min 48 s. Previous results of SMOEF in volunteers without DM or PAD agreed well with findings in published studies that used positron emission tomography (PET) techniques. 26
All imaging sessions were performed on a 3T Prisma Siemens whole-body MR system (Siemens Healthcare, Malvern, PA). A commercial flexible surface coil (receive-only) was used for calf imaging. A custom-made ergometer was used in this study for the isometric plantarflexion contraction, with details described previously. 9 All data acquisitions were obtained in one slice at the mid-calf level with maximal girth visually. The subjects were instructed to push against the foot pedal plantarflexing the ankle to the preset 30° stop. The subjects held the position for 5 min. The resistance of the pedal was set to 10 psi to allow all participants to hold the contraction for the duration of the scan and to perform the exercise without complaints of pain. Subjects were given a 5-min rest between two consecutive exercises for separate measurements of exercise SMOEF and SMBF.
ABI, TBI tests, and physical activity questionnaire
All subjects completed ABI tests through comparing arm (brachial) systolic blood pressure to Doppler measured blood pressure at the dorsalis pedis artery on the dorsum of the foot (ABI). To measure TBI, a photoplethysmography (PPG) was applied to the largest toe available (usually the great toe). If there was a waveform detected in PPG, a toe blood pressure cuff (2–2.5 cm width) was placed on the toe proximal to the PPG sensor and inflated until the waveform disappeared. The cuff was then released slowly until the PPG waveform returned. Beginning of the very first waveform corresponded to the toe systolic pressure in that toe. TBI was then calculated by dividing the toe systolic pressure by the arm systolic pressure. Physical activity, as assessed with the Yale Physical Activity Survey in all subjects, except one subject in the DM + ulcer group. This survey estimates physical activity across a wide range of intensities and settings (i.e. household, recreational, and community) and is specific to older adults. 27
Image analysis
The source images from both SMBF and SMOEF measurements were processed using custom-made software written in Matlab (R2018b version, The MathWorks,Natick, MA) to create SMBF and SMOEF maps, respectively. An analyst with 2-years of experience, blinded to the individual group, first drew two regions-of-interest (ROIs) around the soleus and medial gastrocnemius (MG) muscle on one source image.28,29 The ROIs were then copied to both SMBF and SMOEF maps with manual adjustment of ROI locations if there were apparent shifts between rest and exercise maps. Data was expressed means ± standard deviations.
Statistical analysis
Analyzes were first focused on assessing differences and trends in exercise data sets among three groups of subjects in two major muscle groups (MG and soleus). Data distribution normality of continuous variables was first assessed with the Shapiro-Wilk W test, and a Levene’s test was used to determine whether the variances were equal. If neither of these required assumptions were violated, an analysis of variance was performed, with post-hoc testing being performed with the Tukey honestly significant difference test; otherwise, the non-parametric Kruskal-Wallis Rank Sums test was performed, with post-hoc comparisons being performed with the Steel-Dwass method. The Jonckheere-Terpstra trend test was used to test whether the medians of the three groups are ordered (increase or decrease). To address the effects of demographics and medical history on these differences, generalized regression analyzes were performed and adaptive elastic net was used as the estimation method (to fit better models by shrinking the model coefficients toward 0). 30
Additionally, we used correlation analysis to assess associations between MRI-index values (exercise SMBF and SMOEF in MG and soleus muscles) and values for clinical variables (age, BMI, ABI, Yale scores, and HbA1c) using combined data of control, DM, and DM+ulcer groups. If the data residuals were non-normally distributed, a Spearman’s coefficient of rank correlation (rho) was determined; otherwise, a product moment correlation coefficient (r) was determined. We reported only those correlations that passed our significance threshold.
All statistical analyzes were performed with JMP Pro Statistical Software (SAS Institute, Inc., Cary, NC), and MedCalc Statistics for Biomedical Research (MedCalc Software, Mariakerke, Belgium). A p-value <0.05 was considered statistically significant.
Results
Comparison of SMBF and SMOEF among control and DM subject groups
In general, there were no significant difference in ABI and TBI among controls and DM groups. Table 2 contains a summary of SMBF and SMOEF indexes for two major calf muscles (MG and soleus) for control, DM, and DM + ulcer groups. There were no differences in all resting indexes. All exercise indexes were significantly different among the three groups. Exercise SMBF and SMOEF in the MG and soleus muscles demonstrated a significantly downward trend from control, to DM, to DM + ulcer groups, as determined by the Jonckheere-Terpstra trend tests.
Assessments of differences in MR indexes (SMBF, SMOEF) among control and DM groups for different calf muscles (MG, soleus).
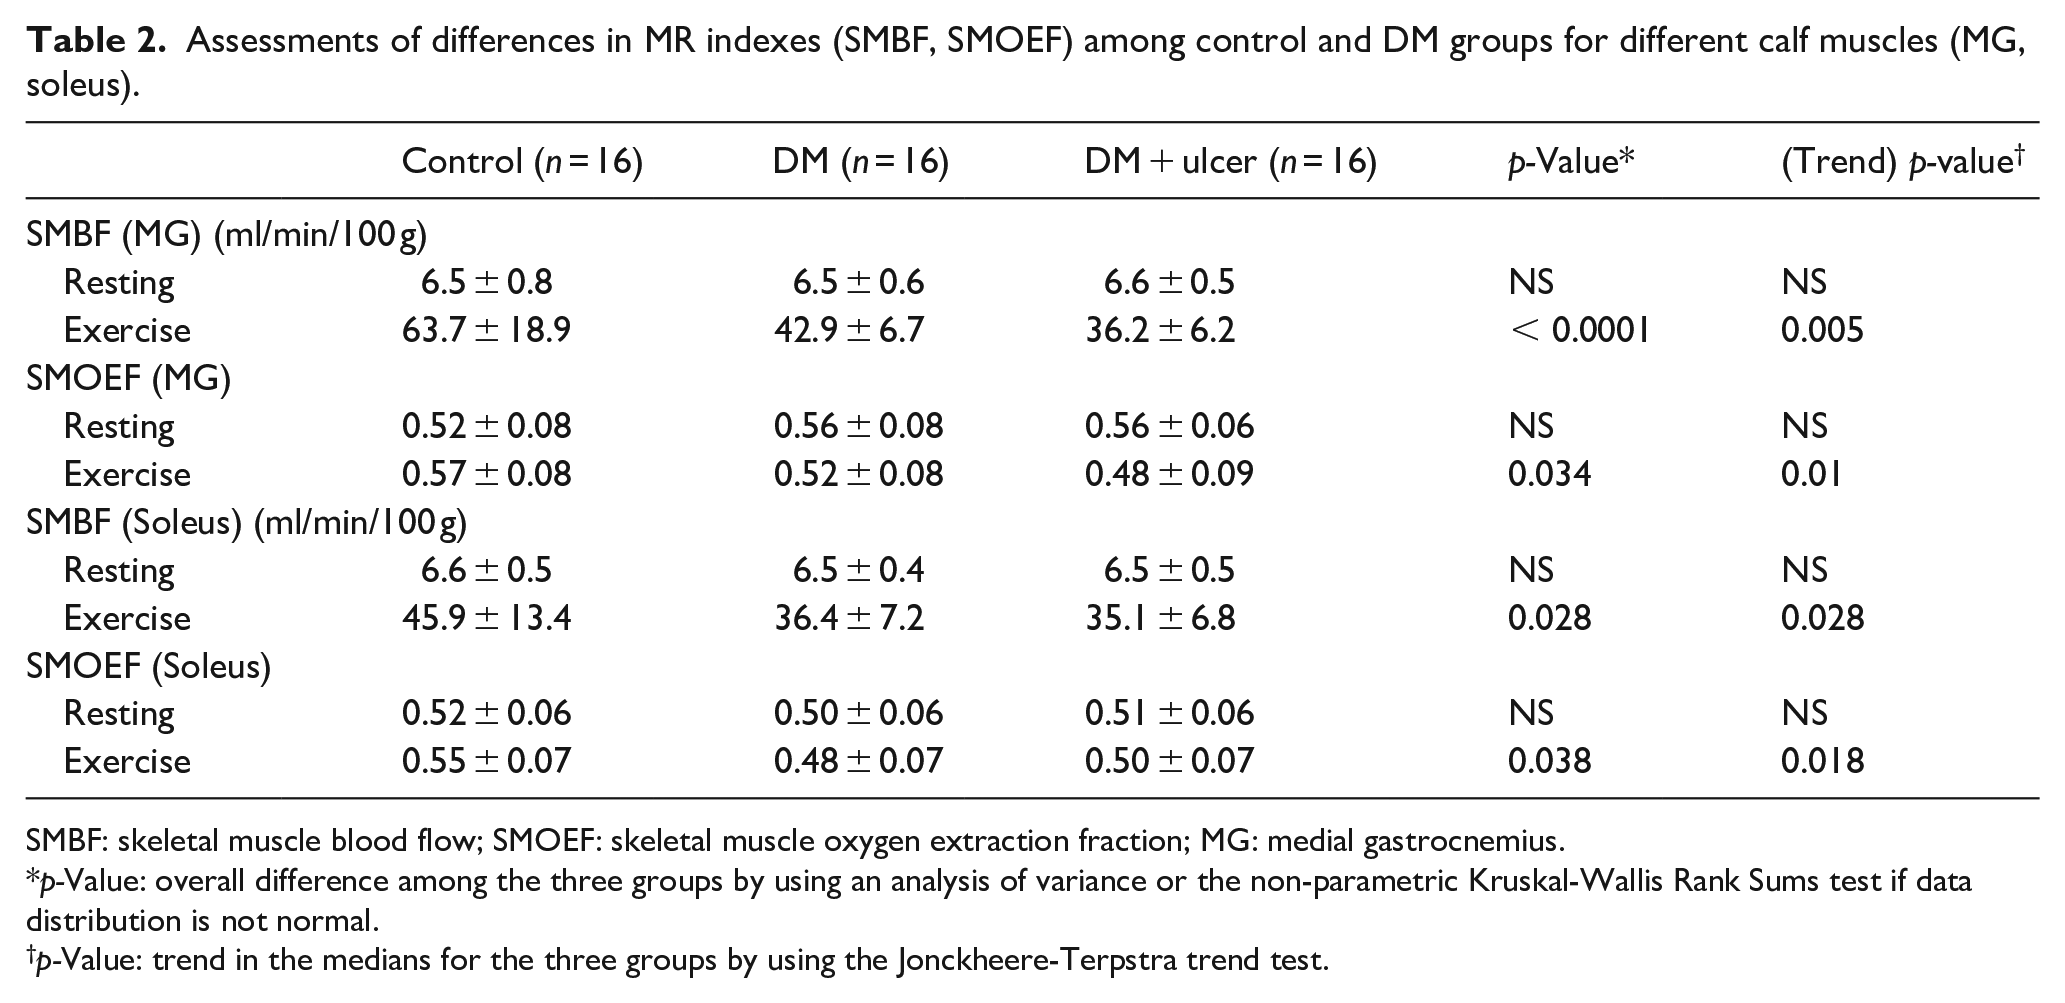
SMBF: skeletal muscle blood flow; SMOEF: skeletal muscle oxygen extraction fraction; MG: medial gastrocnemius.
p-Value: overall difference among the three groups by using an analysis of variance or the non-parametric Kruskal-Wallis Rank Sums test if data distribution is not normal.
p-Value: trend in the medians for the three groups by using the Jonckheere-Terpstra trend test.
Figure 1 contains the box plots of exercise SMBF and SMOEF indexes for the MG and soleus muscles for the three groups. Exercise SMBF in the MG muscle was the most sensitive index and able to differentiate the three groups. Exercise SMOEF in the MG muscle was significantly lower in the DM + ulcer group compared to the control group. In the soleus muscle, exercise SBMF was significantly reduced in the DM + ulcer group compared to the control group and exercise SMOEF was reduced in the DM group compared to controls. Figure 2 shows an example of SMBF map at rest and during the exercise from all three study groups.
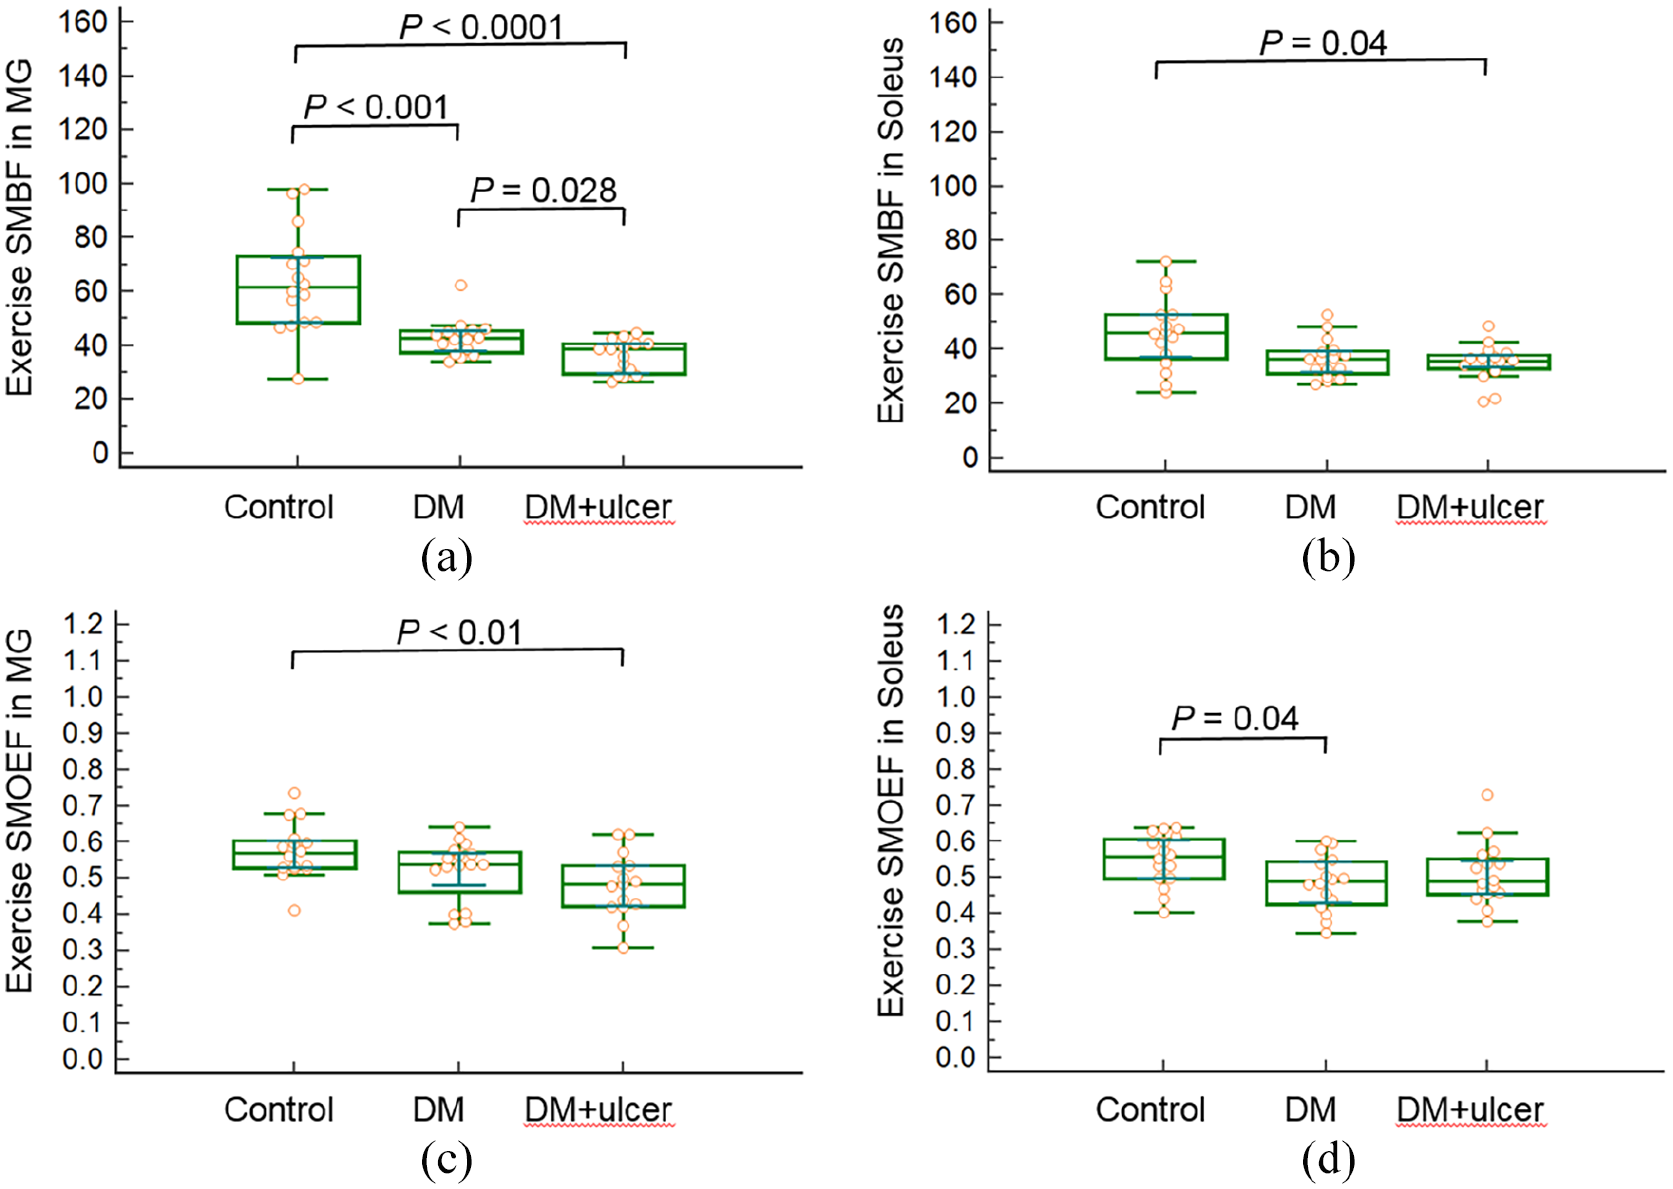
Box plots of exercise SMBF and SMOEF in the MG (a, c) and soleus (b, d) muscles for subjects of control, DM, and DM + ulcer. The comparisons between two groups with significant differences are demonstrated.
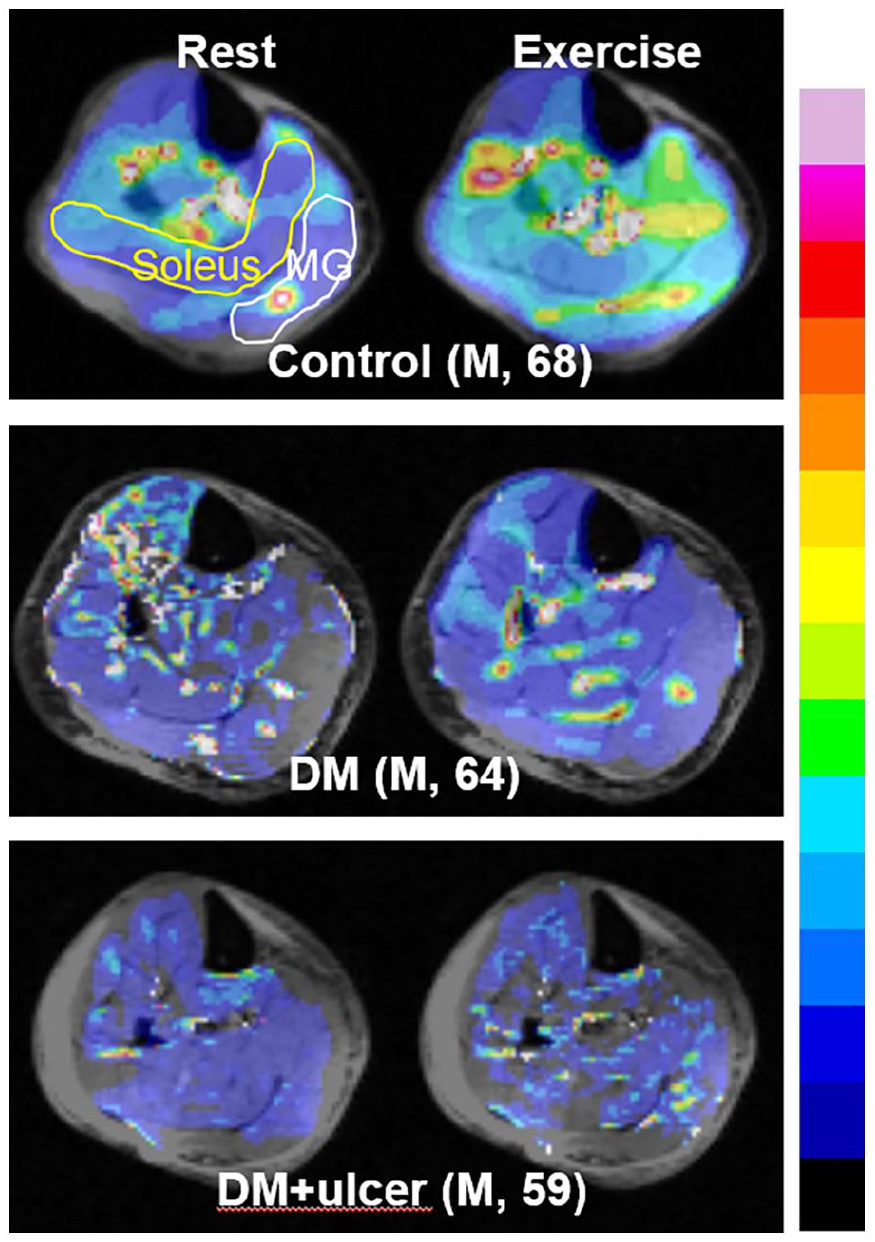
Representative MR SMBF maps in three subjects from three different groups. These subjects were all men with similar ages. While resting SMBF appeared similar among subjects, gradually diminished exercise SMBF can be seen in soleus and medial gastrocnemius muscles from control to DM + ulcer. The color bar scale for absolute SMBF maps is from 0 to 100 ml/min/100 g.
The generalized regression analysis revealed there were no demographics (age, BMI, and gender), clinical indices (ABI, TBI, and HbA1c), or risk factors (ever smoker, neuropathy, and hypertension) that had an impact on the differences among or between groups for MRI indices (exercise SMBF and SMOEF).
Correlations between clinical indexes values and MRI indexes
The Yale score was significantly difference among the three groups (p = 0.025) and there was a significant downward trend from the control to the DM to the DM + ulcer group (p = 0.01). Age had no impact on this significance. For the comparison between two groups, there was a significant difference between the control and DM groups (p = 0.02) and between the control and DM + ulcer groups (p < 0.01). Table 3 summarizes correlations between MRI indices and HbA1c and Yale score. Exercise SMBF in the MG negatively correlated with HbA1c values (r = −0.61, p < 0.001). Exercise SMBF in the soleus positively correlated with Yale score (r = 0.39, p < 0.01). None of the SMOEF indices were associated with HbA1c or Yale score.
Data for three groups of subjects combined (control, DM, and DM + ulcer, n = 48), correlations between HbA1c or Yale score and MRI indexes (only significant correlations shown).
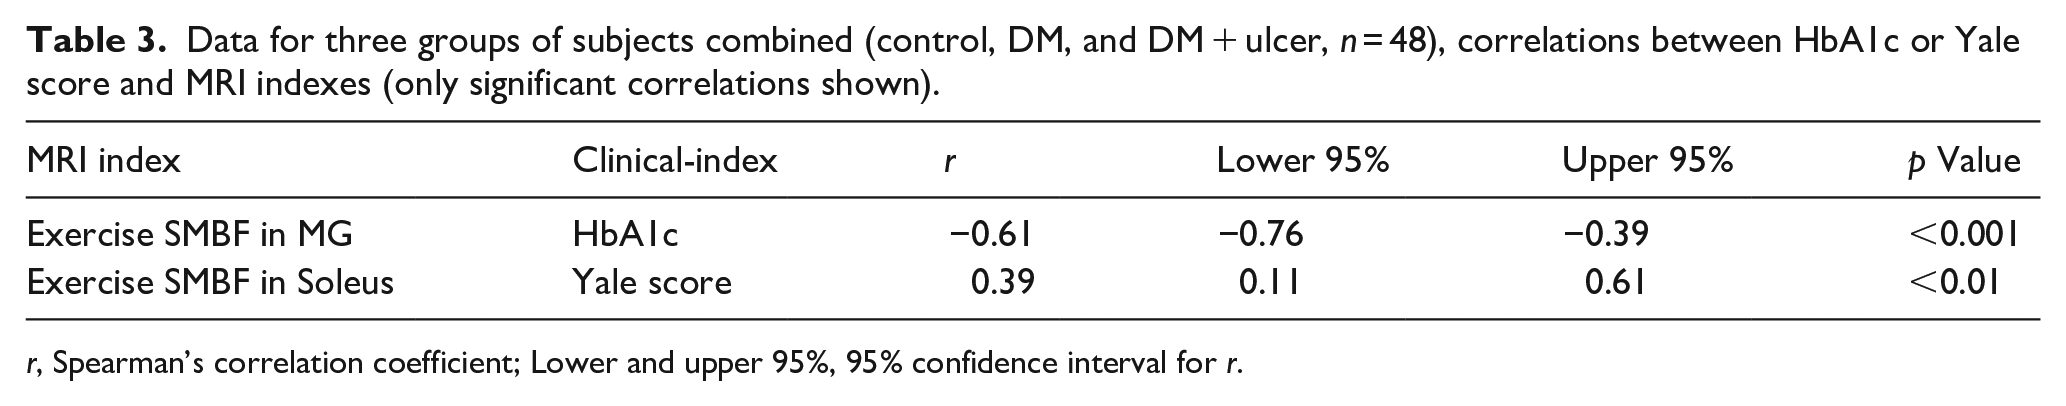
r, Spearman’s correlation coefficient; Lower and upper 95%, 95% confidence interval for r.
Discussion
In this study, contrast-free MRI techniques were used to quantify skeletal muscle microcirculation (blood flow and oxygen extraction) in the calf at rest and during an isometric exercise. We observed exercise SMBF in MG muscle decreased progressively from the control, to DM, to DM + ulcer group (p < 0.05), whereas exercise SMOEF of MG muscle in the DM + ulcer group was significantly lower than that in the control group. Daily activity was associated with soleus muscle exercise SMBF and MG muscle exercise SMBF was associated with HbA1c.
SMBF and SMOEF contrast-free MRI techniques were previously developed and validated in animal models in heart muscle to measure myocardial blood flow and in brain to measure cerebral oxygen extraction fraction, respectively.21,31 The physical principles of blood flow and oxygen extraction measured in the heart and brain are shared in the lower extremities and thus the measurement techniques were applied to measure limb microcirculation. In a previous report, the SMBF and SMOEF measured in calf muscles agreed well with literature values measured by using PET approaches. 15 However, direct validation in animal models and humans is still needed.
The DM + ulcer group had an elevated HbA1c (8.02 ± 2.3%), indicative of poor blood glucose control, and by definition had lower extremity diabetic complications. The MG muscle in the DM + ulcer group had the lowest exercise SMBF and a lower SMOEF compared to controls. These results suggest that severe DM, indicated by foot ulceration and poor blood sugar control, may have more detrimental effect on blood delivery and oxygen metabolism in calf muscle than controlled DM, despite a lack of macro-occlusive disease. A similar interpretation was offered in a biopsy study of patients with PAD and PAD with DM. In this study, it was found that oxygen consumption in the gastrocnemius muscle was reduced by 30% in the patients with PAD and DM, compared with that in the patients with only PAD. 32 The altered oxidative capacity in people with DM has been linked to mitochondrial dysfunction in DM which directly affects tissue oxygen extraction. 33 On the other hand, investigators have failed to find evidence to support the notion that there is an intrinsic mitochondrial deficit in early-stage PAD. 34 Future studies are warranted to further explore mechanisms of oxygen metabolism dysfunction in patients with DM.
Our study demonstrated a significant trend of a decrease general physical activity, measured by the Yale score, from controls to DM groups, and a significant positive association between the Yale score and soleus muscle exercise SMBF. The soleus muscle is a predominately slow-twitch muscle, most recruited during standing/postural activities. The relationship between the soleus muscle and Yale likely reflects a number of low vigor daily activities included in the survey such as cooking, washing dishes, and doing laundry. Our work supports the significant and consistent link between decreased physical activity and an increase in microvascular dysfunction. Our work does not allow inference of a causal relationship between physical activity and microvascular measures but provides preliminary evidence to support examination of the use of physical activity in prevention and treatment of diabetes and vascular complications.
Study limitations
There are a few limitations in this study. First, we did not normalize the isometric resistance based on individual strength in this preliminary study. All participants had the same resistance which likely represent a higher percent of maximal voluntary contraction (MVC) for the groups with a diagnosed disease (DM and DM + ulcer) compared with the control group.1,2 Physiologically, working at a higher % MVC should result in larger exercise SMBF and SMOEF; however, the disease groups had lower exercise SMBF and SMOEF. Therefore, the difference between groups is likely underestimated. Data in this study underscore a potentially more adverse impact of DM in local tissue microcirculation once exercise strength is adjusted to a fixed % MVC in future studies. Second, while clinical perfusion assessments (ABI) were performed, other imaging modalities (e.g. ultrasound, near-infrared optic imaging, etc.) may have helped identify and quantify vascular disease. Nevertheless, our study provides a clear representation of the clinical standard for ruling out PAD in people with DM and foot complications. Although there was no significant difference in the ABI among three groups of individuals, there was one patient in the DM group and three patients in the DM + ulcer group that had ABIs > 1.4. This falsely high ABI may indicate noncompressible or calcified tibial arteries. However, the impact of this confounding factor on limb microcirculation is unknown and needs more extensive study. Third, we scanned only one slice of calf muscle, which may not be representative of the entire function of the calf muscle. Improvements in imaging techniques to cover the entire calf volume is under investigation. Lastly, although our small prospective study was adequately powered relative to SMOEF change, we acknowledge our small sample set may have been subject to uncontrolled confounders, such as patient medications, diet, and underlying metabolism.
Conclusion
This study demonstrates the capability of contrast-free MR imaging with an exercise regime to differentiate impaired regional microcirculation in calf muscles of patients with DM and ABI > 0.9 from that in control subjects. Subjects with DM with and without foot ulcers, had significantly reduced exercise blood flow in the medial gastrocnemius muscle compared to control. In subjects with DM + ulcers, the exercise oxygen extraction fraction is also impaired. Exercise SMBF in the medial gastrocnemius muscle was the most sensitive index and was associated with HbA1c. Lower exercise blood flow in the soleus muscle was associated with lower Yale score.
Footnotes
Acknowledgements
This study was supported in part by research grants from National Institute of Health R21 AR065672, K08HL132060, and R01DK105322. The authors would like to thank Darrah Snozek, Katherine Love, and Dakkota Thies for coordinating the recruitment of participants.
Author contributions
JZ: designed the study, collected, analyzed and interpreted the data, wrote and edited the paper. CS: designed the study, collected, edited the paper. RL: collected, analyzed the data, edited the paper. HA: designed the study, interpreted the data, edited the paper. CFH: designed the study, analyzed and interpreted the data, edited the paper. MAZ: designed the study, analyzed and interpreted the data, edited the paper. MJM: designed the study, analyzed and interpreted the data, edited the paper. MKH: designed the study, collected, analyzed and interpreted the data, edited the paper.
Declaration of conflicting interests
The author(s) declared no potential conflicts of interest with respect to the research, authorship, and/or publication of this article.
Funding
The author(s) disclosed receipt of the following financial support for the research, authorship, and/or publication of this article: National Institute of Health R21 AR065672 (to JZ), K08HL132060 (to MZ), and R01DK105322 (to JZ and MKH).