
Abstract
Few studies have examined stroke risk in type 1 diabetes mellitus (T1DM). Stroke incidence, predictors, and survival were thus explored in this study. Pittsburgh Epidemiology of Diabetes Complications (EDC) Study participants (n = 658) with childhood-onset T1DM were followed biennially for 18 years. Baseline (1986–1988) mean age and diabetes duration were 28 and 19 years respectively. Stroke incidence and type was determined via survey or physician interview and, when possible, confirmed with medical or autopsy records. During follow-up, 31 (4.7%) strokes occurred (21 ischaemic, 8 haemorrhagic, 2 unclassified) in participants of mean age = 40.2 years (range 23–60). In exploratory multivariable Cox modelling, diabetes duration, systolic blood pressure (SBP), non-high density lipoprotein cholesterol (non-HDLc), white blood cells (WBC), and pulse significantly predicted ischaemic stroke. Adding overt nephropathy (ON) (hazard ratio = 4.4, 95% CI, 1.5–12.4) to the model replaced SBP. Participant survival after stroke was 80.6%, 45.2%, and 9.6% at 1, 5, and 10 years, respectively, and significantly worse after haemorrhagic stroke (p = 0.03). These risk factors merit careful evaluation and management to prevent stroke in T1DM, which occurs at least 20 years earlier than in the general population.
Introduction
Type 1 diabetes mellitus (T1DM) increases the risk of many long-term complications, especially renal and cardiovascular disease. Although many T1DM studies have included stroke as part of a composite cardiovascular endpoint, few have specifically focused on cerebrovascular disease in T1DM.1–6 Three recent studies have reported that T1DM is associated with an increased risk of stroke compared to nondiabetic persons, especially before 50 years of age.5–7 Mortality from stroke is increased 3- to 4-fold in T1DM compared to the general population. 3 Prospective studies examining predictors of stroke in T1DM have shown that, univariately, conventional cardiovascular risk factors (i.e. hypertension and dyslipidaemia), as well as proteinuria, increase stroke risk in this population, but are limited in the number of stroke events with limited follow-up.1–2,4 Data are lacking on survival after stroke in T1DM.
Using the Pittsburgh Epidemiology of Diabetes Complications (EDC) cohort with 18 years of follow-up, our objectives were: (a) to determine the incidence of stroke in a large T1DM population; (b) to examine univariate and explore multivariable associations between baseline variables and incident stroke; (c) examine univariate and explore multivariable associations between time-varying variables and incident stroke; (d) to estimate median survival after incident stroke.
Participants and methods
Study population
Complete methodology for patient selection, examination, and laboratory testing in the Pittsburgh EDC Study has been described in detail.8–9 Briefly, the EDC Study began in 1986–1988 consisting of 658 individuals diagnosed 1950–1980 with childhood-onset T1DM (age < 17 years) and seen at Children’s Hospital of Pittsburgh within one year of diagnosis. Mean age and diabetes duration were 28 and 19 years, respectively, at baseline (1986–1988). Participants have been followed biennially by survey, and by physical examination biennially for the first 10 years and then again at 18 years. Research protocols were approved by the University of Pittsburgh Institutional Review Board and all participants provided written informed consent.
Outcome variable
Incident stroke (as well as hospitalisation for any reason) was assessed biennially via survey. Medical/autopsy records were obtained, when possible, to verify stroke occurrence and type and were reviewed by a physician (TJO). Confirmatory medical/autopsy records were obtained for 77% of the events. Stroke was defined as a neurological deficit of acute onset lasting ≥24 hours without other evident cause.
Predictor variables
Blood pressure was measured with a random-zero sphygmomanometer after a five-minute rest according to the Hypertension Detection and Follow-up Program protocol. 10 Hypertension was defined as a blood pressure ≥140/90 mm Hg or antihypertensive medication use. Height and weight were measured to calculate body mass index (BMI). An ever smoker was defined as one who had smoked ≥100 lifetime cigarettes.
Fasting blood samples were taken to measure glycosylated haemoglobin (HbA1), lipids, lipoproteins, and serum creatinine. Original HbA1 values were converted to Diabetes Complications and Control Trial (DCCT)-aligned HbA1c for all analyses. Total cholesterol and triglycerides were measured enzymatically, and high-density lipoprotein cholesterol (HDLc) was determined with a heparin and manganese chloride precipitation technique. 11 Non-HDLc was the difference between total cholesterol and HDLc levels.
White blood cell (WBC) counts were obtained using a Coulter Counter (model S-plus IV, Beckman-Coulter, Fullerton, CA) and fibrinogen assayed using a biuret colorimetric procedure and a clotting method. Serum and urinary albumin were measured by immunonephelometry, 12 and creatinine was assayed using an Ectachem 400 Analyzer (Eastman Kodak, Rochester, NY). Renal damage status was based on urinary albumin excretion rates (AER) from two of three timed urine collections and assessed as follows: microalbuminuria, AER = 20–200 μg/min; overt nephropathy (ON), AER > 200 μg/min or, in the absence of urine, a serum creatinine level > 2 mg/dl, renal failure or renal transplantation. Glomerular filtration rate (GFR) was estimated using the Cockcroft-Gault equation. 13
Coronary artery disease (CAD) was defined as CAD death, fatal or nonfatal myocardial infarction and confirmed either by hospital records or by Q-waves on electrocardiogram (Minnesota code 1.1, 1.2), angiographic stenosis ≥50% confirmed by hospital records, revascularisation, EDC-diagnosed angina or ischaemic ECG changes (Minnesota code 1.3, 4.1–4.3, 5.1–5.3, 7.1) which include minor Q-waves, ST depression, T-wave inversion/flattening, or left bundle branch block. Lower extremity arterial disease (LEAD) included claudication (based on the Rose questionnaire), amputation, or ankle brachial index <0.8. 14
Proliferative retinopathy (PR) was assessed using stereoscopic fundus photographs of fields 1, 2, and 4 with a Zeiss camera, read by the Fundus Photography Reading Center (University of Wisconsin-Madison) and classified based on the modified Airlie House system. 15 For participants refusing fundus photographs or unable to attend an EDC clinic visit (n = 43), PR was defined as receiving laser phototherapy for proliferative diabetic retinopathy.
Mortality data
Vital status was determined as of 1 January 2010 via participant contact and searches in both the Social Security Death Index and the National Death Index. Each death was confirmed by death certificate. In addition, attempts were made to obtain the following, if appropriate: pertinent medical records, autopsy/coroner’s reports; and interview with next-of-kin regarding the circumstances surrounding the death. Each decedent’s underlying cause of death, and all contributing causes, was determined by a Mortality Classification Committee of at least two physician epidemiologists using all available data based on standardised procedures. 16
Statistical analysis
Baseline traditional cardiovascular and diabetes-specific risk factors were analysed univariately using the Student’s t-test (or Mann-Whitney U-test for non-parametric comparisons) and the χ2 test (or Fisher’s exact test) by incident stroke status. Due to the small number of events, in addition to comparing ischaemic stroke and no stroke, all incident strokes (ischaemic and haemorrhagic) were combined for multivariable analysis. Significant univariate variables were made available to exploratory multivariable Cox regression models. The proportional hazards assumption was visually assessed, then verified by testing time-varying interaction terms.
Since many variables were significant univariately, exploratory analysis was performed by grouping variables into 3 groups: 1) demographic, 2) complications and 3) clinical, with diabetes duration included in all exploratory models. Independent variables were analysed both at baseline and as time-varying updated means. In the second method, updated means of each continuous variable were calculated as the overall mean of said variable for each participant at every cycle (i.e. the average of all data up to and including the present cycle), until either an event occurred or follow-up ended. Variables found to be significant in exploratory multivariable analysis were combined into Cox regression models with backward elimination. Survival plots by stroke status were based on Kaplan-Meier life-tables. Statistical significance was defined as p < 0.05. All HRs are reported per increase of 1 SD for continuous variables. SPSS 18.0 (IBM, Chicago, IL) was used for survival analyses and SAS 9.2 (SAS Institute, Cary, NC) was used for all other analyses.
Results
Four (0.6%) persons suffered a stroke prior to study entry and were excluded. In addition, one individual was lost to follow-up after the initial visit and thus excluded. During a mean (±SD) follow-up of 15.4 (±4.9 years), 31 participants (4.7%) suffered an incident stroke, six of which were fatal. This represents an unadjusted incidence rate of 3.1 (95% CI, 2.0-4.1) strokes/1000 person-years, which did not differ by sex. The incidence of stroke increased with both age and diabetes duration in this T1DM cohort. The mean age at stroke onset was 40.2 years (range 23–60). Ten participants who suffered an incident stroke (32%) had evidence of coronary artery disease prior to the stroke, while three (10%) had a prior transient ischaemic attack (TIA). Stroke type was determined for 29 of the 31 incident strokes: 21 were ischaemic, 8 were haemorrhagic and two could not be classified.
Baseline predictors of stroke
Table 1 presents baseline data based on incident stroke status and type. Persons with incident stroke were significantly older and had a longer diabetes duration at baseline compared to persons with no stroke, but no difference existed by sex or race. Baseline systolic blood pressure (SBP) was significantly higher for those with ischaemic stroke, whereas diastolic blood pressure was significantly higher for those with haemorrhagic stroke. Compared to individuals without stroke, non-HDLc, triglycerides, AER, fibrinogen and WBC count were elevated and estimated GFR (eGFR) was decreased, in those with ischaemic stroke. Compared to those without stroke, those with haemorrhagic stroke had elevated pulse, non-HDLc, triglycerides and AER but their daily insulin dose and hematocrit were decreased, in. HbA1c was only univariately significant for haemorrhagic stroke. Of note, individuals with incident stroke (both types) were more likely to have a history of renal damage (microalbuminuria (MA) or overt ON), but only those with ischaemic stroke were more likely to have smoked.
Baseline characteristics of Pittsburgh EDC participants by incident stroke status (n = 651). a
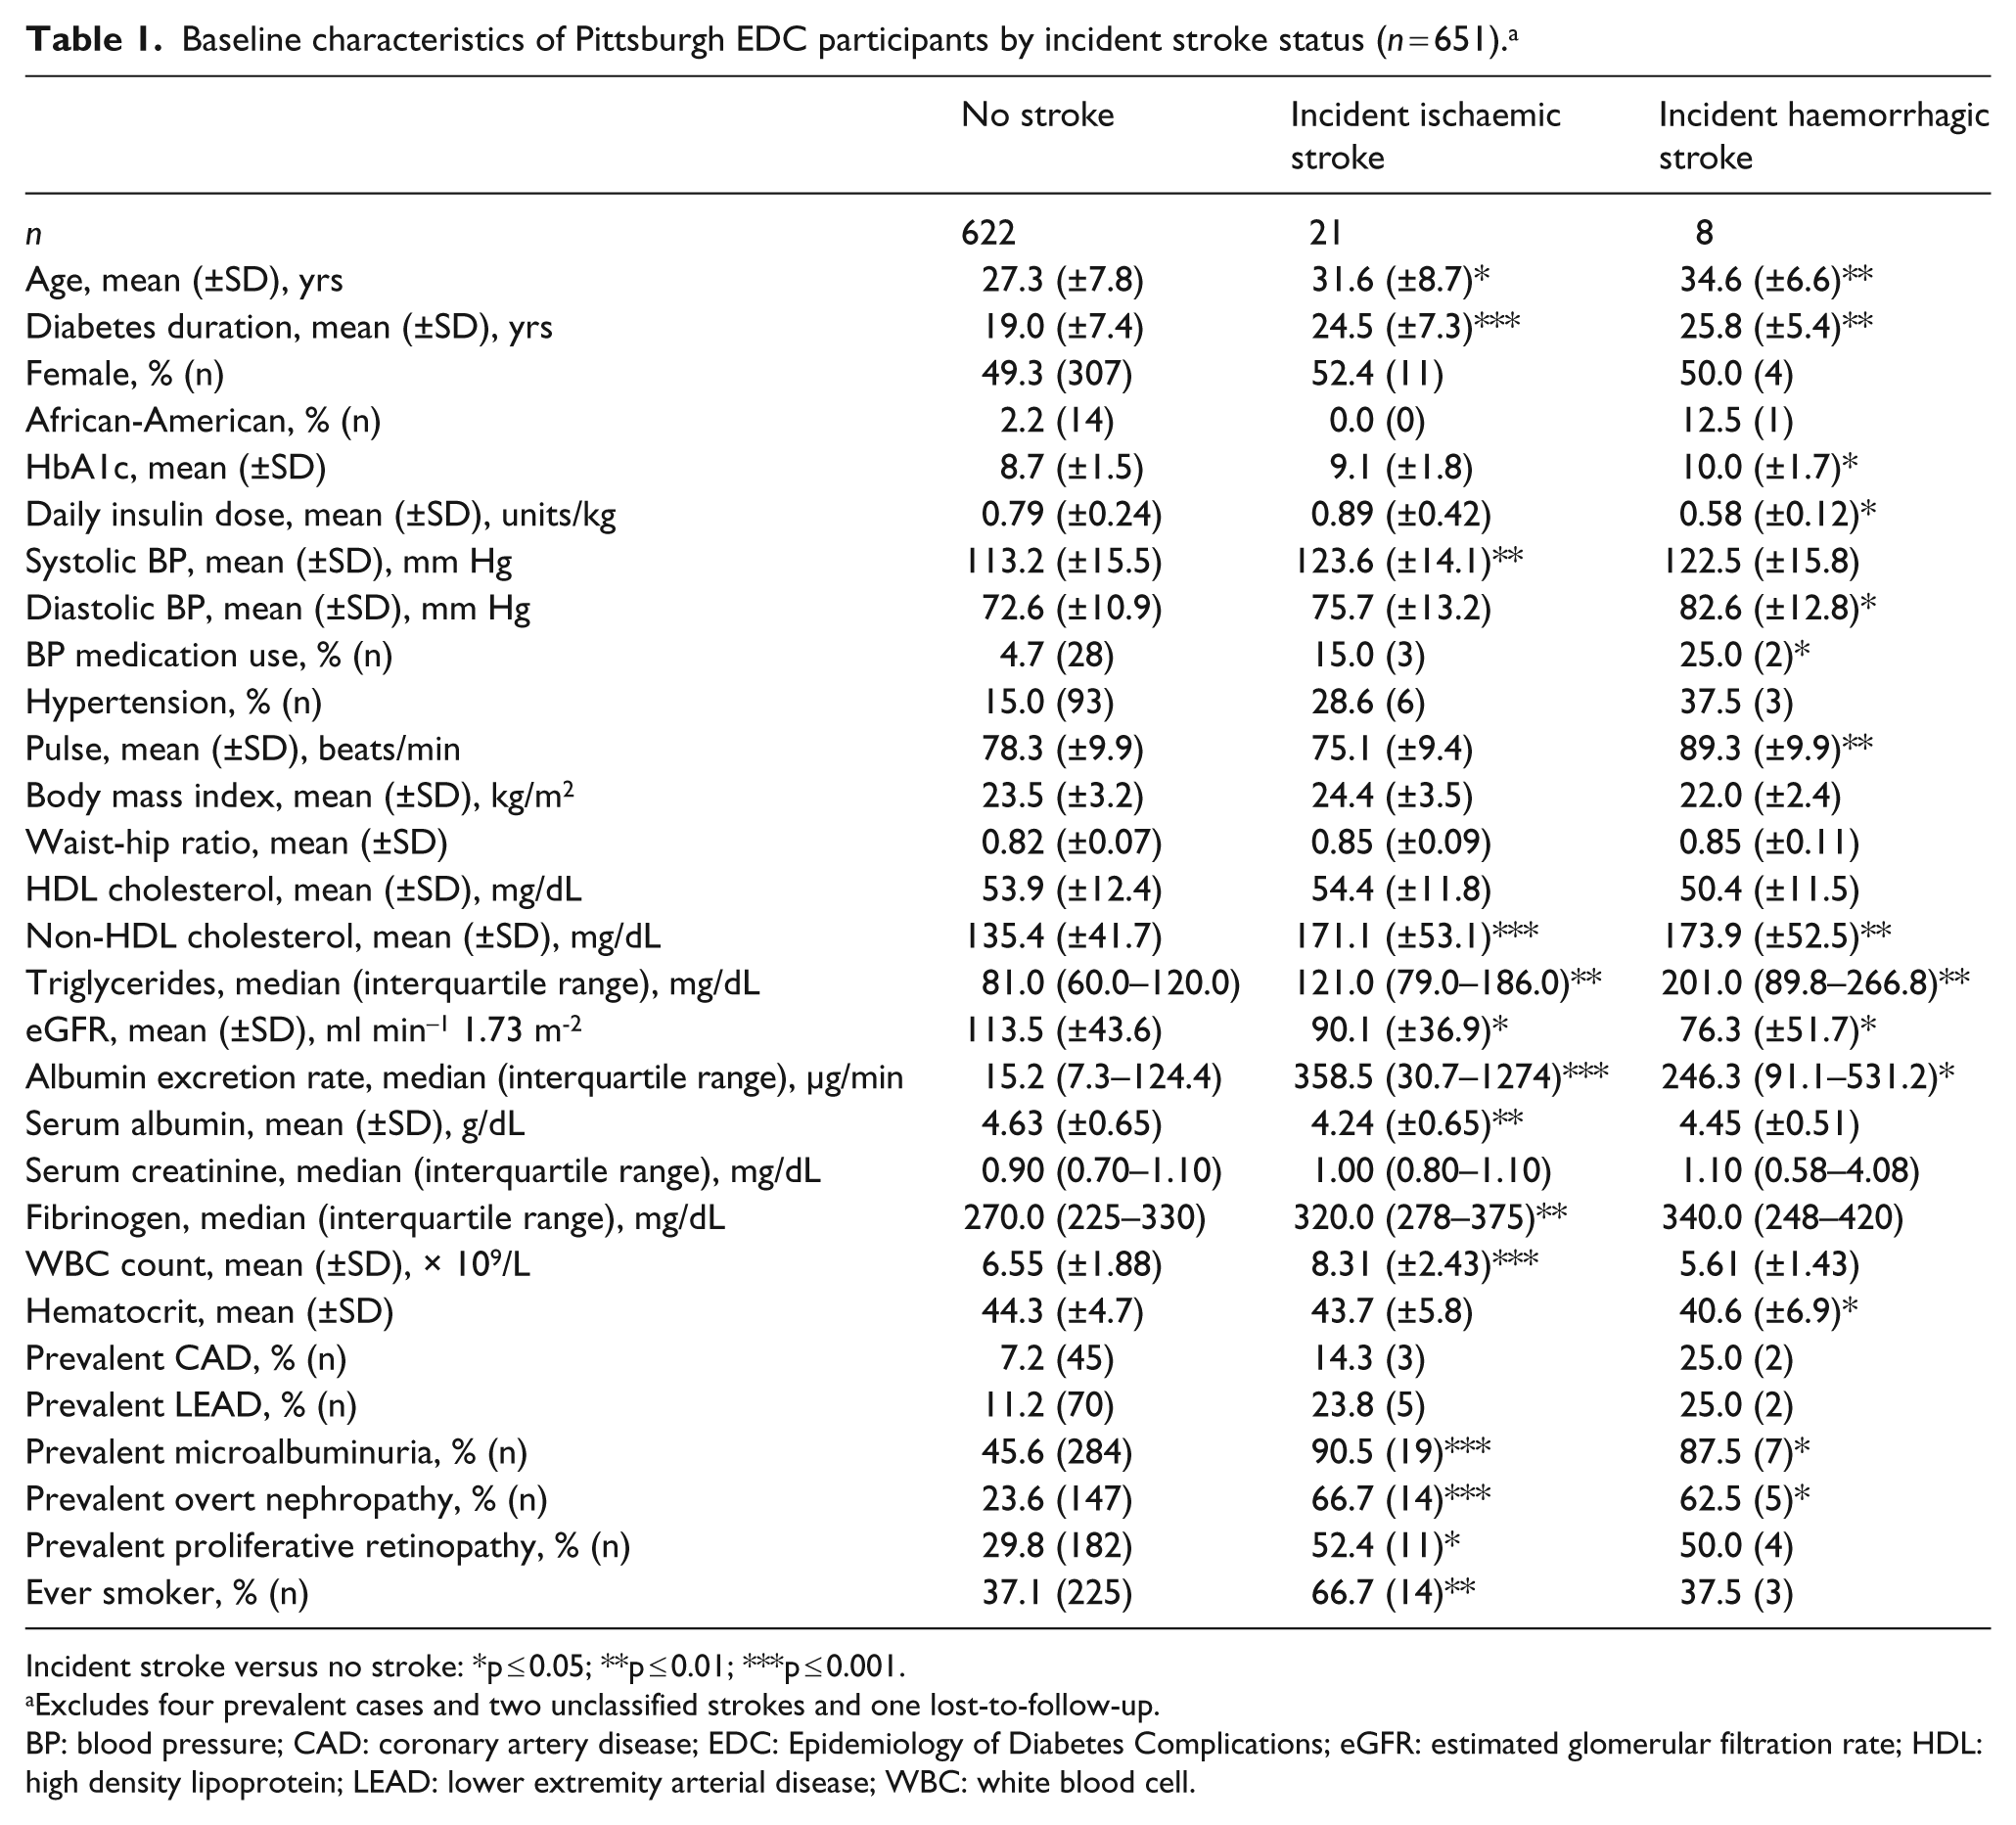
Incident stroke versus no stroke: *p ≤ 0.05; **p ≤ 0.01; ***p ≤ 0.001.
Excludes four prevalent cases and two unclassified strokes and one lost-to-follow-up.
BP: blood pressure; CAD: coronary artery disease; EDC: Epidemiology of Diabetes Complications; eGFR: estimated glomerular filtration rate; HDL: high density lipoprotein; LEAD: lower extremity arterial disease; WBC: white blood cell.
Exploratory multivariable analyses of baseline predictors consistently showed diabetes duration and non-HDLc as significant predictors of any stroke, and these effects did not materially change in the four models (Table 2). The effects of SBP and HBA1c were only significant in Model 1, which also included eGFR as a measure of renal function. The effect of renal damage, ON, was highly predictive (HR = 4.3), even after accounting for diabetes duration and non-HDLc, and replaced both SBP and HbA1c (Table 2A, Model 2). Substituting subclinical renal damage, MA, for clinical ON was also predictive of stroke (HR = 5.1, 95% CI, 1.5–18.1), as was the continuous measure, AER (HR = 1.8, 95% CI, 1.2–2.6 per SD increase).
Cox regression models for baseline predictors of (A) any stroke and (B) ischaemic stroke in type 1 diabetes.
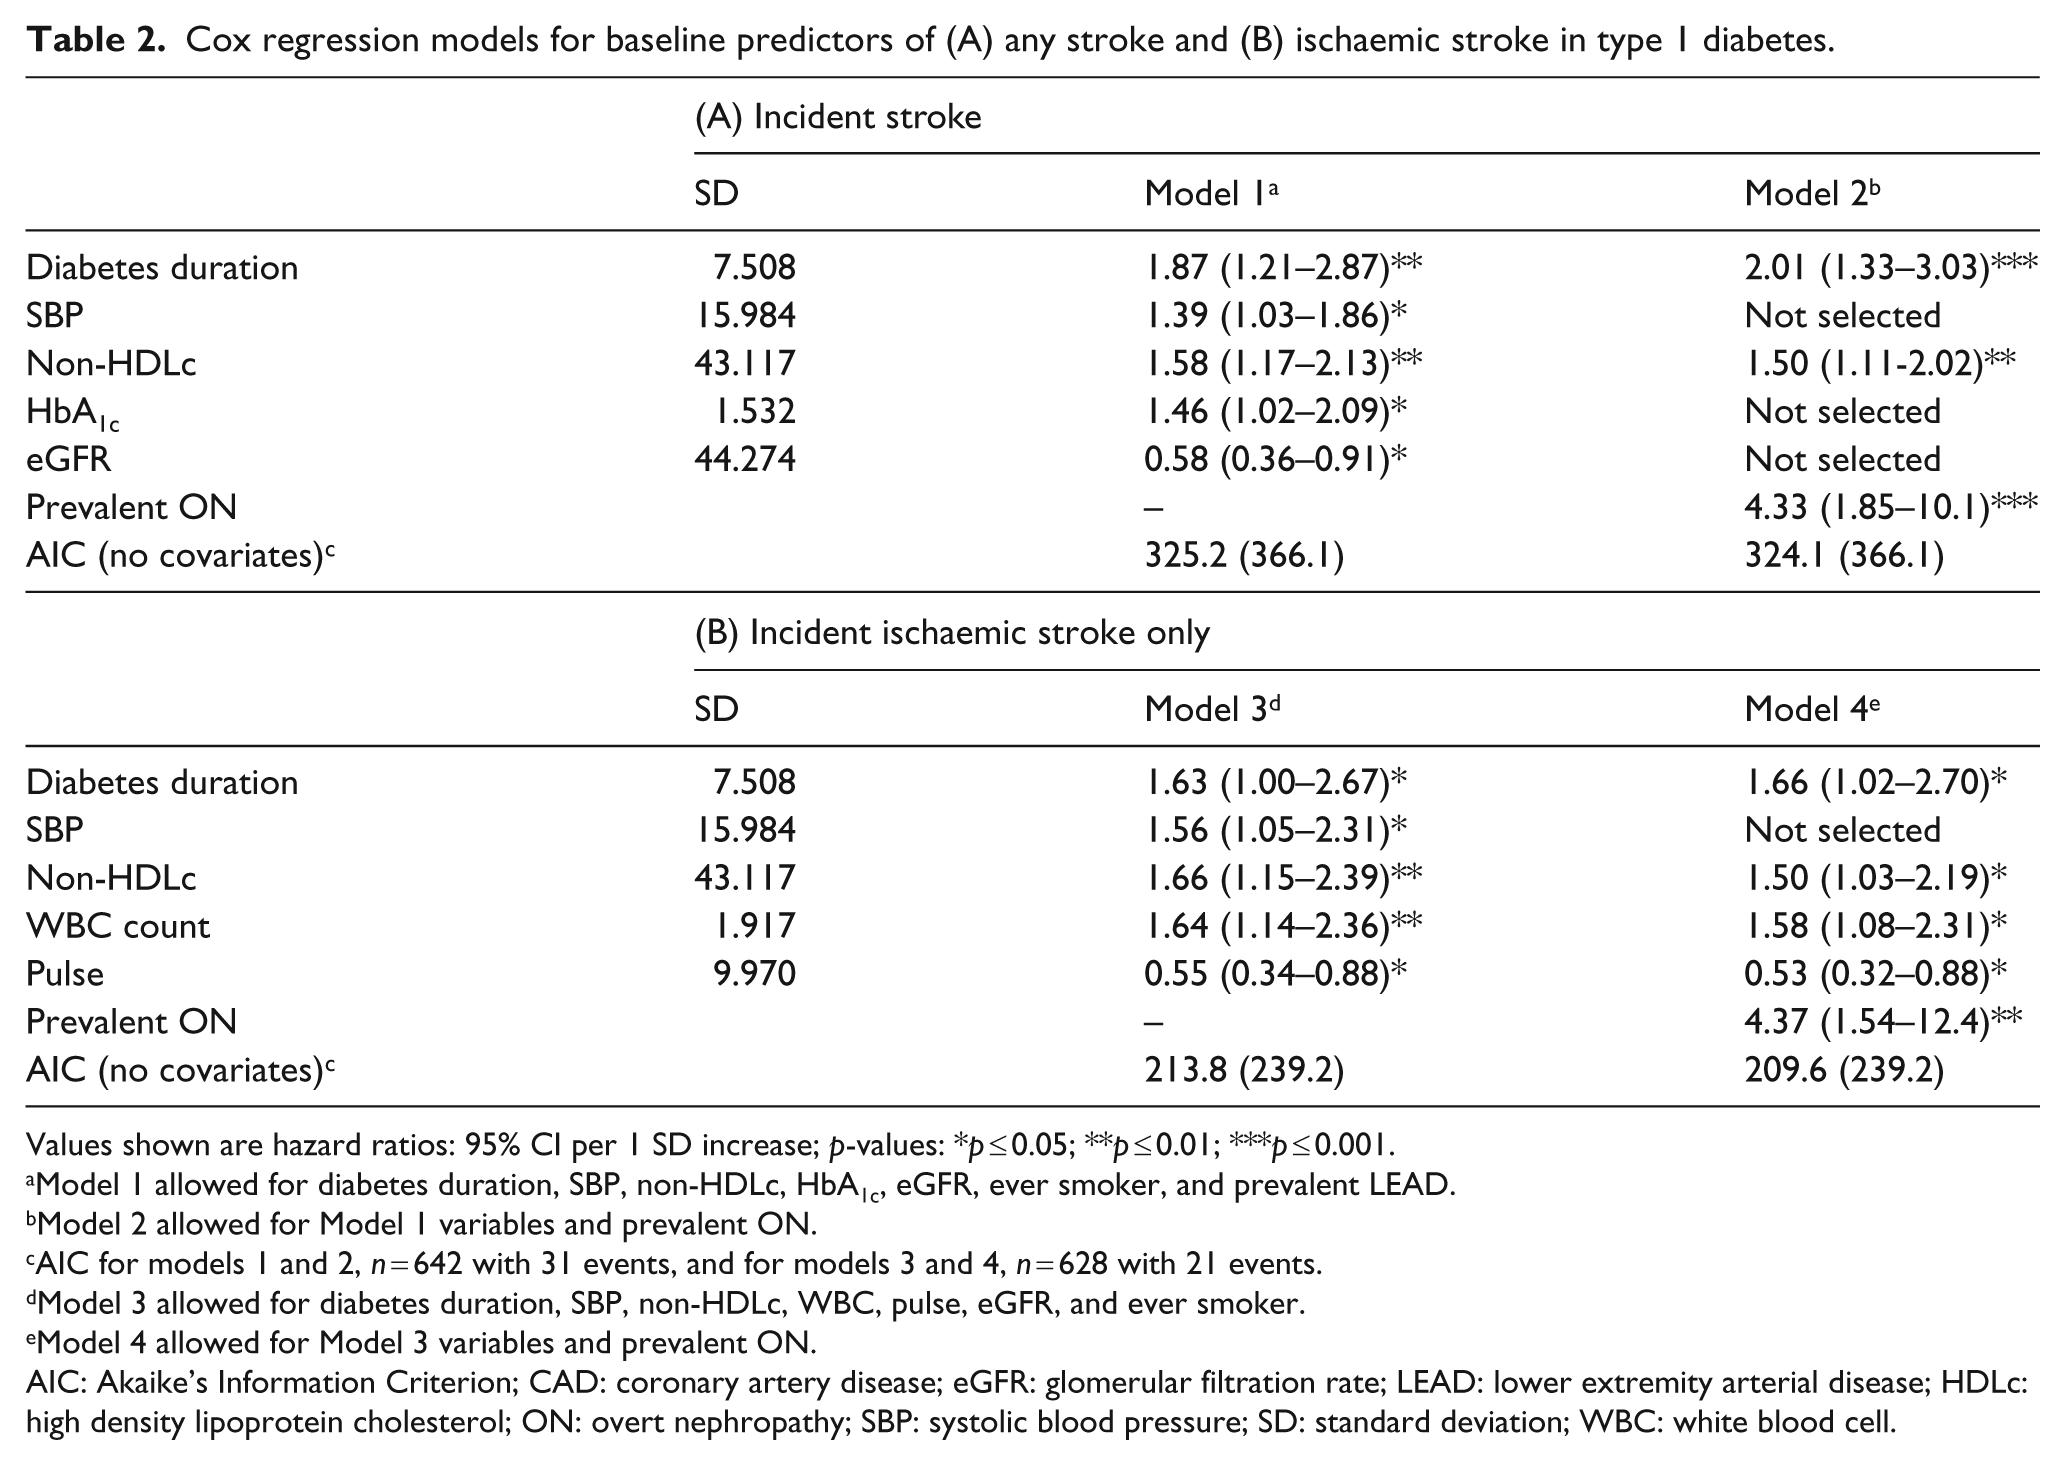
Values shown are hazard ratios: 95% CI per 1 SD increase; p-values: *p ≤ 0.05; **p≤ 0.01; ***p ≤ 0.001.
Model 1 allowed for diabetes duration, SBP, non-HDLc, HbA1c, eGFR, ever smoker, and prevalent LEAD.
Model 2 allowed for Model 1 variables and prevalent ON.
AIC for models 1 and 2, n = 642 with 31 events, and for models 3 and 4, n = 628 with 21 events.
Model 3 allowed for diabetes duration, SBP, non-HDLc, WBC, pulse, eGFR, and ever smoker.
Model 4 allowed for Model 3 variables and prevalent ON.
AIC: Akaike’s Information Criterion; CAD: coronary artery disease; eGFR: glomerular filtration rate; LEAD: lower extremity arterial disease; HDLc: high density lipoprotein cholesterol; ON: overt nephropathy; SBP: systolic blood pressure; SD: standard deviation; WBC: white blood cell.
Consistent baseline predictors of ischaemic stroke included diabetes duration, SBP, non-HDLc, WBC and pulse (Table 2B). Unlike the overall stroke models in Table 2A, when ON was included (Table 2B, Model 4), these other baseline predictors remained significant, except for SBP. Despite the small numbers, multivariable analysis revealed that the strongest baseline predictors of haemorrhagic stroke were diabetes duration (HR = 3.5, 95% CI, 1.6–7.6), HbA1c (HR = 2.5, 95% CI, 1.4–4.5) and diastolic blood pressure (DBP) (HR = 2.0, 95% CI, 1.2–3.5).
Time-varying updated-means
Exploratory models using time-varying updated-means for all continuous variables were quite similar to the baseline models above. Predictors of incident stroke included longer diabetes duration (HR = 1.57), higher SBP (HR = 1.38), higher non-HDLc (HR = 1.67), higher HbA1c (HR = 1.26) and lower eGFR (HR = 0.50) (Supplementary Table 1, Model 1). When prevalent ON was added to the model, it was strongly predictive of stroke (HR = 4.54) and replaced both SBP and non-HDLc. Both higher HbA1c (HR = 1.26) and lower eGFR (HR = 0.53) remained in the fully-adjusted model (Supplementary Table 1, Model 2).
The major predictors of ischaemic stroke using time-varying updated-means were longer diabetes duration, ever smoker, higher SBP and higher non-HDLc; however, neither diabetes duration nor ever smoker reached statistical significance (p = 0.08 for both, Supplementary Table 1, Model 3). When prevalent ON was added, only longer diabetes duration (HR = 1.70) and prevalent ON (HR = 8.22) remained predictive in the final model (Supplementary Table 1, Model 4).
Survival after stroke
In this cohort, six (19.4%) incident strokes were fatal. The only significant baseline predictor of fatal incident stroke was HbA1c (HR = 2.3, 95% CI, 1.1–4.9); sex, diabetes duration, renal damage, hypertension and dyslipidaemia were not significant (data not shown). In participants with a non-fatal incident stroke (n = 25), 40.0% suffered at least one additional stroke over a median follow-up time of 3.9 years (range 0.6–14.9).
As of 1 January 2010, 27 (87.1%) individuals with an incident stroke had died. Overall median survival time after incident stroke was 3.8 years; 5.1 and 1.0 years for ischaemic and haemorrhagic stroke, respectively. The underlying cause of death was as follows: nine (33.3%) died of a stroke, nine (33.3%) died of a myocardial infarction or CAD death, eight (29.6%) died of another diabetes-related cause (e.g. diabetic ketoacidosis, end-stage renal disease, sepsis), and one (3.7%) died of multiple sclerosis. Of note, two individuals with a fatal haemorrhagic stroke had a prior ischaemic stroke.
Survival after incident stroke is shown in Figure 1. Overall, 1-year survival after stroke was 80.6%; 5-year survival was 45.2%; and 10-year survival was 9.6%. Stratification by stroke type, despite limited numbers (haemorrhagic stroke, n = 8), showed significant differences in survival, with 1-year survival after ischaemic stroke at 95.2% vs. 50.0% for haemorrhagic stroke (p = 0.03). A similar pattern persisted for 5-year survival (52.4% vs. 25.0%, respectively).
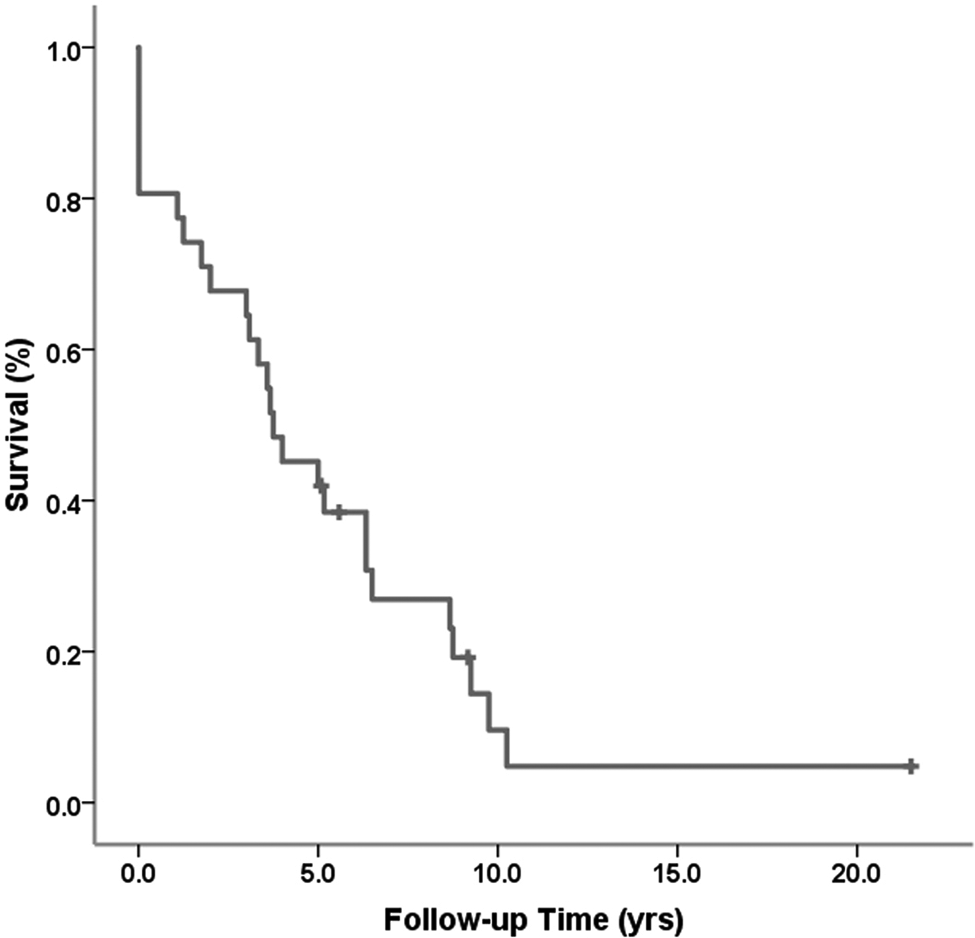
Survival (Kaplan-Meier) after incident stroke in type 1 diabetes participants of the Pittsburgh EDC Study.
Discussion
We report that stroke incidence in a large childhood-onset T1DM population is 3.0/1000 person-years during follow-up (mean 15.4 years), with no differences seen by sex. More than two-thirds of the incident strokes were ischaemic, consistent with other studies,2–4 and were usually not preceded by either CAD (32%) or TIA (10%), similar to the pattern seen in the general population. In exploratory analyses, renal damage, both at baseline and during follow-up, was the strongest predictor of overall and ischaemic stroke in T1DM. Survival after stroke was very low, especially for haemorrhagic stroke, consistent with findings that haemorrhagic strokes are often more severe. 17
Very few reports exist on stroke in T1DM for comparison. The largest study to date, the Diabetes UK Study, of >23,000 individuals with insulin-treated diabetes (diagnosed prior to age 30) examined only fatal strokes. 3 The authors found overall stroke standardised mortality ratios of 3.1 for males and 4.4 for females. However, only 19% of our cohort had a fatal incident stroke, and >66% of those with a non-fatal stroke died of a cause other than stroke, so a study capturing only fatal strokes potentially misses a large segment of affected individuals.
The risk for any stroke in the U.K. General Practitioners Research Database Study was increased 3.7-fold for males and 4.8-fold for females with T1DM compared to matched controls. 6 In the Nurses’ Health Study, the relative risk for haemorrhagic and ischaemic stroke was 4.5 and 7.9 respectively, compared to non-diabetic women, over 24 years of follow-up. 5 Our incidence rate (4.7%) for any stroke in the EDC Study is approximately four times higher than that seen in the 20–59 year-old general population in the National Health and Nutrition Examination Survey (NHANES) 2005–2008 (1.2%). 18
Few data exist on predictors of stroke in T1DM. In 2001, Fuller et al. combined data from multiple countries to look at risk factors for stroke (fatal and non-fatal) in T1DM. 2 They found significant univariate associations between stroke and baseline SBP, ON and ECG abnormalities, although the latter was only significant in men. However, a number of risk factors, including diabetes duration, plasma glucose, serum cholesterol and smoking history, were not predictive. In contrast, diabetes duration was one of the strongest predictors in the present study. A more recent report from the Fremantle Diabetes Study found that the strongest univariate predictor of ischaemic stroke in T1DM was serum HDLc, with diabetes duration and history of antihypertensive medication use also showing predictive value; however, only five incident ischaemic strokes occurred in their cohort. 4
Not surprisingly, we found different predictors for ischaemic versus haemorrhagic stroke. Diabetes duration, which, in childhood-onset diabetes serves as a proxy for age, strongly predicted both types of stroke. Blood pressure was also a significant predictor for both, SBP for ischaemic stroke and DBP for haemorrhagic stroke. Blood pressure has consistently been shown to be a risk factor for stroke both in T1DM2,19 and in the general population.20–21 It should be noted that SBP lost significance by adding ON to multivariable models of ischaemic and overall stroke. The interplay between hypertension and derangements in the renin-angiotensin-aldosterone system (RAAS) secondary to chronic kidney disease (CKD) are well known in both diabetes and the population at large,22–23 and early and consistent use of RAAS inhibitors (ACE inhibitors and angiotensin II receptor blockers) have been shown to delay and/or prevent CKD in diabetes.24–25 Similarly, increased non-HDLc levels predicted stroke in our population and the timely addition of statin therapy for T1DM patients with dyslipidaemia has shown clear antithrombotic benefit which translates into reduced rates of stroke.26–27 WBC, as a marker of inflammation, was also predictive of ischaemic stroke, as has been reported in the general population.28–30 Baseline HbA1c was only predictive of haemorrhagic strokes and not ischaemic strokes, in our T1DM cohort. We have shown previously that baseline HbA1c is not as predictive of CAD (i.e. ischaemic heart disease) as other insulin resistance-related factors. 31
When strokes occur in T1DM, they appear to have more detrimental effects on overall health and survival than seen in the general population. In fact, our median survival after incident stroke of 3.8 years is nearly half the median survival of seven years after incident stroke in individuals aged 65–74 in the general population. 20
Our EDC cohort has several strengths for evaluating the predictors of incident stroke and survival after stroke, including its prospective design with biennial examinations prior to stroke, its long-term follow-up to ascertain mortality, and its detailed classification of cause of death by an expert committee, using a standardised protocol to determine the primary and contributing causes of death. 16 Ascertainment of relevant demographic and clinical variables has allowed us to incorporate these into our analysis to minimise confounding. The longitudinal nature of the data also allows the assessment of the effect of progression from normoalbuminuria to renal disease on mortality. Our renal disease data are quite consistent with those published from the FinnDiane study, thus strengthening the overall validity, particularly given the different socioeconomic and healthcare backgrounds from which both cohorts derive.32–33
However, this study has its limitations. First, relatively few (n = 31) strokes occurred during 18 years of follow-up. While we feel this figure is accurate, we are limited in our analyses to simple univariate and exploratory multivariable Cox modelling. These analyses will hopefully provide direction for future studies in T1DM, but should be validated in other large T1DM cohorts. Also, our cohort is hospital-based, which may limit the generalisability of these results; however, a comparison of the EDC study population with the Allegheny County T1DM registry showed our EDC cohort to be epidemiologically representative of the local T1DM population. 34 As MRIs were not available to detect subclinical stroke, these data only capture clinical strokes, thus presenting only part of the stroke picture. Also, we relied on biennial surveys and clinical examinations to ascertain stroke events and only 77% of the strokes could be confirmed by medical/autopsy records. Of the seven stroke events that could not be confirmed, four patients were started on anticoagulant therapy after their stated stroke, suggesting that a stroke might have occurred. In addition, we were unable to gather sufficient clinical data (especially hospital records from strokes occurring in the 1980s and 1990s) to adequately explore predictors of survival after stroke. Finally, the EDC population consists of participants with long-standing diabetes. Thus, these findings partially reflect outdated diabetes management and care and may not be generalisable to individuals recently diagnosed with T1DM, whose experience may more closely resemble that of the DCCT intensive therapy cohort. 35
As with the general population, stroke in T1DM is largely ischaemic and usually not preceded by either a CAD or TIA event. The strongest predictors of stroke in T1DM were diabetes duration and modifiable risk factors, including increased blood pressure (ischaemic and haemorrhagic), dyslipidaemia (ischaemic), poor glycaemic control (haemorrhagic) and ON (ischaemic). Thus, careful diabetes management could minimise or prevent this major complication, which occurs at least 20 years earlier than in the general population.
Footnotes
Acknowledgements
We are indebted to the EDC Study participants for their efforts in helping to understand the natural history of T1DM. Preliminary data were presented at the 68th Annual American Diabetes Association Scientific Sessions in San Francisco, CA in June 2008.
Funding
This work was supported by the National Institute of Diabetes and Digestive and Kidney Diseases (R01-DK034818 and F30-DK082137 for A.M.S.).
Conflict of interests
The authors have no relevant conflicts of interest to disclose.