
Abstract
Objective
To assess the incidence and predictors of hypertension among patients with diabetes attending a diabetes follow-up clinic.
Methods
This institution-based retrospective cohort study was conducted among patients with diabetes who attended a diabetic follow-up clinic at Asella Referral and Teaching Hospital between January 2017 and December 2021. Patients diagnosed with hypertension prior to diabetes, or diagnosed with hypertension at the start of follow-up, were excluded. Data were extracted from medical records and analysed.
Result
A total of 351 patients with diabetes were included. The incidence density rate (IDR) of hypertension during 688.98 person-years of observation was 58.05 per 1000 (95% confidence interval [CI] 42.58, 79.14) person-years. The cumulative incidence of hypertension was 11.4% (95% CI 8.05, 14.7%) over 5 years. The 25th percentile survival time to hypertension development was 4.6 years. Multivariable Cox proportional hazard regression analysis showed that older age (adjusted hazard ratio [HR] 6.24, 95% CI 3.13, 12.45), family history of hypertension (adjusted HR 1.67, 95% CI 1.22, 9.65), comorbidity (adjusted HR 2.20, 95% CI 1.94, 5.21) and higher body mass index (adjusted HR 2.07, 95% CI 1.23, 5.63) were statistically significant predictors of hypertension development.
Conclusion
Among patients with diabetes in Ethiopia, the IDR of hypertension was high; and older age, family history of hypertension, comorbidity and higher body mass index were statistically significant predictors of hypertension development.
Keywords
Introduction
In 2022, the World Health Organization (WHO) defined diabetes as a chronic disease that occurs either when the body cannot effectively use the insulin it produces, or when the pancreas does not produce enough insulin. There are three types of diabetes: type 1 diabetes, which occurs due to deficient insulin production by the pancreas; type 2 diabetes, which results from the body’s ineffective use of insulin produced by the pancreas; and gestational diabetes, which occurs during pregnancy. 1 In 2021, the WHO defined blood pressure as the force exerted on blood vessels by circulating blood. Hypertension, or high blood pressure, is diagnosed when two different day measurements show a reading of systolic blood pressure ≥140 mmHg and diastolic blood pressure ≥90 mmHg. 2
The prevalence of hypertension among patients with type 2 diabetes appears to vary between populations. For example, a Malaysian study published in 2013 reported a prevalence of 92.7%, 3 a Spanish study reported prevalence rates of 89.78% in 2003 and 94.76% in 2009, 4 60.2% was reported in 2007 for a population in Israel, 5 70.5% in an Afghanistan study of patients with type 2 diabetes in 2022, 6 74.6% for patients in Jordan in 2021, 7 25.6% from a study in Karnataka, India in 2014, 8 43% among US patients with type 1 diabetes in 2005, 9 and 89.6% among Iraqi patients with diabetes in 2012. 10 In the developing countries, the prevalence of hypertension among patients with diabetes was found to be 47.6% in a study performed in Sudan in 2021, 11 54.2% in a study from Benin City, Nigeria in 2011, 12 and 66.7% in a study performed in sub-Saharan Africa in 2007. 13 In 2022, the prevalence of hypertension among patients with type 2 diabetes in Ethiopia was reported to be 55%. 14
The presence of hypertension in patients with diabetes highly increases the risk of all causes of mortality. 15 Hypertension is an important public health challenge worldwide, 16 and globally, hypertension is considered the most common risk factor for death. In 2004, hypertension resulted in 7.5 million deaths, 17 in 2012, high blood pressure was reported to result in 7.6 million deaths per annum, 18 and in 2008, hypertension resulted in 57 million disability-adjusted life years worldwide. 19 In India alone, hypertension was responsible for 17.5% of all deaths and 9.7% of disability-adjusted life years by the year 2017. 20 High blood pressure-related mortality is rising in low and middle income countries, with over 80% of this disease burden occurring in low and middle income countries. 18 Hypertension is a major public health problem in Ethiopia, 21 and has been reported to result in 14.% of all medical ward deaths in Addis Ababa. 22 In a study performed in southern Ethiopia, the economic burden of hypertension was found to be 105.55 US dollars per person per month. 23 Hypertension-related complications include stroke, heart failure, aneurysm, dementia, and eye and kidney problems. 24
Globally, death due to diabetes was estimated to be 4.2 million among adults aged 20–79 years in 2020, 25 an increase from 1.281 million in the same age group in 2010. 26 Diabetes resulted in 1.5 million deaths in 2019, which was reported to be a 3% increase in diabetes-related mortality rate between 2000 and 2019. 27 In 2021, diabetes-related mortality rates among adults aged 20–79 were 1 111 201 in Europe and 12 021 in Australia alone. 28 Furthermore, the number of years living with disability due to diabetes increased from 12 412 in 1990 to 20 785 in 2010. 26 In 2017, disability-adjusted life years associated with diabetes was 67.9 million, and is estimated to increase to 79.3 million globally by 2025. 29 The global economic burden of diabetes is estimated to increase from 1.3 trillion US dollars in 2015 to 2.5 trillion US dollars according to past trends, 2.2 trillion US dollars as a baseline, or 2.1 trillion US dollars as a target scenario by the year 2030. 30 According to a 2010 study, the average annual cost per case of diabetes was 9 677 US dollars for type 2 diabetes and 14 856 US dollars for type 1 diabetes. 31
Diabetes mellitus is also a public health problem in developing countries. 32 In 2020, an estimated 6.8% of deaths among adults aged 20–79 years in the Africa region were estimated to be due to diabetes. 25 In lower to middle-income countries, the diabetes-associated mortality rate increased by 13% between 2000 and 2019. 27 In 2021, mortality rates due to diabetes among adults aged 20–79 were 416 163 in Africa, 21 749 in Algeria, and 11 173 in Angola, 28 and 255 (32.5%) in Nigeria in 2010. 33 In Ethiopia, there were 16 258 deaths due to diabetes (2.88% of total deaths in Ethiopia) according to the WHO (2020). 34 In low and middle income countries, the age-standardized disability-adjusted life-year rate due to diabetes increased from 628.3 per 100 000 person-years in 1990 to 801.5 per 100 000 person-years in 2019. 35 In addition, a 2009 study showed that diabetes has resulted in a total economic loss of Int$25.51 billion in Africa regions. 36
In spite of its preventability, the incidence of hypertension among patients with diabetes is increasing globally. This is a critical issue that needs to be addressed by all concerned bodies. However, to the best of the author’s knowledge, there are no studies addressing the incidence and predictors of hypertension among diabetes patients attending a diabetic follow-up clinic in the study setting, and this topic is not well-studied generally. Therefore, to address this gap, the present study was conducted to assess the incidence and predictors of hypertension among diabetes patients attending a diabetic follow-up clinic at Asella Referral and Teaching Hospital, Asella, Oromia Regional State, Ethiopia.
Patients and methods
Study setting and population
This 5-year, retrospective cohort study was conducted in Asella Referral and Teaching Hospital, located in Asella town, in the Arsi Zone, Oromia Regional state, Ethiopia, 126 km south of Addis Ababa. Asella retains some administrative functions as the seat of the present Arsi Zone, and in the 2007 national census, was reported to have a total population of 67 269, of whom 33 826 were men and 33 443 were women. Asella Referral and Teaching Hospital is a governmental hospital serving for both patient care services and teaching purposes, 37 providing a variety of healthcare services, including in the medical, surgical, paediatric, and gynaecological fields.
The study was performed between March 2022 and April 2022 by extracting data from the medical chart records of patients diagnosed with diabetes who were enrolled to attend the medical diabetes follow-up clinic at Asella Referral and Teaching Hospital between January 2017 and December 2021.
Eligibility criteria
All patients with diabetes aged ≥18 years were eligible for study inclusion. Exclusion criteria comprised the following: patients with incomplete medical charts, patients whose medical charts were missing at the time at the time of data collection, patients who were diagnosed with hypertension at the beginning of the follow-up, and/or patients with a medical-chart record of hypertension before diagnosis of diabetes.
Study design
This retrospective cohort study was conducted according to the ‘Strengthening the Reporting of Observational Studies in Epidemiology (STROBE) statement: guidelines for reporting observational studies’. 38
Sample size determination
Sample size for the incidence of hypertension among patients with diabetes attending a diabetes follow-up clinic was estimated using a formula for a single population proportion, where: p = proportion of patients with diabetes reported to have developed hypertension (29%) in a previous study from the Gurage Zone, Ethiopia; 39 d = margin of error (5%); z(α/2) = 95% confidence level (CI) (1.96); N = total number of patients with diabetes registered with the follow-up clinic at Asella Referral and Teaching hospital (885); and n = required sample size. As the number of patients with diabetes patients registered with the follow up clinic was <10 000, a correction formula was used. Finally, by adding 10% for incomplete medical chart data, the final sample size was calculated to be 257 patients.
Sample size for predictors of hypertension among patients with diabetes attending a diabetic follow-up clinic was determined using a double population proportion formula. Predictors, such as age, body mass index (BMI), type of diabetes, presence of comorbidity, and drug adherence, were taken from a previously published study conducted at the Gurage Zone, Ethiopia. 39 The sample size for these predictors was calculated using the Epi Info™, version 7.2.2.6 (https://www.cdc.gov/epiinfo/) StatCalc tool, where: P1 is the percent of patients exposed to the outcome; P2 is the percent of patients not exposed to the outcome; Z α/2 is the 95% CI; Z_β is the 80% power; r is the ratio of non-exposed to exposed 1:1. After calculating for all listed predictors, the highest sample size was obtained for the predictor ‘presence of comorbidity’, which was 604 patients. As the total population was 885 patients, which is <10 000, the correction formula was used. By adding 10% for incomplete medical chart data, the final sample size was calculated to be 396 patients. After comparing the two sample sizes, a sample size of 396 was used for the present study.
Sampling technique and procedure
The eligibility criteria were checked against patient’s medical chart records, and all patients with diabetes who attended the medical follow-up clinic between January 2017 and December 2021 were deemed eligible for study inclusion. A systematic sampling technique was used to select study participants, as follows: A regular interval kth was calculated and found to be 2. The number of the first patient to be included in the sample was randomly selected from one out of two pieces of paper (numbered one and two, to represent the first two patient’s medical records). Number two was randomly chosen, and thereafter, patients were selected according to a regular interval of 2.
Study variables
The dependent variable was survival time to hypertension development. The independent variables comprised age, sex, residency, family history of diabetes, family history of hypertension, presence of infection, drug adherence, type of diabetes mellitus diagnosed, presence of comorbidity, duration of diabetes, diabetes status during the last contact, glycaemic control and BMI.
Operational definitions
Survival status: the status of a patient during their last contact, which could be event or censored. Event: the development of hypertension. Censored: patients who did not develop hypertension during the course of study, lost or withdrawn from follow-up, transferred due to medical or other reasons, died before developing hypertension, or discharged against medical advice were considered censored. Beginning date: the date on which the patient was diagnosed diabetes mellitus. End date: the date on which the patient developed hypertension or was censored, whichever came first. Survival time: the length of time from diagnosis of diabetes to development of hypertension, calculated as the end date minus the beginning date. Hypertension: physician statement of hypertension diagnosis on medical chart records. BMI: calculated using the patient’s weight and height and categorized according to the WHO classification as either underweight (<18.5 kg/m2), normal weight (18.5–24.9 kg/m2), overweight (25.0–29.9 kg/m2), or obese (≥30.0 kg/m2).
40
Drug adherence: adherence to antidiabetic medications was defined as taking more than 80% of the prescribed treatment,
39
categorized as good adherence if a patient took a prescribed antidiabetic medication and only lost ≤2 of the prescribed medications within a single year, or poor adherence if a patient lost >2 of the prescribed antidiabetic medication per a single year. Glycaemic control: HbA1c level < 6.5% was classified as good glycaemic control and HbA1c level ≥6.5% was classified as poor glycaemic control, based on recommendations of the American Diabetes Association for non-pregnant adults.
41
Data collection tool, procedure and quality assurance
Data were extracted from patient’s medical chart records using a data extraction checklist, developed from previously published studies.39,42–45 Data were extracted by three nurses and during extraction, all patient details were de-identified. This study was supervised by one nurse (ADW) who was qualified to MSc level in adult health nursing.
To help ensure the quality of collected data, the data extraction format was pretested on 5% of the sample size prior to the study data collection date; data collectors underwent one day of training on the data collection tool and its procedure; and the completeness of each collected dataset was checked at the time of extraction.
Statistical analyses
Data were cleared, checked, coded and entered into EpiData Entry software, version 4.2.0.0 and then exported for analysis into Stata software, version 14.2 (Stata.com). Correlations between predictors were checked using a multicollinearity test, and no sign of multicollinearity was found, based on criteria applied to the variance inflation factor. The largest variance inflation factor of the predictors was 1.17. Descriptive statistics were used to assess variables included in the present study. Incidence density rate (IDR) and cumulative incidence were calculated. Kaplan-Meier survival estimation was performed to determine the rate of survival probability. To test for equality of survival functions among different categorical predictors, a Kaplan-Meier survival curve and log-rank test were performed.
Schoenfeld and scaled Schoenfeld residuals were used to check and test the Cox proportional hazards assumption, which is a goodness-of-fit test approach. Predictors with a P-value > 0.05 were considered as fulfilling the Cox proportional hazard model assumption. Cox–Snell residual was used to determine the overall model fit. Bivariable and multivariable Cox proportional hazard regression analysis was performed. At the initial stage, bivariable Cox proportional hazard regression analysis and predictors with a P-value < 0.25 were considered for multivariable Cox proportional hazard regression analysis. Results are presented as crude hazard ratio (HR) and adjusted HR, with 95% CIs. A P-value <0.05 was considered to be statistically significant.
Ethics approval and informed consent
The study was approved by the Ethical Review and Research Committee of the Nursing Department, College of Health Sciences, Arsi University, and permission to conduct the study was received from the Asella Referral and Teaching Hospital concerned body prior to study commencement. The requirement for informed consent was waived by the Ethical Review and Research Committee of the Nursing Department, College of Health Sciences, Arsi University, due to the retrospective study design and as the study depended on secondary data collected from patients’ medical charts. All methods were performed in accordance with the ethical standards as laid down in the Declaration of Helsinki and its later amendments or comparable ethical standards.
Results
Sociodemographic and clinical characteristics
The medical charts from a total of 351 patients with diabetes were enrolled into this study (representing 88.64% of the calculated sample size). More than half of the patients (214 [60.97%]) were male, and the majority of patients (293 [(83.48%]) were aged < 60 years (Table 1); 78 patients (22.22%) had a family history of diabetes, and 12 patients (3.42%) had a family history of hypertension. Presence of comorbidity was recorded for 33 (9.4%) of the patients. The clinical-related characteristics are summarised in Table 2.
Sociodemographic characteristics of 351 patients with diabetes who attended a diabetic follow-up clinic at Asella Referral and Teaching Hospital, Asella, Ethiopia, between January 2017 and December 2021.

Clinical-related characteristics of 351 patients with diabetes who attended a diabetic follow-up clinic at Asella Referral and Teaching Hospital, Asella, Ethiopia, between January 2017 and December 2021.

Survival status
The IDR of hypertension among 351 patients with diabetes was found to be 58.05 per 1000 person-year (95% CI 42.58, 79.14), and the cumulative incidence was found to be 11.4% (95% CI 8.05, 14.7) over the 5-year follow-up period.
During the 5-year follow-up period, 40/351 patients (11.4%) developed hypertension. A total of 311 patients (88.60%) were considered censored: 148 patients (47.59%) were withdrawn from follow-up, 56 (18.01%) were lost to follow-up, 95 (30.55%) did not develop hypertension, six (1.93%) transferred to another health centre, five (1.61%) discharged against medical advice, and one patient (0.32%) died.
IDR of hypertension among different patient subgroups
The IDR of hypertension was calculated for each group of predictors (Table 3). Patients aged ≥60 years were found to have a higher IDR of hypertension (27.2 per 100 person-years) compared with those aged <60 years (2.96 per 100 person years); male patients with diabetes exhibited a higher IDR of hypertension (6.99 per 100 person-years) than female patients (3.84 per 100 person-years); and patients with diabetes who have a family history of hypertension had a higher IDR of hypertension (23.1 per 100 person-years) than those without family history of hypertension (5.2 per 100 person-years).
Incidence density rate (IDR) of hypertension among subgroups of 351 patients with diabetes who attended a diabetic follow-up clinic at Asella Referral and Teaching Hospital, Asella, Ethiopia, between January 2017 and December 2021.

BMI, body mass index; CI, confidence interval.
Time to hypertension development
The mean and median follow-up period was 1.96 years and 1.71 years, respectively. The median survival time could not be determined for the present study. However, the 25th percentile survival time for patients with diabetes was 4.57 years. The restricted mean survival time was 4.33 years (95% CI 4.14, 4.51).
Overall survival function
From the Kaplan-Meier survival estimation, the overall estimated survival rate for the development of hypertension after diagnosis of diabetes was 70.23% (95% CI 53.67, 81.82) at 5 years of follow-up. The estimated cumulative survival rate for the development of hypertension was 94.32 (95% CI 91.12, 96.39), 84.90 (95% CI 79.11, 89.19) and 70.23% (95% CI 53.67, 81.82) at 1, 3, and 5 years, respectively (Figure 1).
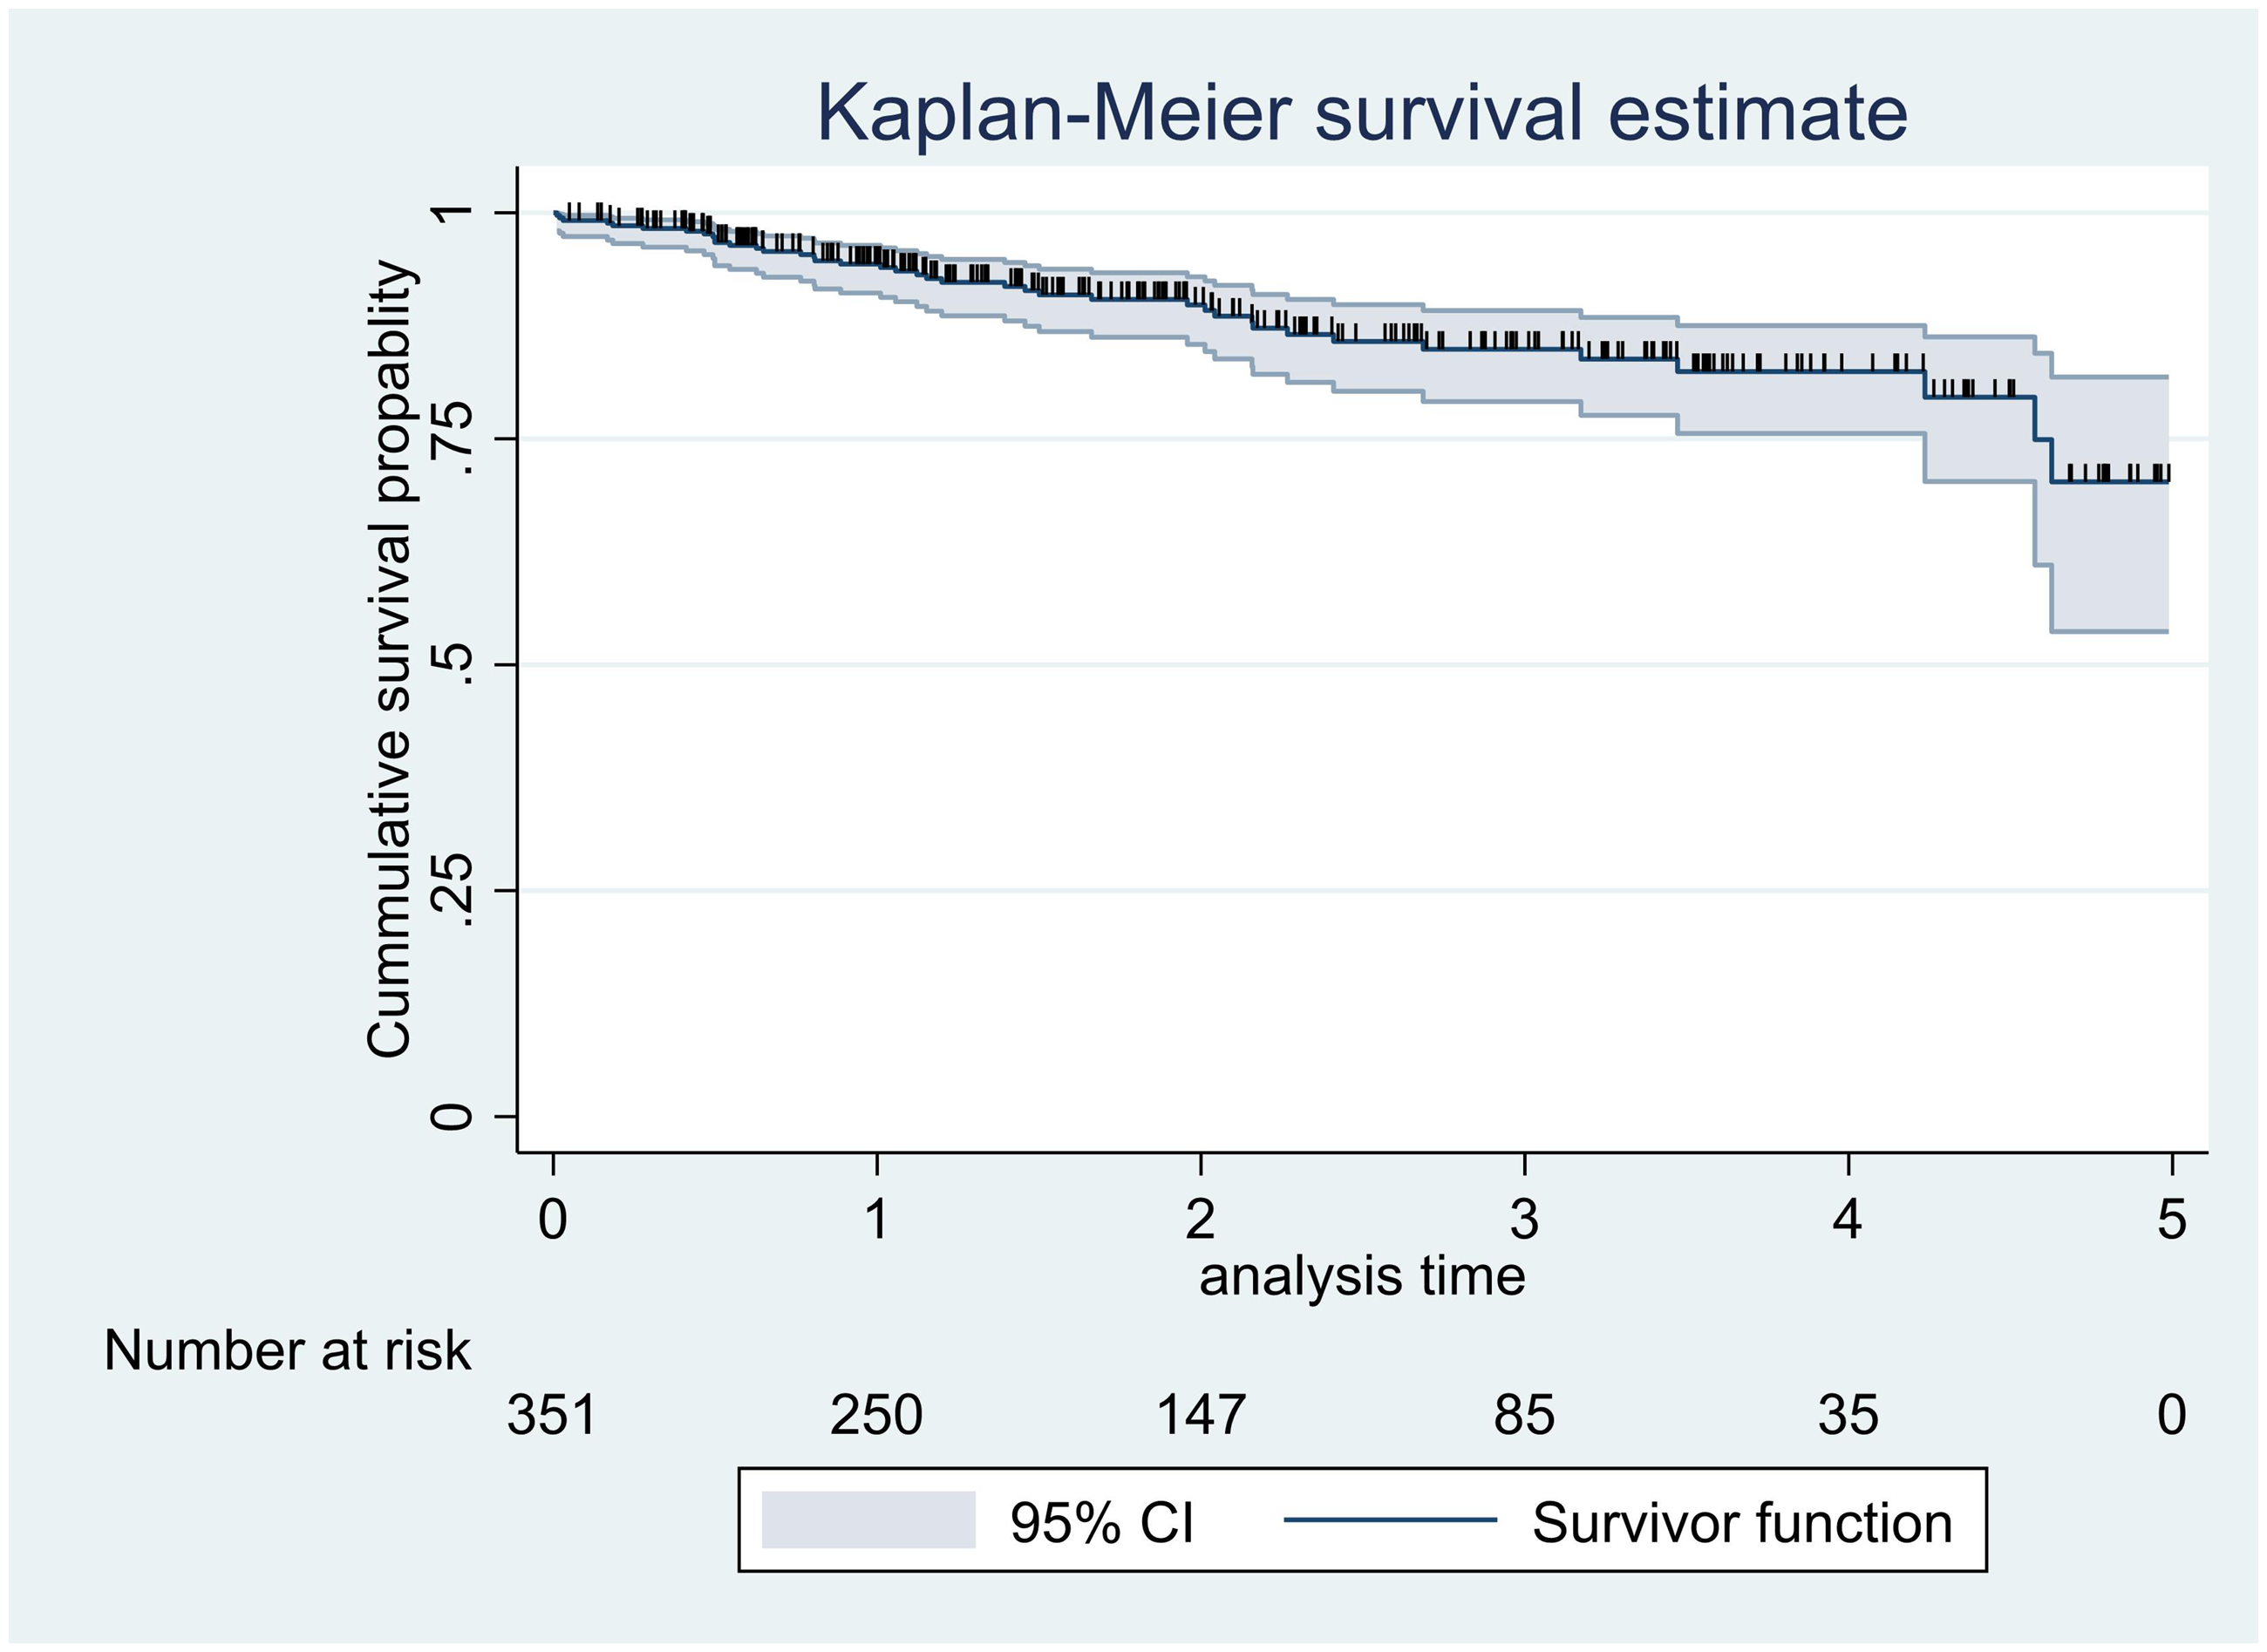
Overall Kaplan–Meier estimation of survival function in 351 patients with diabetes who attended a diabetic follow-up clinic at Asella Referral and Teaching Hospital, Asella, Ethiopia, between January 2017 and December 2021. CI, confidence interval.
Survival function among different predictors
The equality of survival function between different subgroups was checked among different categorical variables by performing log-rank tests, which were performed to determine the presence of statistically significant differences in survival time between different subgroups. The Kaplan–Meier survival function plot was generated for the subgroups to show the probability of survival time.
Patient age
The log-rank test results for age subgroups revealed a statistically significant difference in survival time between age groups (X2 = 71.85, df = 1, and P < 0.001). Patients with diabetes aged <60 years displayed a higher probability of survival time than patients with diabetes aged ≥60 years, thus, the null hypothesis was rejected (Figure 2).

Kaplan–Meier survival function in 351 patients with diabetes who attended a diabetic follow-up clinic at Asella Referral and Teaching Hospital, Asella, Ethiopia, between January 2017 and December 2021, categorized according to age <60 years or ≥60 years. Survival time, years.
Family history of hypertension
The log-rank test results for family history of hypertension revealed a statistically significant difference in survival time between subgroups with or without family history of hypertension (X2 = 11.29, df = 1, P < 0.001). Patients with diabetes who had no family history of hypertension displayed a greater probability of survival time than patients with diabetes who have a family history of hypertension, thus, the null hypothesis was rejected (Figure 3).
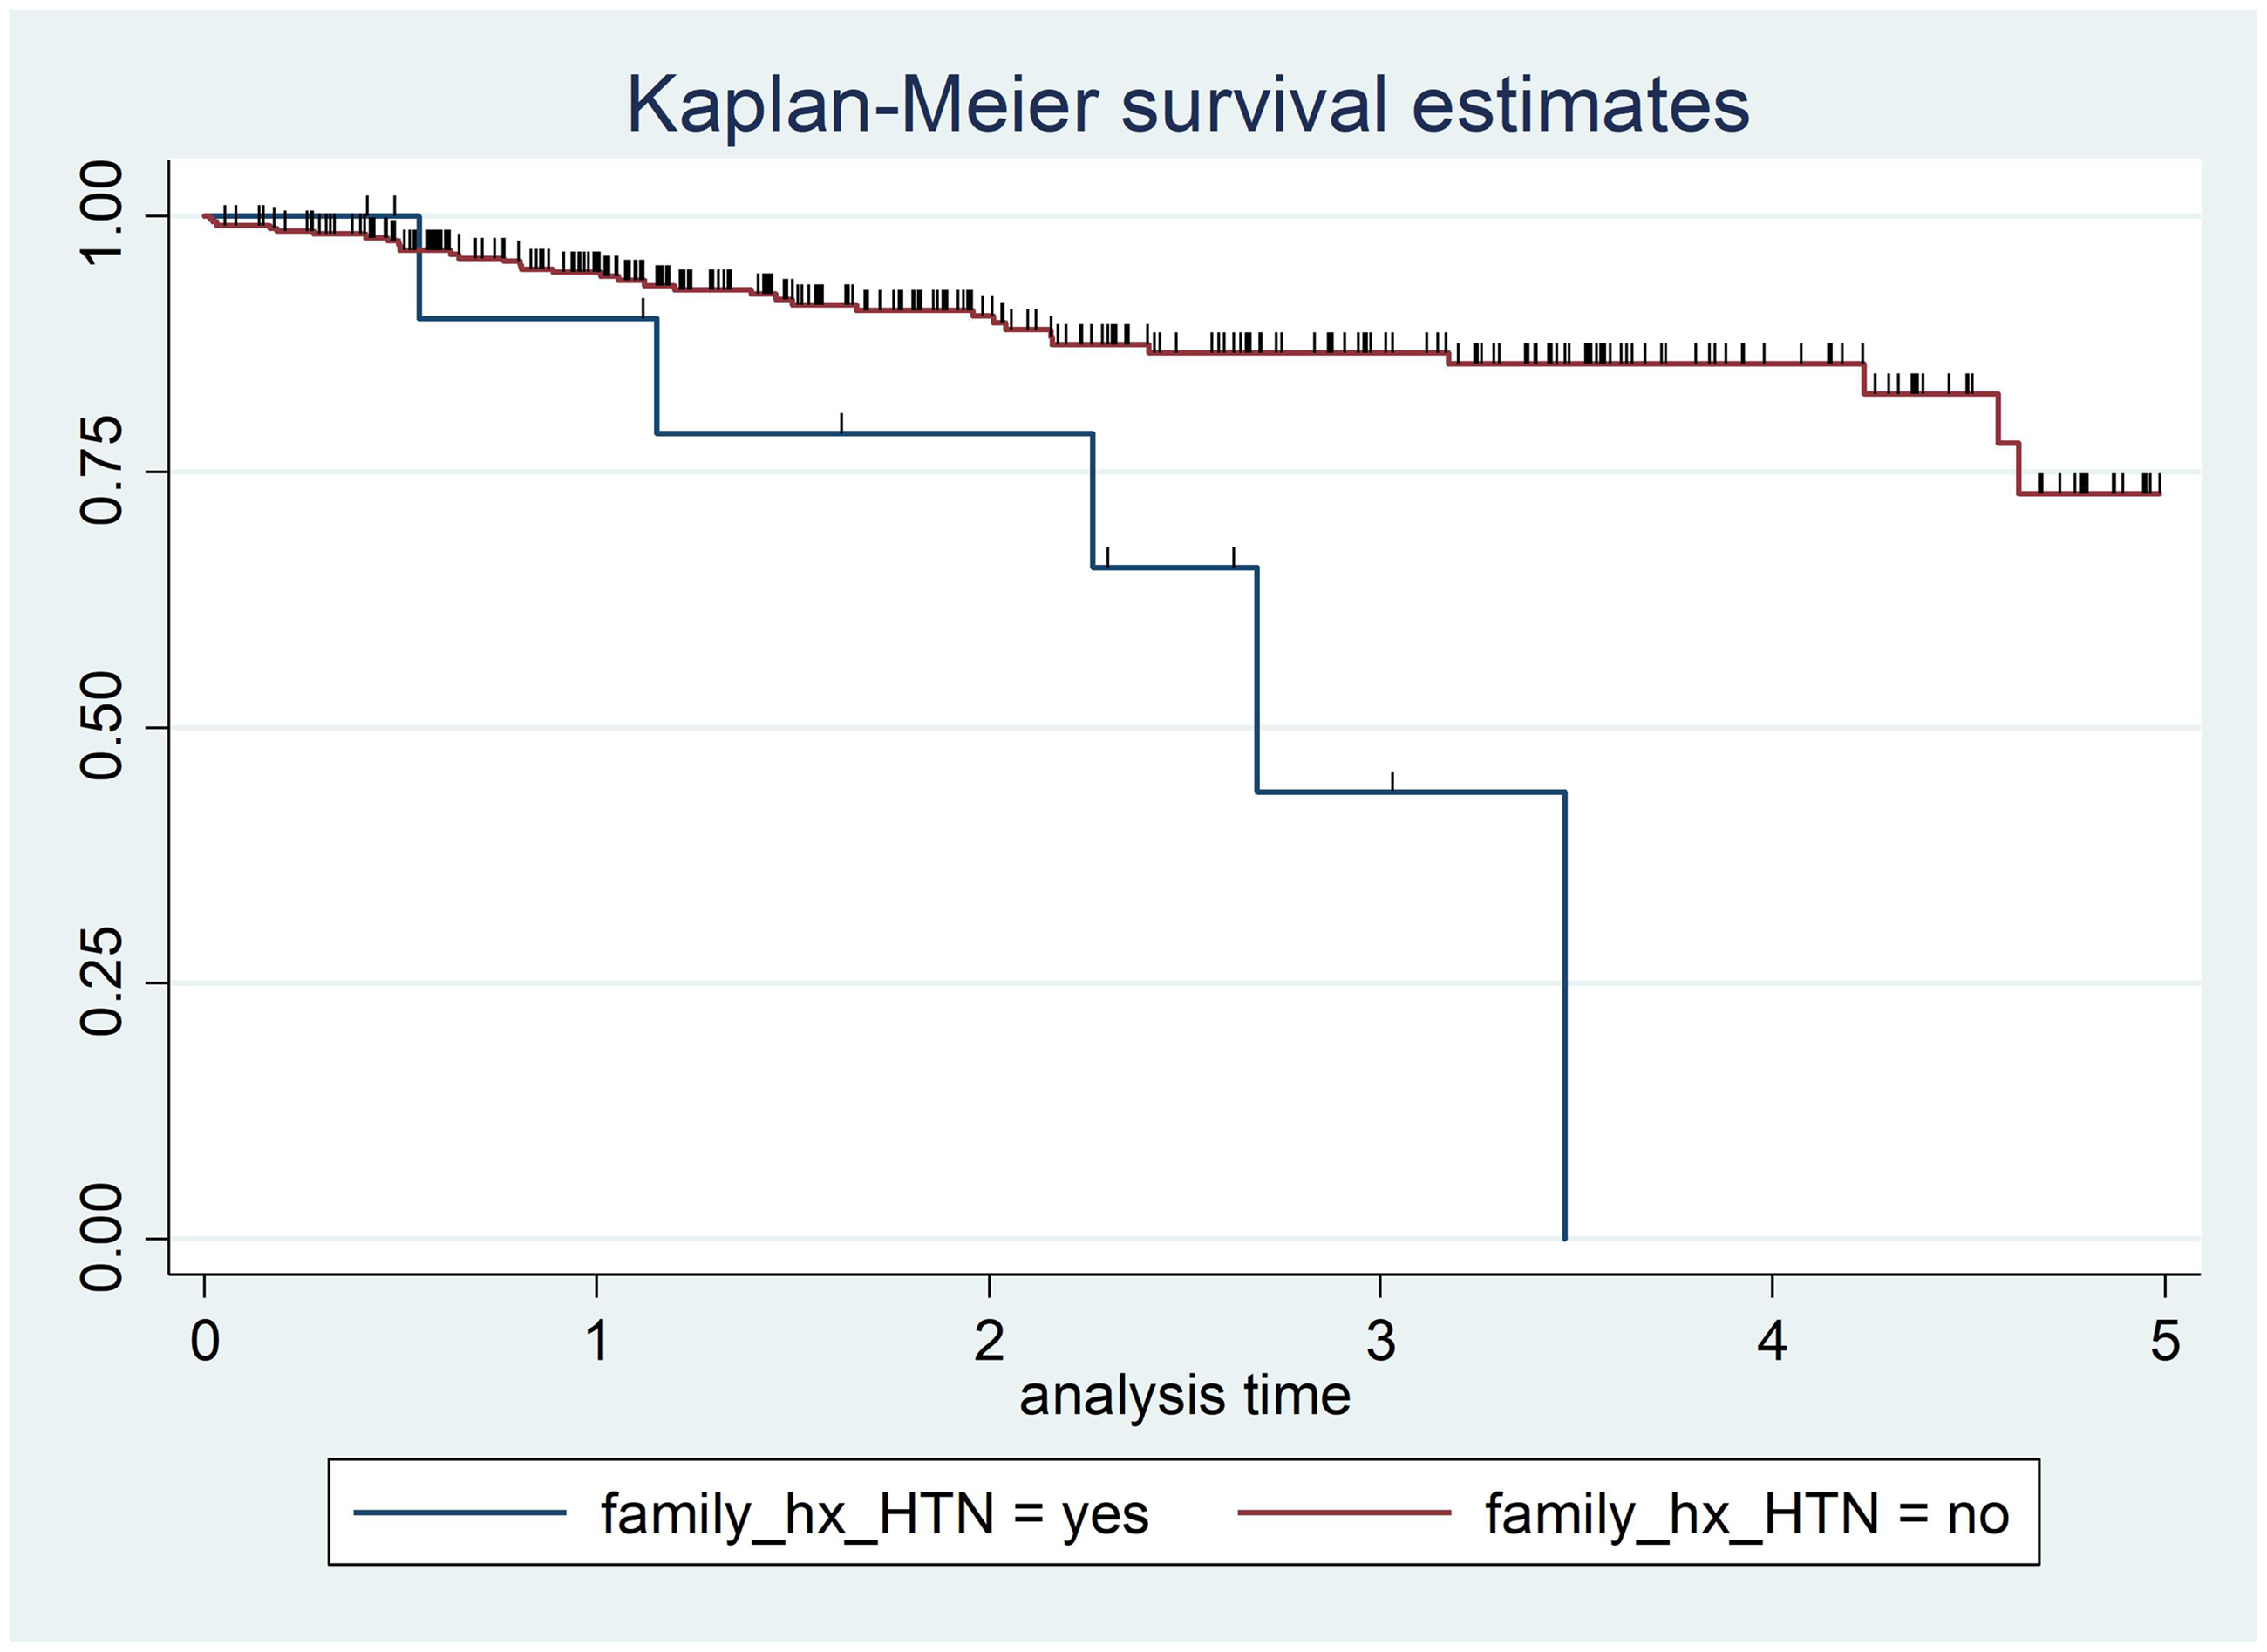
Kaplan–Meier survival function in 351 patients with diabetes who attended a diabetic follow-up clinic at Asella Referral and Teaching Hospital, Asella, Ethiopia, between January 2017 and December 2021, categorized according to family history of hypertension (family_hx_HTN). Survival time, years.
Presence of comorbidity
The log-rank test results for presence of comorbidity revealed a statistically significant difference in survival time between subgroups with or without comorbidity (X2 = 9.99, df = 1, P = 0.002). Patient with diabetes who had no comorbidity had a greater probability of survival time than patients with diabetes and comorbidity, thus, the null hypothesis was rejected (Figure 4).
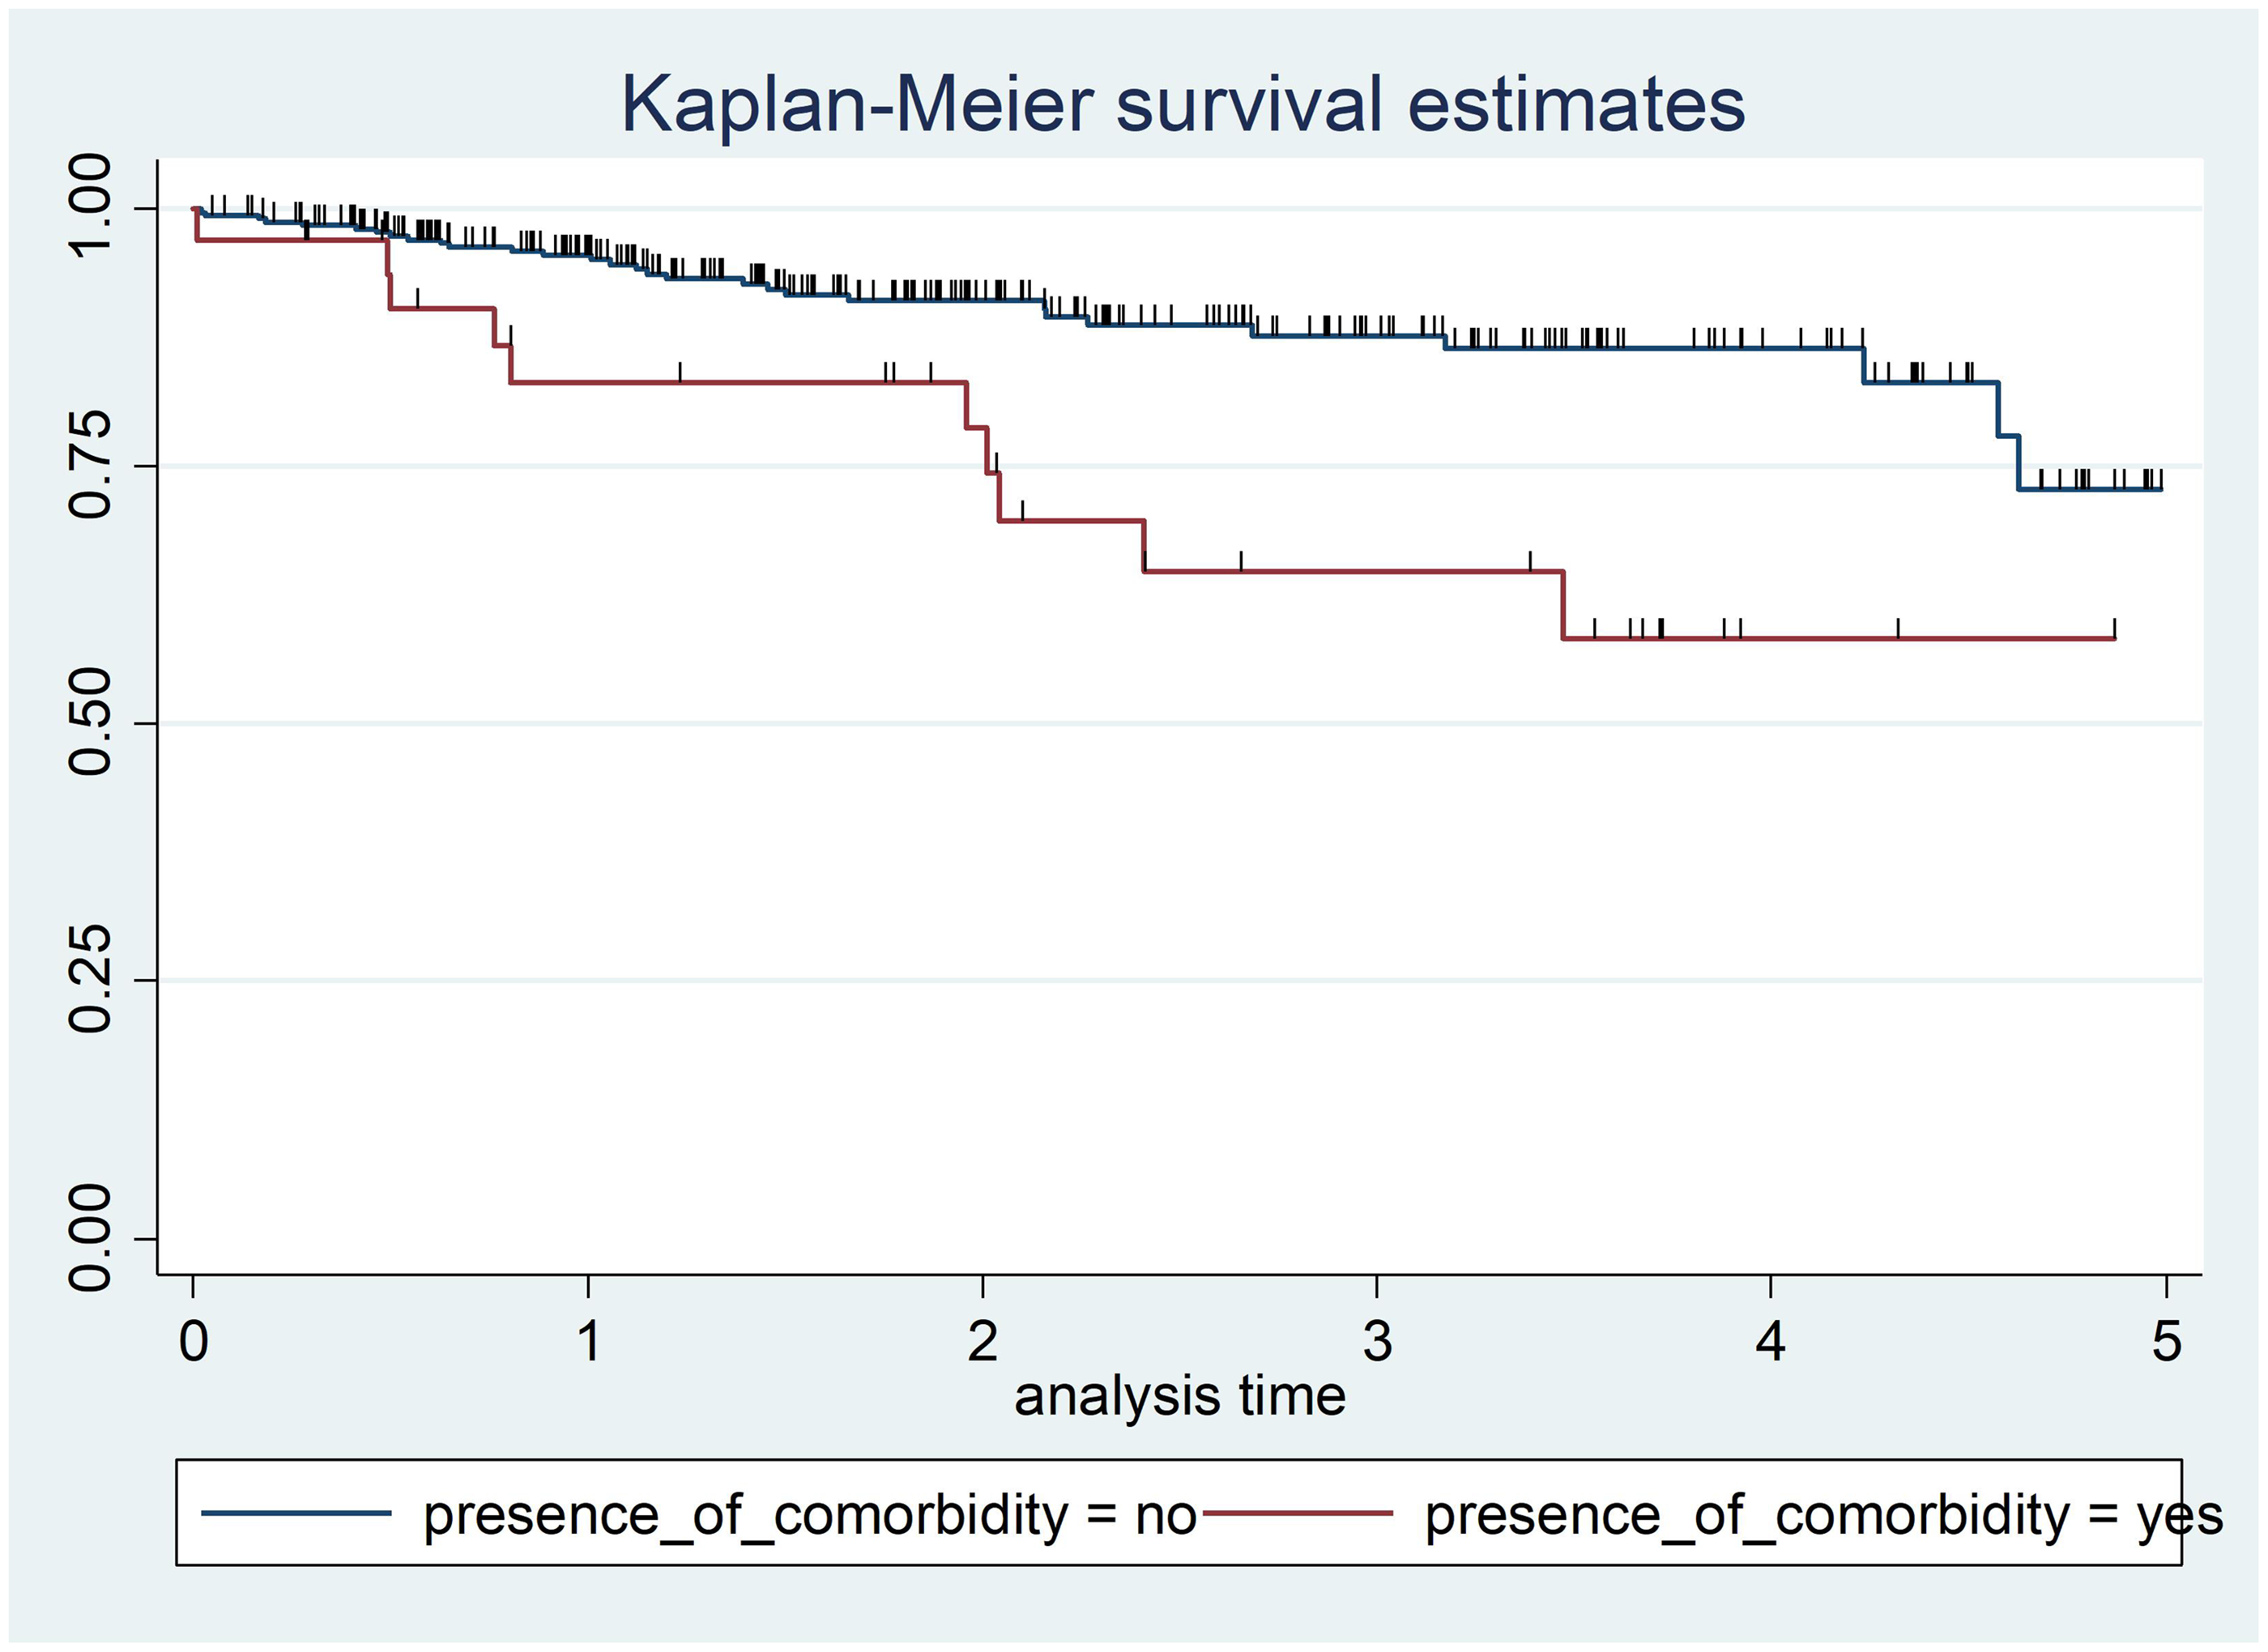
Kaplan–Meier survival function in 351 patients with diabetes who attended a diabetic follow-up clinic at Asella Referral and Teaching Hospital, Asella, Ethiopia, between January 2017 and December 2021, categorized according to presence of comorbidity. Survival time, years.
Antidiabetic medication taken
The log-rank test results for antidiabetic agents revealed a statistically significant difference in survival time between type of antidiabetic medication taken (X2 = 13.60, df = 1, P < 0.001). Taking both oral antidiabetic medication and insulin by injection was associated with a greater probability of survival time than taking oral antidiabetic agents only, thus, the null hypothesis was rejected (Figure 5).

Kaplan–Meier survival function in 351 patients with diabetes who attended a diabetic follow-up clinic at Asella Referral and Teaching Hospital, Asella, Ethiopia, between January 2017 and December 2021, categorized according to antidiabetic agent taken (AntiDM_taken). Survival time, years.
Presence of infection
The log-rank test results for presence of infection revealed a statistically significant difference in survival time between presence or absence of infection (X2 = 10.21, df = 1, P = 0.001). Patients with diabetes who had no infection had a greater probability of survival time than those with infection, thus, the null hypothesis was rejected (Figure 6).
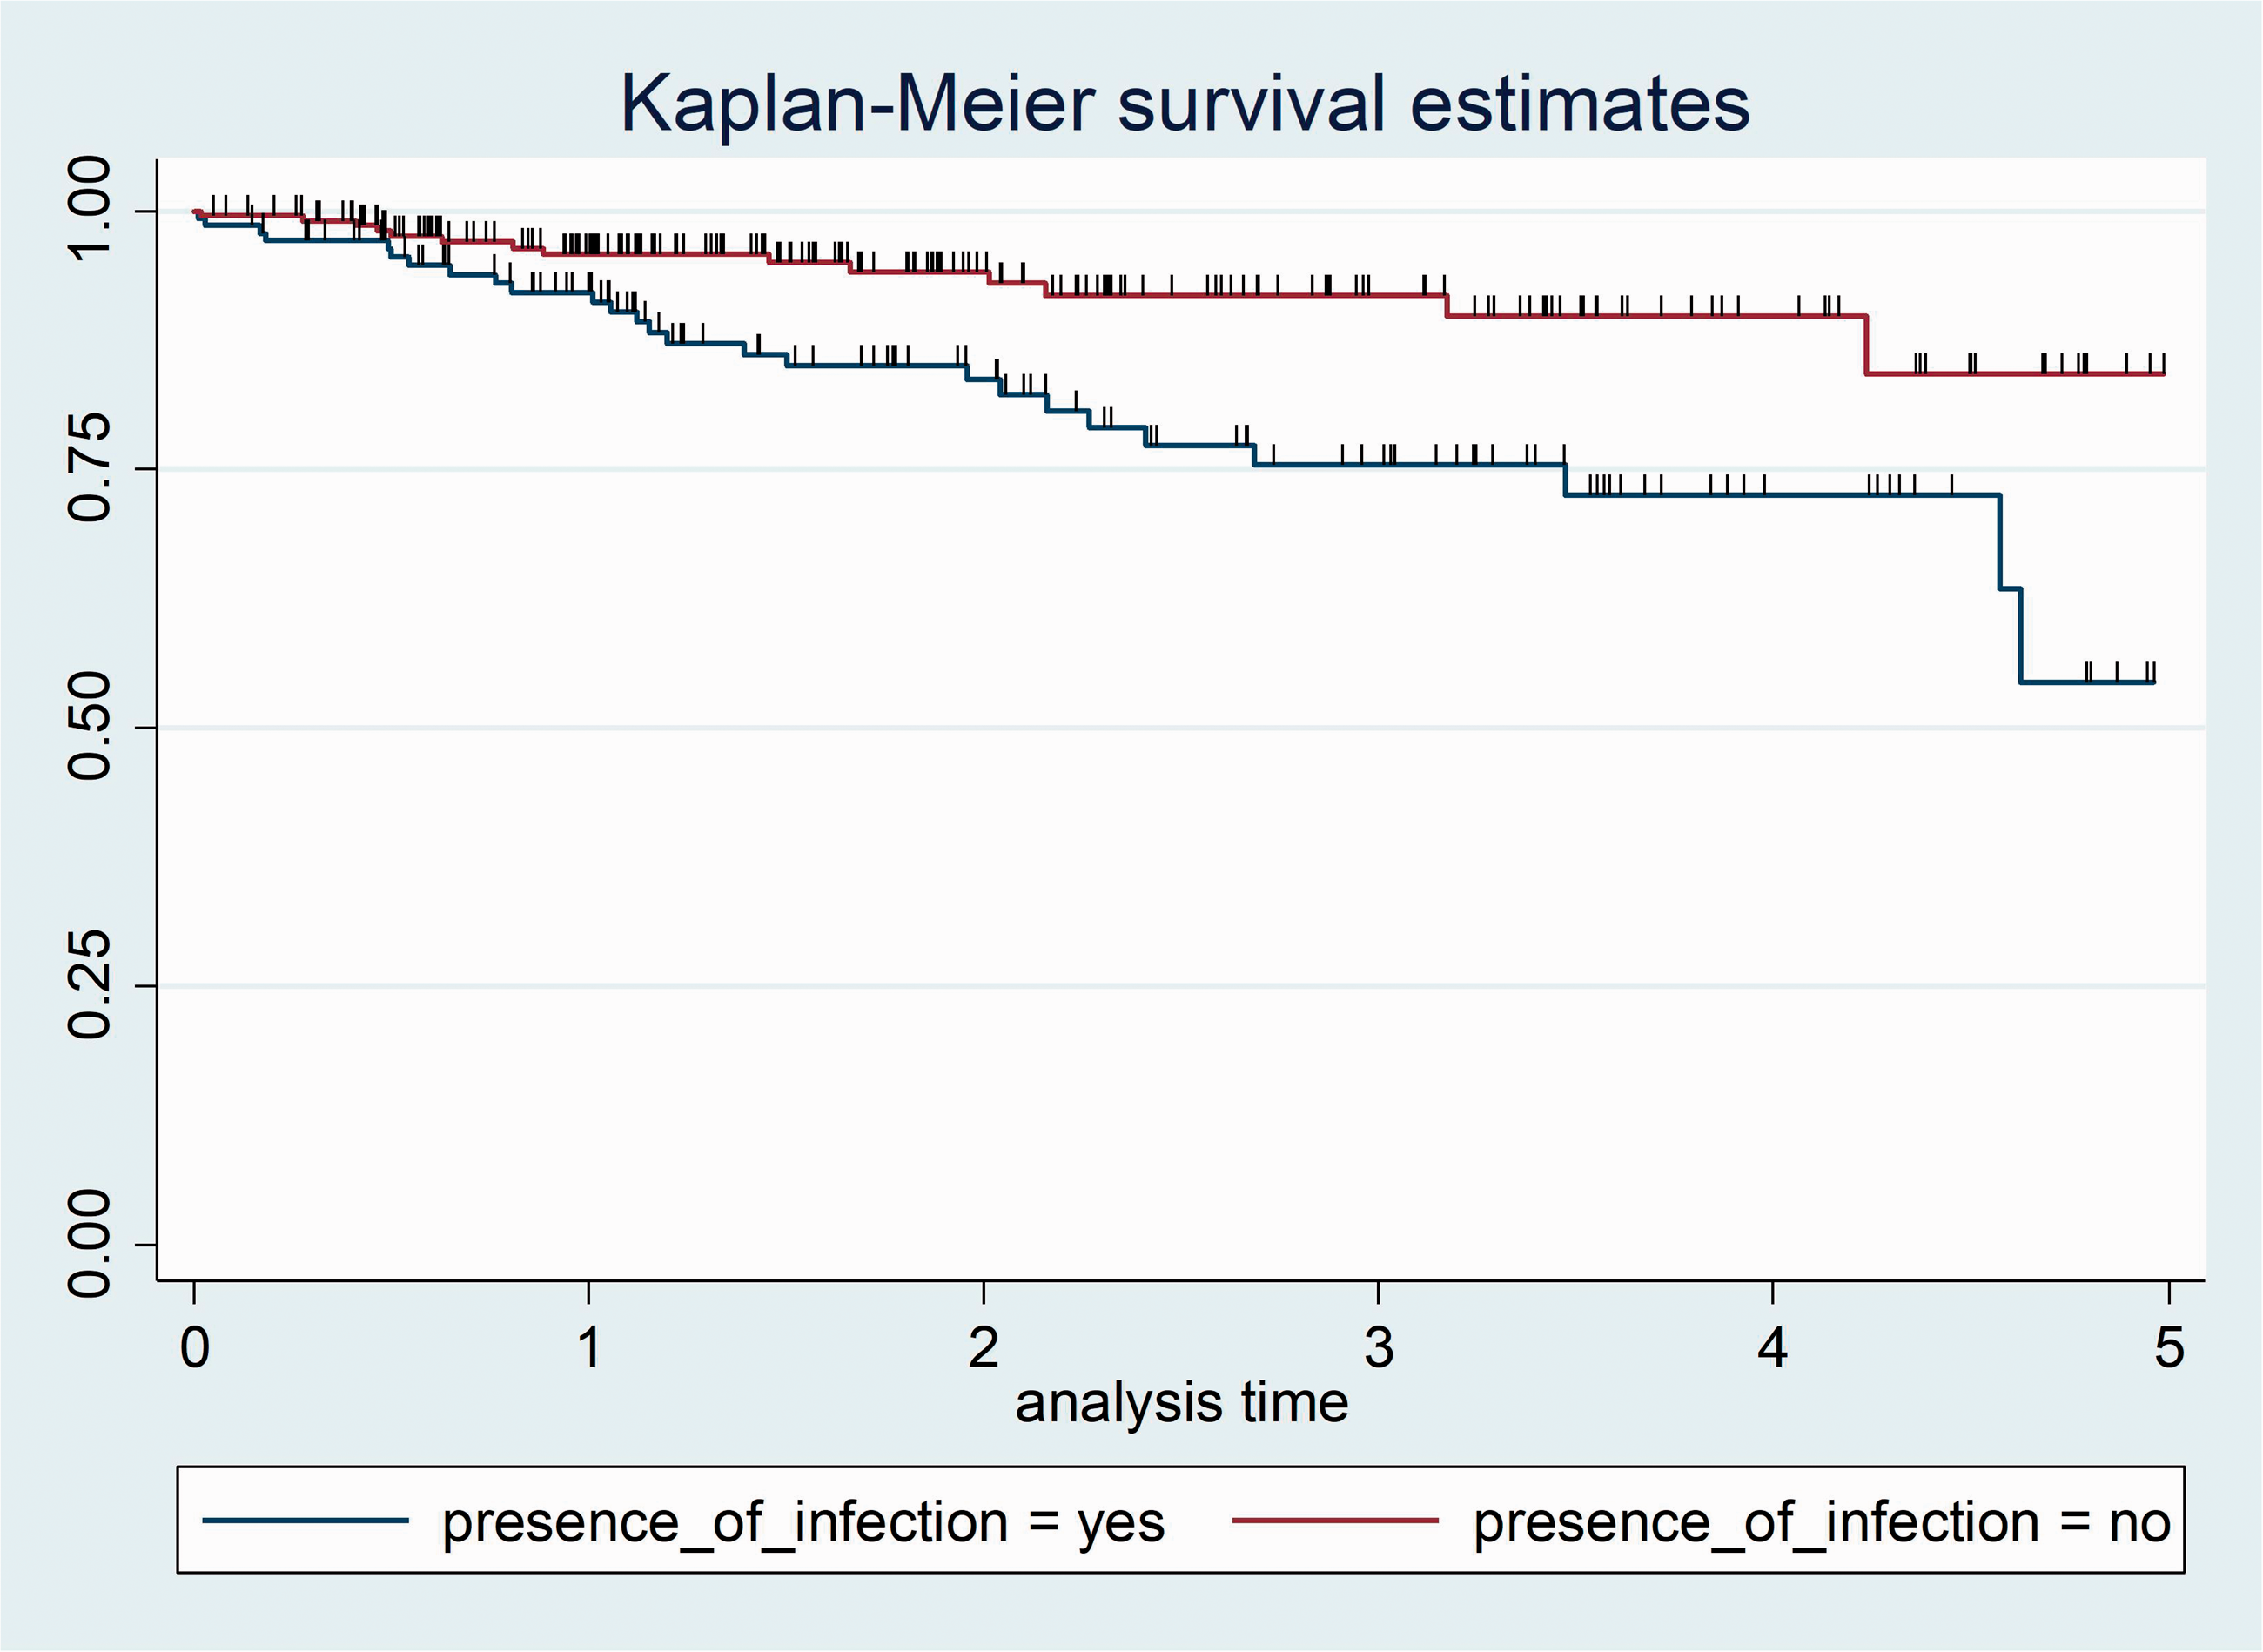
Kaplan–Meier survival function in 351 patients with diabetes who attended a diabetic follow-up clinic at Asella Referral and Teaching Hospital, Asella, Ethiopia, between January 2017 and December 2021, categorized according to presence of infection. Survival time, years.
Drug adherence
The log-rank test results for drug adherence revealed no statistically significant difference in survival time between poor and good drug adherence (X2 = 2.70, df = 1, P = 0.101). Patients with diabetes whose drug adherence level was poor or good showed the same probability of survival time, thus, the test failed to reject the null hypothesis (Figure 7).

Kaplan–Meier survival function in 351 patients with diabetes who attended a diabetic follow-up clinic at Asella Referral and Teaching Hospital, Asella, Ethiopia, between January 2017 and December 2021, categorized according to drug adherence level. Survival time, years.
Glycaemic control
The log-rank test to check the equality of survival function for glycaemic control revealed no statistically significant difference in survival time between poor and good glycaemic control (X2 = 2.70, df = 1, P = 0.101). Patients with diabetes whose glycaemic control level was poor or good displayed the same probability of survival time, thus, the test failed to reject the null hypothesis (Figure 8).

Kaplan–Meier survival function in 351 patients with diabetes who attended a diabetic follow-up clinic at Asella Referral and Teaching Hospital, Asella, Ethiopia, between January 2017 and December 2021, categorized according to glycaemic control level. Survival time, years.
Gender
The log-rank test to check the equality of survival function according to sex revealed no statistically significant difference in survival time between male or female patients (X2 = 2.84, df = 1, P = 0.0917). Male and female patients with diabetes exhibited the same probability of survival time, thus, the null hypothesis was not rejected (Figure 9).
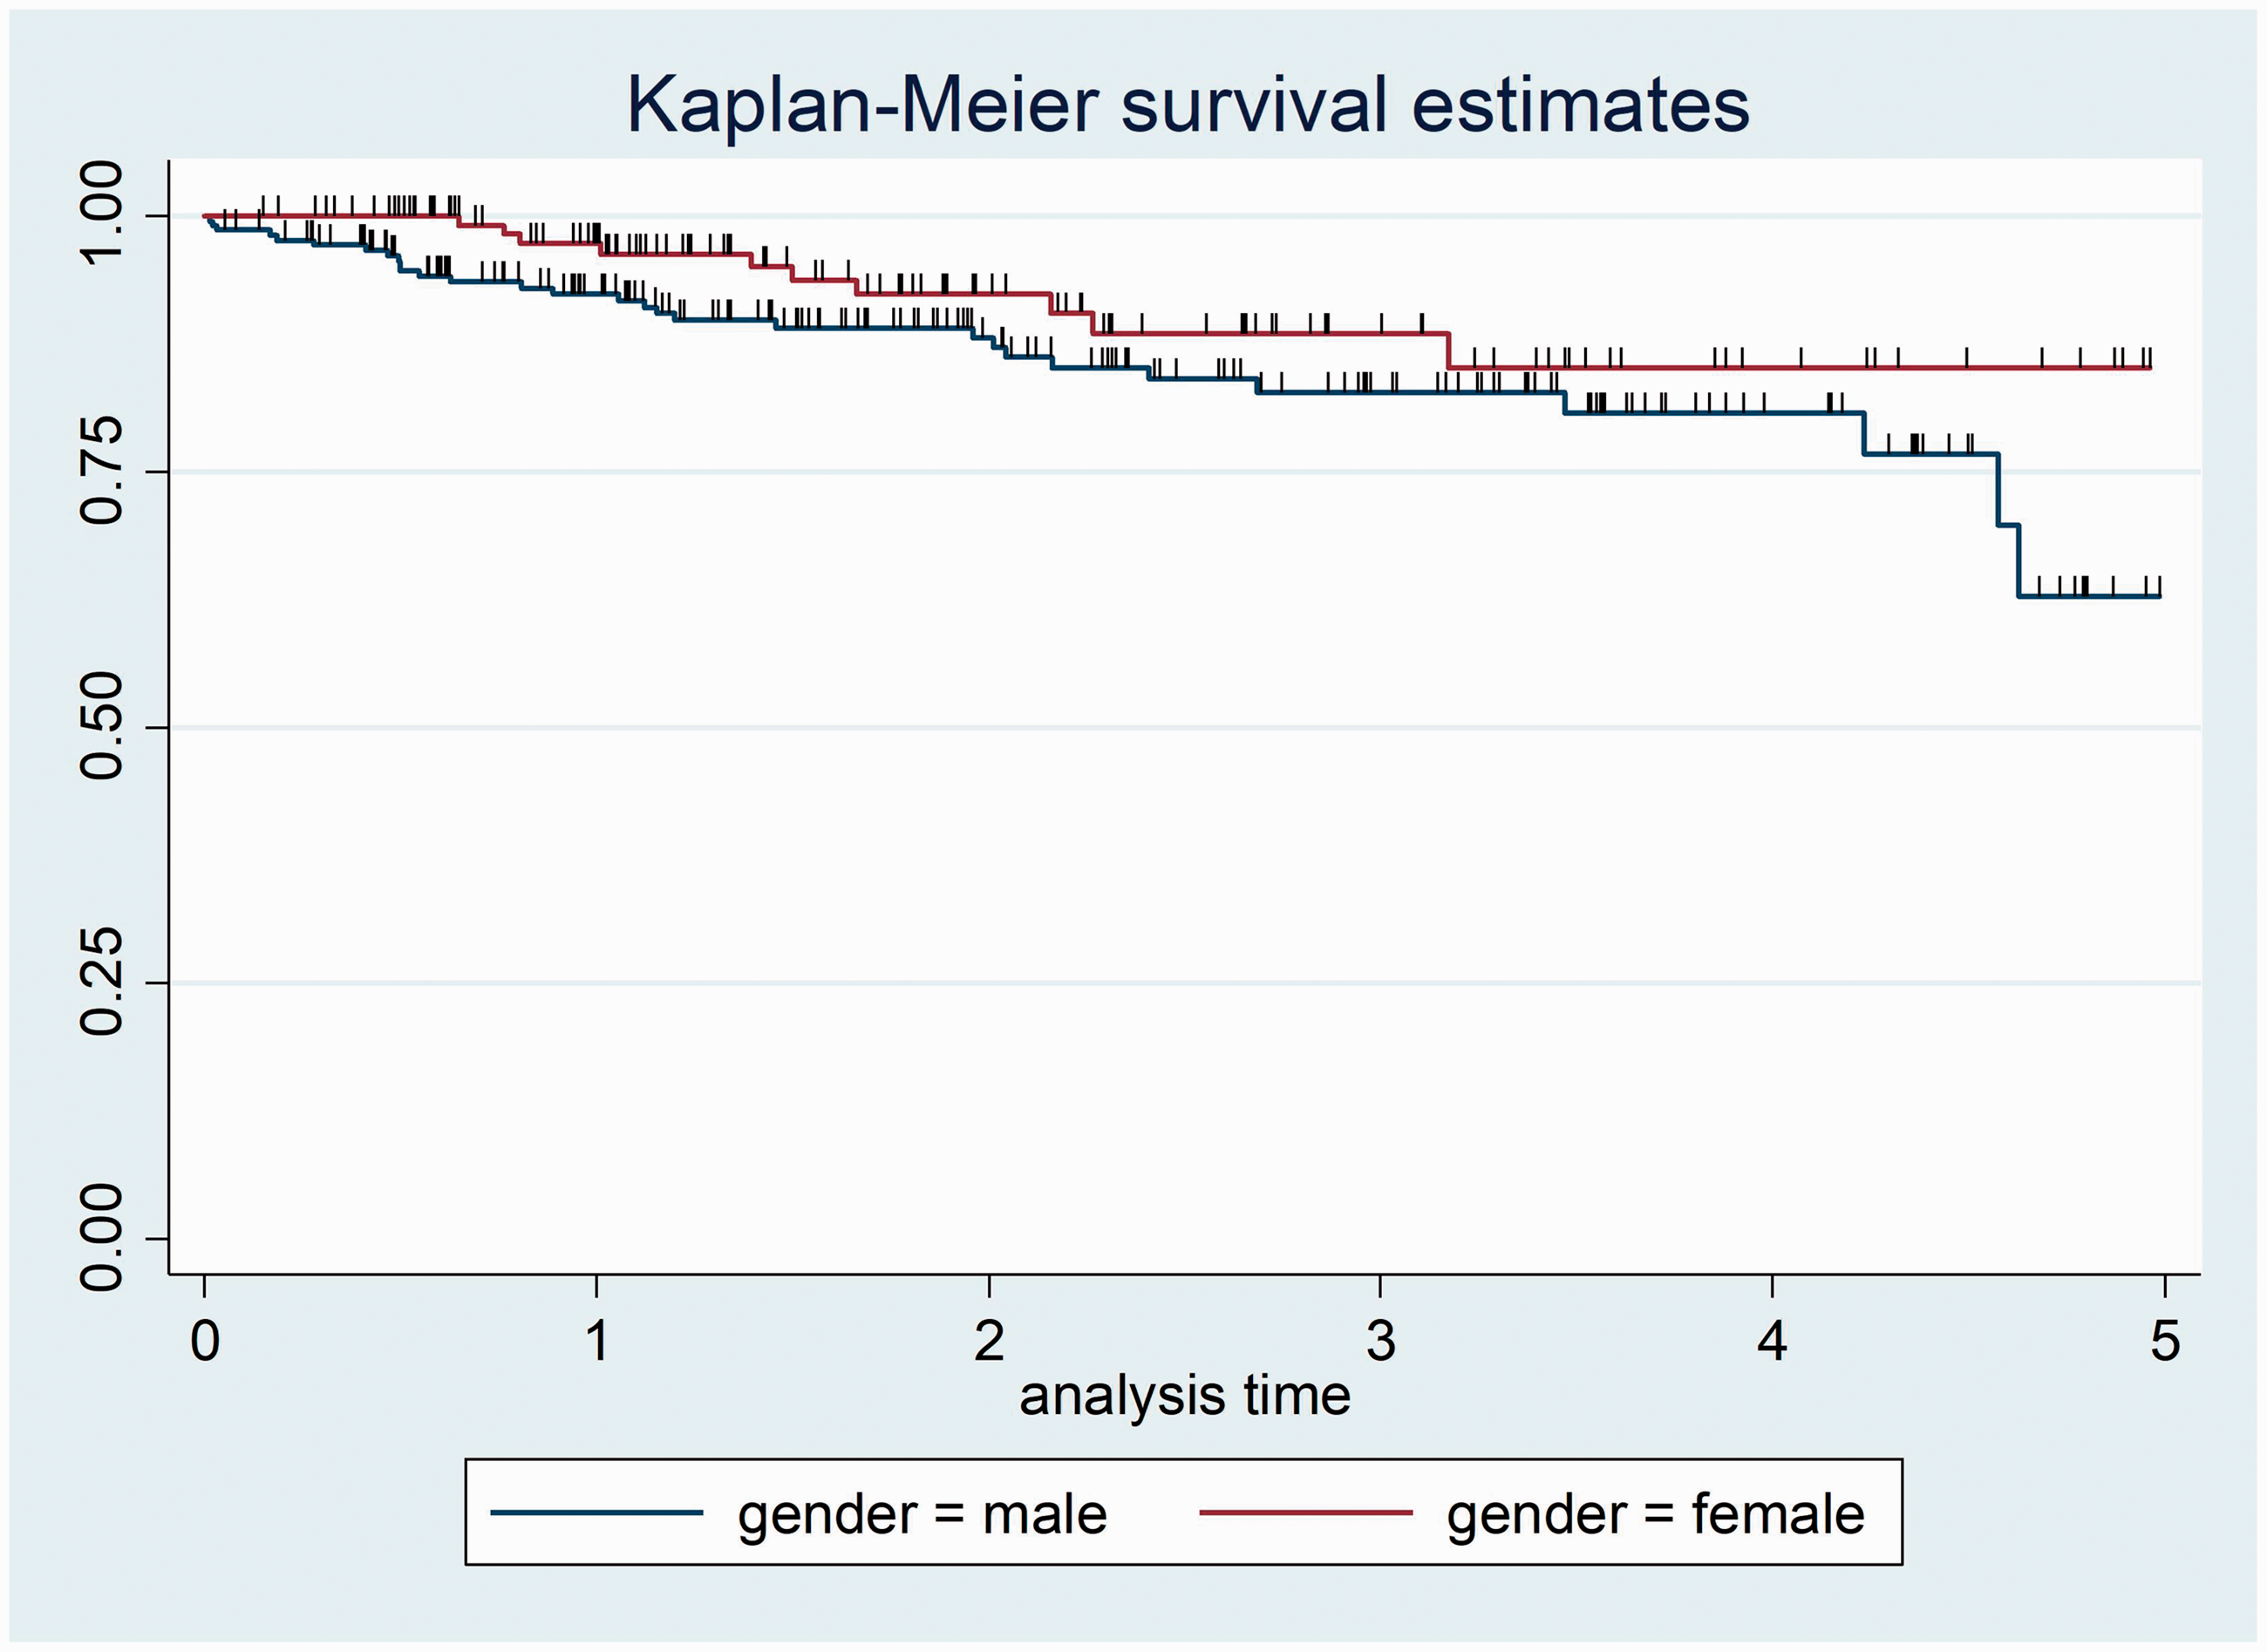
Kaplan–Meier survival function in 351 patients with diabetes who attended a diabetic follow-up clinic at Asella Referral and Teaching Hospital, Asella, Ethiopia, between January 2017 and December 2021, categorized according to sex. Survival time, years.
Diabetic status during last contact
The log-rank test to check the equality of survival function for diabetic status during last contact revealed no statistically significant difference in survival time between controlled or uncontrolled diabetes (X2 = 1.13, df = 1, P = 0.2875). Patients with controlled or uncontrolled diabetes displayed the same probability of survival time, thus, the null hypothesis was not rejected (Figure 10).

Kaplan–Meier survival function in 351 patients with diabetes who attended a diabetic follow-up clinic at Asella Referral and Teaching Hospital, Asella, Ethiopia, between January 2017 and December 2021, categorized according to diabetes status during last contact. Survival time, years.
Residency
The log-rank test to check the equality of survival function for residency revealed no statistically significant difference in survival time between urban and rural residence (X2 = 1.41, df = 1, P = 0.2351). Patients with diabetes who lived in urban or rural areas showed the same probability of survival time, thus, the null hypothesis was not rejected (Figure 11).

Kaplan–Meier survival function in 351 patients with diabetes who attended a diabetic follow-up clinic at Asella Referral and Teaching Hospital, Asella, Ethiopia, between January 2017 and December 2021, categorized according to residency type. Survival time, years.
Family history of diabetes
The log-rank test to check the equality of survival function for family history of diabetes revealed no statistically significant difference in survival time between patients with a family history of diabetes and those without family history of diabetes (X2 = 1.80, df = 1, P = 0.180). Patients with diabetes and family history of diabetes had the same probability of survival time as those without family history of diabetes, thus, the null hypothesis was not rejected (Figure 12).

Kaplan–Meier survival function in 351 patients with diabetes who attended a diabetic follow-up clinic at Asella Referral and Teaching Hospital, Asella, Ethiopia, between January 2017 and December 2021, categorized according to family history of diabetes (Family_hx_of_DM). Survival time, years.
Body mass index
The log-rank test to check the equality of survival function for BMI revealed a statistically significant difference in survival time between normal and overweight BMI in patients with diabetes (X2 = 7.37, df = 1, P = 0.007). Patients with diabetes and normal BMI had a greater probability of survival time than those with overweight BMI, thus, the null hypothesis was rejected (Figure 13).

Kaplan–Meier survival function in 351 patients with diabetes who attended a diabetic follow-up clinic at Asella Referral and Teaching Hospital, Asella, Ethiopia, between January 2017 and December 2021, categorized according to body mass index classification (normal, 18.5–24.9 kg/m2; or overweight, 25.0–29.9 kg/m2). Survival time, years.
Testing overall model fit
The model’s fitness was determined by the Nelson–Aalen estimator, an empirical estimate of the cumulative hazard function, using the Cox–Snell residuals. If the model fits the data, the plot of the cumulative hazard versus (cs) should approximate a straight line with slope of 1. If the Cox regression model fits the data, these residuals should have a standard censored exponential distribution with HR. Comparing the jagged line with the reference line, the hazard function followed the 45° line closely. The output display of Cox–Snell residuals satisfied the overall model fitness (Figure 14).
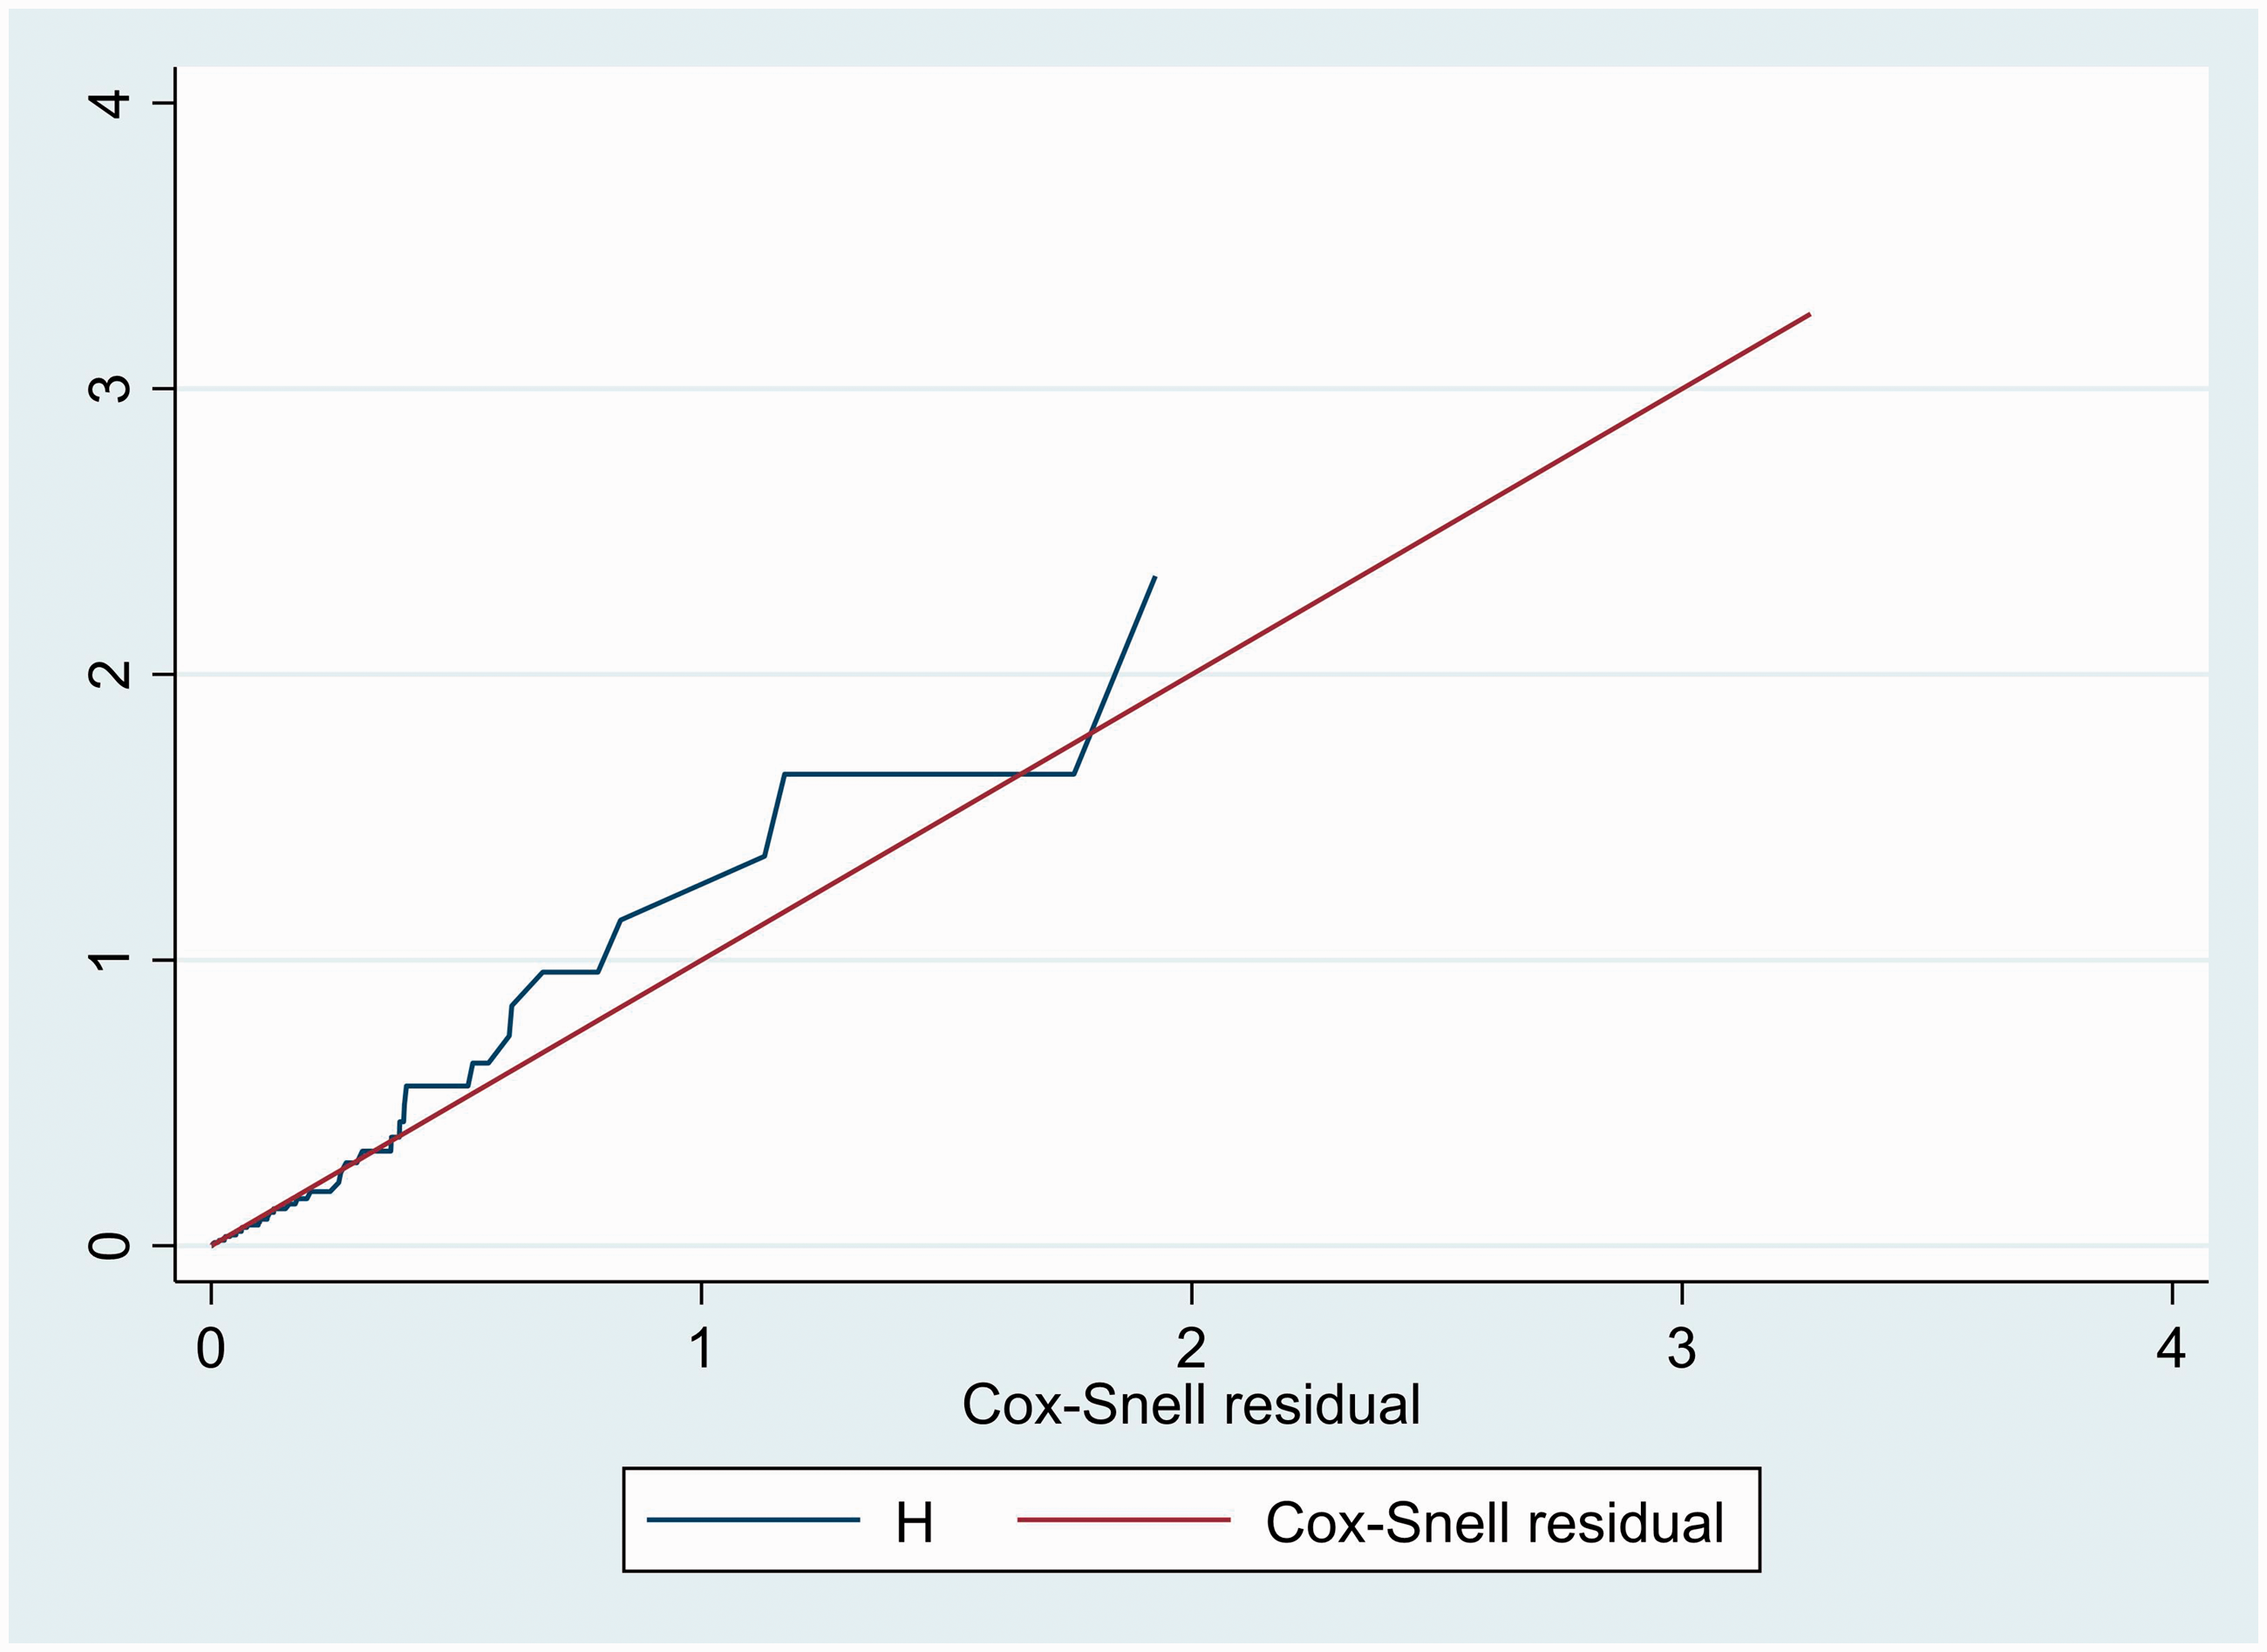
Cox–Snell residual Nelson-Aalen cumulative hazard graph in 351 patients with diabetes who attended a diabetic follow-up clinic at Asella Referral and Teaching Hospital, Asella, Ethiopia, between January 2017 and December 2021.
Predictors of hypertension among patients with diabetes
To determine predictors of hypertension development among patients with diabetes, the variables age, sex, residency, family history of diabetes, family history of hypertension, BMI, drug adherence, glycaemic control, presence of comorbidity, presence of infection, diabetes status during last contact and type of antidiabetic medication taken were entered into a bivariable Cox proportional hazard regression model. However, glycaemic control and diabetic status during last contact had a P-value >0.25, so both were excluded from the final multivariable Cox proportional hazard regression model. After performing multivariable Cox proportional hazard regression analysis, only age, family history of hypertension, presence of comorbidity and BMI showed a significant association with the development of hypertension.
The risk of developing hypertension in patients with diabetes aged ≥60 years was 6.24 higher (adjusted HR 6.24, 95% CI 3.13, 12.45, P < 0.001) than in patients with diabetes aged <60 years. Patients with diabetes and a family history of hypertension had 1.67 times higher risk of developing hypertension (adjusted HR 1.67, 95% CI 1.22, 9.65, P = 0.042) than patients with diabetes and no family history of hypertension. The risk of developing hypertension in patients with diabetes who had comorbidities was 2.20 times higher (adjusted HR 2.20, 95% CI 1.94, 5.21, P = 0.027) than in patients with diabetes who had no comorbidities. Patients with diabetes who were overweight (BMI 25.0–29.9 kg/m2) had 2.07 times higher risk of developing hypertension (adjusted HR 2.07, 95% CI 1.23, 5.63, P = 0.033) than patients with diabetes who had normal BMI (18.5–24.9 kg/m2; Table 4).
Bivariable and multivariable Cox proportional hazard regression analysis of predictors of hypertension development among 351 patients with diabetes who attended a diabetic follow-up clinic at Asella Referral and Teaching Hospital, Asella, Ethiopia, between January 2017 and December 2021.

Data presented as n (%) prevalence.
Ref, reference category; NA, not applicable for multivariable Cox proportional hazard regression model; HR, hazard ratio; CI, confidence interval.
NS, no statistically significant correlation (P > 0.05).
Discussion
The present study was conducted on incidence and predictors of hypertension among patients with diabetes attending a diabetic follow-up clinic in Asella Referral and Teaching Hospital, Ethiopia. To the best of the author’s knowledge, this is the first such study in this setting. Thus, the present findings may provide insight towards interventions that might decrease the development of hypertension among patients with diabetes.
The present study revealed that the IDR of hypertension was 58.05 per 1000 person-years (95% CI 42.58, 79.14), which was lower than in previous studies conducted in South Asia, Saudi Arabia, Iran, and Tanzania, in which IDR of hypertension was reported to be 82.6 per 1000 person-years, 42 172.2 per 1000 person-years, 43 208 per 1000 person-years, 44 and 120 per 1000 person-years, 45 respectively. The variation might be due to differences in sociodemographic characteristics of the study participants, study setting, and healthcare service, which would all play an important role. However, the present study finding was consistent with a previous study conducted in Ethiopia that reported the IDR of hypertension as 48.6 per 1000 person-years. 39
In the present study, the cumulative incidence of hypertension was found to be 11.4% (95% CI 8.05, 14.7), which was higher than the cumulative incidence of hypertension reported in a study from North America, of 2.6%. 46 The present study finding was consistent with a Tanzanian study, which reported a cumulative incidence of hypertension of 9.6%, 45 however, it was lower than a study performed in Wisconsin, USA, which showed a cumulative incidence of hypertension of 25.9%. 47 The present study finding was also lower than a previous study in Ethiopia, which reported a cumulative incidence of hypertension as 29%. 39
The median follow-up period for the present cohort was 1.72 years. Kaplan-Meier survival estimation revealed an overall estimated survival rate for the development of hypertension after diagnosis of diabetes of 70.23% (95% CI 53.67, 81.82) at 5 years of follow-up. Whereas, the estimated cumulative survival rate for the development of hypertension was 94.32 (95% CI 91.12, 96.39), 84.90 (95% CI 79.11, 89.19) and 70.23% (95% CI 53.67, 81.82) at 1, 3 and 5 years, respectively. The 25th percentile was found to be 4.57 years. The mean survival time was 4.330 (95% CI 4.146, 4.515) years. The present findings were not in line with a previous study in Ethiopia that demonstrated a median hypertension-free time of 5.9 years. 39
In the present study, the IDR of hypertension among male patients with diabetes was found to be 6.99 per 100 person-years (95% CI 4.9, 10), which was lower than a previous study in Iran, in which the IDR of hypertension was reported to be 20.6 per 100 person-years. 44 The present finding was also lower than that reported for a study in Saudi Arabia, in which the IDR of hypertension was 17 per 100 person-years. 43
The present study found that IDR of hypertension among female patients with diabetes was 3.84 per 100 person-years (95% CI 2.06, 7.1), which was lower than that reported for a study in Iran, in which the IDR of hypertension was 20.9 per 100 person-years. 44 The present finding was also lower than a study conducted in Saudi Arabia, in which the IDR of hypertension was 17.5 per 100 person-years, 43 but was consistent was a study from Trinidad, South America, in which the IDR of hypertension was 3 per 100 per person-year. 48
Regarding predictors of hypertension development among patients with diabetes, the present study revealed that the risk of developing hypertension among patients with diabetes aged ≥60 years was 6.24 higher (adjusted HR 6.24, 95% CI 3.13, 12.45, P < 0.001) than in patients with diabetes aged < 60 years. This finding was supported by studies from Ethiopia and Iran.39,44 Patients with diabetes and a family history of hypertension had 1.67 times higher risk of developing hypertension (adjusted HR 1.67, 95% CI 1.22, 9.65, P = 0.042) compared with patients with diabetes who had no family history of hypertension. The risk of developing hypertension among patients with diabetes and comorbidities was 2.20 times higher (adjusted HR 2.20, 95% CI 1.94, 5.21, P = 0.027) than patients with diabetes and no comorbidities. Overweight patients with diabetes (BMI 25.0–29.9 kg/m2) had 2.07 times higher risk of developing hypertension (adjusted HR 2.07, 95% CI 1.23, 5.63, P = 0.033) compared with normal weight patients with diabetes (BMI 18.5–24.9 kg/m2).
Despite being conducted on an interesting, timely, and critical topic, the results of the present study may be limited by several factors. First, the study was conducted in a single-centre setting, which may limit the generalisability of the results. Secondly, data were retrospectively extracted from patient medical chart records, thus, incomplete information was a main issue. Thirdly, behavioural and hospital-related predictors were not determined in the present study. Finally, there were limited previously published studies addressing the incidence and predictors of hypertension among patients with diabetes that could be used for comparison.
Conclusion
The present study revealed that the IDR of hypertension among Ethiopian patients with diabetes was high. Moreover, older age, presence of family history of hypertension, presence of comorbidity and higher BMI were statistically significant predictors of hypertension development among this patient group. The findings of the present study may add to the understanding of incidence of hypertension among patients with diabetes. A call for action should focus on reducing the incidence of hypertension among patients with diabetes, in order to abate the related consequences. Concerned bodies, such as government, hypertension associations, diabetic associations, healthcare professionals, national and local policy makers and implementers, and researchers, should mainly focus on strategies that would support in lessening the incidence of hypertension among patients with diabetes. Those strategies should focus mainly on enabling early screening programs. Furthermore, it is recommended that health education and health promotion actions focusing on identified factors need to be conducted by doctors and nurses working in diabetic follow-up clinics, as this may help reduce the incidence of hypertension among patients with diabetes. Lastly, future studies on this topic should be conducted via prospective cohort studies, with the consideration of behavioural and hospital related predictors.
Supplemental Material
sj-pdf-1-imr-10.1177_03000605231201765 - Supplemental material for Incidence and predictors of hypertension among diabetic patients attending a diabetic follow-up clinic in Ethiopia: a retrospective cohort study
Supplemental material, sj-pdf-1-imr-10.1177_03000605231201765 for Incidence and predictors of hypertension among diabetic patients attending a diabetic follow-up clinic in Ethiopia: a retrospective cohort study by Addisu Dabi Wake in Journal of International Medical Research
Footnotes
Acknowledgments
The author would like to thank Asella Referral and Teaching Hospital, Arsi University, and data collectors.
Author contributions
The author contributed to the study conception, data analysis, and drafting/revising the article, gave final approval of the version to be published, and agreed to be accountable for all aspects of the work.
Data accessibility
The datasets used and analysed during the present study are available from the corresponding author on reasonable request.
Declaration of conflicting interest
The author declares that there are no conflicts of interest.
Funding
This research received no specific grant from any funding agency in the public, commercial, or not-for-profit sectors.
References
Supplementary Material
Please find the following supplemental material available below.
For Open Access articles published under a Creative Commons License, all supplemental material carries the same license as the article it is associated with.
For non-Open Access articles published, all supplemental material carries a non-exclusive license, and permission requests for re-use of supplemental material or any part of supplemental material shall be sent directly to the copyright owner as specified in the copyright notice associated with the article.