
Abstract
Background:
Diabetic patients often exhibit severe, asymptomatic coronary artery disease (CAD). The relationship between osteoprotegerin (OPG), inflammatory markers and silent myocardial ischemia remains to be elucidated.
Methods:
We recruited 45 type 2 diabetic patients and 33 healthy controls and assessed them for silent myocardial ischemia (SMI) by myocardial perfusion imaging. Patient blood was tested for OPG, IL-6 and leptin concentrations.
Results:
OPG, leptin and IL-6 levels were found significantly elevated in diabetic patients (p < 0.001, p < 0.01, p < 0.05). Based on our classification of presence/absence of SMI in our diabetic group, we found that there was a significant association between SMI and the biomarkers IL-6 (p < 0.001), leptin (p < 0.001) and OPG (p < 0.05). In multivariate regression analyses, OPG was found to be significantly related to diabetes mellitus and to SMI. Age, sex and smoking increased the association between OPG and SMI.
Conclusion:
High OPG, leptin and IL-6 levels are associated with the presence and severity of SMI in type 2 diabetic patients.
Keywords
Introduction
Diabetes mellitus (DM) is considered an inflammatory process with systemic involvement of the vascular tree.1,2 Asymptomic coronary artery disease is common in diabetic patients and is a strong predictor for future adverse coronary vascular events, as well as early death.2,3 The American Diabetes Association (ADA) recommends using an exercise stress test to screen for coronary artery disease (CAD) in type 2 diabetic patients presenting with ≥ 2 additional cardiovascular risk factors. 4
Osteoprotegerin (OPG) is a secreted glycoprotein, belonging to the tumor necrosis factor (TNF) receptor superfamily. It is a decay-related receptor for the receptor activator of nuclear factor KB ligand (RANKL) and the TNF-related apoptosis inducing ligand (TRAIL). OPG binds and neutralizes RANKL, which is a cytokine with strong osteoclast-inducing activity. OPG binding causes inhibition of RANKL and its receptor RANK interactions, leading to inhibition of osteoclastogenesis. OPG production has been demonstrated in many different tissues, including bone (osteoblasts), heart and vasculature (endothelial and vascular smooth muscle cells). In addition to its presence in connective tissues, OPG also circulates in blood at considerably lower concentrations than in tissues.5,6
Expression of RANK and RANKL has been demonstrated in atherosclerotic, calcified plaques, indicating a localized, paracrine role of this system in the vasculature. An imbalance in the OPG/RANKL/RANK molecular triad system has been suggested to be responsible for the calcification process of atherosclerotic plaques.5,6
OPG appears to play a crucial role in vascular homeostasis. This protein functions as a vascular calcification inhibitor and a regulatory molecule in atherosclerosis. In numerous clinical studies, OPG has been consistently reported as a strong independent risk factor and a predictor for the onset and severity of both atherosclerosis and cardiovascular disease (CVD).7–10 The ability to identify the subset of diabetic patients at increased risk for asymptomatic CAD based on plasma OPG levels could be of great benefit in the stratifying of risk in these patients.10–15
This study was designed to determine the ability of OPG to predict silent myocardial ischemia (SMI) and to clarify the relationship between OPG and several other established cardiovascular risk factors and biomarkers of vascular inflammation (C-reactive protein (CRP), leptin, IL-6) in type 2 diabetes patients.
Materials and methods
Patients
This study was conducted on 45 type II diabetes mellitus patients who were undergoing treatment at Taksim Education and Research Hospital. Diabetes was diagnosed according to ADA criteria. 4 A detailed medical history was recorded for each patient, including: age, gender, duration of diabetes, history of hypertension and type of antihypertensive therapy that the patient was receiving along with other concomitant medications. Exclusion criteria were an age <35 or >85 years, documented CAD, typical angina pectoris, abnormal resting electrocardiogram (e.g. Q waves, left bundle branch block), cerebrovascular or peripheral arterial disease (PAD), or serious life-threatening illness. Hypertension was diagnosed if at least one of several specific conditions was present: systolic blood pressure ≥140 mmHg, diastolic blood pressure ≥90 mmHg, or use of at least one antihypertensive medication. Dyslipidemia was considered when LDL cholesterol was ≥3.35 mmol/L, HDL cholesterol was <1.05 mmol/L, triglycerides were ≥1.70 mmol/L, and/or if the patient was undergoing lipid-lowering therapy. The degree of nephropathy was also divided into three groups by the urinary findings and serum creatinine (Cr) level: normal (urinary albumin excretion rates (AER) <30 mg/24 h), microalbuminuria (30 ≤AER <300 mg/24 h) and macroalbuminuria (300 mg/24 h ≤AER).
The control group consisted of 33 healthy, age-matched individuals. The study protocol was approved by the local ethics committee. Written informed consent was obtained from all patients and controls.
Stress protocol and myocardial perfusion imaging
Stress tests and myocardial perfusion imaging (MPI) were performed and interpreted as previously described. 11 Briefly, all subjects underwent a combined dipyridamol (0.75 mg/kg) exercise stress test, followed by a same-day stress-rest imaging protocol using 99mTc-sestamibi (1 mCi/10 kg body weight, with a minimum of 7 mCi; 259 MBq). Stress and rest images were acquired from the patient in the prone position, 1 h after injection of 99mTc-sestamibi. Image acquisition was performed using a double-headed gamma camera with low-energy, high-resolution, parallel-hole collimators. Stress and rest acquisitions were gated (10% R–R interval acceptance window; eight gated intervals). Images were reconstructed (Butterworth filter order 4, cutoff frequency 0.25/cm), and short-axis, horizontal long-axis, and vertical long-axis sections were obtained. MPI reconstructions were divided into 20 segmental regions. Inside a segment, a hypoperfusion was considered significant if the mean activity in the segment was <70% of the maximal myocardial activity.
When stress images showed that there was a significant defect in at least three segments (i.e. ≥15% of the whole left ventricular myocardium), the images were scored as abnormal and a resting study was performed. For resting studies, patients were injected with 21 mCi (777 MBq) of 99mTc-sestamibi, 3 h after stress. Stress images showing smaller defects (<15%) were scored as normal, so for these patients, no rest image acquisition was performed. Defects seen were classified as reversible (normalization after injection), fixed (persistent defect after injection), or partially reversible. Subjects were considered to have SMI in the presence of a positive stress electrocardiogram or ECG (i.e. horizontal or descending ST segment depression ≥1 mm, relative to the isometric line and measured at the J-junction) and/or an abnormal scintigraphic image.
Blood samples
Blood samples from patients and controls were drawn by venipuncture into precooled tubes. Triglycerides, total cholesterol, HDL-cholesterol, CRP, fibrinogen and hemoglobin A1c (HbA1c) were measured immediately. The blood samples to be used for other measurements were centrifuged at 1500 × g at 4°C for 10 min. Serum and plasma samples were stored at −86°C until the analysis.
Osteoprotegerin measurement
OPG levels in the serum were quantified by Biovendor enzyme-linked immunosorbent assays (ELISA). The assay detects both monomer and dimeric forms of OPG, including OPG bound to its ligand. Briefly, mouse anti-human OPG was used as a capture antibody and a biotinylated polyclonal anti-human OPG antibody was used for detection. The detection limit of this assay was 0.4 pmol/L. Intra- and interassay variabilities for this test are less than 7%.
IL-6 measurement
IL-6 levels were determined using the Quantikine ELISA Kit (R&D Systems). A monoclonal antibody specific for IL-6 is pre-coated onto a microplate, so that any IL-6 present in the serum tested is bound by the immobilized antibody. Next, a substrate solution is added to the wells and color develops in proportion to the amount of IL-6 that bound in the initial step. Once color development is stopped, the color intensity is measured. The detection limit of this assay was <0.70 pg/mL. Intra-assay variabilities were <5.5% and interassay variabilities were <4%.
Leptin measurement
Serum leptin levels were measured by the DRG ELISA Kit, which is based on the competition principle and microtiter plate separation. The unknown amount of leptin present in the sample and a fixed amount of leptin conjugate immobilized onto the wells, compete for the binding sites in a polyclonal antiserum. Next, an enzyme complex binds to the antiserum and any unbound complex is washed off. After addition of the substrate solution (tetramethyl benzidine), the concentration of leptin in the sample will be inversely proportional to the optical density measured. Inter-assay and intra-assay coefficient of variance (CV)% were 7.6 and 5.42%, respectively.
CRP measurement
For detecting the CRP, a particle-enhanced immunoturbidimetric method was performed using a Behring Nephelometer BN–100 (Behring Diagnostic, Germany): Human CRP agglutinates with latex particles that are coated with monoclonal anti-CRP antibodies. The aggregates obtained are quantified turbidimetrically. The sensitivity limit of the test is 0.1 mg/L.
Other serum, blood and urine assays
Serum cholesterol, triglyceride and HDL-C were measured by enzymatic colorimetric methods with commercially available kits (COBAS 311, Roche Diagnostics GmbH, Mannheim, Germany) and LDL-C was calculated according to the Friedewald formula. Serum glucose measures were determined enzymatically by using the hexokinase method (Roche Diagnostics GmbH, Mannheim, Germany).
Blood HbA1c was determined on the COBAS 311 analyzer, using the particle-enhanced immunoturbidimetric method (Roche Diagnostics, Mannheim, Germany). Final results were expressed as percent HbA1c from the total Hb, according to the protocol of the Diabetes Control and Complications Trial/National Glycohemoglobin Standardization Program (DCCT/NGSP).
Urine albumin was assessed quantitatively using an immunoturbidimetric test (Tinaquant Albumin assay, Roche Diagnostics, Mannheim, Germany). The quantex reagent (Biokit, S.A., Barcelona, Spain) for the in vitro determination of human albumin in urine is based on the measurement of the turbidity produced when insoluble aggregates are formed due to a specific reaction between the anti-human-albumin goat serum reagent with the albumin in the patient’s urine. In addition, urinary creatinine was quantified using a modified Jaffe method (interassay CV: 1.9%; intra-assay CV: 1.0%; Roche Diagnostics).
Statistical analysis
Unpaired Student’s t-test was done for the normally distributed parameters and a Mann–Whitney U test for the abnormally distributed data, to compare patient and control groups, and tests were performed between SMI (+) and SMI (–) diabetic groups (see Tables 1 and 2 in results section). The variables associated with DM at a significance of p ≤ 0.05 were entered in the multivariate models. Multiple logistic regression analysis was performed to determine the associations between DM as the dependent variable and independent covariates of sex, age, body mass index (BMI), hypertension, hyperlipidemia, current smoking, IL-6, leptin and OPG. The odds ratio (OR) and 95% confidence interval (CI) were calculated by logistic regression analysis.
Values (means ± SD) of the analysed parameters in Type II diabetes mellitus patients and control group, with their statistical significance.
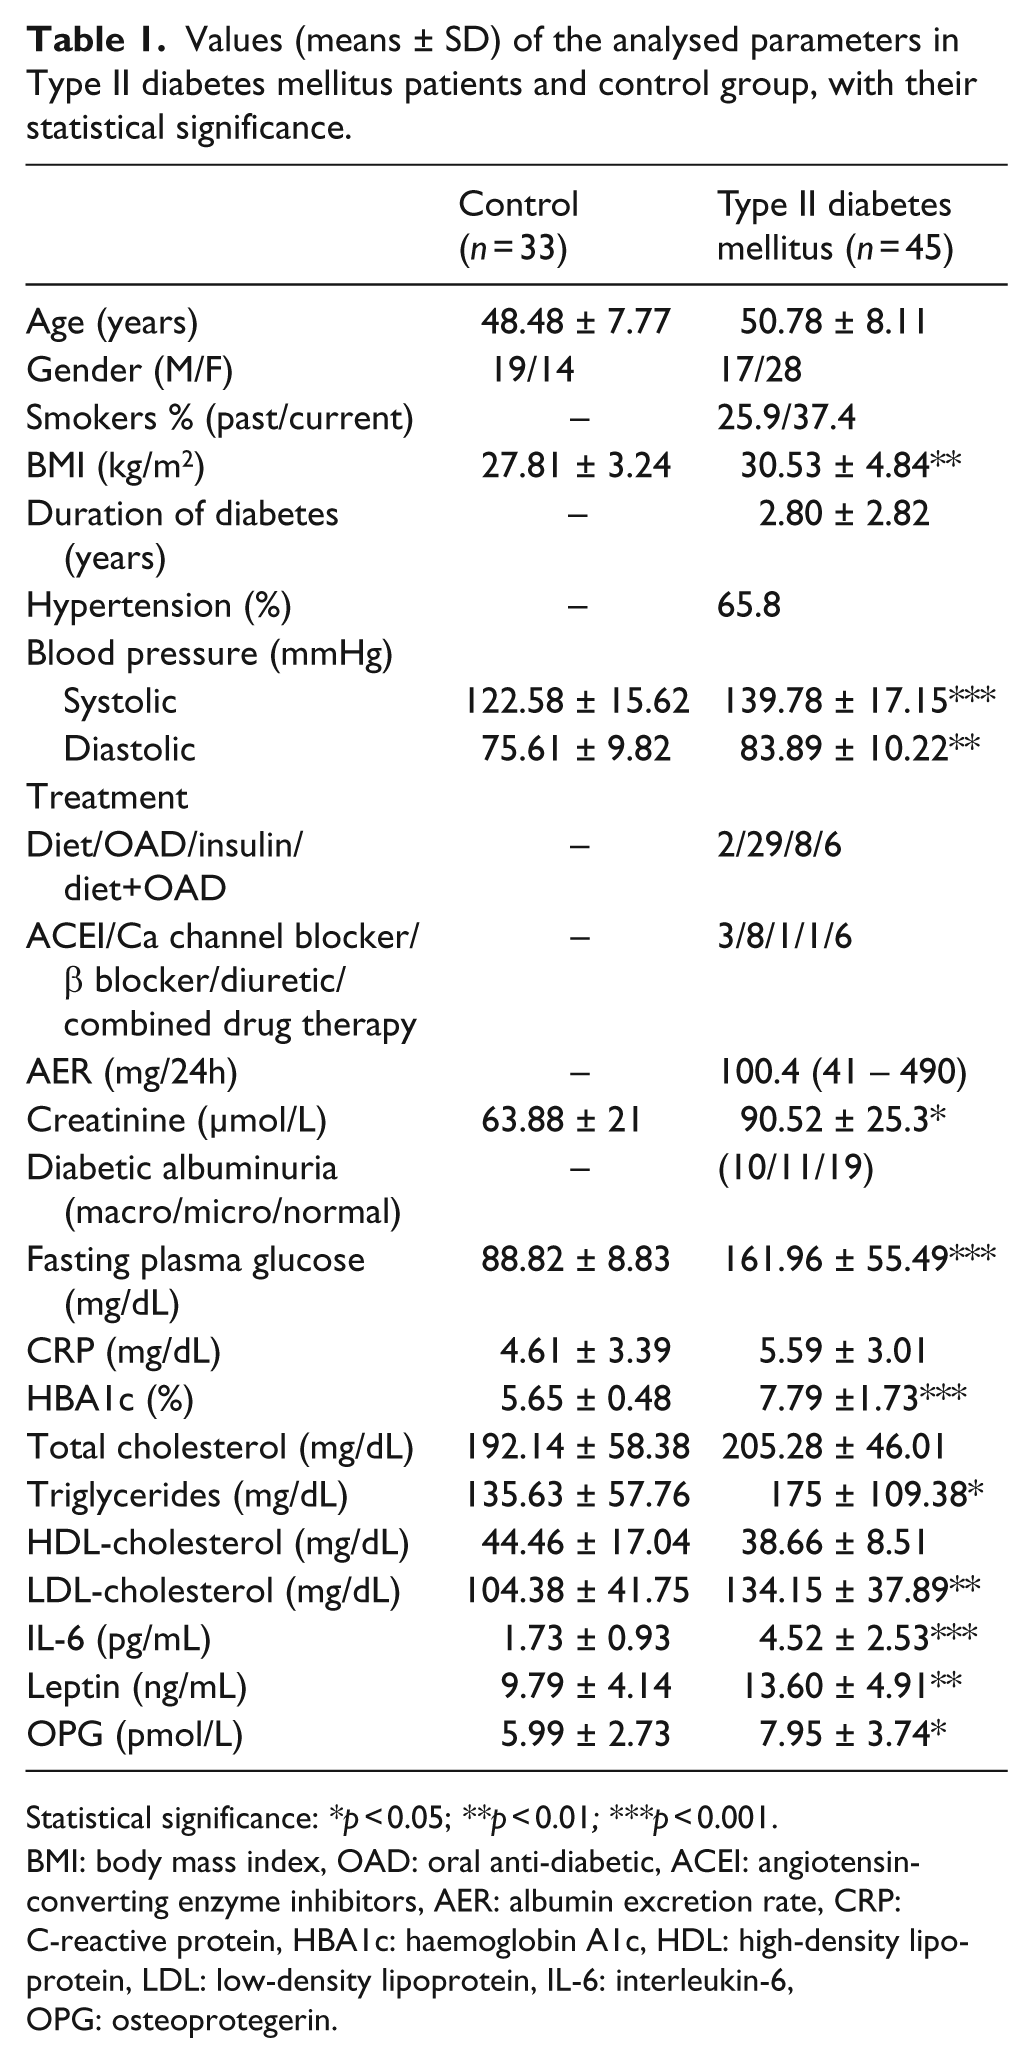
Statistical significance: *p < 0.05; **p < 0.01; ***p < 0.001.
BMI: body mass index, OAD: oral anti-diabetic, ACEI: angiotensin- converting enzyme inhibitors, AER: albumin excretion rate, CRP: C-reactive protein, HBA1c: haemoglobin A1c, HDL: high-density lipoprotein, LDL: low-density lipoprotein, IL-6: interleukin-6, OPG: osteoprotegerin.
Comparison of demographic data and analysed parameters of Type II diabetes mellitus (DM) patients classified according to MPI.
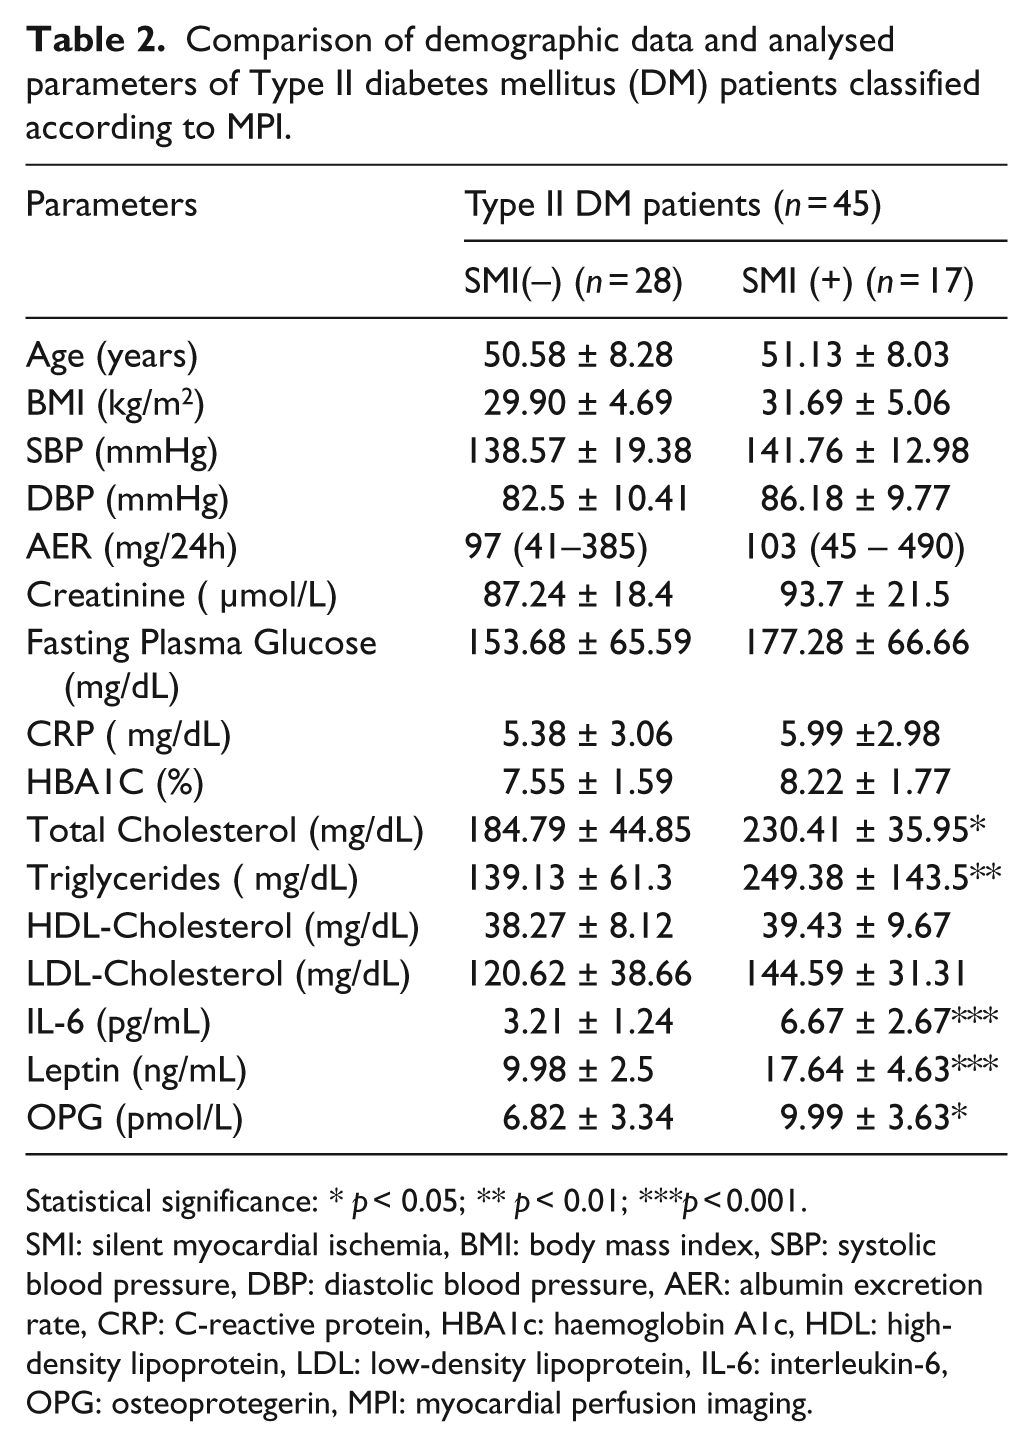
Statistical significance: *p < 0.05; **p < 0.01; ***p < 0.001.
SMI: silent myocardial ischemia, BMI: body mass index, SBP: systolic blood pressure, DBP: diastolic blood pressure, AER: albumin excretion rate, CRP: C-reactive protein, HBA1c: haemoglobin A1c, HDL: high-density lipoprotein, LDL: low-density lipoprotein, IL-6: interleukin-6, OPG: osteoprotegerin, MPI: myocardial perfusion imaging.
Mean values of OPG in DM patients (see Table 3 in results section) and in diabetic patients with SMI(+) (see Table 4 in results section) were adjusted for age, sex, cholesterol, triglycerides, leptin and IL-6 through the use of logistic regression analyses. Multivariate models were generated by entering variables (IL-6, leptin and OPG) into two separate models, to explore their contributions to SMI in DM (see Table 5 in the results section).
Association of osteoprotegerin (OPG) levels with coronary arterial disease (CAD) risk factors in fully adjusted models of diabetes mellitus (DM) patients.
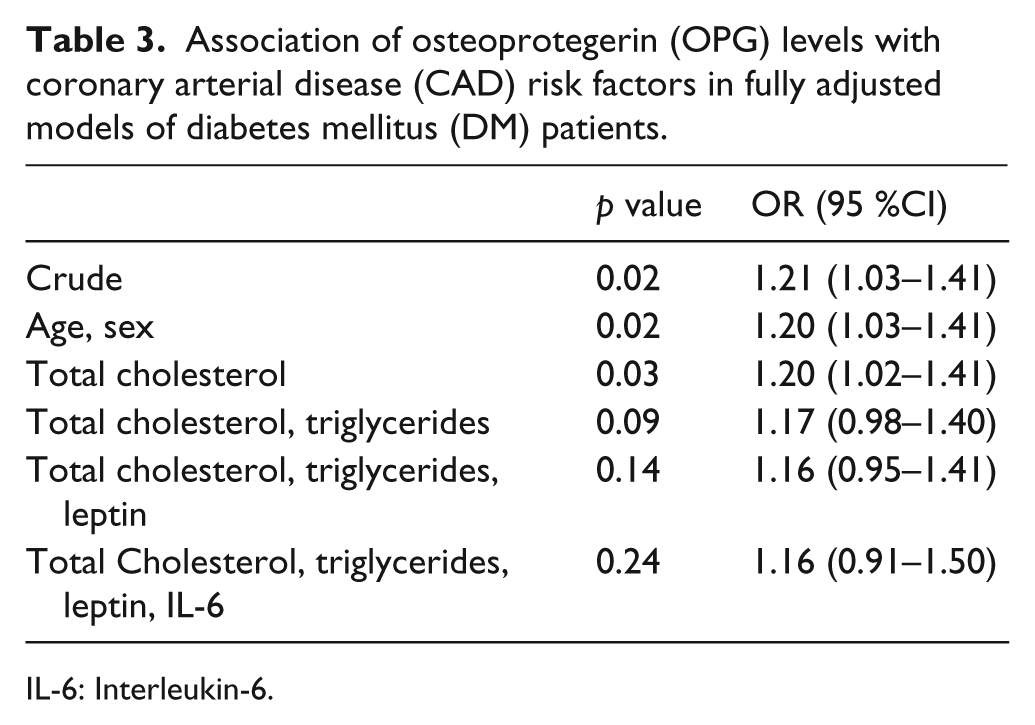
IL-6: Interleukin-6.
Association of osteoprotegerin (OPG) levels with coronary arterial disease (CAD) risk factors in fully adjusted models in diabetes mellitus (DM) patients with silent myocardial ischemia (SMI).
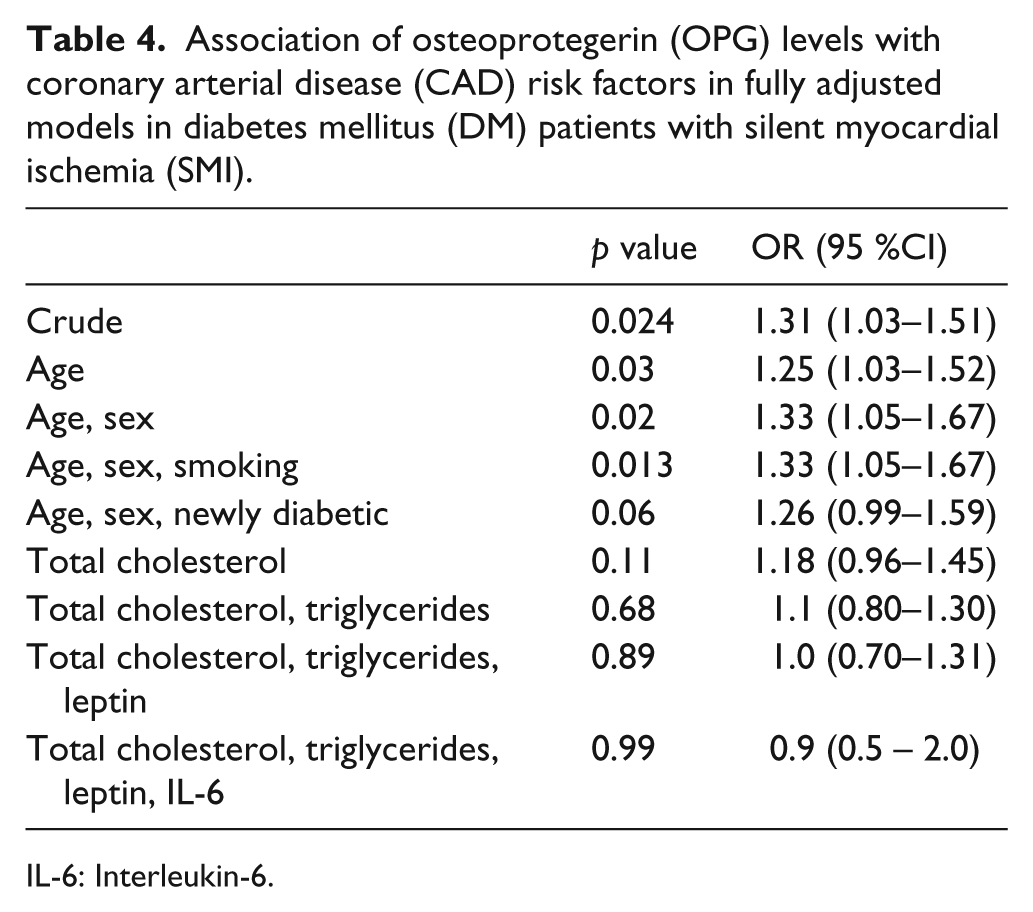
IL-6: Interleukin-6.
Multivariate linear regression models for variables: OPG, IL-6 and leptin in diabetic patients with SMI.
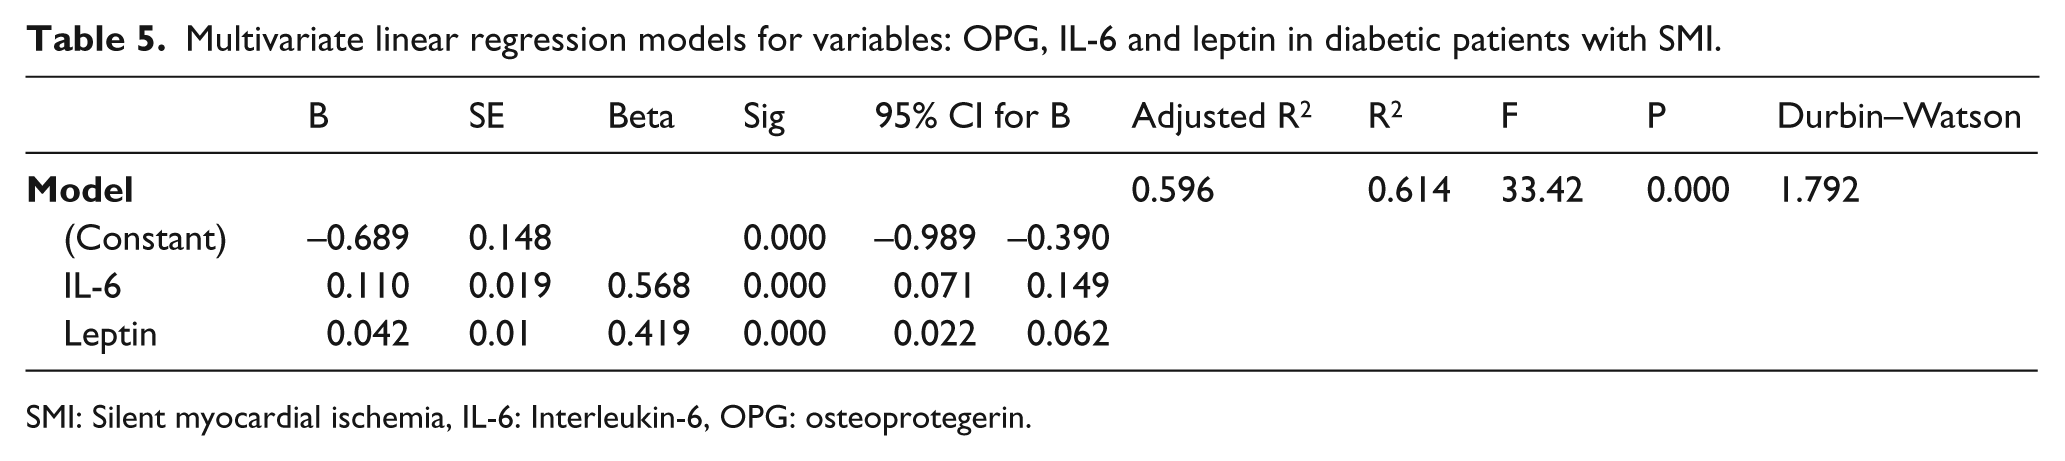
SMI: Silent myocardial ischemia, IL-6: Interleukin-6, OPG: osteoprotegerin.
The relationships between OPG, leptin, IL-6 and cardiovascular risk factors were explored using Pearson’s correlation analysis for normally distributed variables and Spearman’s correlation analysis for the variables that were distributed otherwise.
Results
There were no significant differences between diabetic patients and the healthy control group with respect to age. Glucose status parameters (fasting plasma glucose, HbA1c) were significantly higher (p < 0.001) in type 2 diabetic patients compared to controls. In the lipid profile parameters, only triglycerides (p < 0.05) and LDL-C (p < 0.01) were significantly elevated in that patient group. Interestingly, IL-6, leptin and OPG were also found to be significantly higher in DM patients (p < 0.001, p < 0.01, p < 0.05 respectively) (Table 1).
When our diabetic patients were classified according to the presence/absence of SMI, there were no significant differences with respect to age, BMI, hypertension or glucose status parameters. Biological markers that were significantly associated with SMI included total cholesterol (p < 0.05), triglycerides (p < 0.01), IL-6 (p < 0.001), leptin (p < 0.001) and OPG (p < 0.05) (Table 2).
Using multivariate logistic regression analysis to ascertain the association between type 2 DM and cardiovascular risk factors; it was determined that IL-6 (OR: 2.6; CI: 1.5–4.5; p = 0.008), leptin (OR: 1.4; CI: 1.1–1.8; p = 0.002) and OPG (OR: 1.3; CI: 1.0–1.5; p = 0.024) were each independently associated with DM.
Using multivariate regression analysis, OPG was determined to be significantly related to DM (OR: 1.21; CI: 1.03–1.41, p < 0.02). The association slightly diminished after adjusting for age, sex and total cholesterol. After further adjustment for cholesterol and triglycerides; OPG fell short of statistical significance (Table 3).
Also, OPG levels were found to be significantly related to SMI within the diabetic group (OR: 1.31; CI: 1.03–1.51; p < 0.024). Here, adjustments for age, sex and smoking increased the association with respect to OPG (OR: 1.33; CI: 1.05–1.67; p < 0.013) (Table 4).
To assess the predictive power of variables, a linear regression analysis was performed in which IL-6 and leptin were used to generate our predictive Model 1. OPG not only failed to contribute significantly to the regression, but it actually decreased the predictive power of the model (p < 0.265). Model 1 accounted for 59% of the variance in diabetic patients exhibiting SMI. We found that increased IL-6 and leptin serve as strong predictors for SMI in DM patients, with IL-6 (β: 0.568, p < 0.001) being a stronger predictor than leptin (β: 0.42, p < 0.001) (Table 5).
In diabetic patients, we found that OPG, leptin and IL-6 were positively correlated with the BMI triglyceride values (r = 0.624; p < 0.01; r = 0.512, p < 0.01; r: 0.315, p < 0.05, respectively). Significant positive correlation was observed between total cholesterol, and OPG and leptin (r = 0.421, p < 0.01; r = 0.326, p < 0.05, respectively). Also, OPG and leptin were found to be positively correlated (r = 0.480, p < 0.01). In diabetic patients diagnosed with SMI, IL-6 was positively correlated to BMI (r = 0.424, p < 0.05) and OPG was positively correlated to the duration of DM (r = 0.461, p < 0.05).
Discussion
The main findings of our study reveal significantly higher IL-6, leptin and OPG values in type 2 diabetic patients with SMI, as compared to diabetic patients without SMI. Among lipid status parameters only, triglyceride and total cholesterol levels were also significantly higher in in the SMI group. The presence of SMI, however, did not affect the hypertensive and glucose status of diabetic patients; therefore, development of SMI did not appear to change these nor worsen them. Furthermore, in line with various studies in literature,10–15 we observed that there were significantly higher IL-6, leptin and OPG levels in type 2 diabetic patients, as compared to healthy controls.
To further evaluate the association between DM and cardiovascular risk factors, ORs were assessed by multivariate logistic regression analyses. We observed significant independent associations between DM and IL-6, leptin and OPG levels. According to our data, the association of OPG with DM was not affected by confounding factors such as age, sex and total cholesterol (Table 3). Furthermore, significant association of OPG with SMI in diabetic patients increased after adjustment by age, sex and smoking (Table 4). To assess the predictive power of vascular inflammation factors other than OPG, a model including IL-6 and leptin was generated. Significantly, we observed that IL-6 and leptin serve as strong predictors for SMI in diabetic patients (Table 5).
In the literature, controversial findings are reported regarding increased prevelance of SMI in diabetic patients. Araz et al. 16 (2004) showed that poor glycemic control, as reflected by HbA1c levels, may be a factor related to SMI in diabetic patients. A significant correlation between silent CAD and postprandial blood glucose level was observed in an article published in 2003 by Gokcel et al. 17 In contrast, Janand-Delenne et al. 18 (1999) had reported that there was no correlation between SMI and duration of diabetes nor HbA1c.
There is conflicting evidence as to the general relationship between circulating OPG levels and cardiovascular risk factors for type 2 diabetes.12,15,19–24 The concept that high OPG is a compensatory self-defensive response to the progression of atherosclerosis was first proposed by Browner et al. 21 (2001) and reinforced by Jono 7 (2002) and Hofbauer 25 (2001). The prospective report of Anand et al.12,26 (2006) found that among the range of biochemical markers assessed, only OPG predicted the extent of coronary artery calcification and subsequent cardiovascular events in asymptomic diabetic patients. The prognostic significance of increased serum OPG concentrations as an independent risk factor for cardiovascular morbidity and mortality has been confirmed in diabetic patients, even after correction for conventional cardiovascular risk factors.10,27–29 Singh’s 30 (2010) observation of low OPG levels in type 1 diabetes patients and Jorgenson’s 31 (2009) data demonstrating that there was no difference in OPG levels between healthy controls and type 2 diabetes patients presenting with widespread microvascular complications, are in apparent contrast with the numerous other studies mentioned above.
In vitro data have demonstrated that insulin can downregulate OPG expression in vascular smooth muscle cells (VSMC). Thus, insulin resistance in type 2 diabetes may be partly responsible for the observed OPG increase. Inflammatory cytokines such as IL-1, TNF-α and PDGF have been shown to upregulate OPG expression, both in VSMC and endothelial cells.32,33 Leptin and IL-6, together with OPG, are strong predictors of SMI in diabetic patients, using adjusted models. In this study, we addressed the hypothesis that elevated plasma leptin levels in type 2 diabetes are associated with SMI. Leptin, a pleiotropic adipokine, is reported to be a valid marker of atherosclerotic burden and a modulator of vascular signaling. In the literature, plasma leptin levels are found to be predictors of CVD events, even after adjusting for traditional risk factors.12,34–36
It is reported that hypertension favors the incidence and severity of SMI more than diabetes mellitus. 37 Incidence of SMI was observed to be 26.2% in hypertensive patients and 18.8% in white-Coat hypertension. 38 Our findings related to systolic and diastolic blood pressure did not show that there was a significant difference in diabetic patients, with or without SMI; thus, in the present study SMI was not affected by the hypertensive status of the patients.
Emerging evidence has demonstrated a link between OPG and vasculopathy. Among microangiopathic complications, diabetic nephropathy is the main predictor of SMI. In hypertensive patients, high OPG levels are accompanied by pronounced albuminuria and endothelial dysfunction, as reflected by raised asymmetric dimethylarginine (ADMA) levels. Tsioufis et al. 39 (2011) reported this finding as a link between OPG and the progression of diffuse hypertensive vascular damage. In a case-controlled study, Rutter et al. 40 (1999) show that patients with microalbuminuria had a significantly higher prevelance of SMI than patients without it (65% vs 44%, respectively). In the literature there are reports of both concordant3,41,42 and disconcordant18,43 data on the predictive value of albuminuria for SMI. Our findings related to albumin excretion rate revealed no significant difference between diabetic patients with or without SMI.
The questions regarding whether OPG has a protective, detrimental or dual role in the development and progression of atherosclerosis and vascular calcification remain unclarified. In healthy individuals, the proatherogenic and antiatherogenic effects of this protein are balanced. In response to persistent positive induction by various risk factors, the proatherogenic pathway becomes predominant, suggesting that OPG could function as a valuable biomarker of vascular risk and CVD prognosis5,6 Our findings of serum OPG levels showed that they were significantly high in type 2 diabetic patients with SMI. Elevated OPG levels may function as a crucial compensatory mechanism to limit further vascular damage and to keep excessive activation of inflammatory pathways related to injurious stimuli under control.
We believe that evaluation of OPG, leptin and IL-6 together can help to better identify an increased likelihood of SMI in the diabetic population. These biomarkers might represent a useful and cost-effective means of identifying the subset of diabetic patients that require stress testing in order to be diagnosed and treated best. Therapeutic strategies focused on decreasing serum levels of OPG, leptin and IL-6 may be useful, to improve vascular function in DM and in other vascular pathologies characterized by a chronic inflammatory state.
Footnotes
Funding
This research received no specific grant from any funding agency in the public, commercial, or not-for-profit sectors.
Conflicts of interest
No conflicts of interest have been declared.