
Abstract
The novel coronavirus (SARS-CoV-2) and the associated Coronavirus Disease 2019 (COVID-19) pandemic have had far-reaching health, economic, social and political impacts. The latter is the focus of this research note, which proposes using a difference-in-differences approach to estimate the electoral impact of reported SARS-CoV-2 infection rates. The approach is illustrated using data from the 2020 Croatian parliamentary election. The outcomes of interest are the vote shares for the dominant Croatian Democratic Union party, as well as the turnout. The analysis concludes that there is no evidence that reported county-level infection rates affected Croatian Democratic Union support or turnout. However, results using this approach may be affected by the statistical power of the analysis, issues related to causal identification and reliability of infection rate measures. Nonetheless, the difference-in-differences approach can potentially be applied in contexts around the world to estimate the electoral impact of reported SARS-CoV-2 infection rates.
Introduction
The novel coronavirus (SARS-CoV-2) and associated acute respiratory Coronavirus Disease 2019 (COVID-19) first came to light in December 2019, when a cluster of cases of pneumonia was identified in Wuhan, the capital of the Chinese province of Hubei. Chinese scientists isolated and identified the novel coronavirus on 7 January 2020 (Wang et al., 2020). Over the following months, SARS-CoV-2 spread first within China and then around the world. On 11 March 2020, with 118,000 cases in 114 countries, and 4291 deaths, the World Health Organization (WHO, 2020) declared a (global) pandemic.
Beyond the health effects on individuals, understanding the political impact of the pandemic is vital. The initial SARS-CoV-2 outbreaks and associated restrictions occurred across Europe in spring 2020, but as the number of new infections began to decrease, governments across the continent began to relax related measures. With this loosening of restrictions came an attempted return to ‘normal’ competitive electoral politics, with nationwide elections occurring in Poland, Serbia, Croatia and Iceland during June and July 2020. Since such elections were held in the months following the SARS-CoV-2 outbreak, the polls potentially provide insights into the political impact of the pandemic within these countries.
The primary objectives of the analysis below are to use a causal inference approach that can be applied in many other contexts to estimate the electoral impact of the SARS-CoV-2 outbreak within a country and to also reflect on the challenges of employing such an approach. The case of Croatia is selected as a typical European electoral democracy.
The next section will briefly summarise the Croatian political system and the SARS-CoV-2 outbreak in the country. The literature linking elections and natural disasters will then be briefly outlined. The subsequent sections will explain the sources of data and analytical strategy used. In particular, the analysis will employ a difference-in-differences (DD) approach, explained in the latter section. The results of the analysis of Croatian elections will then be presented. The note concludes with a discussion of the results, as well as highlighting a number of challenges in estimating the electoral effects of the novel coronavirus outbreak.
The Case of Croatia
The Croatian Democratic Union (HDZ) has dominated Croatian politics since the first multi-party Yugoslav elections in 1990, just before the brutal war that led to Croatian independence in 1995. HDZ is the party of the establishment, and its vote share is hence the focus of the analysis below.
The Croatian electoral system for parliamentary elections is typical among proportional systems. Croatia consists of 12 electoral districts: 10 territorial (14 seats each); 1 for minorities (8 seats); and 1 for Diaspora (3 seats). In each district, the seats are allocated using the d’Hondt method. The 21 Croatian counties (županije), including the City of Zagreb, are the main sub-national level of governance, each with a legislature and executive.
Turning to the novel coronavirus outbreak, the first infection was confirmed in Croatia on 25 February 2020, with the patient hospitalised in Zagreb (Ilic, 2020). The government, led by Prime Minister Andrej Plenkovic (HDZ), brought in strict lockdown measures in mid-March (Pajtak and Delija, 2020). In the period following lockdown, the number of daily new infections gradually decreased, reaching zero for a number of days. This allowed the government to gradually lift the restrictions between 27 April and 11 May 2020 (Organisation for Economic Co-operation and Development (OECD), 2020).
Some commentators noted that the apparent success of containing SARS-CoV-2 in Croatia and other parts of Central and Eastern Europe were under-reported in English-language media (Culik and Solic, 2020).
The next Croatian general election was planned for autumn 2020, but the HDZ pushed for early elections in July, perhaps to capitalise on the effective handling of the initial outbreak (Vladisavljevic, 2020). However, some of the measures were partially reinstated as the number of infections started to rise again. The possibly opportunistic move by HDZ looked to backfire, with HDZ and the main challengers, the Restart coalition led by the Social Democratic Party (SDP), involved in a tight race. However, HDZ won 66 of the 151 seats and formed a coalition government on 23 July 2020.
Before investigating whether the county-level incidence of SARS-CoV-2 affected electoral results, the next section will review the literature on electoral behaviour and natural disasters.
Retrospective Voting and Natural Disasters
Within the political science literature, the idea that elections act as a ‘referendum’ (Fiorina, 1981) on the recent performance of incumbent governments has been demonstrated widely (Healy and Malhotra, 2013; Lewis-Beck and Stegmeier, 2013). This retrospective voting is conceptualised primarily economically. That is, incumbent governments are either electorally rewarded or punished related depending on levels of recent economic prosperity (Lewis-Beck and Paldam, 2000). However, the focus in the analysis below is on non-economic retrospective voting behaviour in the midst of a natural disaster.
O’Keefe et al. (1976) problematised the ‘naturalness’ of natural disasters, concluding that the lack of precautionary planning to protect certain vulnerable sections of the population led to disasters. This resonates with the experience during the novel coronavirus pandemic, which has impacted certain vulnerable communities – such as the elderly, ethnic minorities and precarious migrant labour – more than others.
In general, elections amid disaster negatively impact incumbents’ fortunes. For example, Achen and Bartels (2002) show that the shark attacks off the New Jersey coast before the 1916 electorally hurt Woodrow Wilson in that year’s US Presidential election. Similarly, incumbents have been punished electorally after disasters in other contexts (Arceneaux and Stein, 2006; Gasper and Reeves, 2011). However, Gasper and Reeves (2011) found that although incumbents are punished for natural disasters, more attentive responses from incumbents can actually lead to electoral benefits. In a large-N study across 156 countries during the period 1975–2010, Chang and Berdiev (2015) found that the occurrence and number of most natural disasters, as well as disaster-related losses, are associated with governmental turnover. Crucially for this analysis, there were no significant partial associations related to epidemics, though the intensity and scope of the SARS-CoV-2 pandemic is unprecedented and not covered by their analysis.
Natural disasters could also affect electoral turnout. Sinclair et al. (2011) found mixed results in their study of the 2006 New Orleans mayoral election after Hurricane Katrina. Although increased difficulties associated with voting led to a decrease in turnout, places where flooding was more severe actually had higher turnout, which the authors attributed to increased voter mobilisation and motivation to participate. Bodet et al. (2016) argue that the mechanism for decreased turnout is more convincing, with increased costs of voting trumping ‘civic duty’.
The outcomes of interest in the present analysis are thus vote share for the predominant political party and voter turnout.
It is important to note, however, that despite the evidence of post-disaster electoral effects, more recent scholarship have found negligible effects (Albrecht, 2017; Bodet et al., 2016; Bovan et al., 2018; Fowler and Hall, 2018).
The data and methods are presented in the next two sections.
Data
Parliamentary election data for 2015, 1 2016, 2 and 2020 3 aggregated by county were obtained from the Croatian State Electoral Commission. The following information was extracted: county, registered voters, votes cast from the electoral list, valid votes, and votes for HDZ or HDZ-led coalition. HDZ vote share was calculated by dividing the number of votes for HDZ (or the HDZ-led list) by the number of valid votes. Turnout was calculated by dividing the number of votes from the electoral list divided by the number of registered voters. The county-level population estimates were obtained from the Croatian State Bureau of Statistics (DZS). 4
A primary aim of the analysis is how to measure the differing impact of the SARS-CoV-2 outbreak across Croatian counties. Polymerase chain reaction (PCR) tests are used to evaluate whether the virus is currently in the subject’s body. In counting the tests across countries, it is PCR testing that is tabulated. A form of PCR that uses reverse transcription (RT-PCR) from RNA to DNA is employed in Croatia.
The number of new cases of SARS-CoV-2 by county is published every day by the Croatian Institute for Public Health, and the time series is available to download in JSON format. 5 The number of new tests conducted are reported daily, 6 but the Croatian government web page does not compile the time series of tests conducted, and it is not possible to see the change in the number of tests directly. Fortunately, testing data have been compiled since the end of March by Our World in Data (OWID). As mentioned by OWID, it is important to note that these numbers are reported as ‘tests performed’ until 5 May 2020, after which the phrase has changed to ‘people tested’. This may have some implications on comparing data over time, 7 but in this analysis, the counts for daily tests will be treated as consistent for the whole period.
It is first important to examine the trajectory of the novel coronavirus epidemic in Croatia over the period under study using the OWID data set (black line-plot in Figure 1). Reported infections nationally tailed off in mid-May, but there was an increase in cases again in mid-June up to the election period. There is thus evidence of a ‘second wave’ of new infections in Croatia, but this could be an artefact of the number of tests. Thus, the reported cases can be scaled as follows
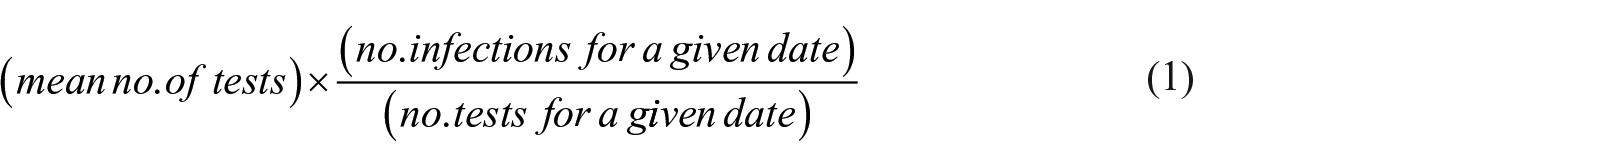
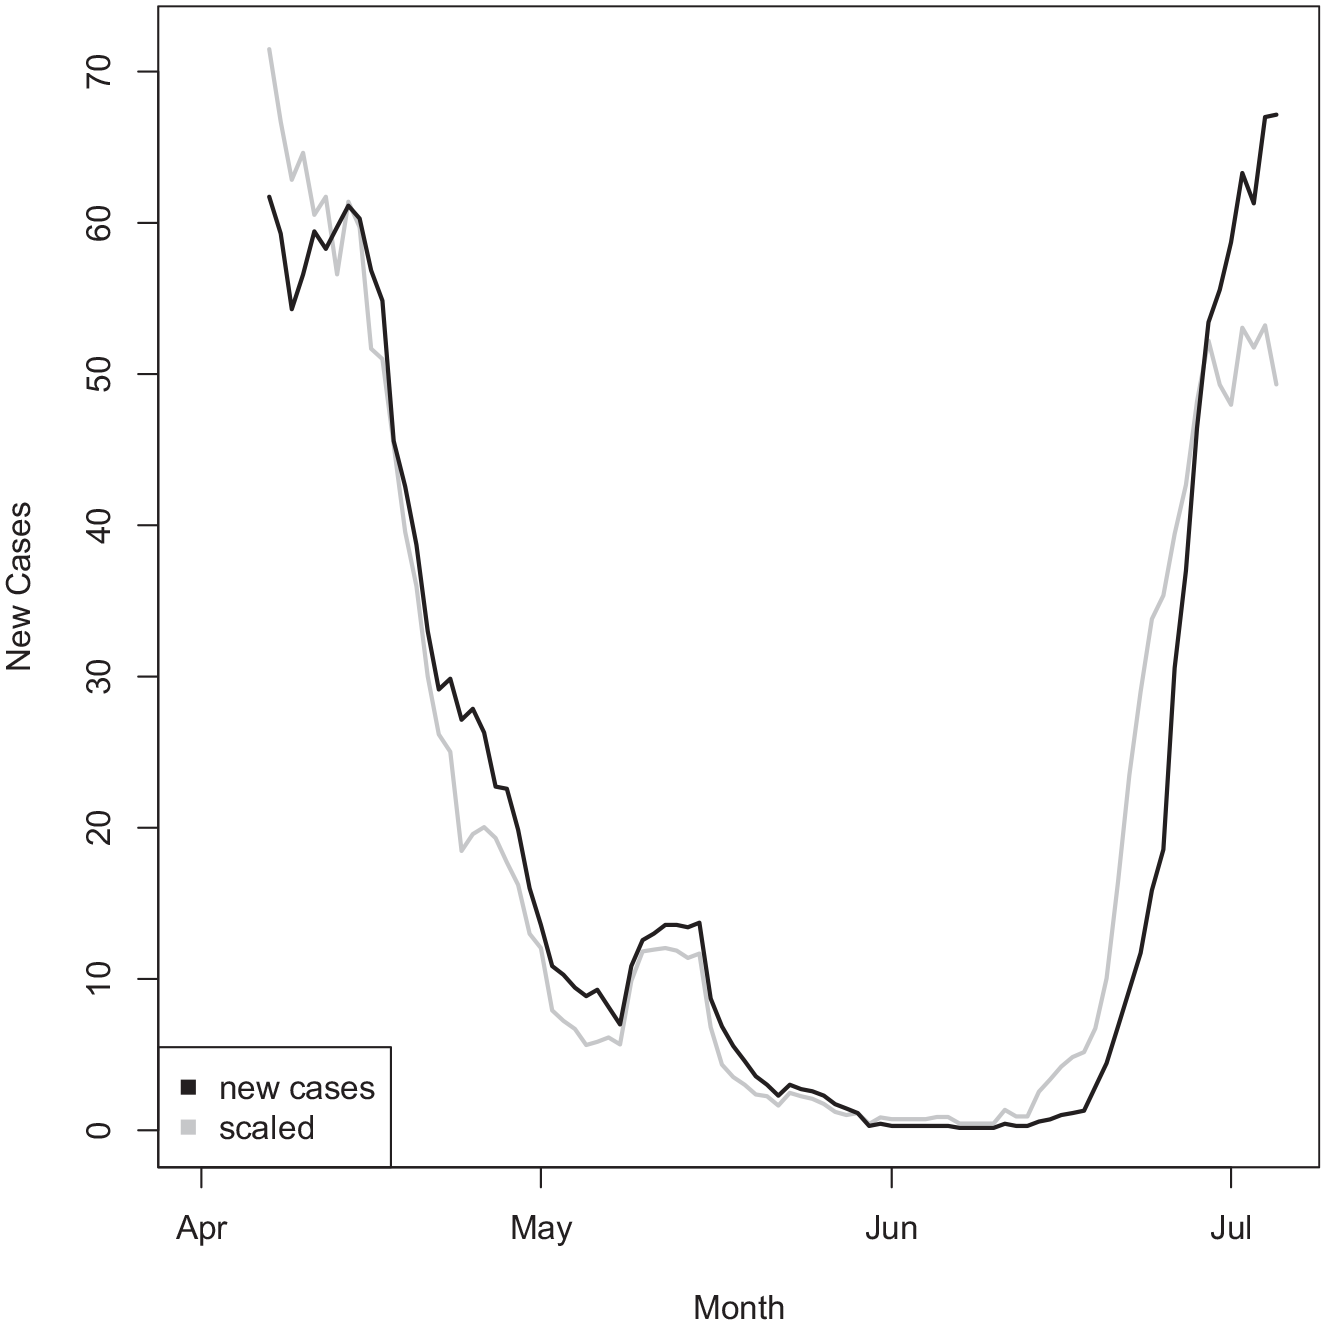
Daily New Cases, Raw and Scaled by Tests (7-Day Rolling Average).
This is plotted in grey in Figure 1. Although not perfectly matching the daily number of infections, the overall shape of the trend is quite similar, and the two measures are highly correlated (r = 0.97). The correspondence between the raw infections data and data scaled by the number of tests is reassuring so the raw numbers of infections by county are used in the remainder of the analysis.
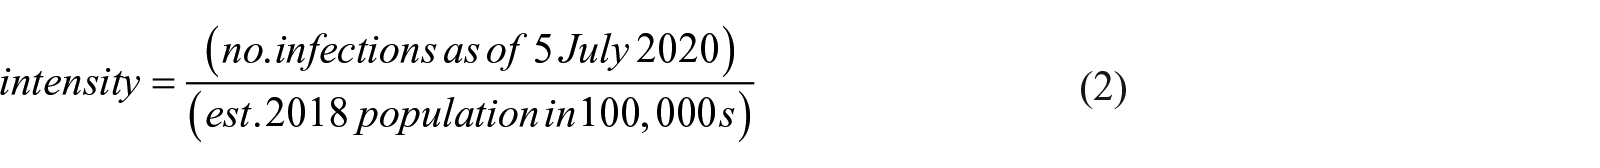
Using the official Croatian data, the intensity of the county-level SARS-CoV-2 outbreak could simply be measured by taking the cumulative number of infections on election day. This, however, does not consider the substantial variation in population among counties. The measure used will hence be the total number of reported infections as of 5 July 2020 per 100,000 inhabitants
Following the approach of Healy and Malhotra (2010), the natural log of the measure of intensity is also considered.
It is informative to think of the epidemic as a set of localised outbreaks, so the number of new daily infections are plotted by county in Figure 2.
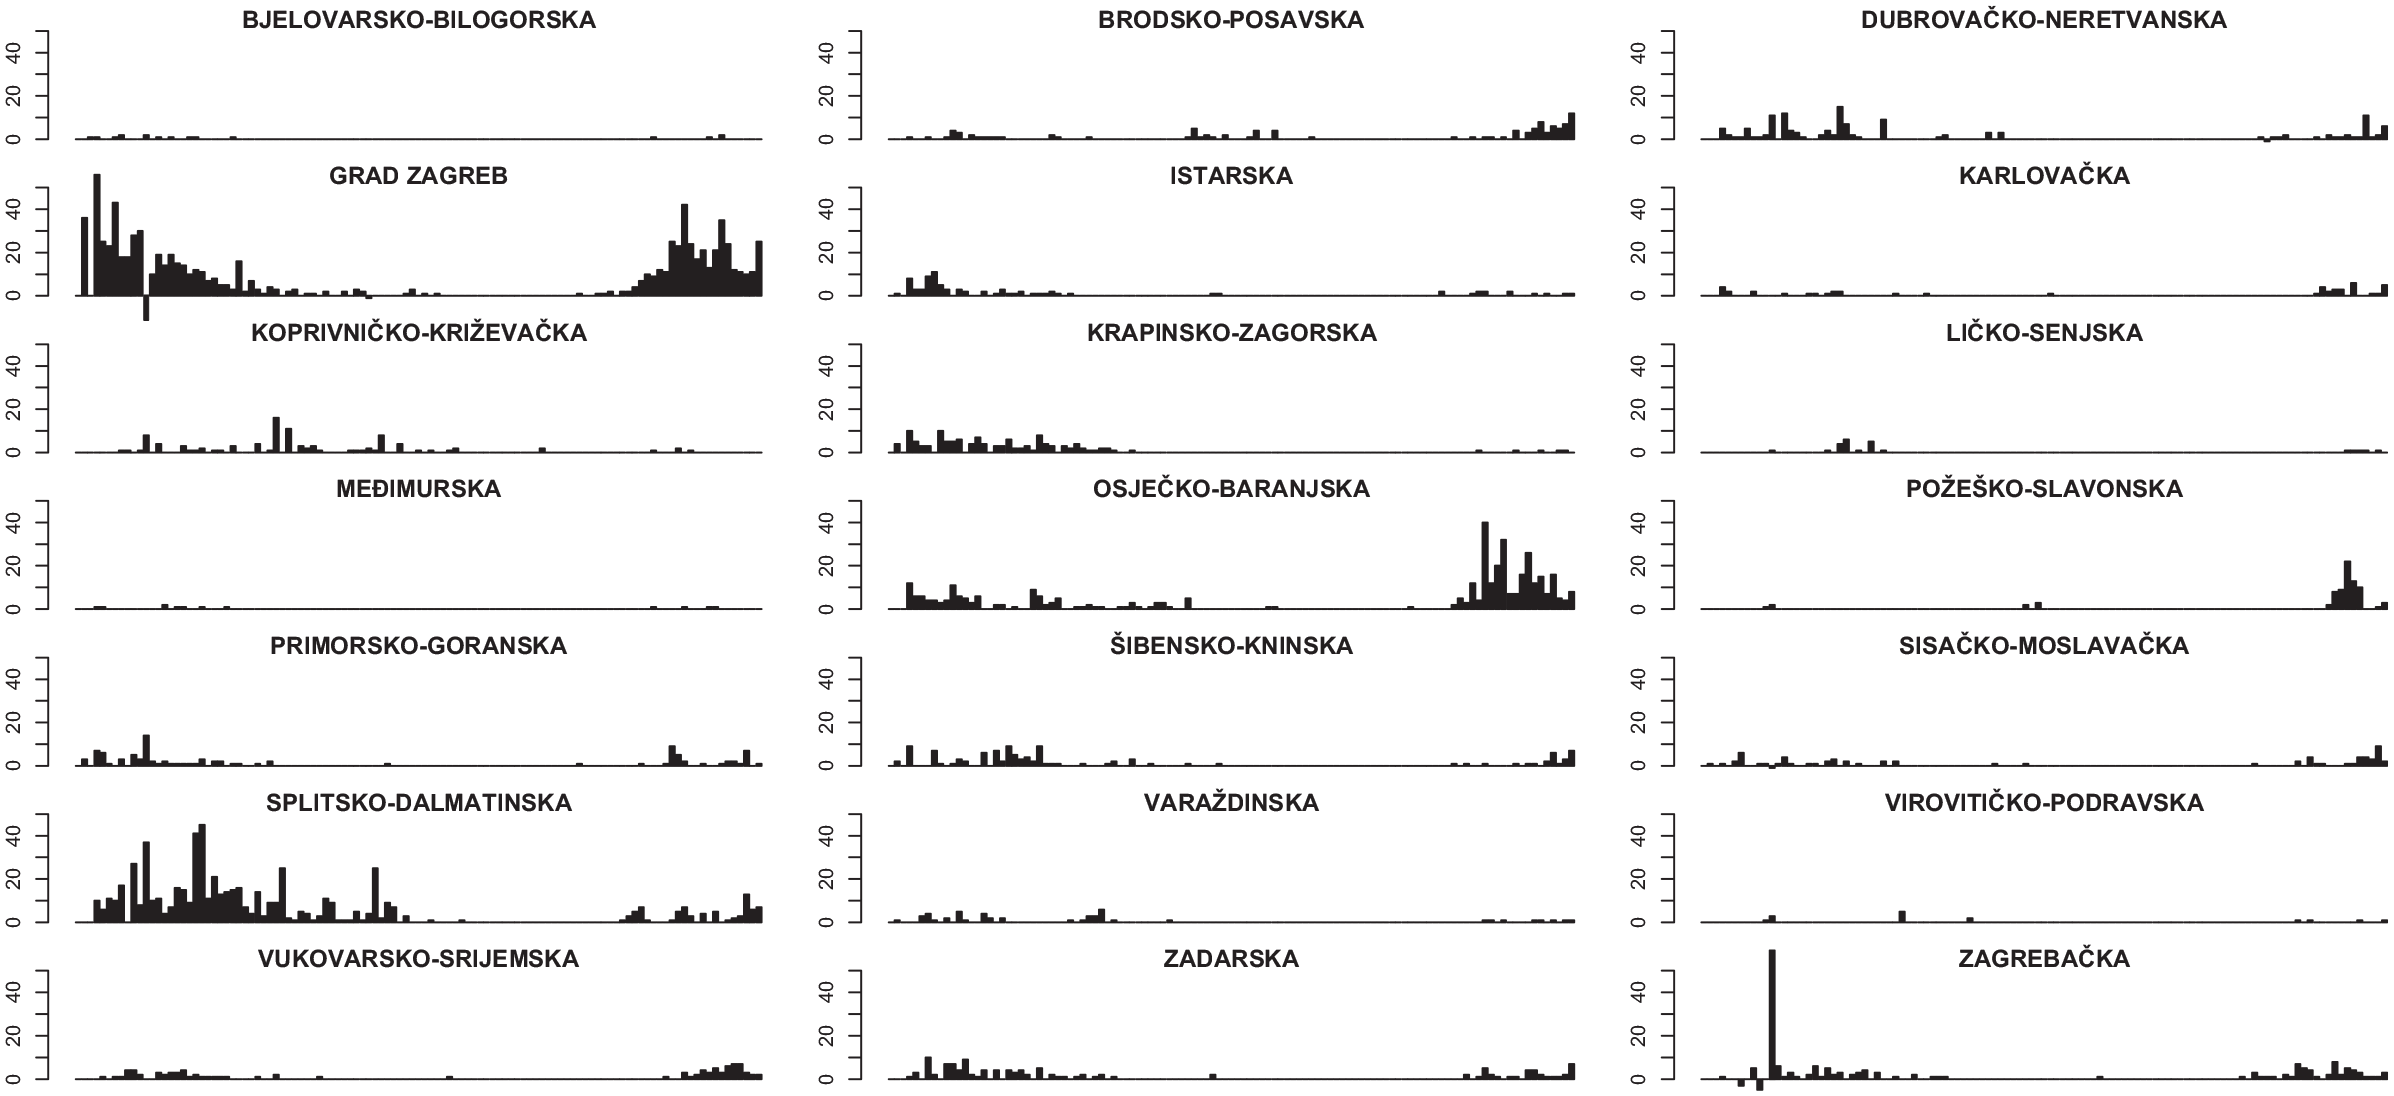
New Daily SARS-CoV-2 Reported Cases by County (Not Smoothed).
Second waves of infections are evident in some places, such as the City of Zagreb (Grad Zagreb) and Osječko-baranjska county, while others such as Splitsko-dalmatinska county only had a relatively pronounced early outbreak with very few cases since May. Thus, an alternative measure of the local epidemic is what percentage of the total number of infections occurred more recently. This measure is chosen instead of taking recent cases per 100,000 in the population, to distinguish between counties experiencing a second wave before the election instead of a first wave, and how this would affect aggregate voter behaviour. Hence, in the current study, ‘recent’ is taken to mean the month before the election, so the measure is
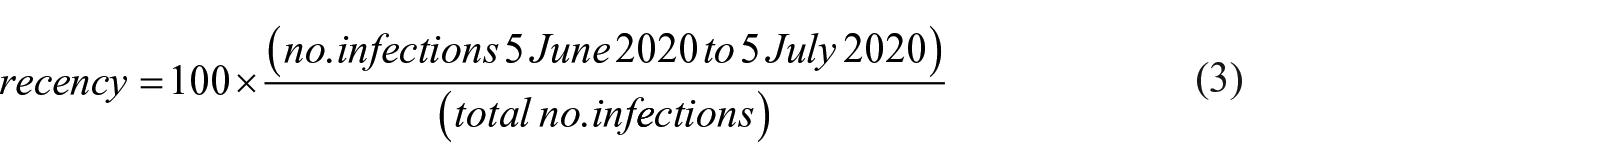
Thus, the possible impact of SARS-CoV-2 is measured in two different ways, either as recency or as intensity. The former is the county-level percentage of total infections in the month before the election (equation (3)). The latter is the total number of infections by county between 1 April 2020 and 5 July 2020 (inclusive), per 100,000 inhabitants (equation (2)).
The methods used for the analysis are presented in the next section.
Methods
The central challenge in the current study is how to estimate the average effect of SARS-CoV-2 on parliamentary electoral results. We start by temporarily simplifying our problem to one where SARS-CoV-2 infections are either present or absent in a county (‘treatment’ or ‘control’ groups using experimental language).
Since it is impossible to observe the same county in both infected and uninfected states, and to measure unit-level effects, it is necessary to estimate the effect as the mean difference between two counterfactual scenarios, or potential outcomes (Rubin, 1974). That is, we can estimate the average difference in outcomes between counties if they would have SARS-CoV-2 infections and counties if they would not.
The approach used in the analysis below is DD, which can be expressed as a regression model for panel data (i.e. repeated measures on the same unit) thus

where y is the outcome of interest for unit i at time t (either pre-treatment or post-treatment). The coefficient α captures the unit fixed effects and λ time fixed effects. The former accounts for time-invariant unobserved factors within a unit that are related to the outcome. For example, there are particular counties where the average HDZ support is always higher or lower. The time fixed effects accounts for constant factors across units. For example, HDZ could have performed better or worse on average across counties for a particular election. The term Si is our ‘treatment’ (e.g. whether there are SARS-CoV-2 infections), and dt is a dummy variable that is 1 in the post-treatment period and 0 otherwise. Thus, the interaction term is only non-zero in the post-treatment period for treated units, and δ is the DD estimate. The error term is εit.
Following the approach of Card (1992), Angrist and Pischke (2009: 234–235) show how, instead of a dummy term, Si can also be continuous. Thus, instead of a binary variable for whether a county has SARS-CoV-2 infections, the ‘treatment’ in the current analysis is continuous and measured as intensity or recency as outlined in the previous section. In other words, the DD estimate δ is the expected change in y between 2016 and 2020 when infection rates change, S2016, S2020. Note that S2016 (SARS-CoV-2 infection rates before the 2016 election) will always be 0, and the 2020 infection rate is non-zero, so the difference will simply be the absolute number of infections in 2020, S2020.
The crucial assumption of the DD framework is that it can identify differences in the trends between treated and control groups. Although DD studies are often a before-after analysis for two periods, this has its shortcomings. For example, the aforementioned findings linking New Jersey shark attacks and the 1916 US Presidential election are confounded by the anomalous 1912 election, due to the presence of a credible candidate from a third party (Theodore Roosevelt), which split the vote and benefitted Wilson, thus overstating the President’s electoral decline in 1916 (Fowler and Hall, 2018). It is thus necessary to include at least two pre-treatment periods to establish parallel trends before investigating whether there is a divergence post-treatment. We thus use two elections, 2015 and 2016, before the SARS-CoV-2 crisis. The form of equation (4) can be extended to more than two periods, as seen below.
There are a number of additional assumptions associated with DD, but we will focus on two that are most relevant to this study: anticipation and the stable unit treatment value assumption (SUTVA). The former means that voters could have anticipated the novel coronavirus outbreak in advance and this affected their behaviour in the previous election. However, the election was nearly 4 years before SARS-CoV-2 appeared and well before the first cases were confirmed in Croatia in February 2020. SUTVA also asserts that a unit’s potential outcome is not affected by the treatment level of other units. In other words, the effects of a treatment do not spill over into other subjects. This assumption is often a challenge in social scientific contexts (Keele, 2015: 317). In the present investigation, a major SARS-CoV-2 outbreak in a neighbouring community might affect voting behaviour. The way to address spillovers in this type of analysis, given availability of disaggregated data, is the trade-off between the number of cases (and thus statistical power) against a threat to SUTVA. For this study, the county level is the best that can be done to minimise problems with spillovers. Although there are statistical methods to analyse spatial error models for panel data (Millo and Piras, 2012), Gerber and Green (2012) illustrate the difficulties of modelling spatial spillovers properly. A simpler qualitative assumption is used here: counties are sufficiently large that voters will react only to their local county-level infection rates. Putting this together, the regression models estimated in the analysis will be of the form

where y is the outcome of interest (turnout or HDZ vote share),
The results are presented in the next section.
Results
Turnout in the 10 territorial constituencies decreased over the course of the three parliamentary elections examined here, while support for HDZ was slightly lower in 2015 compared to 2016 and nearly identical during the latter two elections (2016 and 2020). The interpretation is similar when looking at the average county-level HDZ vote share and turnout (see Table 1).
Turnout and HDZ Vote Share by Election (%).
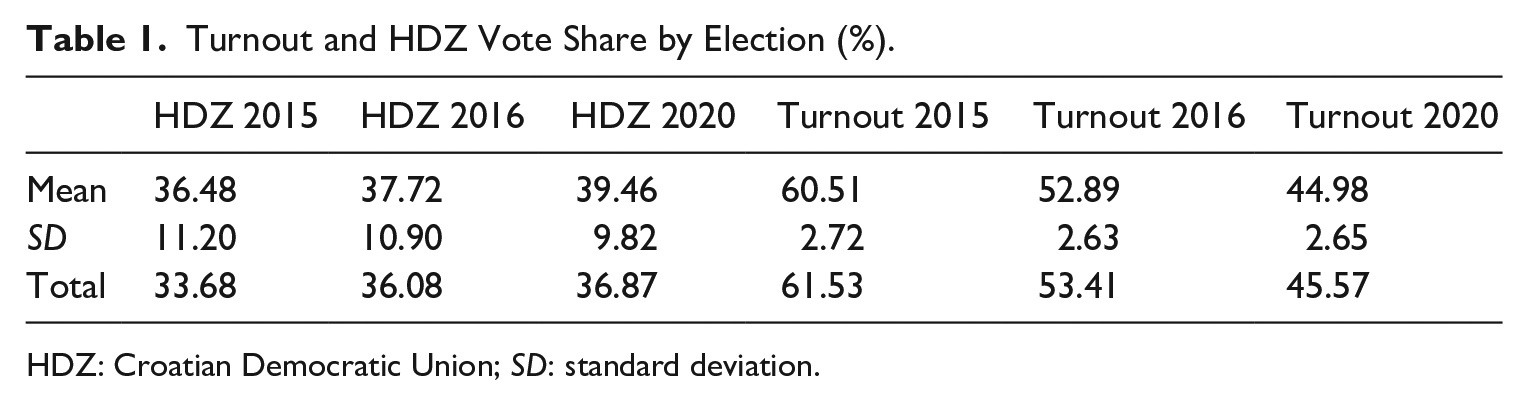
HDZ: Croatian Democratic Union; SD: standard deviation.
Turning to the county-level measures of SARS-CoV-2 infection, the average unlogged infection rate is 66.02 per 100,000 inhabitants (SD 37.59), and the logged infection rate mean is 3.99 (SD 0.71). On average, 26.72% of the total cases were reported in the month leading up to the election (SD 21.13). It is also important to highlight that the median for the unlogged infection rate is 51.40, which suggests that the distribution is positively skewed and that there are a few outliers with higher values. Moreover, there is high variation in the percentage of recent cases and infection rate per 100,000 across the counties. The measure of infection recency is uncorrelated with both the unlogged (r = 0.08) and logged (r = 0.05) versions of the infections reported per 100,000 inhabitants.
We fit six different models of the form in equation (5), one for each measure of SARS-CoV-2 infections and for the two outcomes of interest (see Table 2).
OLS Regression Results (n = 63).
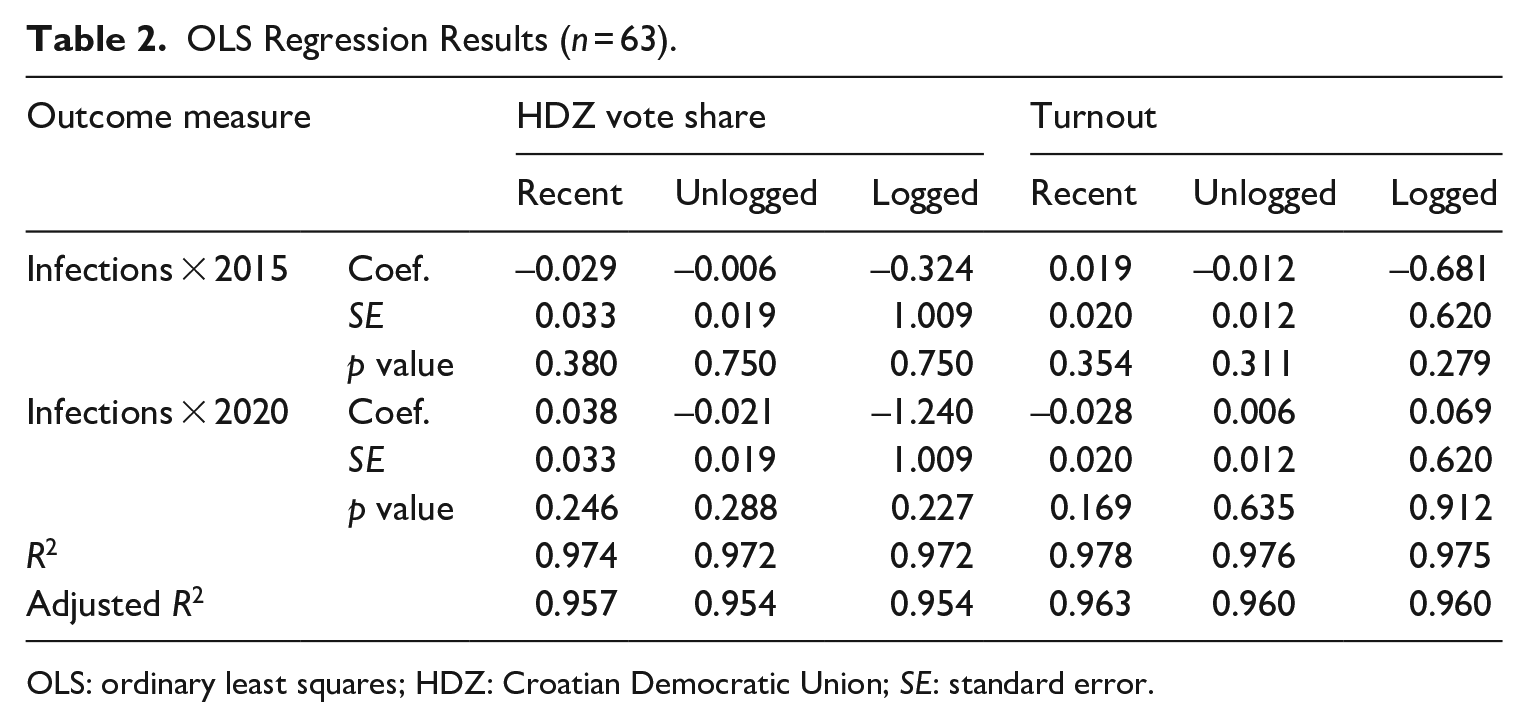
OLS: ordinary least squares; HDZ: Croatian Democratic Union; SE: standard error.
The estimated coefficients infections × 2015 in Table 2 correspond to
Turning to the primary focus of the analysis, the coefficients infections × 2020 correspond to
None of the models fit better with the two additional coefficients (using F-tests, not shown). With county-level fixed effects, compared with 2016, the average HDZ vote share increased by 1.74 percentage points (p = 0.002) and mean turnout decreased by 7.91 percentage points (p < 0.001) within counties in 2020. Thus, although counties with higher infection rates or a greater percentage of overall infections just before the election did not affect electoral behaviour on average, there were some global changes compared with 2016.
Discussion
The results suggest a lack of a localised political effect in the wake of a pandemic. Perhaps there will be a deferred electoral response to SARS-CoV-2, and this can easily be incorporated into the framework in equation (5) by adding future election years and the interaction term with the measure of SARS-CoV-2 infections. The results from the current analysis should be taken with caution, since there are only 21 Croatian counties, and so the statistical power of the analysis would only pick up larger effects.
What the results in this study show is that although there are no average localised electoral effects in Croatia, there may have been global responses. That is, voters perhaps did not react to the impact of county-level infections, but rather that information about the outbreak (and the HDZ-led government’s effort to tackle it) may have had an average national rather than local/individual effect, though other factors could have also been at play.
Another consideration is whether there are exogenous time-varying confounders. The county fixed effects account for time-invariant factors, but not for factors that have changed between 2015 and 2020 and may affect electoral behaviours. These confounders can easily be added to the DD framework outlined above (Angrist and Pischke, 2009). However, the confounders need to be exogenous, that is, unaffected by the treatment. If the confounders are endogenous, then the estimate of the DD effect can be biased. The problem with estimating the electoral effects of SARS-CoV-2 is that the most obvious time-varying confounders are prone to endogeneity. For example, electoral results and turnout can be affected by the overall approval rating for a government or support for a governing or opposition political party, which can be measured using regular public opinion data. Another confounding factor is the recent level of economic prosperity, which has a well-established link to electoral behaviour. However, SARS-CoV-2 infection rates and the government’s perceived handling of the crisis can affect approval ratings, which in turn condition electoral behaviour. Moreover, the SARS-CoV-2 outbreak can be directly linked to unemployment, with illness, lockdown and consumer anxiety all possible causes for an economic slowdown.
The sternest test in conducting analyses linking SARS-CoV-2 to electoral behaviour is the reliability of the data on the ‘treatment’, that is, measures of infection rates. Using the raw counts, scaling by population, logged infections or other transformations may lead to different conclusions in DD analyses (Goodman-Bacon and Marcus, 2020). The trajectory of new infections, hospitalisations and deaths are all highly politically sensitive, and it may be in the interest of the relevant government to manipulate data such that its handling of the crisis appears effective. At worst, governments can withhold infections information in anticipation of an election or to protect approval ratings. For example, this appears to be the case in Serbia, where an investigation showed that numbers of deaths and those testing positive for SARS-CoV-2 were suppressed between March and June 2020 (Jovanovic, 2020).
Even without possible malfeasance, testing data need to be approached carefully. The reported new infections will sometimes be delayed depending on the day of the week (e.g. data from the weekend), and the results are retrospectively amended. For this reason, it is advised to use a smoothed rolling average to detect trends in the data (as in Figure 1). Moreover, as explained above, increases in the number of cases can be due to increased testing or changes in the testing regime.
Finally, SARS-CoV-2 testing data, like any diagnostic health testing, has a certain proportion of false positives and false negatives, which may lead to misleading aggregate data. The proportion of true positives (sensitivity) and true negatives (specificity) for RT-PCR are unknown for SARS-CoV-2, as is the incidence of infections, so the reliability of testing is estimated through clinical trials.
In general, if there is low incidence of infection, then testing will be vulnerable to false positives, and if infection rates are high, then the rate of false negatives increases (Ismail, 2020).
Despite these challenges, the framework uses two readily available forms of data in most democratic systems – electoral and detailed SARS-CoV-2 election data – and a relatively straightforward causal inference framework for the analysis. This allows for the approach to be used in other contexts and will be more effective in places with more electoral units. As mentioned above, it is crucial to trade-off between statistical power and avoiding possible spillover effects. For example, it would be possible to use the DD approach to estimate the effect of SARS-CoV-2 in the US Presidential election in November 2020 using state-level data. Alternatively, it may be possible to apply DD in swing states to estimate the electoral effect of SARS-CoV-2 infection rates in swing states with a sufficient number of counties (e.g. Georgia or Michigan).
Thus, it may be possible to investigate the impact of this unconventional global pandemic on the conventional workings of electoral democracies around the world.
Footnotes
Declaration of conflicting interests
The author(s) declared no potential conflicts of interest with respect to the research, authorship and/or publication of this article.
Funding
The author(s) received no financial support for the research, authorship and/or publication of this article.