
Abstract
The 2020 US presidential election was won by Democrat challenger Joseph Biden over Republican incumbent Donald Trump and was contested during the global Coronavirus Disease 2019 (COVID-19) pandemic. Unemployment increased sharply during the pandemic but was followed by a large federal relief package. We investigate whether there was economic voting in the 2020 election, that is, whether the increased unemployment rate and the subsequent government response during the pandemic affected Trump’s vote negatively or positively overall. We examine 48 states (by excluding Alaska, Hawaii, and DC). Using a triple-differences (DDD) model (that is, examining changes in a candidate’s county-level vote-share depending on the change in unemployment and historical Republican-Democrat partisanship), we predict what would have happened if the increase in unemployment rate in between March and October 2020 had been more modest. Although many states show significant negative expected impacts on the Trump vote, we predict that only when when the unemployment rates experience little change during the pandemic would overall results have swung in the incumbent’s favour – and only then in Arizona and Georgia.
Introduction
The 2020 presidential election was contested against the backdrop of the Coronavirus Disease 2019 (COVID-19) pandemic, between the Republican incumbent Donald Trump and the Democrat challenger, Joe Biden. The election campaign was one of the more heated in recent memory, due to a number of controversies during the Trump presidency. Related to the pandemic, the President’s messaging was often at odds with his scientific advisors, with Trump downplaying the severity of the public health crisis. The pandemic also affected the presidential campaign and voting procedures, with the suspension of mass political rallies and with the widespread availability and use of postal voting.
Despite the controversies surrounding the President’s response to the pandemic, and how the pandemic shaped the election itself, there is little consistent evidence directly linking local COVID-19 pandemic levels to electoral outcomes (Arroyo Abad & Maurer, 2020). Although there is a growing body of literature on the effect of the severity of the pandemic (measured by the case or mortality rate) on the US presidential election (e.g., Baccini et al., 2021), less attention has been paid to the impact of the resulting economic slowdown on the 2020 presidential election.
The COVID-19 pandemic did not only represent a global health crisis, but the resulting “Great Lockdown” of economic activity led to the worst worldwide recession since the Great Depression (Gopinath, 2020). The financial fallout of the pandemic was particularly severe in the US. The unemployment rate increased by 10.3 percentage points to 14.7 per cent, the highest monthly increase in unemployment and highest unemployment rate since records began in 1948 (BLS, 2020b). On the other hand, the US Government responded with the $2 trillion Coronavirus Aid, Relief, and Economic Security (CARES) Act, which included direct payments to individual taxpayers, extended unemployment insurance, health care and state/local government funding, and small-business loans (Davis et al., 2020).
We will thus explore this gap in the existing research, looking at whether there is evidence of economic voting in the 2020 presidential election, that is, whether the unprecedented spike in US unemployment rates and the large relief package soon afterwards had an overall negative or positive impact on Trump’s vote share within states, excluding Hawaii, Alaska, and the District of Columbia.
We ask the following questions about the 2020 US presidential election: 1. Is there evidence that the county-level economic shock during the pandemic impacted Trump’s vote share in the 2020 presidential election (economic voting)? • If so, was there a positive or negative impact? 2. Using predicted county-level unemployment changes to construct simple counterfactuals: • would more modest shifts in unemployment rate during the pandemic predict significant changes in Trump’s state-level vote shares relative to Biden? • would these changes in predicted support for Trump be sufficient to change the state-level results?
In the next section, we will review the relevant literature on economic voting, followed by a description of the sources of data and methods used for the analysis. The results of the analysis are presented and discussed in the final part of the study.
Economic and Post-disaster Voting
Fiorina (1981) views an election as a “referendum” on the incumbent government with voters using simple (economic) performance measures to aid in decision-making (Healy & Malhotra, 2013). Lewis-Beck (1986) identifies four dimensions that encapsulate the debates around explaining this sort of voting behaviour: retrospective versus prospective; individual versus collective; cognitive versus affective; and simple versus mediated.
First, citizens may judge the incumbent’s performance and decide on prospective benefits, that is, which candidate will do better in the future (Chappell & Keech, 1985; Duch & Stevenson, 2008); or voters make a retrospective decision on the incumbent’s performance in the period prior to an election to either reward or punish them for how they have done (Ferejohn, 1986; Fiorina, 1978). On the second dimension, Kinder and Kiewiet (1979) distinguish between voter decisions based on individual “pocketbook” evaluations of the economic situation, or whether voters reflect on collective macro-economic “sociotropic” conditions before casting their ballot. In other words, it may be argued that economic voting is triggered by personal financial (“pocketbook”) circumstances, for example, recent experience of unemployment, rather than macro-economic (“sociotropic”) conditions. However, an analysis of US Presidential elections from the American National Election Study (ANES) between 1960 and 1980 shows little evidence of “pocketbook” voting (Kiewiet, 1983), a finding corroborated in later elections (Lewis-Beck & Stegmaier, 2007).
Healy and Malhotra (2013) further state that these first two dimensions developed from an informal to a formalised rational-choice understanding of voting behaviour. However, other scholarship extends this cognitive understanding of economic voting, and has also considered affective or emotional factors that help determine voter decisions in light of the economic situation (Conover & Feldman, 1986).
Nonetheless, the cognitive understanding of economic voting predominates. Lewis-Beck and Stegmaier (2013) summarise the consensus of the existing public choice economic voting literature, the most relevant of which to this study are as follows: evidence of economic voting is almost always statistically significant; sociotropic economic voting has more of an impact than pocketbook economic voting; retrospective economic voting is stronger than prospective economic voting; micro-level and macro-level research are consistent; unemployment, inflation, and growth are the most important indicators for the economic vote; and voters tend to only remember the recent past when deciding on their vote.
Additional debates in the literature focus on whether economic voting is simple or mediated (Fiorina, 1981; Lewis-Beck, 1986), and voter behaviour in the wake of natural disasters more generally. The simple indicator is whether individuals believe that unemployment has improved or worsened. By contrast, a mediated evaluation asks for voters to make independent simple evaluations and appraise whether they are connected. For example, the question “do you think that the government’s policies have improved or worsened unemployment?” requires evaluations of government policy, unemployment, and the nature of the relationship between the two (Lewis-Beck, 1986).
Voter perception of the economic situation and government policy is particularly relevant in the case of natural disasters. This is because the lack of proactive government policies that may be at fault in the short-term and long-term suffering of vulnerable populations in the face of disaster (O’Keefe et al., 1976).
Indeed, different types of natural disasters across time and geographic context are associated with governmental turnover (Chang & Berdiev, 2015). This begs the question whether voters are misguided, blaming incumbent political leaders for the impacts of natural disasters that are beyond the control of any human intervention (Healy & Malhotra, 2013). For example, Healy et al. (2010) showed that the results of the local college American football team - something clearly beyond the control of the incumbent - affect local and national electoral results. Moreover, voters tend to not reward incumbent presidents for investment in disaster preparedness (Healy & Malhotra, 2009). This type of “blind retrospection” (Achen & Bartels, 2016) weakens the legitimacy of voters as reliable arbiters of political accountability in the wake of natural disasters (Heersink et al., 2020).
However, there are at least two arguments against “blind retrospection”. First, recent research shows that the direct relationship between the natural disaster and electoral outcomes is weak or not statistically significant (Albrecht, 2017; Bodet et al., 2016; Fowler & Hall, 2018).
More importantly, there is evidence of “attentive retrospection” (Heersink et al., 2020) whereby incumbent governments are actually rewarded for disaster response, such as a prompt declaration of an emergency (Gasper & Reeves, 2011; Healy & Malhotra, 2009). Relevant to this study, Healy and Malhotra (2010) show that voters did not punish incumbents dependent on the number of fatalities caused by tornadoes, but economic losses did negatively impact incumbents. In other words, voters did not tend to punish incumbents for events perceived to be beyond governmental control, but did sanction their leaders for matters deemed to be within their duties.
Crucially for this article, Healy and Malhotra (2009) demonstrate that relief payments in the wake of natural disasters provide an individual-level (“pocketbook”) positive impact on incumbent votes. In particular, they show that county-level incumbent vote share is positively associated with direct individual payments but not collective funding. In the case of the pandemic response, among other CARES initiatives, unemployed individuals received direct assistance through: additional weekly (financial) benefits; additional time of receiving benefits; and widening of eligibility for unemployment insurance.
Our reliance on county (macro-level) data to claim about the individual (micro-level) impact of economic conditions on electoral behaviour could be prone to an ecological fallacy, that is, inferring incorrectly about individual behaviours from aggregate patterns.
Recent individual-level studies have shown evidence of the negative impact of unemployment on vote choice (Ahlquist et al., 2020; Healy et al., 2017), including in the 2020 US presidential election (Wu & Huber, 2021). Relevant to the current study, Park and Reeves (2020) demonstrate that local unemployment levels impact individual vote choice in US presidential elections. Crucially, studies that rely on county-level economic and voting data, as we do in this article, also demonstrate evidence of economic voting related to state-level per capita income growth (Eisenberg & Ketcham, 2004), county-level changes in wages (De Benedictis-Kessner & Warshaw, 2020), and county-level unemployment rates (Wright, 2012).
Still, despite the consistent finding between micro-level and macro-level research, we cannot conclusively infer individual-level behaviours from county-level pooled cross-section data, and we should exercise caution with our findings.
Putting this together, the post-disaster voting literature adjusts the assumptions of economic voting used here, that it is mediated, cognitive, retrospective, and consistent between the macro-level (counties) and micro-level (individuals). Furthermore, vote choice is based on recent sociotropic appraisals of (increased) local unemployment on the one hand, while also including pocketbook considerations because of direct relief payments. In other words, we presume a performance-based mechanism of economic voting where individuals make subjective judgments of recent retrospective incumbent economic performance for vote choice.
Thus, we build on existing work examining the relationship between case rates or mortality during the pandemic (non-economic losses) in the US (Baccini et al., 2021) and comparatively (Santana et al., 2020), by focusing instead on the effect of economic gains and losses on the 2020 US presidential election outcomes.
The next section will outline the data and methods used.
Data and Methods
The analysis uses US county-level election and unemployment data, along with additional socio-demographic and COVID-19 county-level data. The unemployment and electoral data used different geographic boundaries for Alaska, and there were no unemployment data for Kalawao County in Hawaii. For these reasons, Alaska and Hawaii, along with the District of Columbia (DC), are excluded from the analysis. This results in an analysis of 3107 counties. County-level descriptive statistics are presented in the Appendix (Table A2).
MIT Election Data and Science Lab (2018) has collected county-level US presidential election data 2000–2020. The outcome of interest in the analysis below is the county-level vote share margin in percentages between the two political parties, defined as Republican minus Democrat. Thus, the margin is positive when Republicans have a higher vote share and negative when Democrats have a higher vote share.
The primary explanatory variable for our analysis used monthly county-level unemployment data US Bureau of Labor Statistics.
1
Looking at these data, there was a small increase in mean unemployment in March 2020, followed by a sharp increase in April 2020. Employment slowly rebounded before the election (see Figure 1). Mean monthly county-level unemployment rate, January 2019 to October 2020 (excluding Alaska, Hawaii, and DC).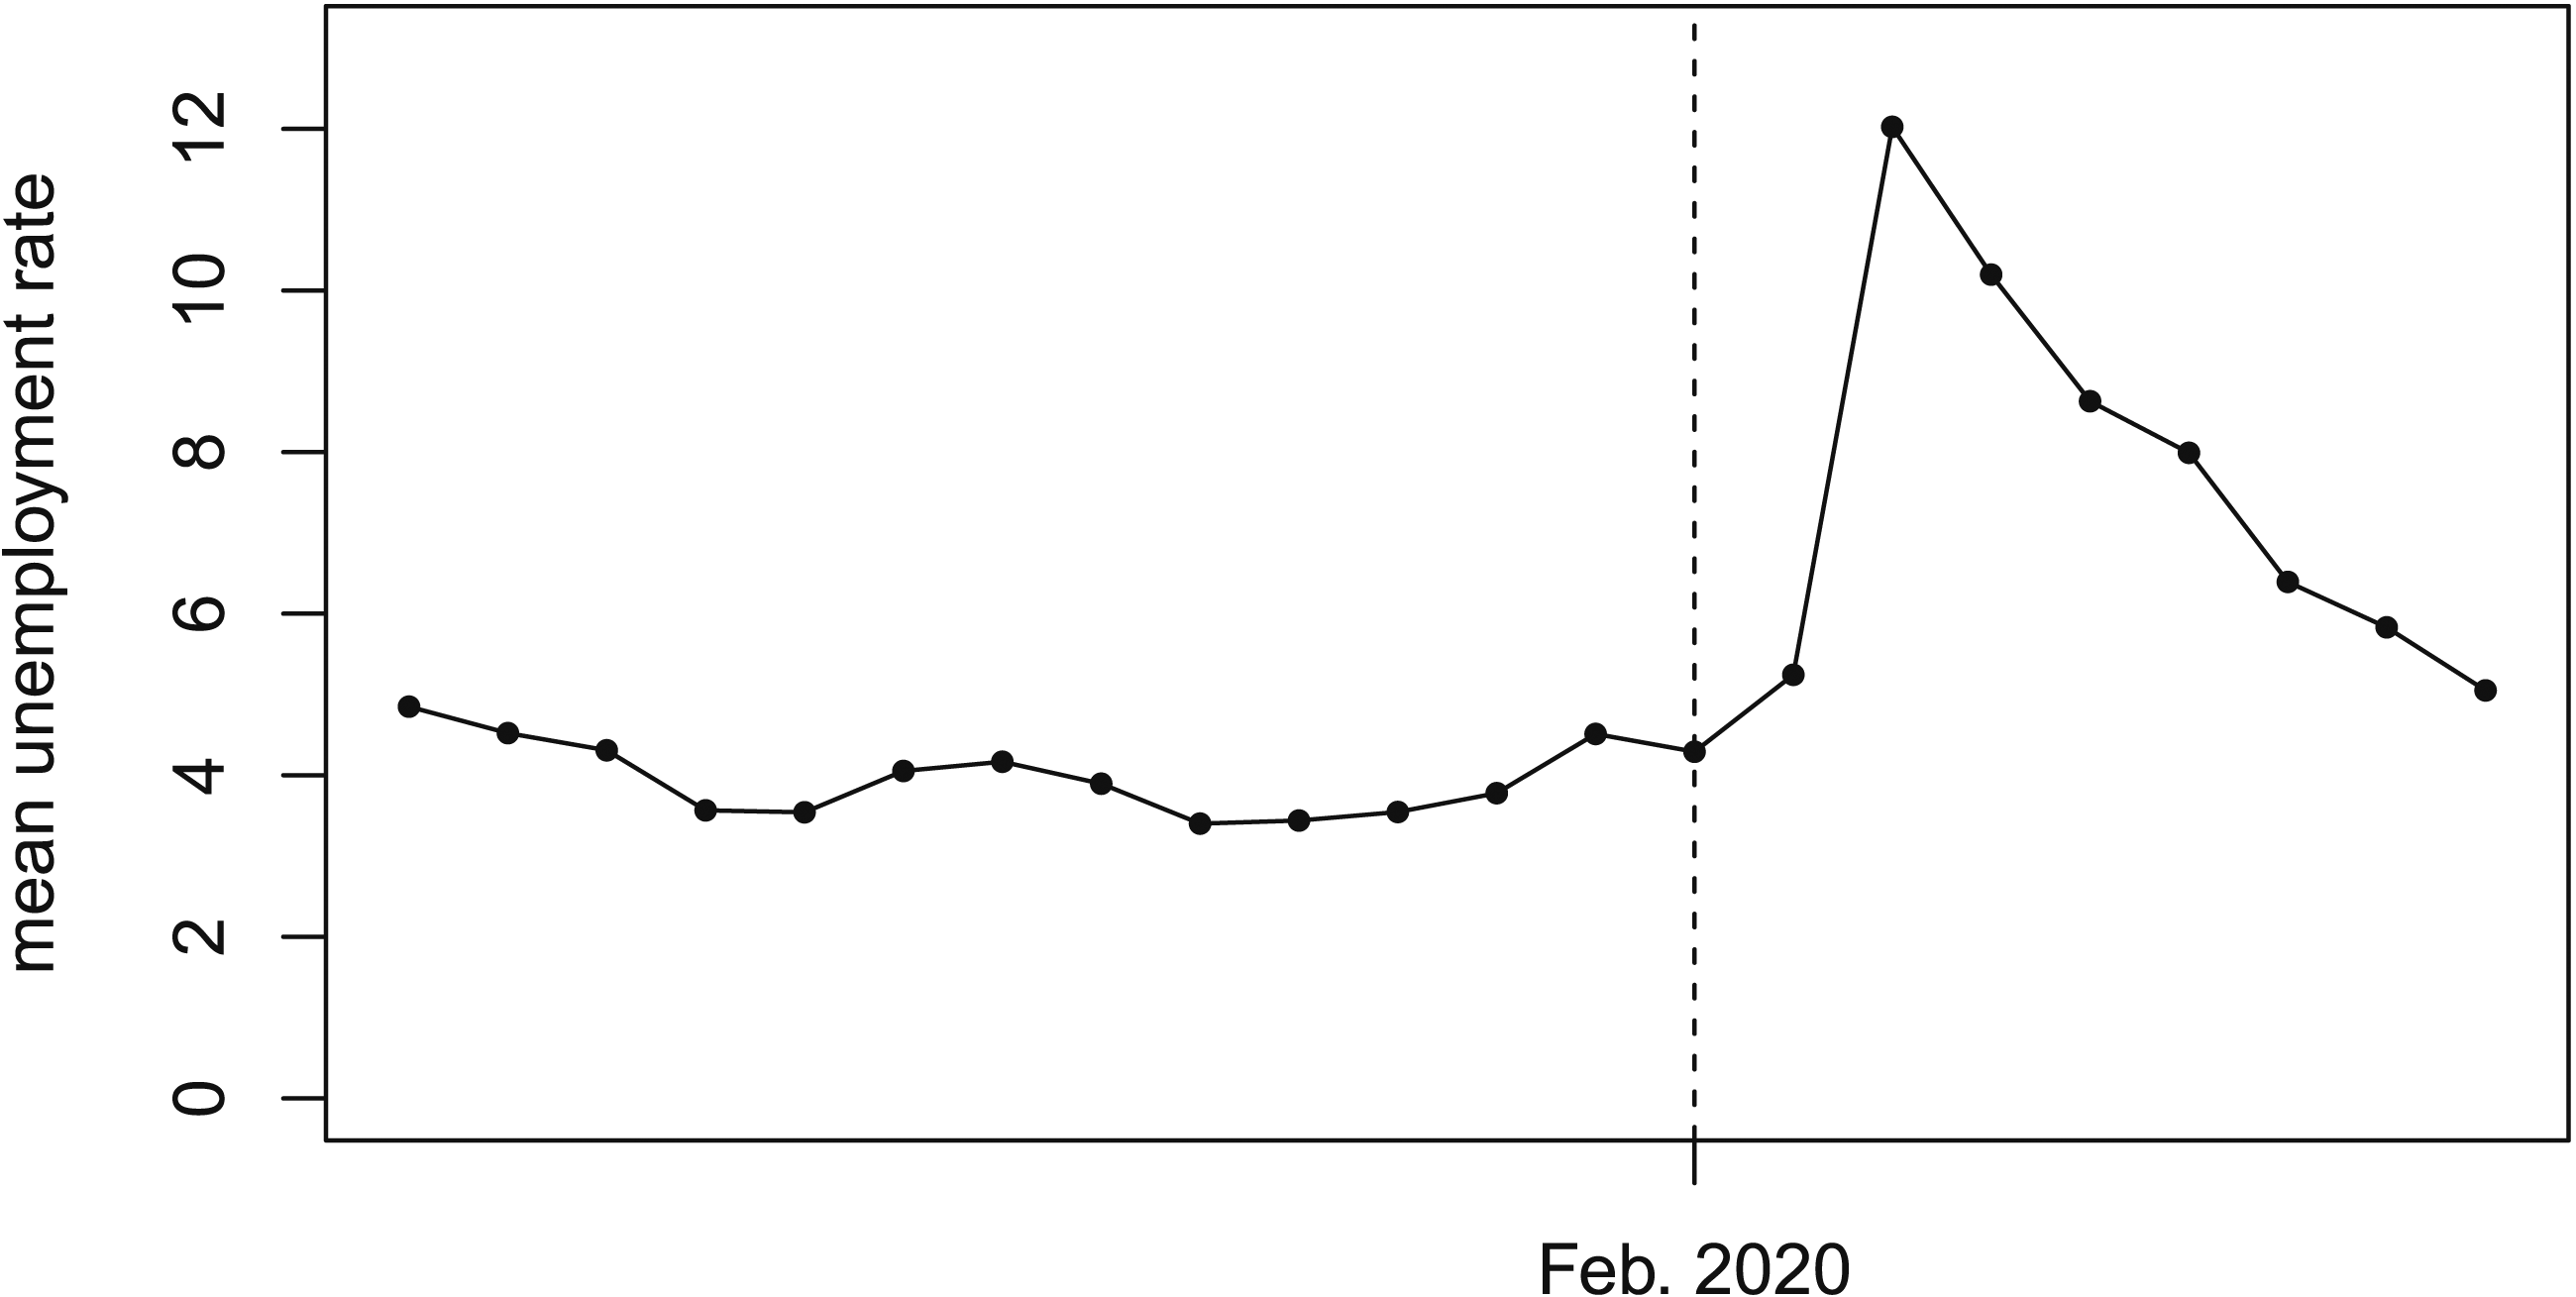
To measure unemployment change, we thus took the average unemployment rate during the seven months before the election (April-October 2020) and subtracted the average unemployment in the seven months prior to that (September 2019 - March 2020). For example, the mean monthly unemployment rate in Fulton County (Georgia) was 9.45 per cent between April and October 2020 and 3.49 per cent between September 2019 and March 2020, so the unemployment change will be 5.96 percentage points. Thus, if the run-up to the election has higher average unemployment compared with the previous period, then the value will be positive, and close to zero if there is little change between the two periods.
We chose these periods, since the increase in unemployment occurred in the eight months before the election. If voters compare the economic shock during the pandemic with the previous period, this may affect their vote choice on average (and change the Republican-Democrat margin). By contrast, the same measure of unemployment change is practically zero on average comparing the same periods before the 2016 election (see Figure A1 in the Appendix).
A primary objective of this study is to use the data to estimate a counterfactual scenario where the economic slowdown (triggering increased unemployment and also the governmental response) had been less pronounced, holding other factors constant.
The average change in the outcome of interest cannot be reduced to the average Republican-Democrat margin in 2020, since counties tended to be more supportive of one of the parties, so we used the difference in the partisan margin between 2016 and 2020. Thus, the analytical framework will estimate how unemployment change between 2016 and 2020 affected the difference in the Republican-Democrat margin between the two elections on average, or in other words difference-in-differences (DID).
However, we may also expect the impact of unemployment change to be different on average among “red” and “blue” counties. For this reason, we extend the DID setup examining all counties within a state to model how the change in Republican-Democrat margin is affected by the county-level partisanship. We thus use a difference-in-difference-in-differences – or triple-differences (DDD) estimator – in the analysis below (Olden & Møen, 2022).
DID and DDD models usually use a binary treatment variable, but in their study of the effect of female labour mobilization on wages, Acemoglu et al. (2004) modelled the intensity of the treatment by taking the difference of percentage of women in the workforce in 1940 and 1950 by state. In the current analysis, we will take the county-level measure for 2019–2020 unemployment change as the treatment variable, which is continuous rather than binary. Note that we are taking the 2015–2016 unemployment change to be zero (as justified above).
We will fit a model for all of the counties together, thus assuming the same within-county effects across all states. However, we also account for time-invariant state-level effects by including a dummy variable for state.
The results could still be affected by time-varying confounders. We thus add information about county-level COVID-19 case rates, since they may impact both the economic situation and the electoral result. We collected the number of reported novel cumulative coronavirus cases compiled by the New York Times and deposited on GitHub. 2 To scale COVID-19 cases by population (per 10,000 inhabitants), we used mid-2020 population estimates from the US Census Bureau. Since our modelling approach uses panel data, this value is used for 2020, while the case rate is set to zero for all counties in 2016 (since this was before the start of the pandemic).
Beyond the overall result of the election, the other headline in 2020 was that turnout had increased substantially, with an estimated 158.4 million votes cast in 2020 compared with 137 million in 2016 (DeSilver, 2021). However, if increased turnout is an intermediate cause, then it is a “bad control” that biases the estimated effect of unemployment change (Angrist & Pischke, 2009; Cinelli et al., 2024). In other words, if the increased unemployment after the pandemic caused a “post-treatment” change in turnout, then it is a “bad control”. Indeed, increased unemployment has been shown to be a “mobilizer” for increased electoral turnout in the US (Burden & Wichowsky, 2014). However, the comparative literature is divided as to whether unemployment leads to voter mobilization or withdrawal (Azzollini, 2021). Either way, turnout is a “bad control” and should be excluded from the model, since it is intermediate in the causal chain between the treatment (economic change) and outcome (voting) and would thus bias the estimate of the direct impact of the economic shock on voting patterns.
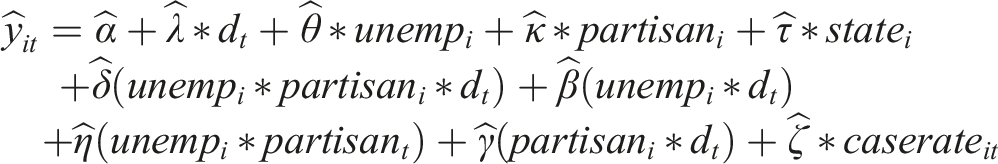
Putting this together, the DDD regression model can be expressed in the following way:
The results of the analysis are presented in the next section.
Results
Regression model estimated coefficients.
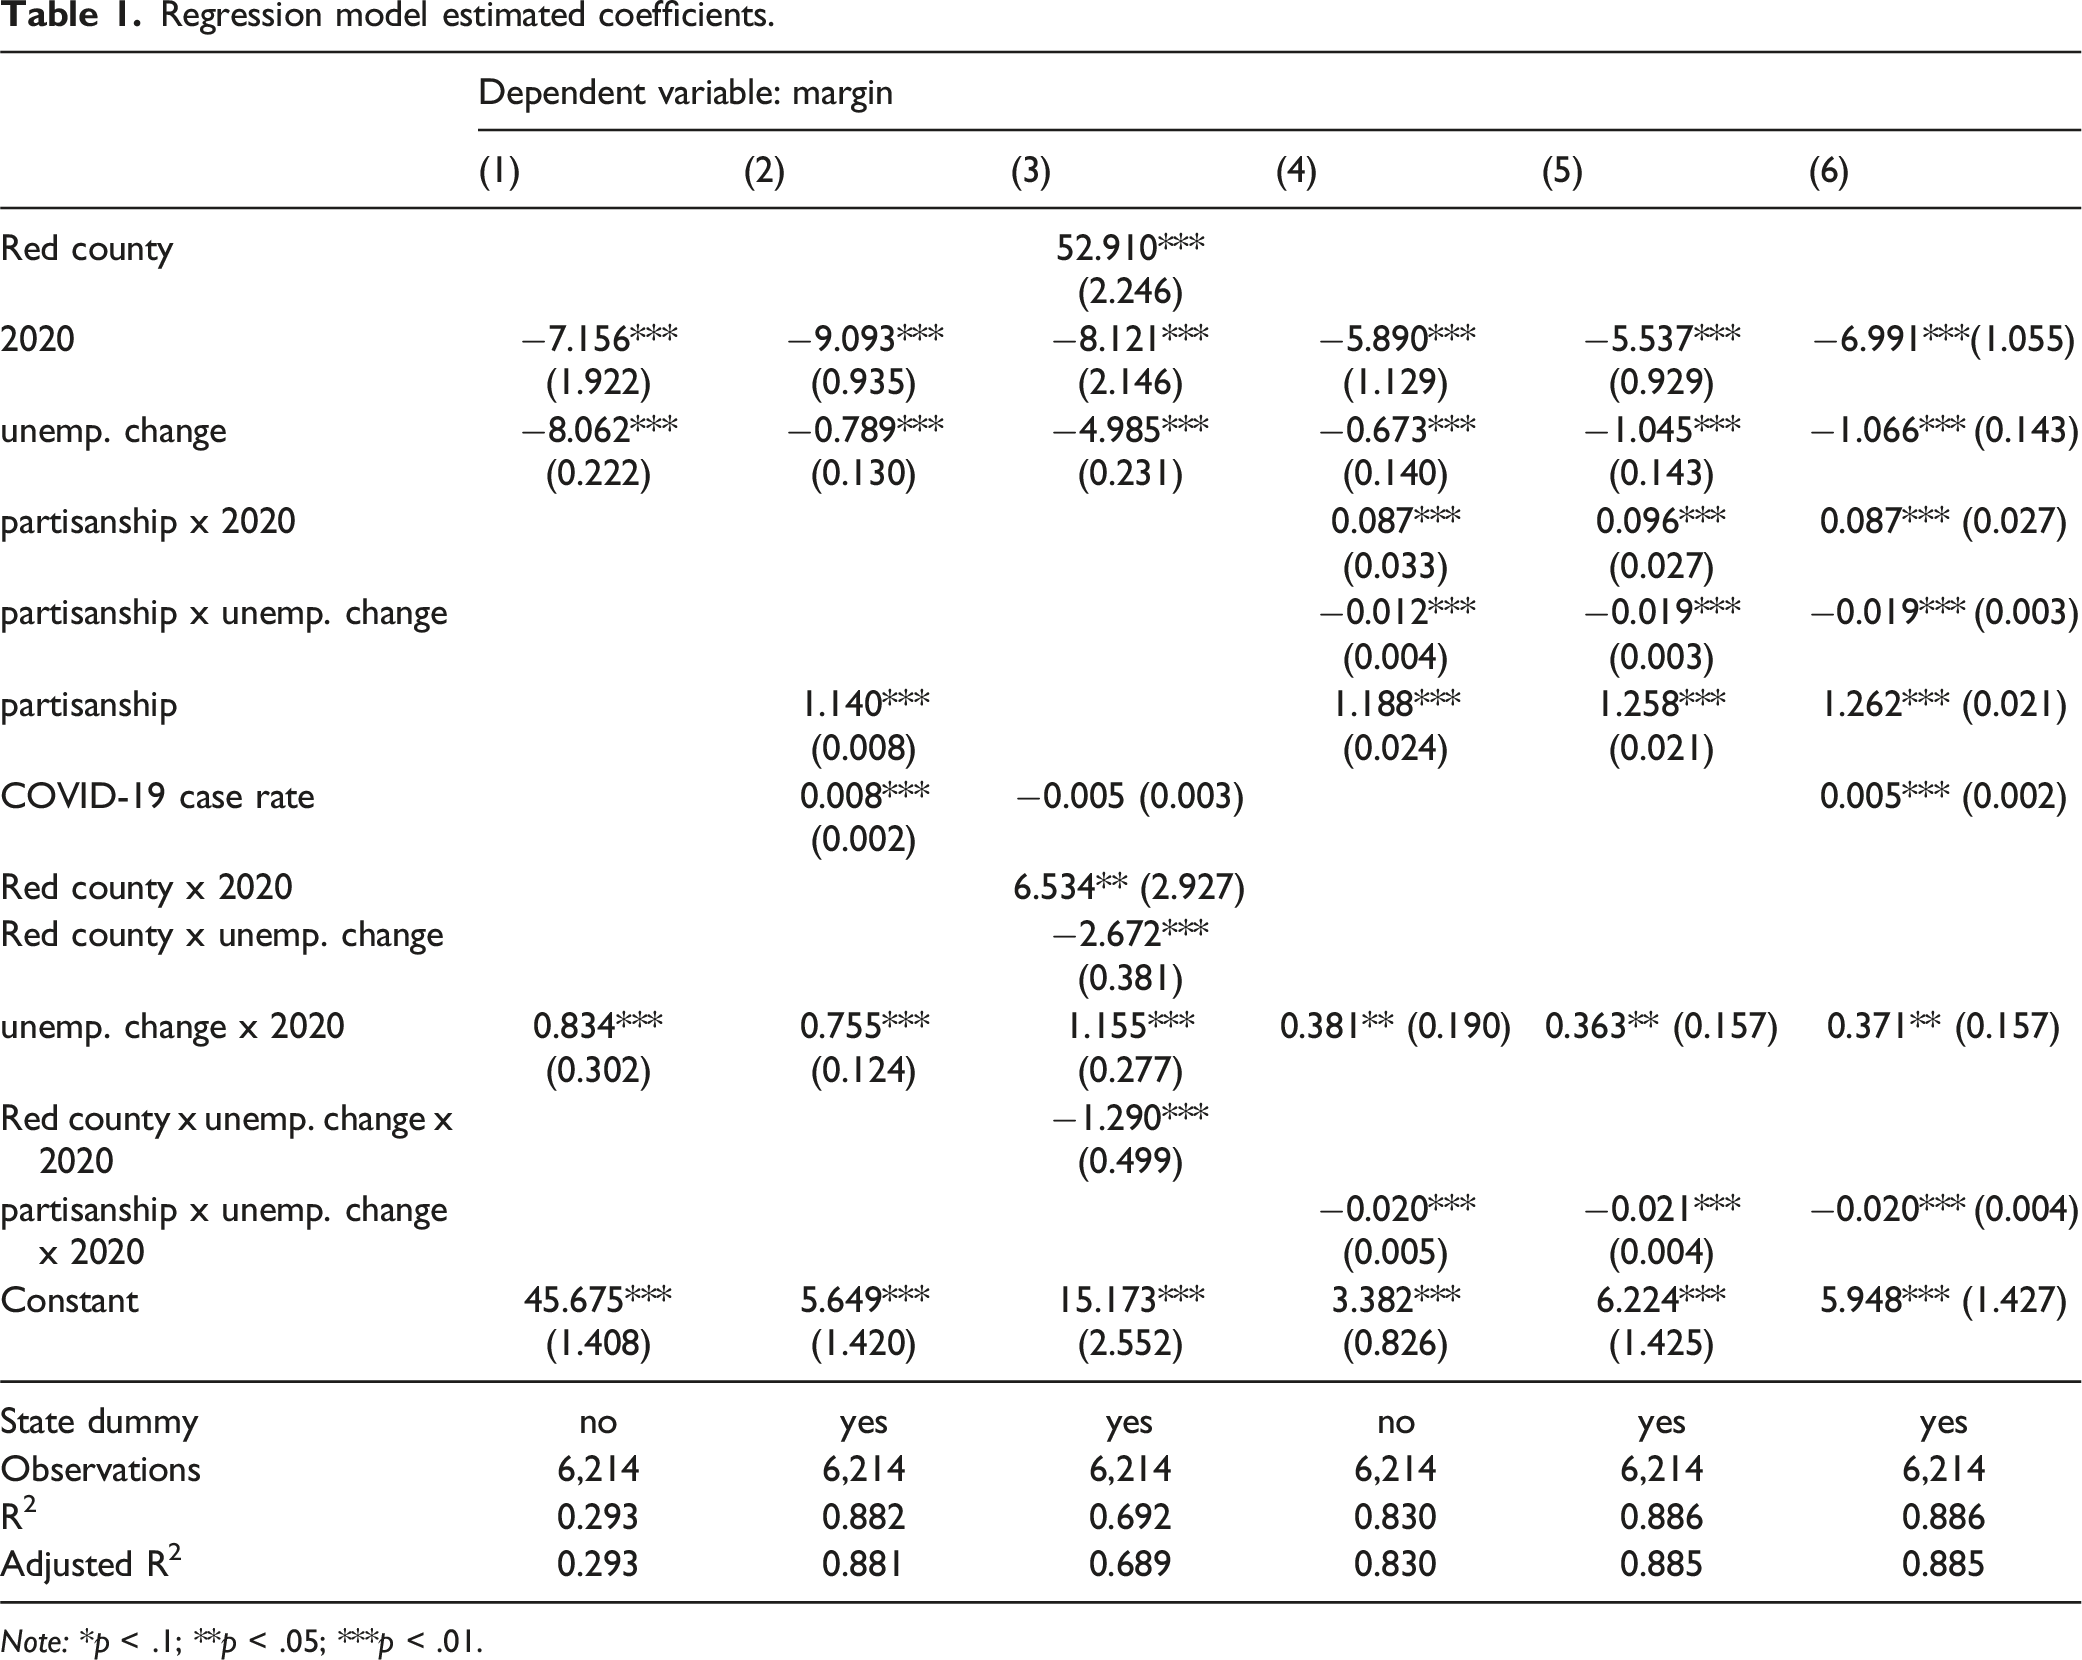
Note: *p < .1; **p < .05; ***p < .01.
The DID estimate (unemp. change x 2020) without adding any additional controls is 0.83 (Model 1). When we add the COVID-19 case rate, partisanship, and state fixed effects, the DID estimate decreases slightly to 0.76 (Model 2). Interestingly, the DID estimate is positive, which means that the estimated impact of higher unemployment change is higher expected Republican-Democrat margin. Specifically, a county-level increase of one percentage point in unemployment change leads to an expected increase of 0.76 percentage points in the vote share for Trump relative to the Democrat candidate.
Partisanship is first introduced as a binary indicator (Model 3), distinguishing between counties that have voted Republican (“red”) or Democrat (“blue”) on average 2000–2012. Fitting a DDD model, the estimated coefficient for unemp. change x 2020 is 1.15 and −1.29 for Red county x unemp. change x 2020. This means that a one percentage point increase in unemployment change increases the Republican-Democrat margin by 1.15 percentage points in blue counties. By contrast, a one percentage point increase in unemployment change decreases the Republican-Democrat margin by 0.14 percentage points in red counties. Hence, the nature of the impact of pandemic economic change differs in red and blue counties.
We then estimate the DDD model with a continuous measure for partisanship, including the COVID-19 case rate as a control and state fixed effects (Model 6). The estimated coefficient for unemp. change x 2020 is 0.37 and −0.02 for partisanship x unemp. change x 2020. In other words, for counties with equal numbers of Republican and Democrat voters (that is, partisanship is 0), a county-level increase of one percentage point in unemployment change leads to an expected increase of 0.37 percentage points in the Republican-Democrat margin.
For an increase of one percentage point in partisanship (that is, the county is more “red”), the impact of unemployment change on expected Republican-Democrat margin decreases by 0.02, or conversely, when a county is more “blue”, the expected impact increases. Moreover, when partisanship exceeds 19 per cent, there is a negative impact of unemployment change on Republican-Democrat that becomes more negative as the county is more “red”.
Predicted differences in margin between unemployment changes of 0 and 3.5 percentage points, for different levels of partisanship.
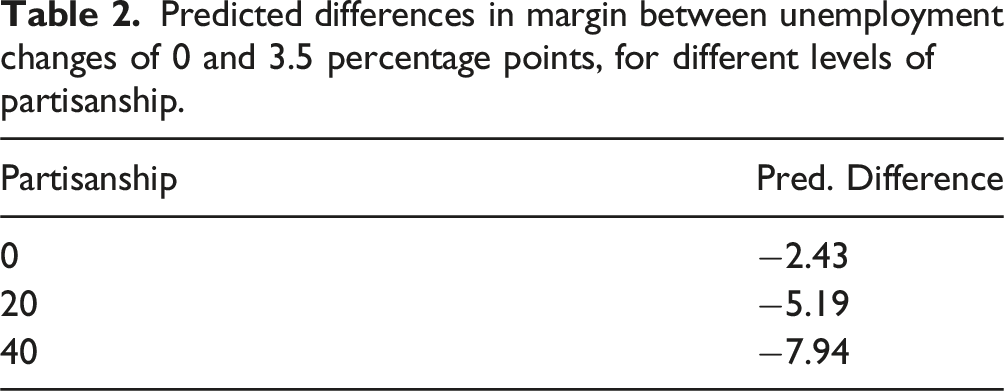
In counties that have even numbers of Democrat and Republican voters, the Republican-Democrat margin decreases by 2.43 percentage points for a median level of unemployment change. The predicted Democrat-Republican margin decreases by 5.19 percentage points when partisanship is 20 percentage points, and a sizable 7.94 percentage points when partisanship is 40 percentage points. We thus find that the predicted changes in Republican-Democrat margin become more negative as the county is more “red”.
The DDD model assumes the same within-county relationship, but these can be heterogeneous depending on other characteristics. We thus collected further socio-demographic data, on education 3 , ethnicity 4 , poverty 5 , and pre-pandemic leisure/hospitality sector employment 6 . We chose this sector, since it was the hardest hit by the economic slowdown, with job losses of nearly 50 per cent at the start of the pandemic (BLS, 2020a). Descriptive statistics are available in the Appendix, Table A2.
We examined the same DDD specification on different subsets of the data, which were compared with the full data set (Appendix, Table A3). Although there is some variation, the DDD estimate remains negative, significant, and of similar magnitude.
We also checked that the results are consistent if we chose Republican two-party vote share as the dependent variable instead and calculate partisanship correspondingly (Appendix, Table A4). As with Republican-Democrat margin, there is a significant positive DID estimate and smaller negative DDD estimate.
Turning to the second research question posed, could less pronounced county-level economic shocks significantly change state-level results? To investigate this, the final part of the analysis constructs simple counterfactuals by multiplying the observed unemployment change by a factor less than one (keeping COVID-19 case rate and partisanship the same), to predict what the Republican-Democrat margin would have been in 2020 if the county-level unemployment change had improved by 20, 40, and 80 per cent. The three values represent moderate, large, and very large reductions in unemployment change. The way this is calculated for county i is:
Using the Fulton County example above, the actual unemployment change in 2019–2020 was 5.96 percentage points, so we predict what the margin would have been in the county if the unemployment change had been 20 per cent lower, or 4.77 percentage points, keeping the other variables at their observed values. We then predict what the margin would have been in other Georgia counties with a 20 per cent improvement in unemployment change in the same way, and then aggregate the results for state s (Georgia in this example) using the equation: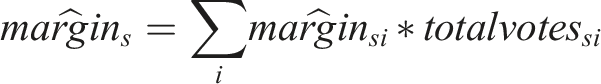
However, since the county-level results are not independent, we cannot simply add the uncertainty from each county-level prediction to construct a state-level confidence interval. Hence, we simulated the estimate and 95 per cent confidence intervals by taking 1000 random draws from a multivariate normal sampling distribution using rvnorm (Genz et al., 2020). The results are presented in Figure 2. Predicted changes in state-level Republican-Democrat margin for improvements in unemployment change by 20, 40, and 80 per cent 2.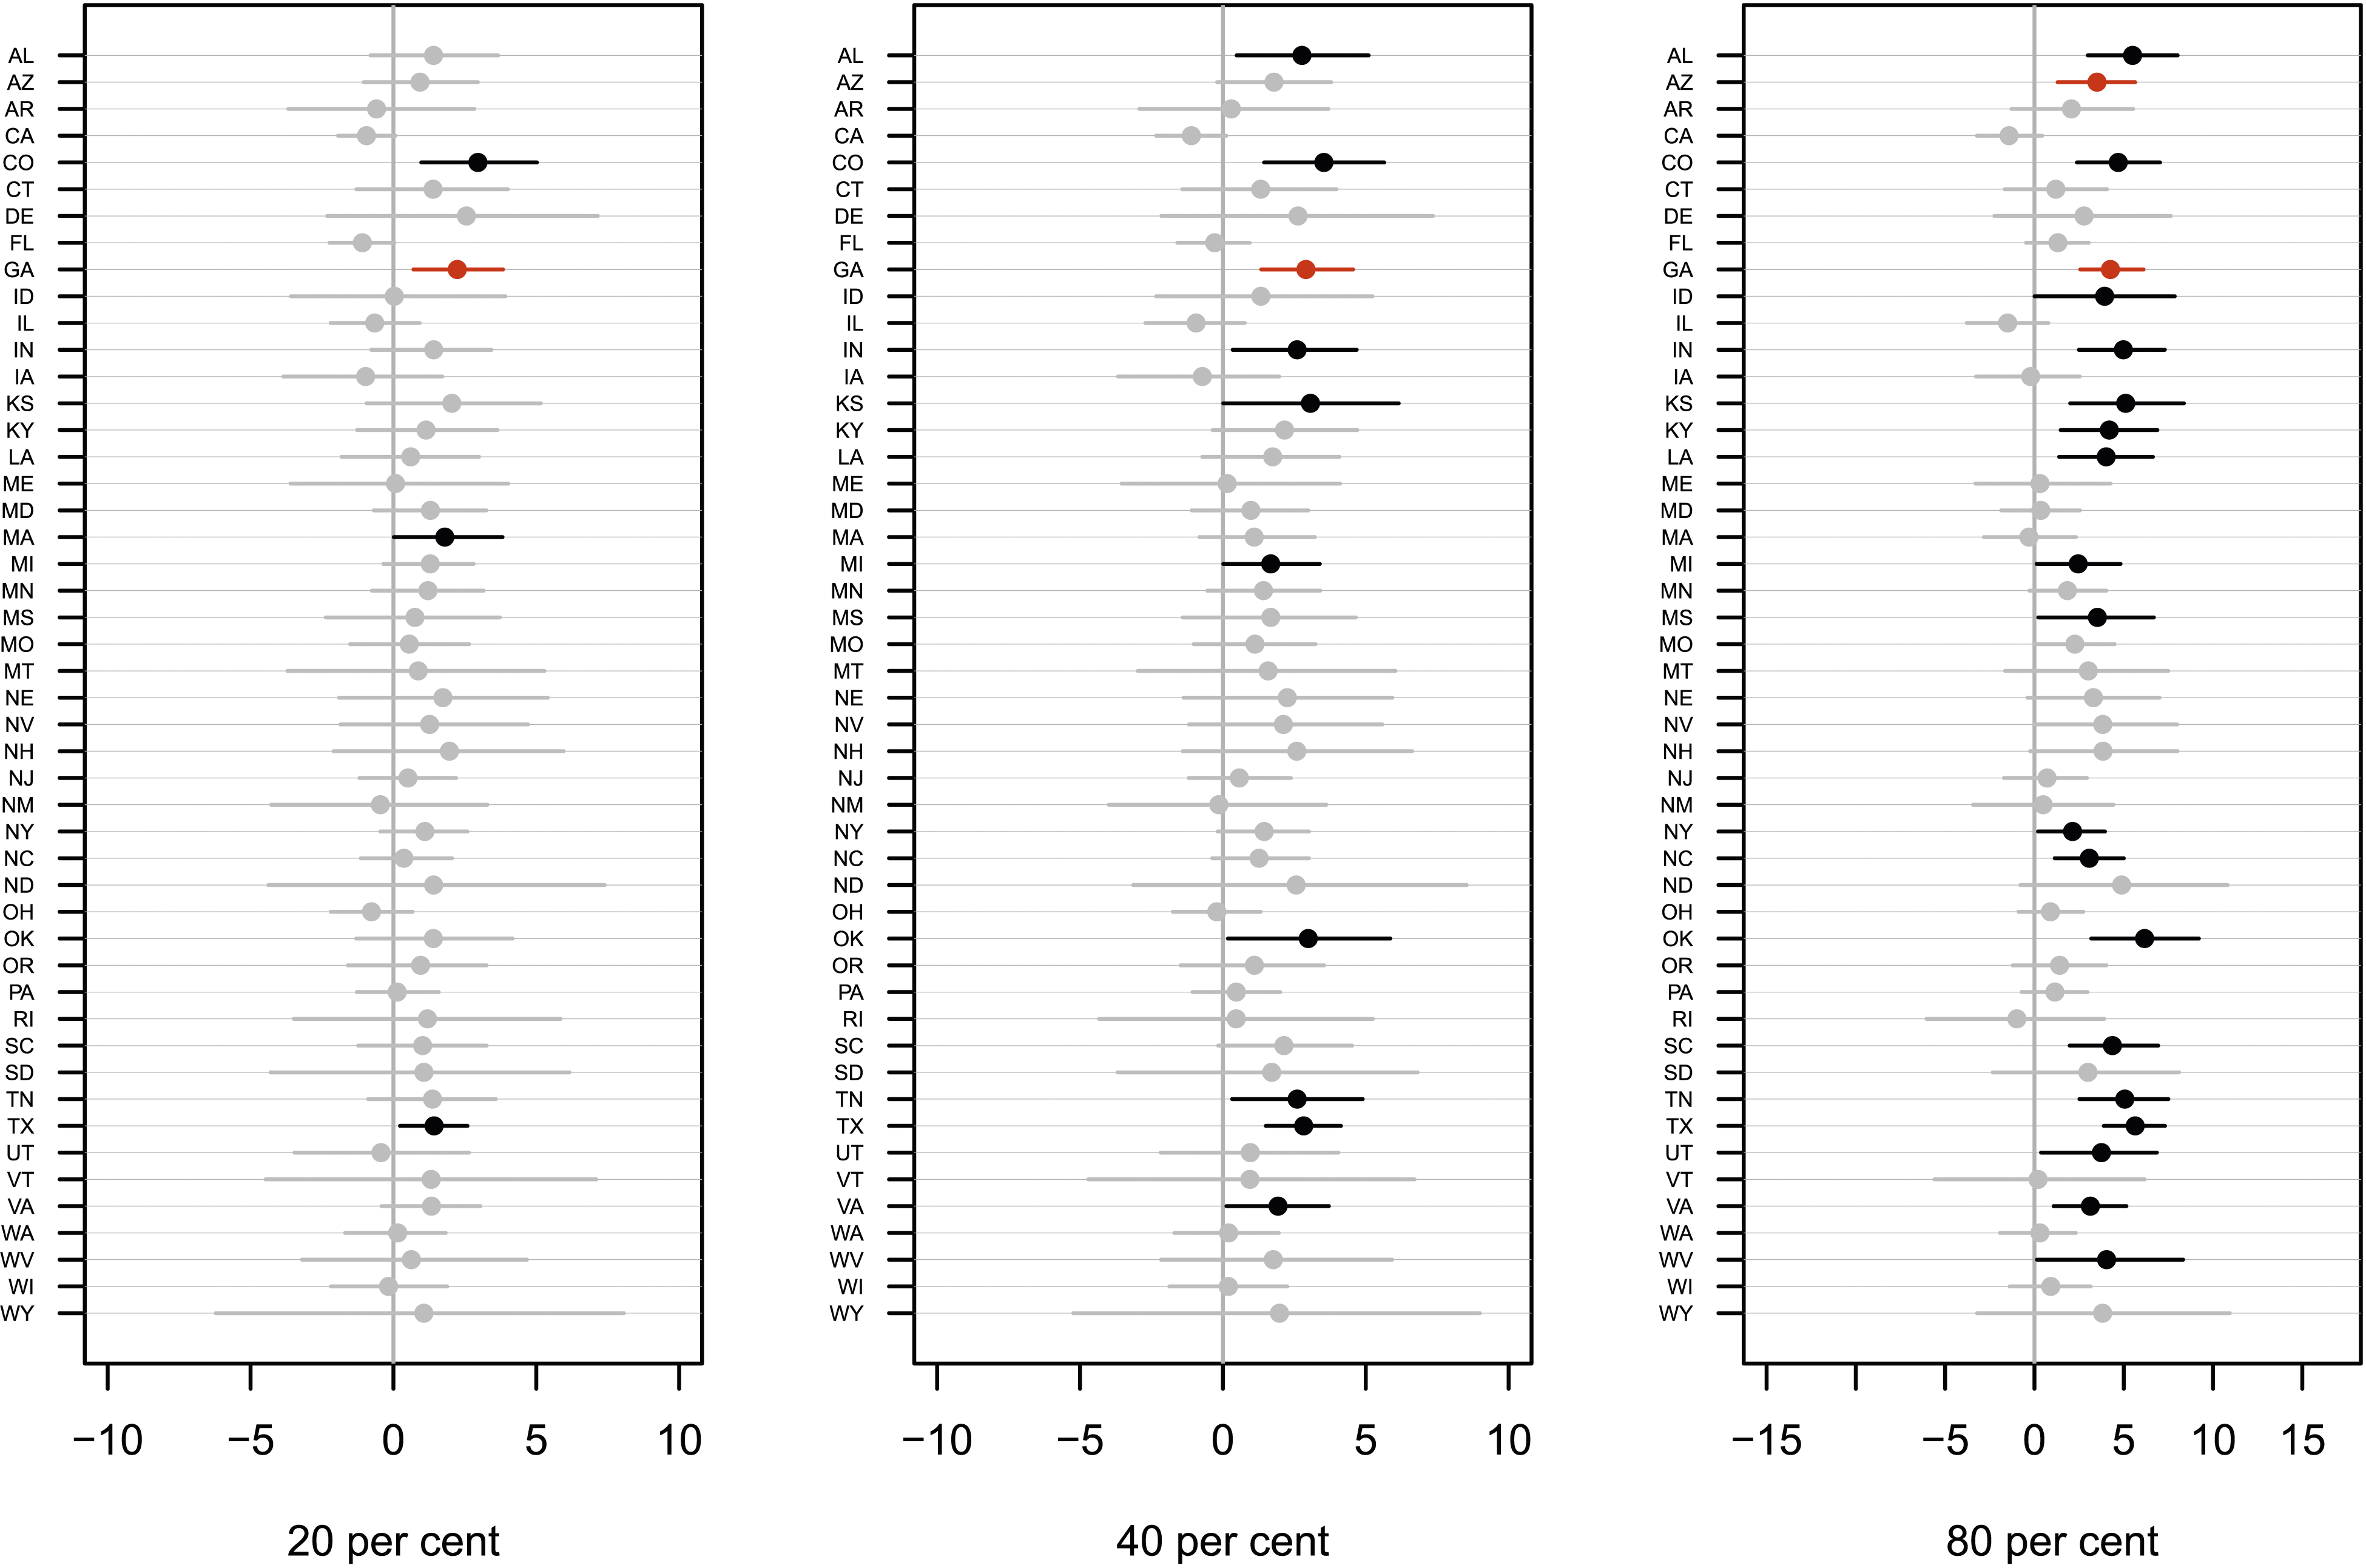
In Figure 2, states with a significant predicted change in Republican-Democrat margin (at the 95% confidence level) are indicated in black. 7 States indicated in red are where the predicted result is different from the observed result. We see that the predicted results would be significantly better for Trump in 4 states with a moderate 20 per cent improvement in unemployment change in every county, in 10 states with a large 40 per cent improvement in unemployment change in every county, and in 21 states with a very large 80 per cent improvement in unemployment change in every county.
Although a number of states show evidence of predicted economic voting, these changes would only have been favourable in overall state-level results with a very large reduction in unemployment change. If county-level unemployment change improves universally by 20 per cent, the predicted result only changes in Georgia. Even at the level of 80 per cent improvement in county-level change would there be sufficient predicted gains for Trump to win in only Georgia and Arizona.
Discussion
Revisiting the first question posed at the start of this article, there is a statistically significant positive DID estimate and negative DDD estimate. These results suggests that, counterintuitively, Trump did better in counties more affected by the pandemic economic slowdown, and that this impact tended to be more pronounced in more Democrat (“blue”) counties. This aligns with previous studies showing that incumbent presidents benefit from post-disaster relief when this is direct and disbursed to individuals (Healy & Malhotra, 2009), such as the extended unemployment benefits in the CARES Act. On the other hand, increased unemployment during the pandemic negatively impacted Trump more the more “red” a county was.
Examining the second set of questions, the predicted state-level margin changed significantly in favour of the Republican incumbent during the 2020 presidential election in a number of states if the unemployment change had been improved by 20, 40, or 80 per cent. However, the predicted overall result changed in Arizona and Georgia only when unemployment change had been better by 80 per cent.
This evidence of a significant estimated effect in our study is seemingly contrary to similar county-level analyses that find no impact of economic voting linked to unemployment change (Baccini et al., 2021; Eisenberg & Ketcham, 2004). By contrast, we find that the more “blue” the county, the better Trump did in the wake of the economic slowdown, and conversely, he did worse in more “red” counties. Moreover, we find that the negative effect in “red” counties was sufficient to exceed the positive impact in “blue” counties and significantly reduce the vote share for Trump in a number of states, changing the overall result in Arizona and Georgia. This partisan heterogeneity resonates with other studies that conclude unemployment has a “partisan” dimension rather than being purely a “valence” issue (Wright, 2012).
This being said, the results of our analysis need to be taken with some caution. We presumed that the findings are not vulnerable to an ecological fallacy based on comparative evidence, but we cannot directly analyse the corresponding individual-level data. It may also be argued that this simple counterfactual is unrealistic, that is, improving unemployment change while keeping other variables fixed, particularly COVID-19 case rate. However, Dreger and Gros (2021) show that any impact of COVID-19 case rate on unemployment is substantively very small. We also checked by regressing unemployment change on COVID-19 case rate (with state fixed effects), and find the relationship to be small and insignificant (p = .23).
Our model also assumed that there is a within-state economic voting effect that is the same on average across states, but allows for a state-level time-invariant effect. It is difficult to account for all possible observable and unobservable confounders, though we have controlled for the COVID-19 case rate. We also showed that there were only moderate levels of heterogeneity in the estimated effect by subsetting on a number of key socio-demographic variables.
We still need to further examine why voters in red counties were more likely to blame the President, which was then reflected during the election, when the division of authority between state and federal levels is not clear-cut.
There is a complex inter-connection between emergencies, state-level and federal policies, and context-specific understandings of attributing responsibility by voters. It is the latter which is the most important to the current study, and lies at the heart of the American political system. The tenth amendment of the US constitution posits that powers not held by the federal government are reserved by states (or to the people). However, there is ambiguity in the division of responsibilities for new policy issues, and furthermore, states are independent and not subordinate entities in the federal system (Chesney, 2020).
In response to the tension between federalist and anti-federalist perspectives, the division of competencies between state and national governments was explicit from the late 1700s as a form of “dual federalism”, which evolved to a symbiotic “cooperative federalism” between state and national governments built on a foundation of consent in the 1930s (Strong, 1938). Although local governments and the federal level were interdependent at this time, this relationship has eroded and resulted in more bottom-up local challenges to federal authority (Riverstone-Newell, 2012).
In more recent times, the historic amiable relationship between the President and state Governors has given way to “polarised” and “punitive” federalism (Goelzhauser & Konisky, 2020). Hence, there is no natural partisan preference for greater or less state rights. Rather, consensual or conflictual relations depend on the political party of the President and Governor (Jensen, 2017).
Turning to the pandemic, the President’s own pronouncements about responsibility were inconsistent. Trump downplayed the severity of the pandemic initially, encouraging state governors to lead on the response, not issuing a national stay-at-home order, and only declaring a national state of emergency on 13 March 2020. However, the President also intervened the following month and asserted the right to unilaterally coerce states to lift restrictions (Colvin et al., 2020). On the other hand, state governors sought nationwide coordination from the President in terms of funding and health supplies, and many governors felt that the federal leadership was inadequate (McCaskill & Ollstein, 2020). Constitutionally, as mentioned above, both states and federal authorities have responsibilities, with governors leading on social restrictions (such as policing), while the President leads on financing the response (Selin, 2020).
Despite the lack of a partisan foundation for prioritising state or federal rights, national-level survey data during the pandemic show that there are partisan patterns regarding attitudes on who should have been leading in the response and who was perceived to actually be leading relief efforts. Republican voters tended to believe that the state government should lead the response, while the responses of who actually led leaned slightly towards Trump compared with the state government (The Economist & YouGov, 2020). Conversely, Democrats tended to believe that Trump should have led relief efforts, but the pandemic response was led locally.
Using existing survey data during the first year of the pandemic (Deane et al., 2021), it is evident that although a clear majority of both Democrat and Republican supporters believed that the pandemic would pose a threat to the economy, there was more of a gap in other ways, with Republican supporters consistently far less concerned that the pandemic would pose a major threat to public health. Republican supporters were also far more likely to prefer relaxing of restrictions, even in the absence of the decrease in the case rate.
There are not only different tendencies between Republican and Democrat voters in their assessment of the critical impacts of the pandemic, but also in their attitudes towards continued federal assistance and ultimate responsibility for economic impacts. In the wake of the CARES Act, Republican voters were far less likely to want additional legislation for financial assistance and to think that the economic impact would be long-lasting (Pew Research Center, 2020). Republican voters were also more likely to not support additional individual-level stimulus payments (Buckles, 2020). Crucially, a majority of Republican voters placed responsibility for meeting basic economic needs with individuals or their families, while a majority of Democrats felt that it should be the federal government (Menasce Horowitz et al., 2021).
Putting this together, we can start to construct an initial explanation for the patterns of economic voting affecting the 2020 presidential election. Compared with Democrats, Republican voters were more likely to attribute authority for the pandemic response to President Trump, and downplay long-term health and economic impacts. Moreover, Democrat voters were more likely to favour more extensive direct relief payments and the lead role of the federal government, and would be more likely to reward direct individual assistance. By contrast, Republican voters were more critical towards federal assistance to meet basic economic needs, and these payments would thus be less likely to counteract the impact of increased unemployment in voting decisions.
However, this is only speculation. Future research will need to disentangle this relationship between attribution, disaster relief, and voting behaviour, and focus on the variation between states, which could be due to individual-, county-, and state-level characteristics.
Hence, adding to the growing literature questioning whether voters rely on “blind retrospection”, we find that voters in many states were “attentive” to and apportion blame to the incumbent President for increased economic losses in more “red” counties, while tending to reward Trump for direct financial assistance in “blue” counties. With voting patterns pulling in different directions, we found that the negative impact of higher unemployment outweighed the positive effect of direct payments in a number of states, and sufficiently so to change the overall result in two states.
Supplemental Material
Supplemental Material - The Great Lockdown and Economic Voting: Estimating the Impact of the COVID-19 Recession on the 2020 US Presidential Election
Supplemental Material for The Great Lockdown and Economic Voting: Estimating the Impact of the COVID-19 Recession on the 2020 US Presidential Election by Indraneel Sircar in American Politics Research
Footnotes
Acknowledgments
An earlier draft of this manuscript was presented at the 2022 European Political Science Association (EPSA) conference. The author is grateful for the feedback from the EPSA conference participants, as well as additional guidance from Jack Blumenau, Ben Lauderdale, and Dan Snow. The usual disclaimer applies.
Declaration of conflicting interests
The author(s) declared no potential conflicts of interest with respect to the research, authorship, and/or publication of this article.
Funding
The author(s) received no financial support for the research, authorship, and/or publication of this article.
Supplemental Material
Supplemental material for this article is available online.
Notes
References
Supplementary Material
Please find the following supplemental material available below.
For Open Access articles published under a Creative Commons License, all supplemental material carries the same license as the article it is associated with.
For non-Open Access articles published, all supplemental material carries a non-exclusive license, and permission requests for re-use of supplemental material or any part of supplemental material shall be sent directly to the copyright owner as specified in the copyright notice associated with the article.