
Abstract
Computer science education has been making dramatic increases in recent years. Across the US, different states are advancing computer science education through different policies. However, as a state makes choices to advance computer science education, it is critical to consider how these policies will broaden participation in computing (BPC). Many have indicated that only white and Asian males (who make up 30% of our population) currently have the opportunity/privilege to engage in computer science education. Therefore, as we implement state-level computer science education reform, it is critical that BPC remains as our guiding principle. Expanding Computing Education Pathways (ECEP) was created as an NSF national alliance to support state-level educational reform with regards to computer science. Over the past 6 years, this alliance of 22 states and Puerto Rico have worked together to share policies to advance BPC in each state. Through these experiences, ECEP has proposed that state change related to CS educational reform follows five stages: (1) Find your leader(s) and change agents; (2) understand the CS education landscape and identify the key issues/policies; (3) gather and organize your allies to establish goals and develop strategic plans and; (4) get initial funding to support change and; (5) building and utilizing data infrastructure that informs strategic BPC efforts. This study examined the ECEP alliance and the five-stage model through the 25,000+ documents and data sources over the past decade, specifically investigating how these five stages impacted states’ overall BPC efforts. Results indicated that these 5 stages seemed to support states’ BPC efforts.
Introduction
The expansion of K-12 computer science education
Computer science (CS) education policy and access have made increases in K-12 student CS participation at the K-12 level in recent years (DeLyser and Wright, 2019; Garvin et al., 2019; Yadav and Berges, 2019). Studies have shown that more states have added CS, more parents are asking for CS, and more principals are saying CS is important (Code.org, CSTA, & ECEP Alliance, 2021; Google and Gallup, 2020). However, compared to their parents or teachers, the 2020 Google and Gallup survey revealed that students did not see CS as relevant to their lives. Some research indicates that such lack of interest is attributable to misperceptions and unfamiliarity with the discipline (Carter, 2006). The early exposure to CS education in K-12 is crucial in promoting learners’ engagement and interest in CS. Since CS related jobs are increasing and well compensated, learners who lack access to CS education are likely to have limitations to their career choices. Although 51% of public high schools teach at least one foundational computer science course (Code.org et al., 2021), this means approximately half of U.S. public high schools do not offer a single CS course. Millions of young people are missing out on the opportunities to learn the CS skills that could serve as a ladder to economic and social mobility. Therefore, we need to investigate how to support the incorporation of CS education into K-12 education by supporting states and their educational policies.
Policies that guide K-12 CS education
As individual states establish their own educational policies, there are a wide range of approaches and legislation that have attempted to increase CS in K-12 education (Code.org et al., 2020). Some of these policies and initiatives are focused on increasing access or participation to students overall, while others are focused on explicitly addressing the gaps in access and broadening participation for underrepresented students. One organization focused on broadening participation in computing at the K-16 levels is the Expanding Computing Education Pathways (ECEP) Alliance. The ECEP Alliance, funded by the National Science Foundation, was designed to “increase the number and diversity of students in the pipeline to computing and computing-intensive degrees by supporting state-level computing education reforms” (ECEP, 2020a).
Launched in 2012, ECEP’s core mission was to build a structure for formal K-12 CS education reform at the state level. In July 2013, ECEP organized a 15-state convening prior to the annual Computer Science Teachers Association (CSTA). The agenda focused on action steps to enable states to increase access to and participation in CS education. These included (a) making CS a graduation requirement and/or counting CS as a math or science credit; (b) improving teacher certification, licensure, training, and professional development; (c) building teacher community; (d) increasing the number of computer science teachers and the disciplines from which they’re drawn; (e) defining computer science for schools, policy-makers, and the public; and (f) fundraising and generating resources. This conversation eventually led to the development of nine policies, commonly promoted by Code.org as a method for increasing access to K-16 CS education: (1) create a state plan, (2) define CS with K-12 standards, (3) funding for CS teacher training, (4) clear CS certification pathways, (5) teacher education programs for CS teachers, (6) establish state-level CS education positions, (7) require all secondary schools to offer CS, (8) allow CS to satisfy core graduation requirements, and (9) allow CS to satisfy admission requirement at higher education institutions (Code et al., 2021).
These nine policies are often used as guides for state policy and advocacy work (Code.org et al., 2020). The nine policies were developed by a coalition of 70+ stakeholders from industry, non-profit, and advocacy organizations who collaborated to integrate CS into the K-12 system (Code.org et al., 2020). Only six states (Alabama, Arkansas, Idaho, Indiana, Maryland, and Nevada) have currently adopted all nine policies (Code et al., 2021).
What are some of the K-12 CS education policies being enacted?
Across the US, states are promoting computer science education through a variety of different policies. During 2020, there were 28 states that passed 42 new laws and regulations related to K-12 computer science education (Code et al., 2020). These policies range from teacher certification requirements, implementation of K-12 CS standards, to providing specific amounts of funding for teacher professional development. Based on the most recent State of CS Report (Code et al., 2021) the most commonly enacted policies are that (1) CS can satisfy a core high school graduation requirement (50 states), (2) the adoption of K-12 standards (39 states), and (3) formal standards for CS teacher certification (41 states). One state example of recently enacted CS education policies around graduation requirements is Missouri, where students can fulfill one unit of any mathematics, science, or practical arts unit required for graduation with a district-approved computer science course. Washington implemented recent CS education policies that included K-12 education standards for computer science, a computer science teaching endorsement, and scholarships for teachers when doing computer science professional development (Wilson, 2015).
CS K-12 education and the focus on equity
These are just a few examples that show the range and depth of K-12 CS education policies being adopted by states in the US. Although these policies have seemed to increase the overall participation in computer science, there is still strong evidence that underrepresented populations do not receive the same opportunities to engage in CS at the K-12 levels. In the most recent State of Computer Science Education report (Code et al., 2021), data showed that economically disadvantaged students, Native American, Black, and Hispanic students were less likely to attend a school that teaches CS, as compared to white students. Furthermore, even when students had access to a CS course, students from underrepresented populations (females, Black students, Hispanic students, economically disadvantaged students, English language learners, and students with disabilities) were less likely to enroll in the course.
As states develop strategies to advance computer science education, it is critical to consider how to broaden participation in computing (BPC). The National Science Foundation indicated that 70% of our population is currently missing from computer science education pathways (National Science Foundation, 2012). National reports have suggested an increase in access to computing, however, without an explicit focus on BPC as we develop our policies, is likely to continue to exclude specific demographics of students (Code.org, 2018, 2019; Code.org et al., 2020, 2021). Computing, and the expansive branches of computer science like AI, data science, cybersecurity, reach into every corner of our society. When the teams that are working in high performance computing are trying to solve some of the world’s most complex problems, it is imperative that these teams are diverse (Nelson, 2014). When teams are more diverse, they can consider more viewpoints, cultures, and aspects of the problem. The field of CS already has a capacity issue—there are not enough trained computer scientists to meet the current demands of research and industry, and the workforce heading into computing lacks diversity. This implies that the world’s biggest problems are going to be tackled by a select few. The select few have had what Margolis identified as preparatory privilege or early access to computing (Margolis etal., 2008). BPC efforts are designed to address these equity gaps, with the goal of ensuring that one of the most prevalent tools of this century are designed and utilized by teams as diverse as the people, communities, states, and nations using them.
Background of ECEP
As we advance state-level computer science education reform, BPC needs to be our guiding principle. ECEP was created as a National Broadening Participation in Computing Alliance (funded by the National Science Foundation) to support state-level educational reform. ECEP seeks to increase the number and diversity of students in computing and computing-intensive degrees by supporting state-level computing education reforms. Through interventions, pathways, partnerships, and models that drive state-level computing education change, ECEP supports states as they develop BPC strategies.
ECEP grew from the BPC initiatives of two states, Georgia and Massachusetts, in 2012. After initial funding, two additional states were added to the ECEP Alliance (California, South Carolina) (Phase 1). In 2015 (Phase 2), eight states that were making progress towards K-16 computer science education were invited to join (Alabama, Connecticut, Indiana, Maryland, New Hampshire, Puerto Rico, Texas, Utah). After receiving supplemental funding from NSF in 2016, Phase 3 added five new states (Arkansas, Nevada, North Carolina, Rhode Island, Virginia). When ECEP transitioned to a new grant and a new leadership team in 2018, funding allowed for the addition of six new states (Hawaii, Minnesota, Mississippi, Ohio, Oregon, Washington) for a total of 22 states and Puerto Rico (Phase 4)(See Figure 1). Map of ECEP Alliance states and which Phase they entered the ECEP Alliance.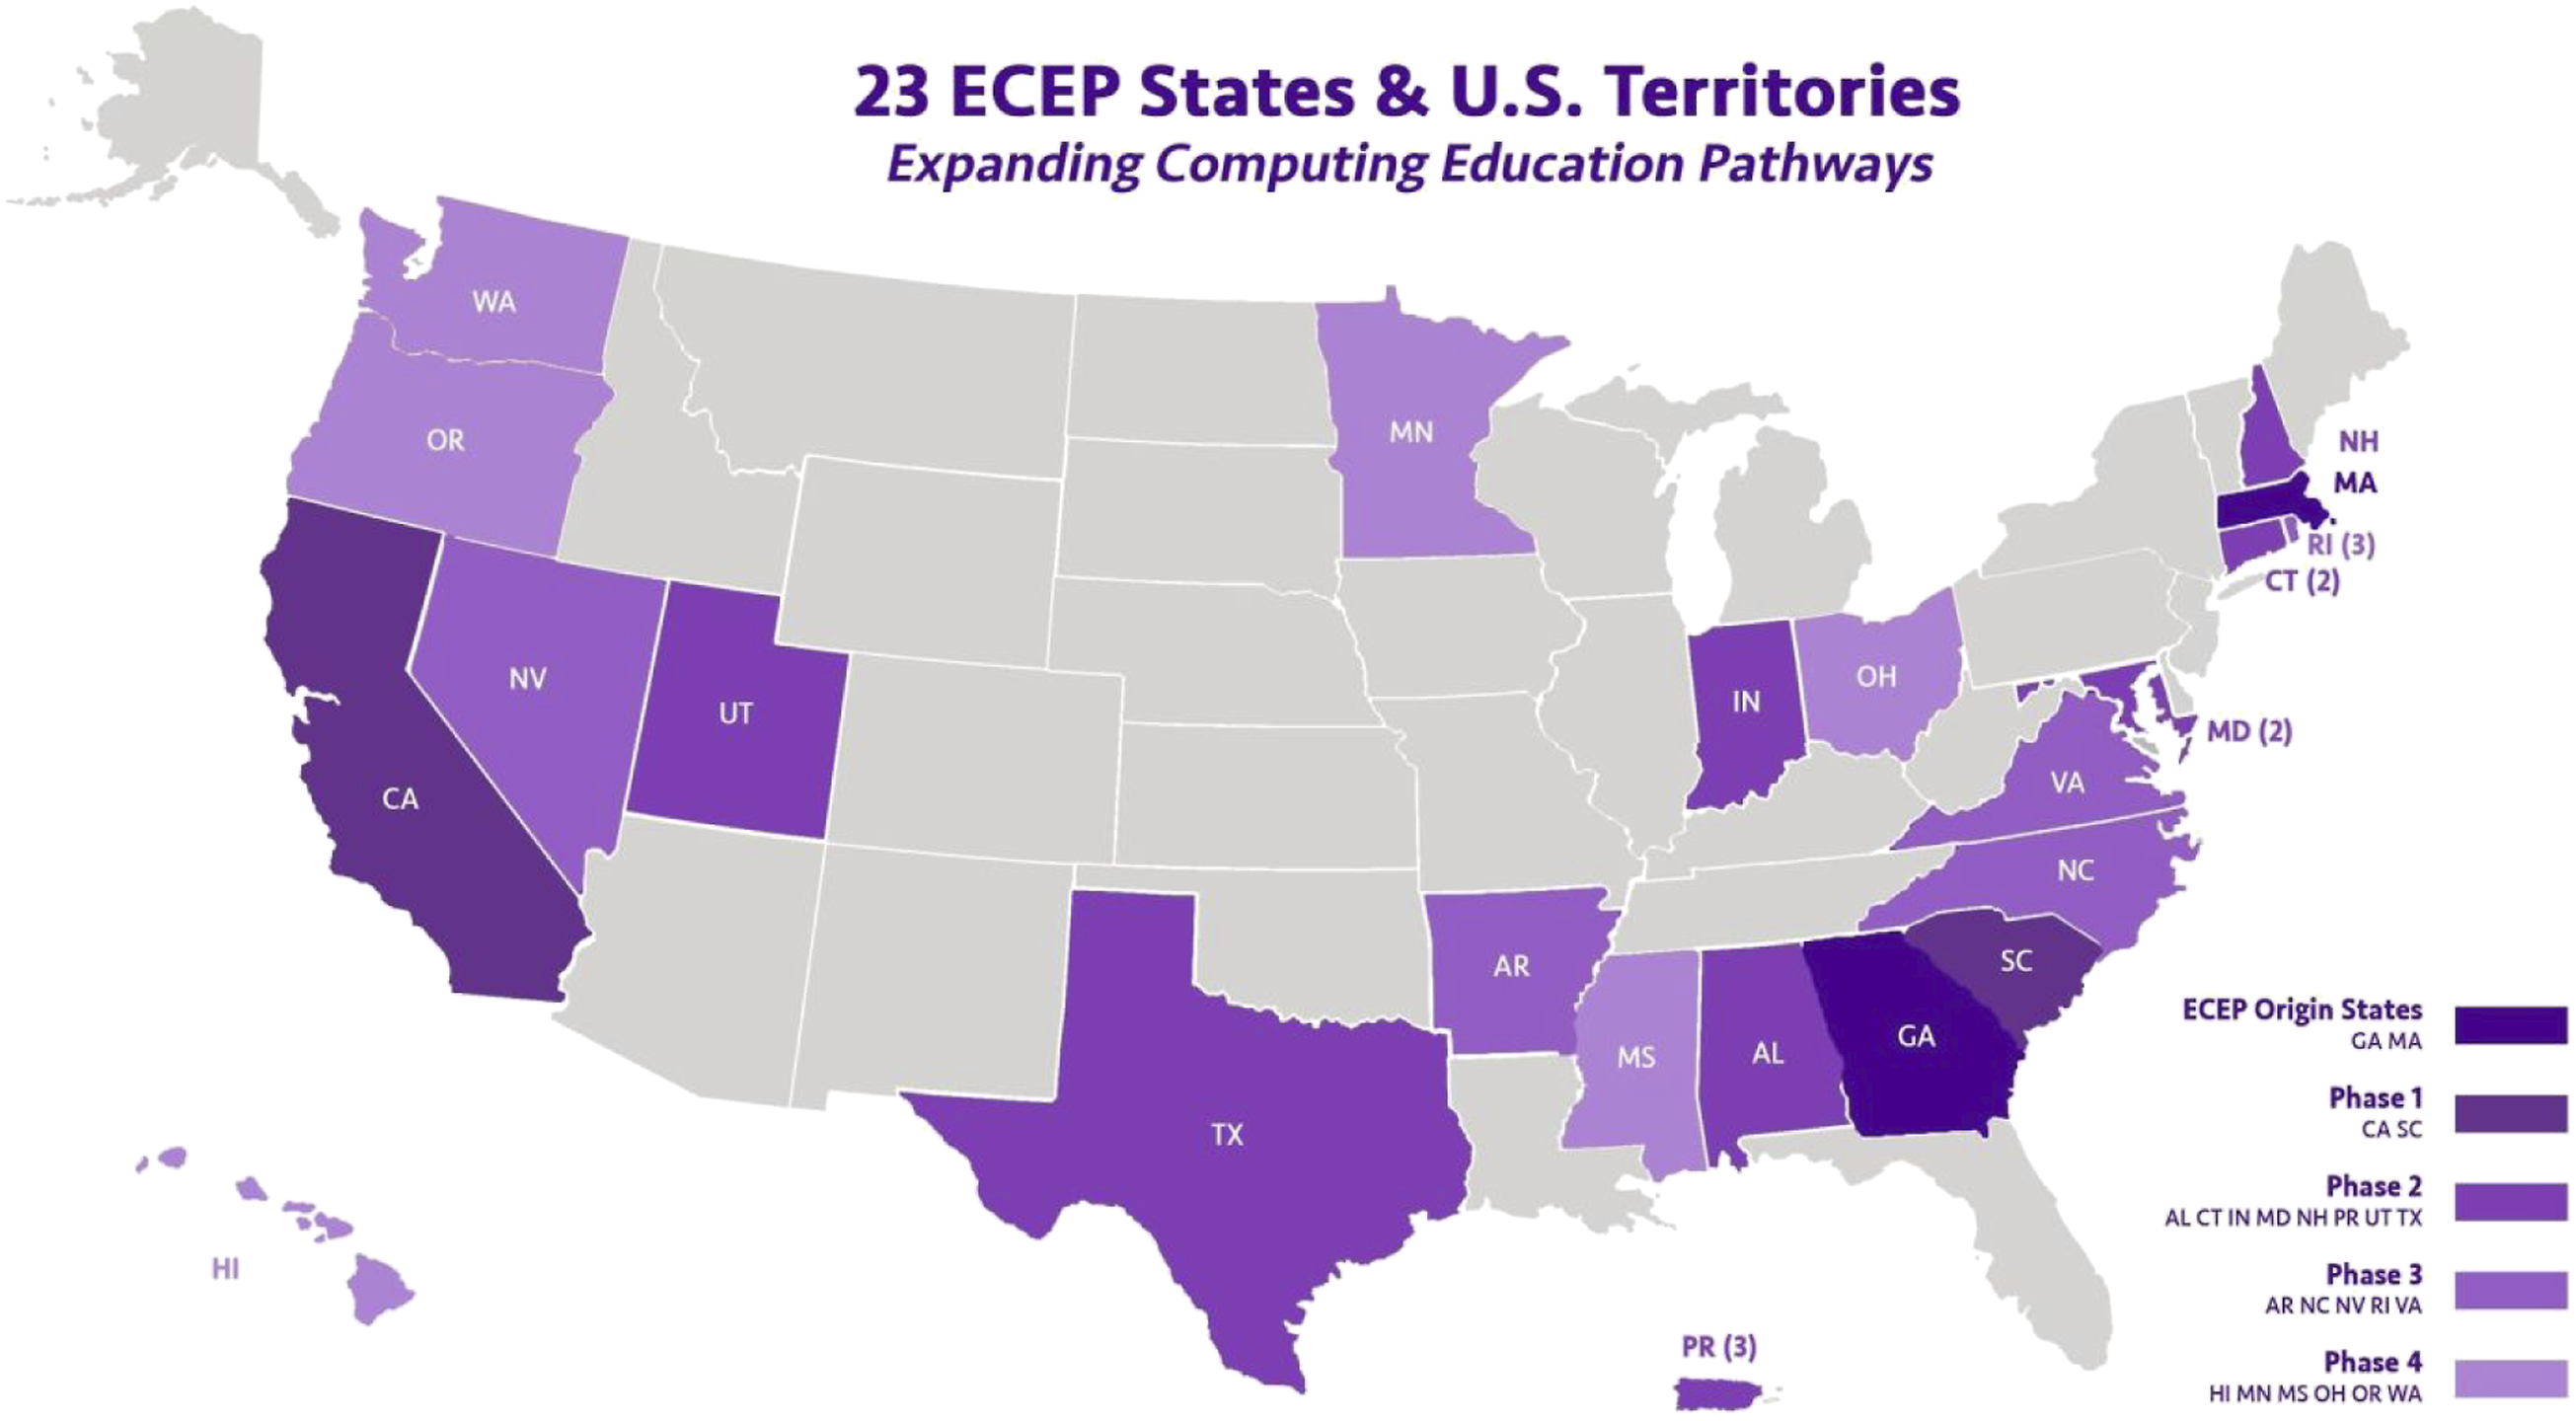
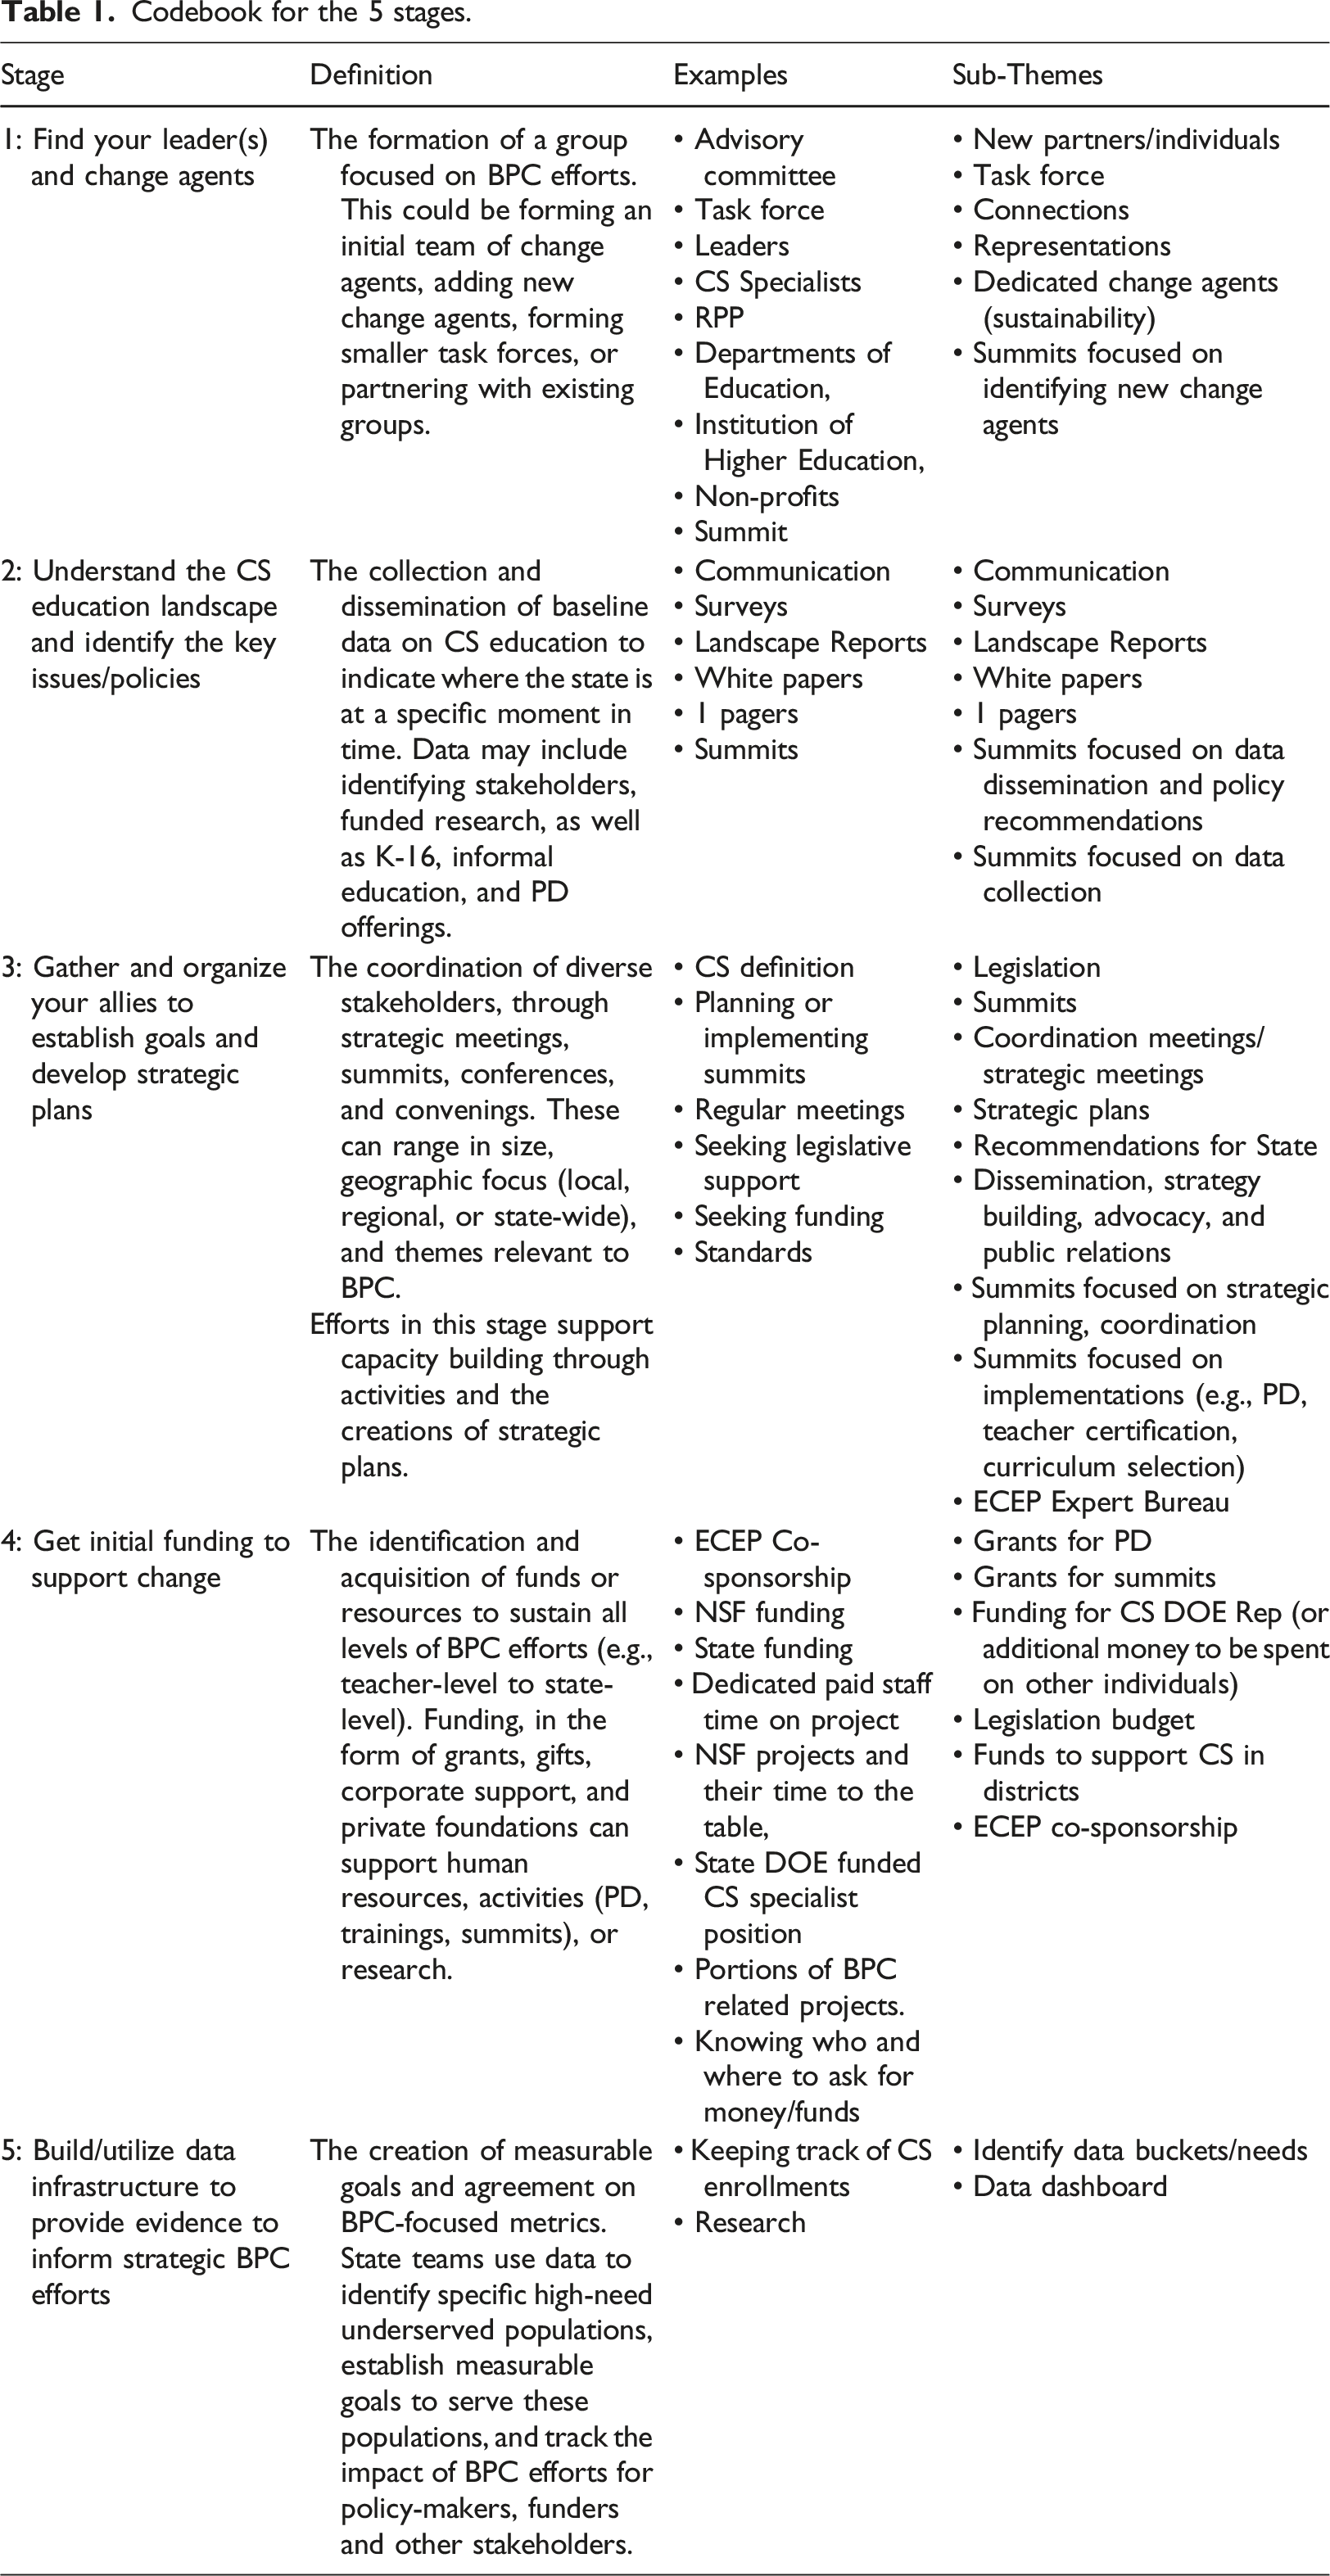
Over the past decade, this alliance of states has worked together to advocate for and share policies to advance BPC. Based on their experiences, ECEP principal and co-principal investigators created a model that described how to change a state, essentially focusing on their BPC goals. The model was initially proposed as a four-stage model: (1) Find your leader(s) and change agents, (2) understand the CS education landscape and identify the key issues/policies, (3) gather and organize your allies to establish goals & develop strategic plans, and (4) get initial funding to support change (Guzdial, 2014). In 2018, a fifth stage was added which focused on (5) build and utilize data infrastructure that informs strategic BPC efforts. This study examines the resources and products associated with ECEP to identify whether these 5 stages are impacting states’ BPC efforts (see Figure 2). ECEP 5 Stage Model: How to Change a State.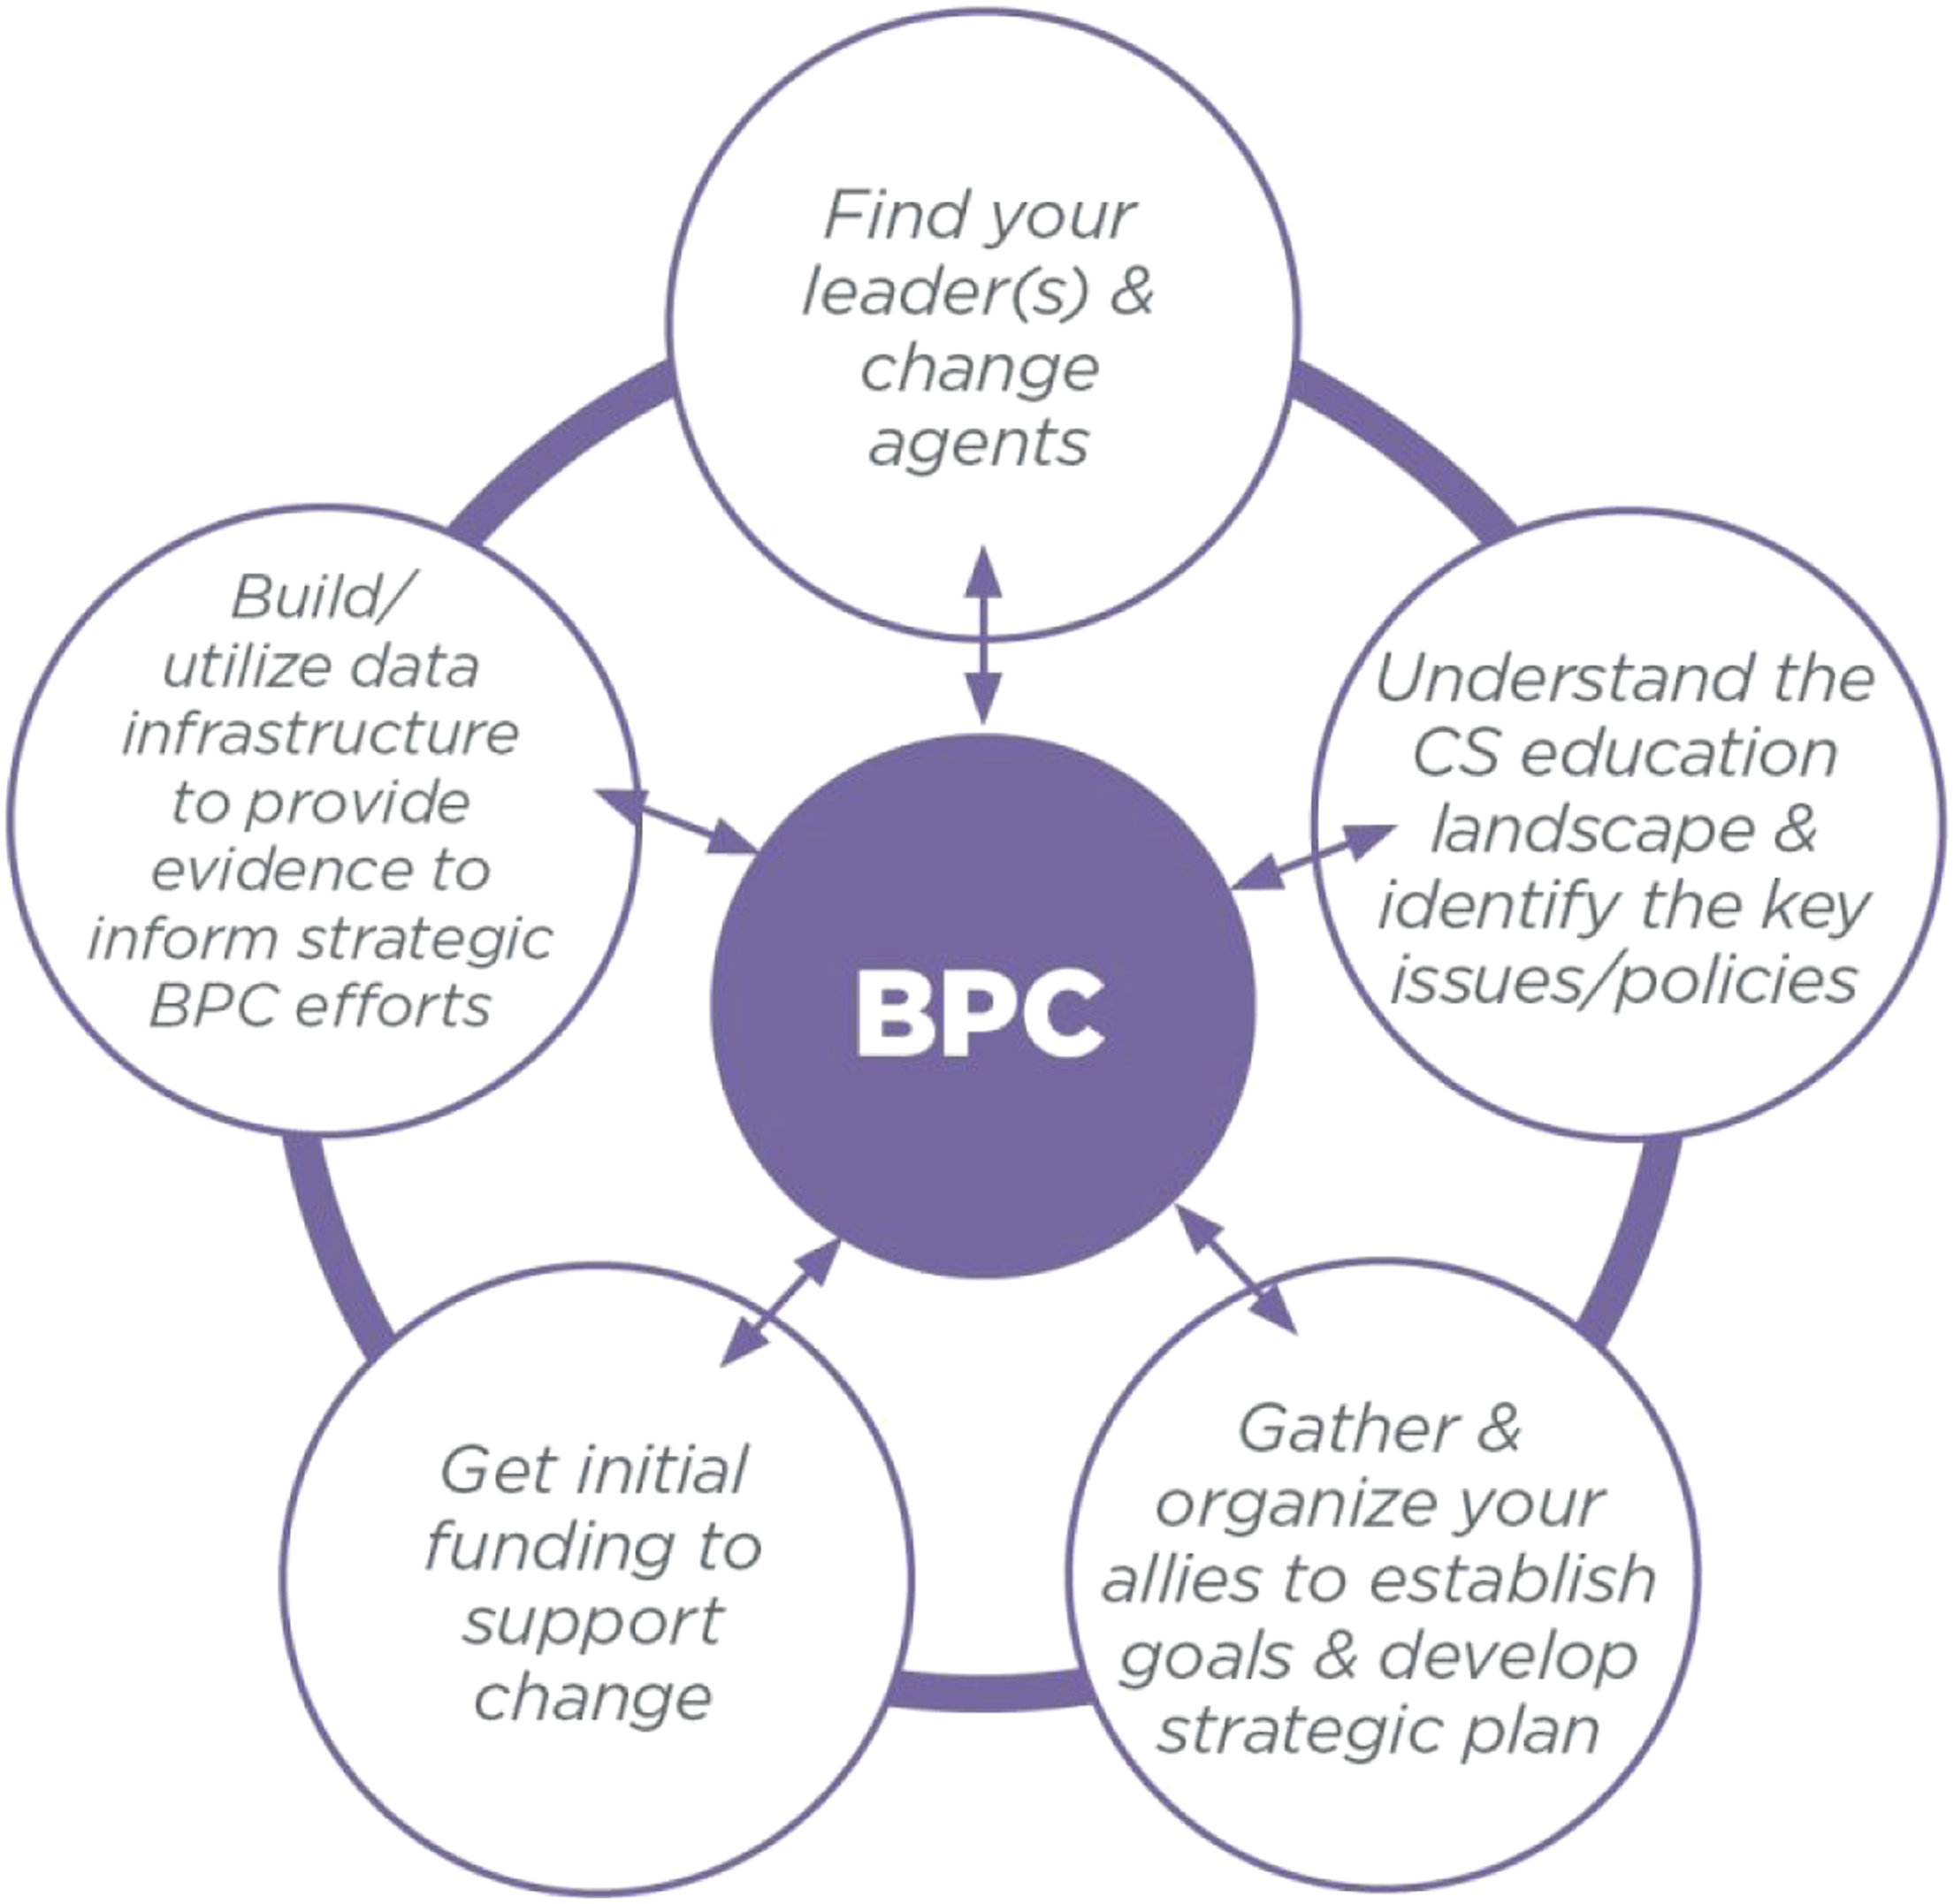
Methods
Research design and questions
We utilized a case study, with the ECEP Alliance states as the unit of analyses. Within this alliance of states, it was necessary to discuss how these policies manifested with the bounded context of each state. Utilizing a case study approach (Miles et al., 2014), we were able to organize the large amount of data to investigate the 5 stage model. To investigate our five-stage model, we sought out to examine how these five stages impacted states’ BPC efforts through the following research questions: 1. How does the makeup of a state’s team impact their state’s overall BPC efforts? 2. How did the landscape report impact the state’s overall BPC efforts? 3. How do summits impact states’ overall BPC efforts? 4. How does funding impact states’ overall BPC efforts? 5. How does evidence-based data impact states’ overall BPC efforts?
Data sources
This study included a rich variety of data sources. Since the ECEP Alliance had been in existence since 2012, there were a massive number of digital communications and archival documents from ECEP—over 25,000+ files. These included, but were not limited to emails, meeting notes, recordings, surveys, landscape reports, annual project reports, summit reports, state posters, grant applications, government whitepapers, presentation slides, legislation bills, journal articles, and curriculum resources (see Figure 3). Screenshot of available data and folders for all ECEP data.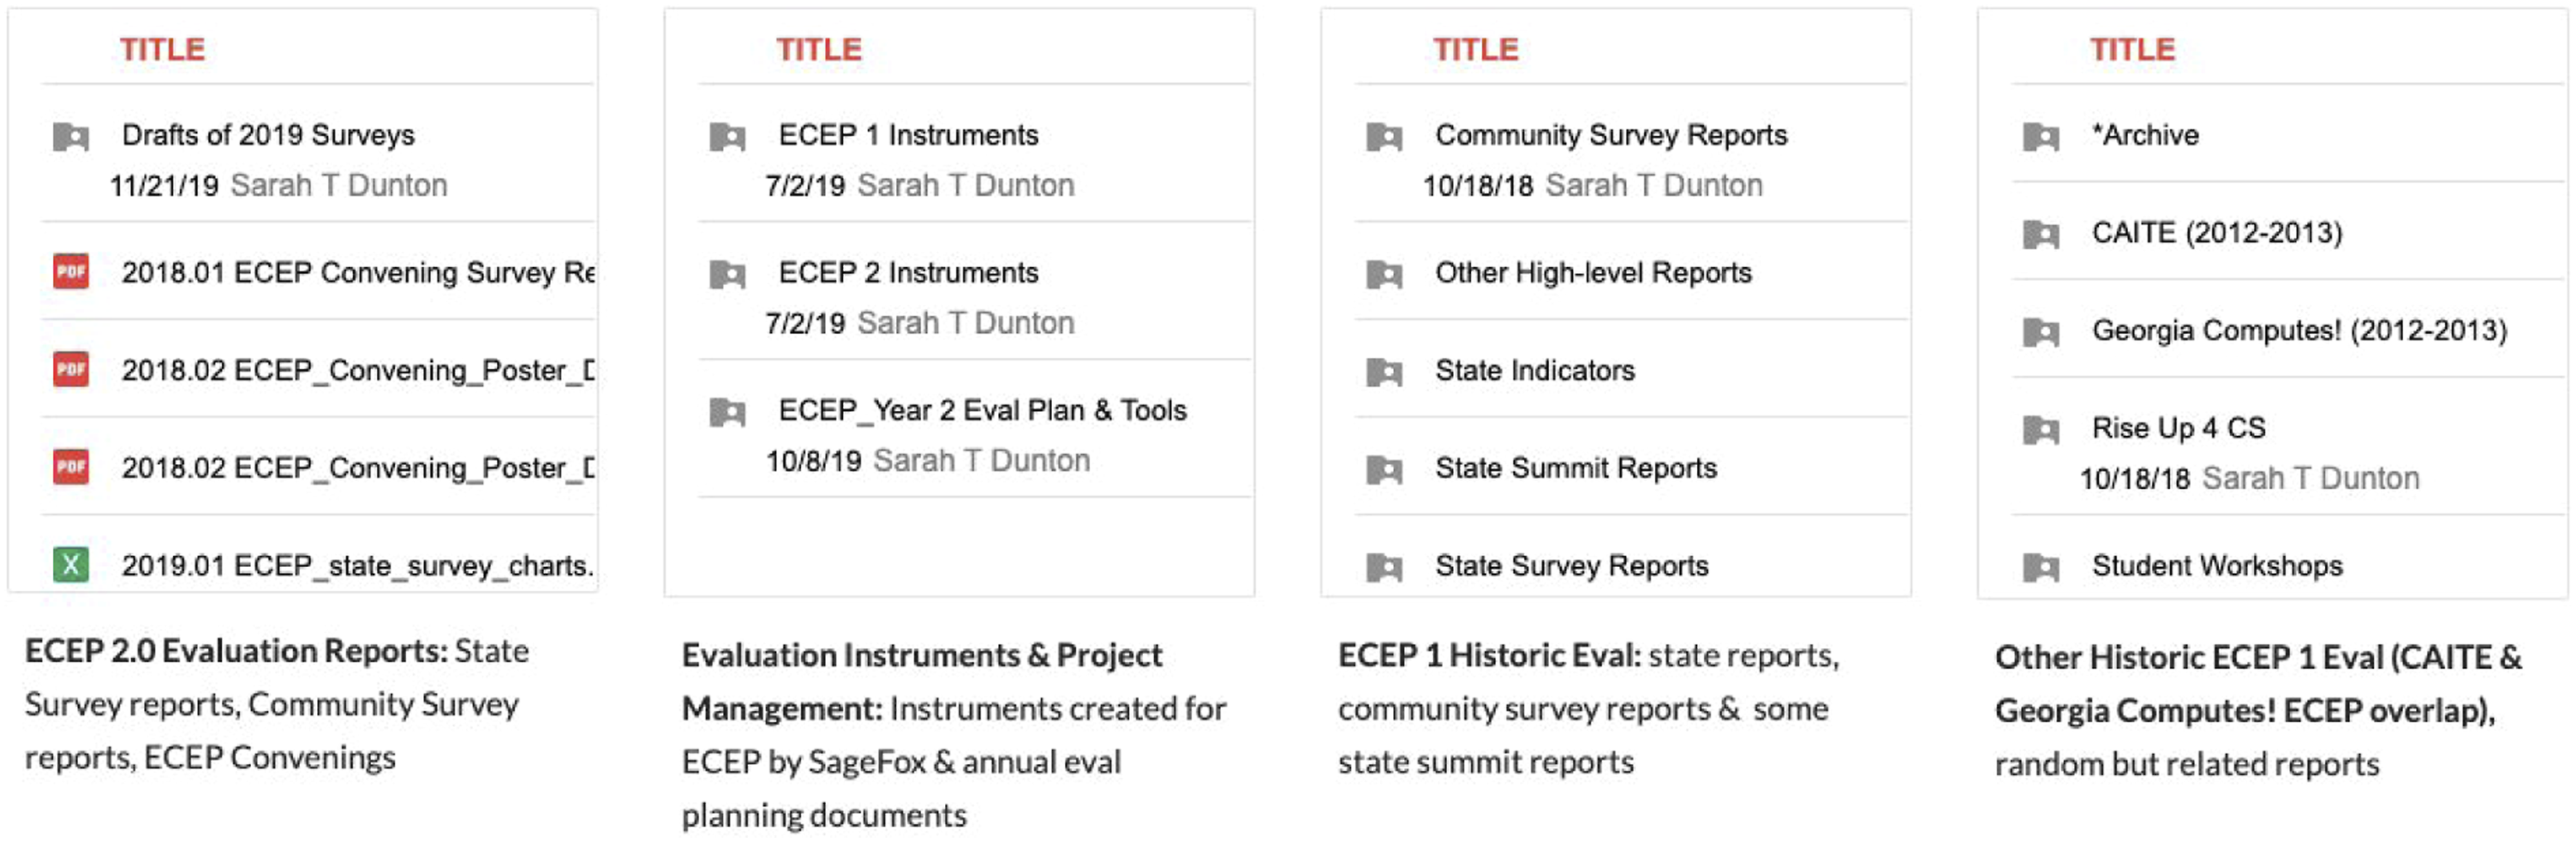
We first began by identifying data sources relevant to this study including NSF annual reports, state surveys, community surveys, summit evaluations, and research produced over the course of the project. This data condensation were necessary analytical choices that helped us organize data into potential categories (Miles et al., 2014). For example, for the first research question that focused on how a state’s team leadership impacted their states’ overall BPC efforts, we concentrated on gathering data from state survey reports and ECEP convening poster data reports. For the fourth research question focused on funding to support changes, we looked into state landscape reports, co-sponsorship review rubrics, and state legislation. To keep track of the states’ individual progress and current status, the ECEP Alliance has implemented a State of the ECEP States spreadsheet (see Figure 4 for screenshot example). Screenshot of State of the ECEP States spreadsheet.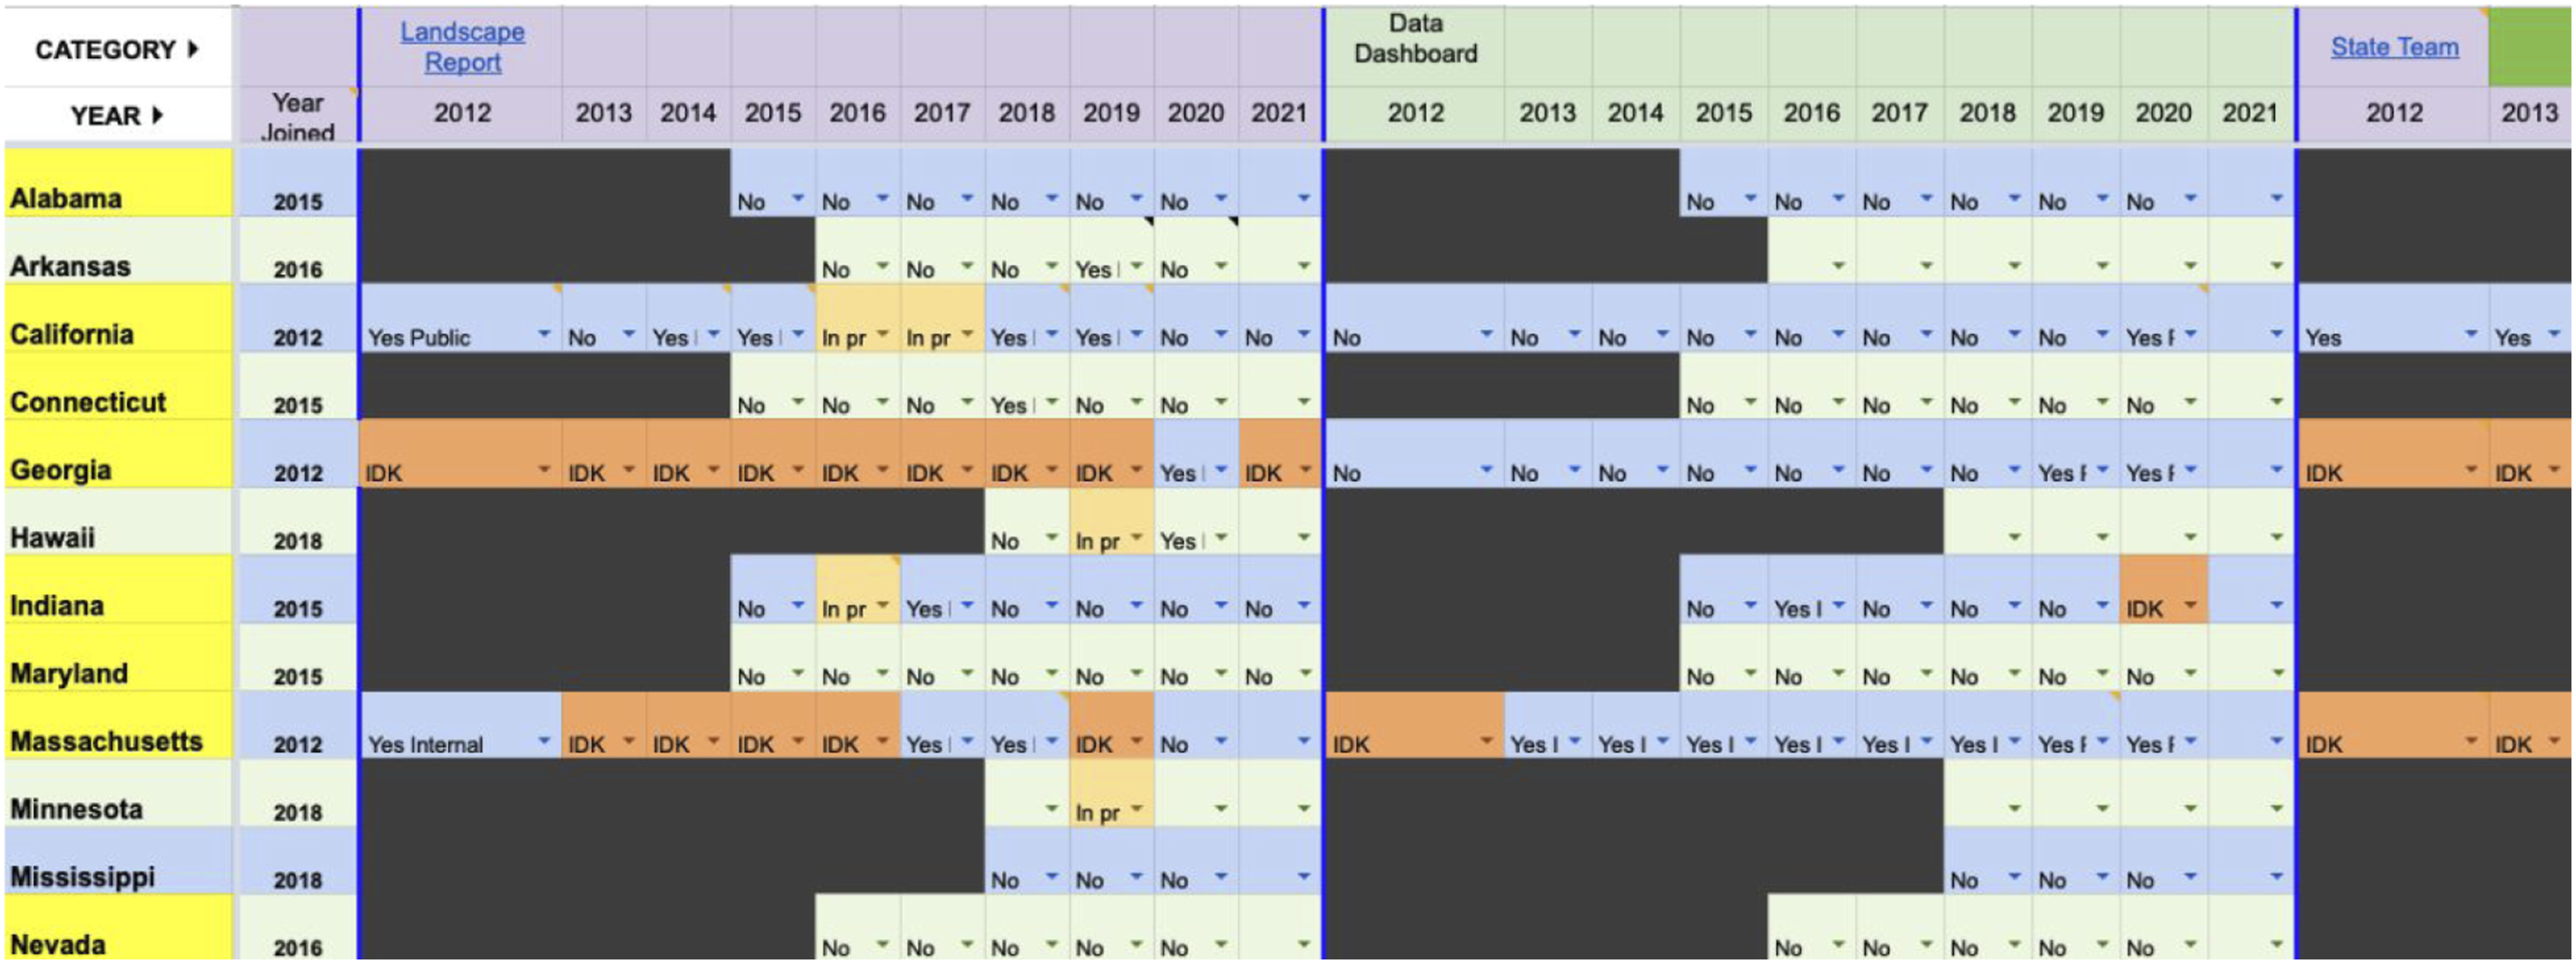
We utilized this spreadsheet to track information on states’ progress toward specific strategies designed to coordinate state BPC efforts. For example, during the year of 2019, we had states report whether or not they had completed a landscape report. Archival data and interviews with state leaders were used to complete the spreadsheet. This data helped identify trends, as well as strategies to support states.
Data analysis
Codebook for the 5 stages.
Results
Stage 1: State’s team impact on their State’s overall BPC efforts
To be an active member of the ECEP Alliance, a state must have, or be prepared to form, an initial leadership team with a designated leader, or leaders, assigned to represent the state within the ECEP Alliance. This was described in the ECEP Leadership, State Teams, and Committees Guidelines document. ECEP teams and state advisory or steering committees work to affect change through championing of CS education policy and advocacy.
State leadership teams
While the states can have larger committees that focus on their own states’ BPC progress, all states have smaller state leadership teams that directly interact with the ECEP Alliance. ECEP teams average four people and draw from a diverse group of stakeholders (ECEP, 2020b). ECEP’s leadership model is designed to include broad representation of leaders from multiple stakeholder groups. This model was created to ensure that K-12 teachers and administrators, researchers/faculty in higher education, industry leaders, and community non-profit organizations, all groups who have a stake in CS education, have a voice in prioritizing the strategies for BPC in their state.
ECEP collects data on state lead teams from an annual survey. Across all ECEP state lead teams, 38.3% of leaders were from higher education, 38.3% were from a state department of education, 10.6% were from non-profit organizations. There were also representatives from K-12 (8.5%), and industry (4.25%). However, this could vary greatly depending on the state. Four out of 23 states had an industry representative and nine states had a K-12 representative directly associated with an ECEP team. We discuss the implications of these team structures in the following sections (see Figure 5). ECEP state lead teams’ representation.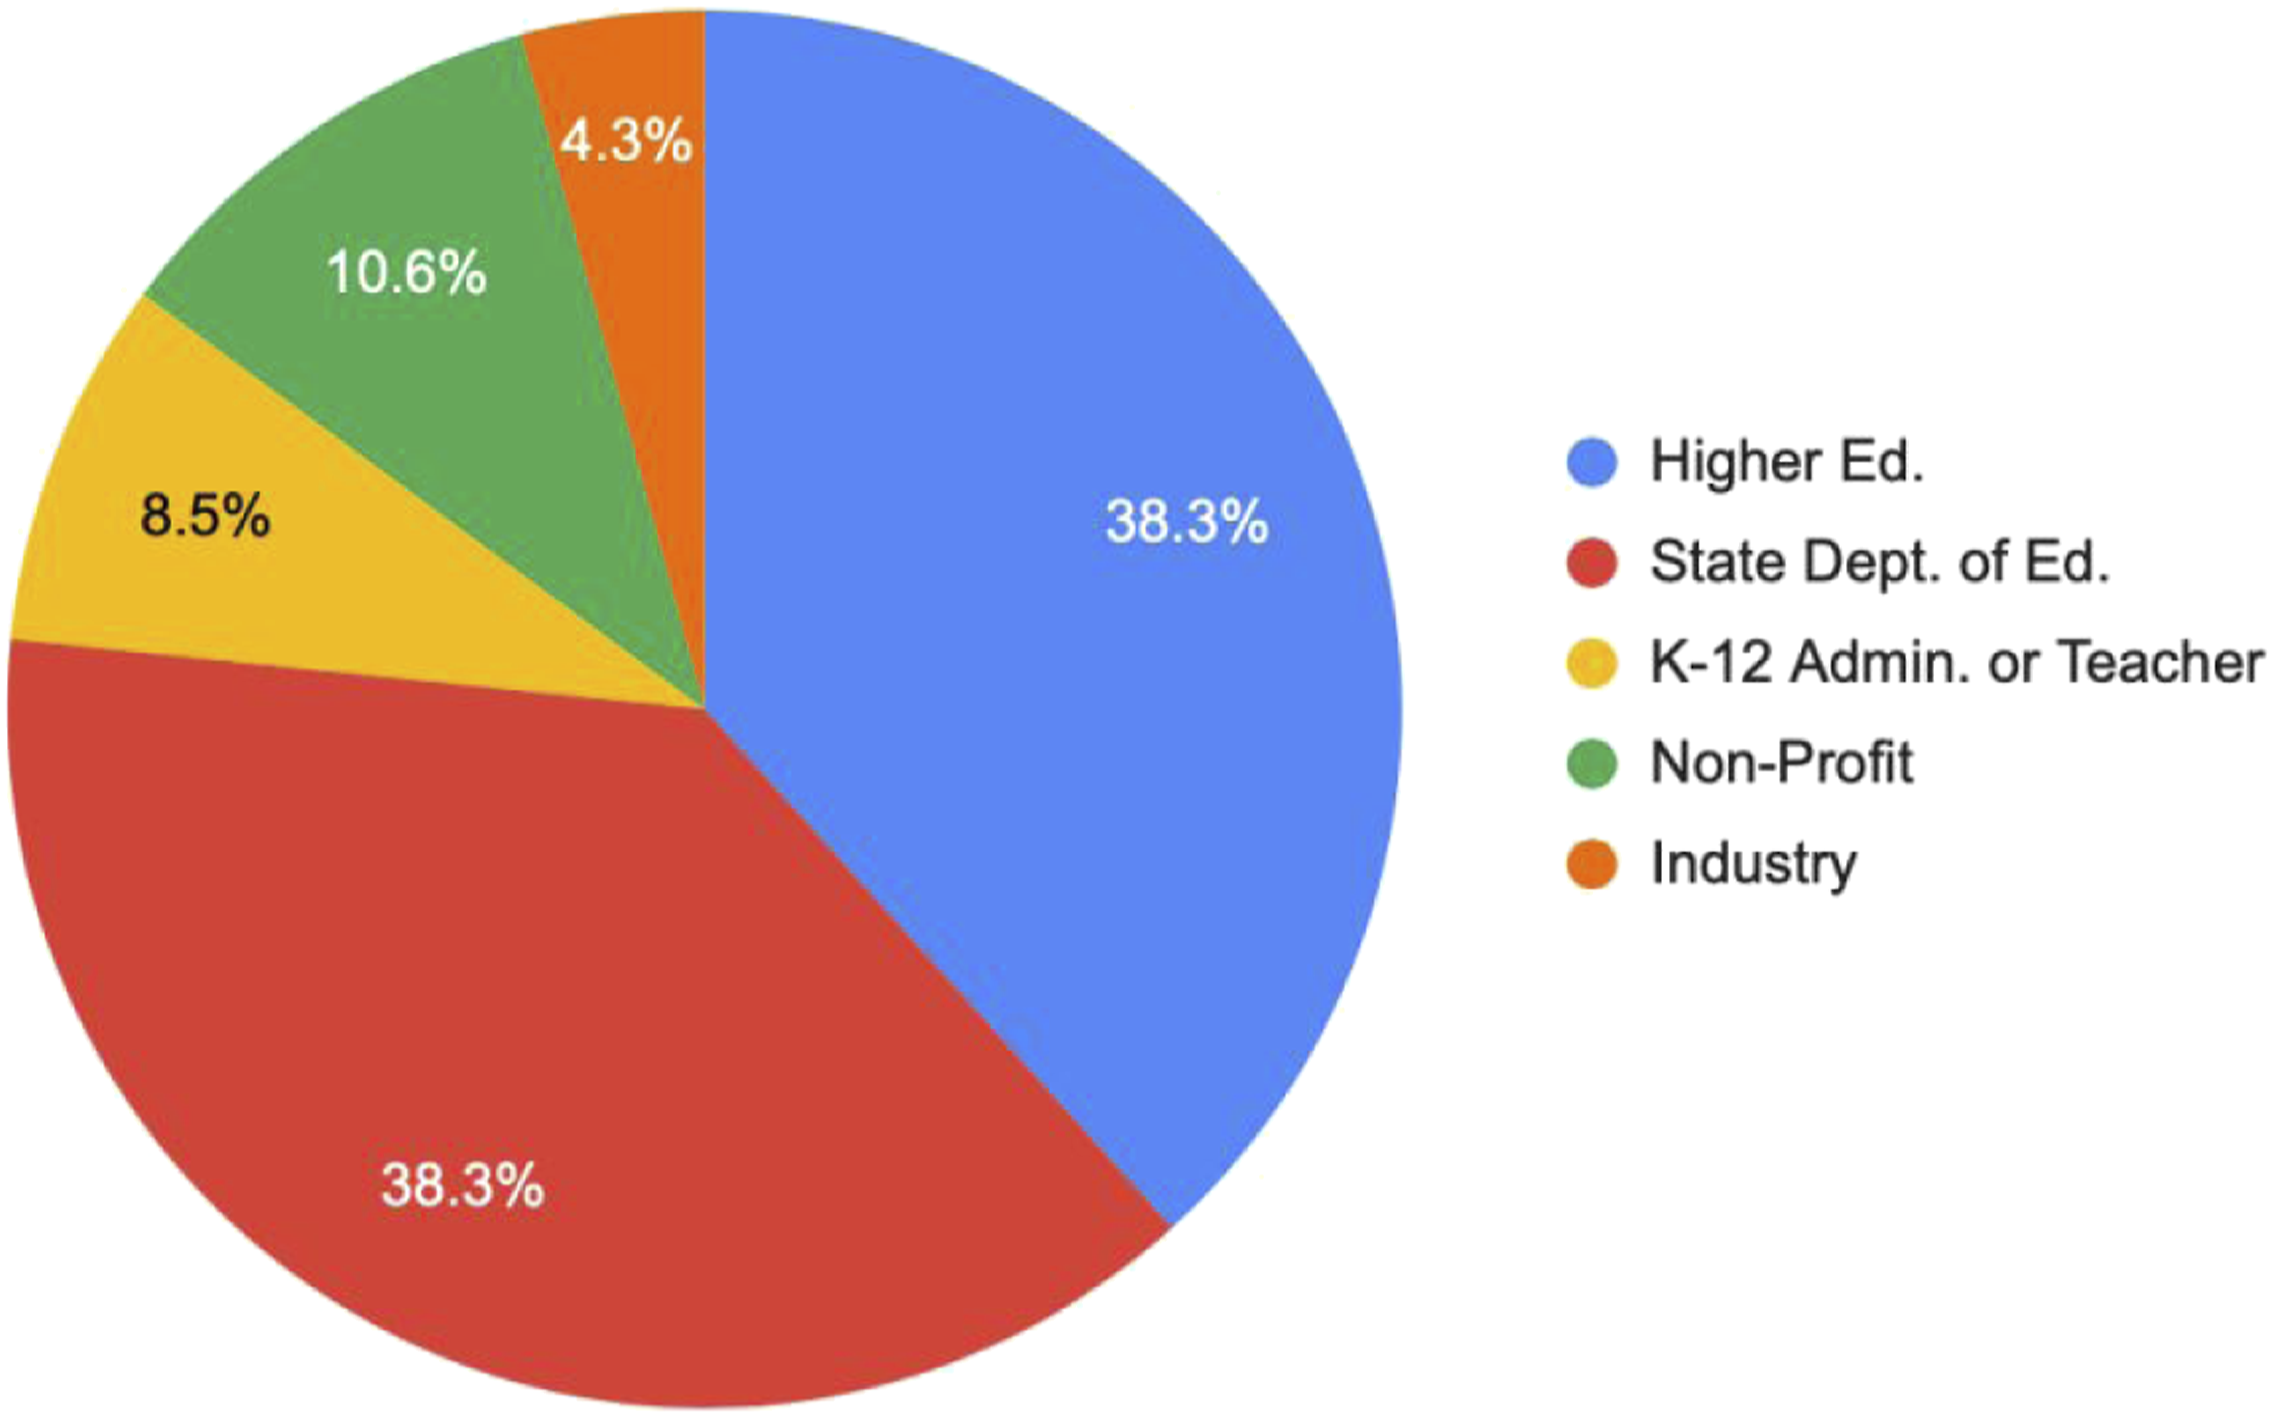
State department of education representation
Having leadership from the state’s department of education helps states align strategies with state education policy and pre-existing structures in which CS education will need to reside. In particular, teams that have a DOE leader engaged at all levels of planning, and strategy often helps states move more quickly to decision making. They are able to provide a realistic view of what can be achieved in a state.
Higher education representatives
Higher education representatives are one of the two most prominent leadership groups, likely due to the fact that the ECEP Alliance grew from initial NSF funding led by researchers at the University of Massachusetts Amherst and Georgia Tech. Much of the impetus for BPC, and the CS for All movement was driven by NSF’s historic commitment to increasing diversity in STEM. As the ECEP Alliance initially expanded, it was primarily researchers in higher education who began state efforts towards BPC. In our 23 Alliance states and territories, 19 of them are led by or collaborating with faculty and researchers in higher education. Higher education partners often launch or lead a states’ landscape report effort, or help states and strategic teams to grapple with data sets that drive advocacy and policy. In addition, higher education partners also tend to offer time and space (e.g., offering PD, building leadership teams, offering space for meetings) as well as expertise (e.g., pre-service education, access to K-12 data).
Non-profit community partners
While advocacy and policy work can exist at a high level, the ultimate implementation can rely heavily on non-profit community partners. This includes organizations that will facilitate large-scale teacher professional development, or directly advocate for policies (e.g., NexTech in Indiana, CodeVA in Virginia). Having these organizations on the team can provide more focus on addressing and serving the diverse populations of the state as they tend to have a broader understanding of what different K-12 communities need across the state to target BPC initiatives. Many organizations, like ReadyCT in Connecticut, the Kapor Center and CSforCA in California, or the STEM Education Center in Utah, have been instrumental partners on ECEP teams.
K-12 representation and industry representation
Only eight ECEP teams had K-12 representation. When BPC policy is written without the input of K-12 representatives, the likelihood that the policy will result in significant unintended consequences is high. Teachers know the needs of their students, have a sense of what is realistic in a classroom in regards to inclusive and exploratory pedagogy, and are already driving localize change efforts. Working with teachers and administrators informs current and proposed research and allows for synergy, as opposed to unnecessary hierarchy and competition.
Only four state teams had direct industry representation on their ECEP team. Typically industry representatives are in a state network, but not directly serving on an ECEP team. CS education has become synonymous with pathways to career and industry (e.g., National Association of Colleges and Employers, 2019). Having local and national industry leaders on ECEP teams, or within a states’ ECEP network, allows for discussions between education and industry. Knowing the needs of industry allows for academic leaders to consider how to build CS courses. Having academic and industry partners at the same table bridges two worlds that often do not meet until students graduate from college, at which point there is a narrow pathway for diverse candidates that are qualified for the needs of industry.
Advisory, steering, or task force committees
The ECEP state teams are not the only group making an impact on CS in a state. Nine states mentioned having an advisory, steering, or task force committee associated with their ECEP efforts. For example, Indiana gathered a larger steering committee to design a landscape report in 2017, while Arkansas’ Governor signed Executive Order 19–17 creating the Computer Science and Cybersecurity Task Force (annual survey). Due to the unique nature of each state, committee structures varied, with their design meeting the specific needs associated with advancing BPC strategies. In their interview, one state described that having an advisory board allowed them to identify the importance of bringing in more viewpoints: “we’re starting to recognize, obviously, where the gaps are and why we need to bring other people in.”
Overall impact of team representation
The makeup of the team helped publicize the current status of state initiatives and develop strategies based on this. States mentioned that diverse perspectives helped provide a holistic picture of K-16 CS education in the state: “the makeup of the team has helped us understand related state initiatives that we can piggyback on to improve our efforts” (Connecticut, interview). Furthermore, states described challenges they faced in their teams, specifically expressing a need for a more expanded, designated leadership team to design strategic plans. It was also pointed out that establishing a team that could collaboratively work towards a goal of CS educational reform was important: “we need a team that can coordinate that to make sure, not only that we’re all moving towards the same end goal, but also to make sure that we’re not getting in each other’s ways with effort” (Connecticut, interview), and “just having a variety of key players who are on, at least somewhat, the same page, always helps in terms of being able to garner progress and get results” (Indiana, interview).
Stage 2: Landscape reports and their impact on states’ overall BPC efforts
The second stage encompasses the collection and dissemination of baseline data on CS education to indicate where the state is at a specific moment in time. Data may include identifying stakeholders, funded research, as well as K-16, informal education, and PD offerings. This is often presented in the form of official landscape reports, and research, white papers, or policy documents associated with those reports.
Between 2012 and 2018, ten ECEP states published landscape reports (CA, CT, GA, IN, MD, MA, NH, NV, SC, TX). Landscape reports were created to address one or more of the following rationales: (1) Serve as an overview of the present situation regarding CS education in different states, (2) explain the rationale for the need to increase participation in CS, including key statistics of top jobs in demand, (3) emphasize progress toward increasing exposure and participation in CS, (4) identify areas for further steps in developing CS education, and/or (5) describe lessons learned and priorities to increase participation in CS. In terms of documenting the present situation, most states included information on (a) teacher certification/licensing, (b) status of professional development for teachers, (c) barriers/challenges to K-12 CS, and (d) demographics of students and teachers participating in K-12 CS. All state landscape reports described that the economic demand for CS jobs exceeded the supply of CS graduates in their states. Only four states included a survey of K-12 teachers, administrators, and/or counselors.
Since 2018, additional landscape studies have been written (n = 9), are being updated (n = 1), or are in progress (n = 2). Figure 6 shows the number of landscape reports that have currently been published in ECEP states. Map of the states that have completed and published a landscape report.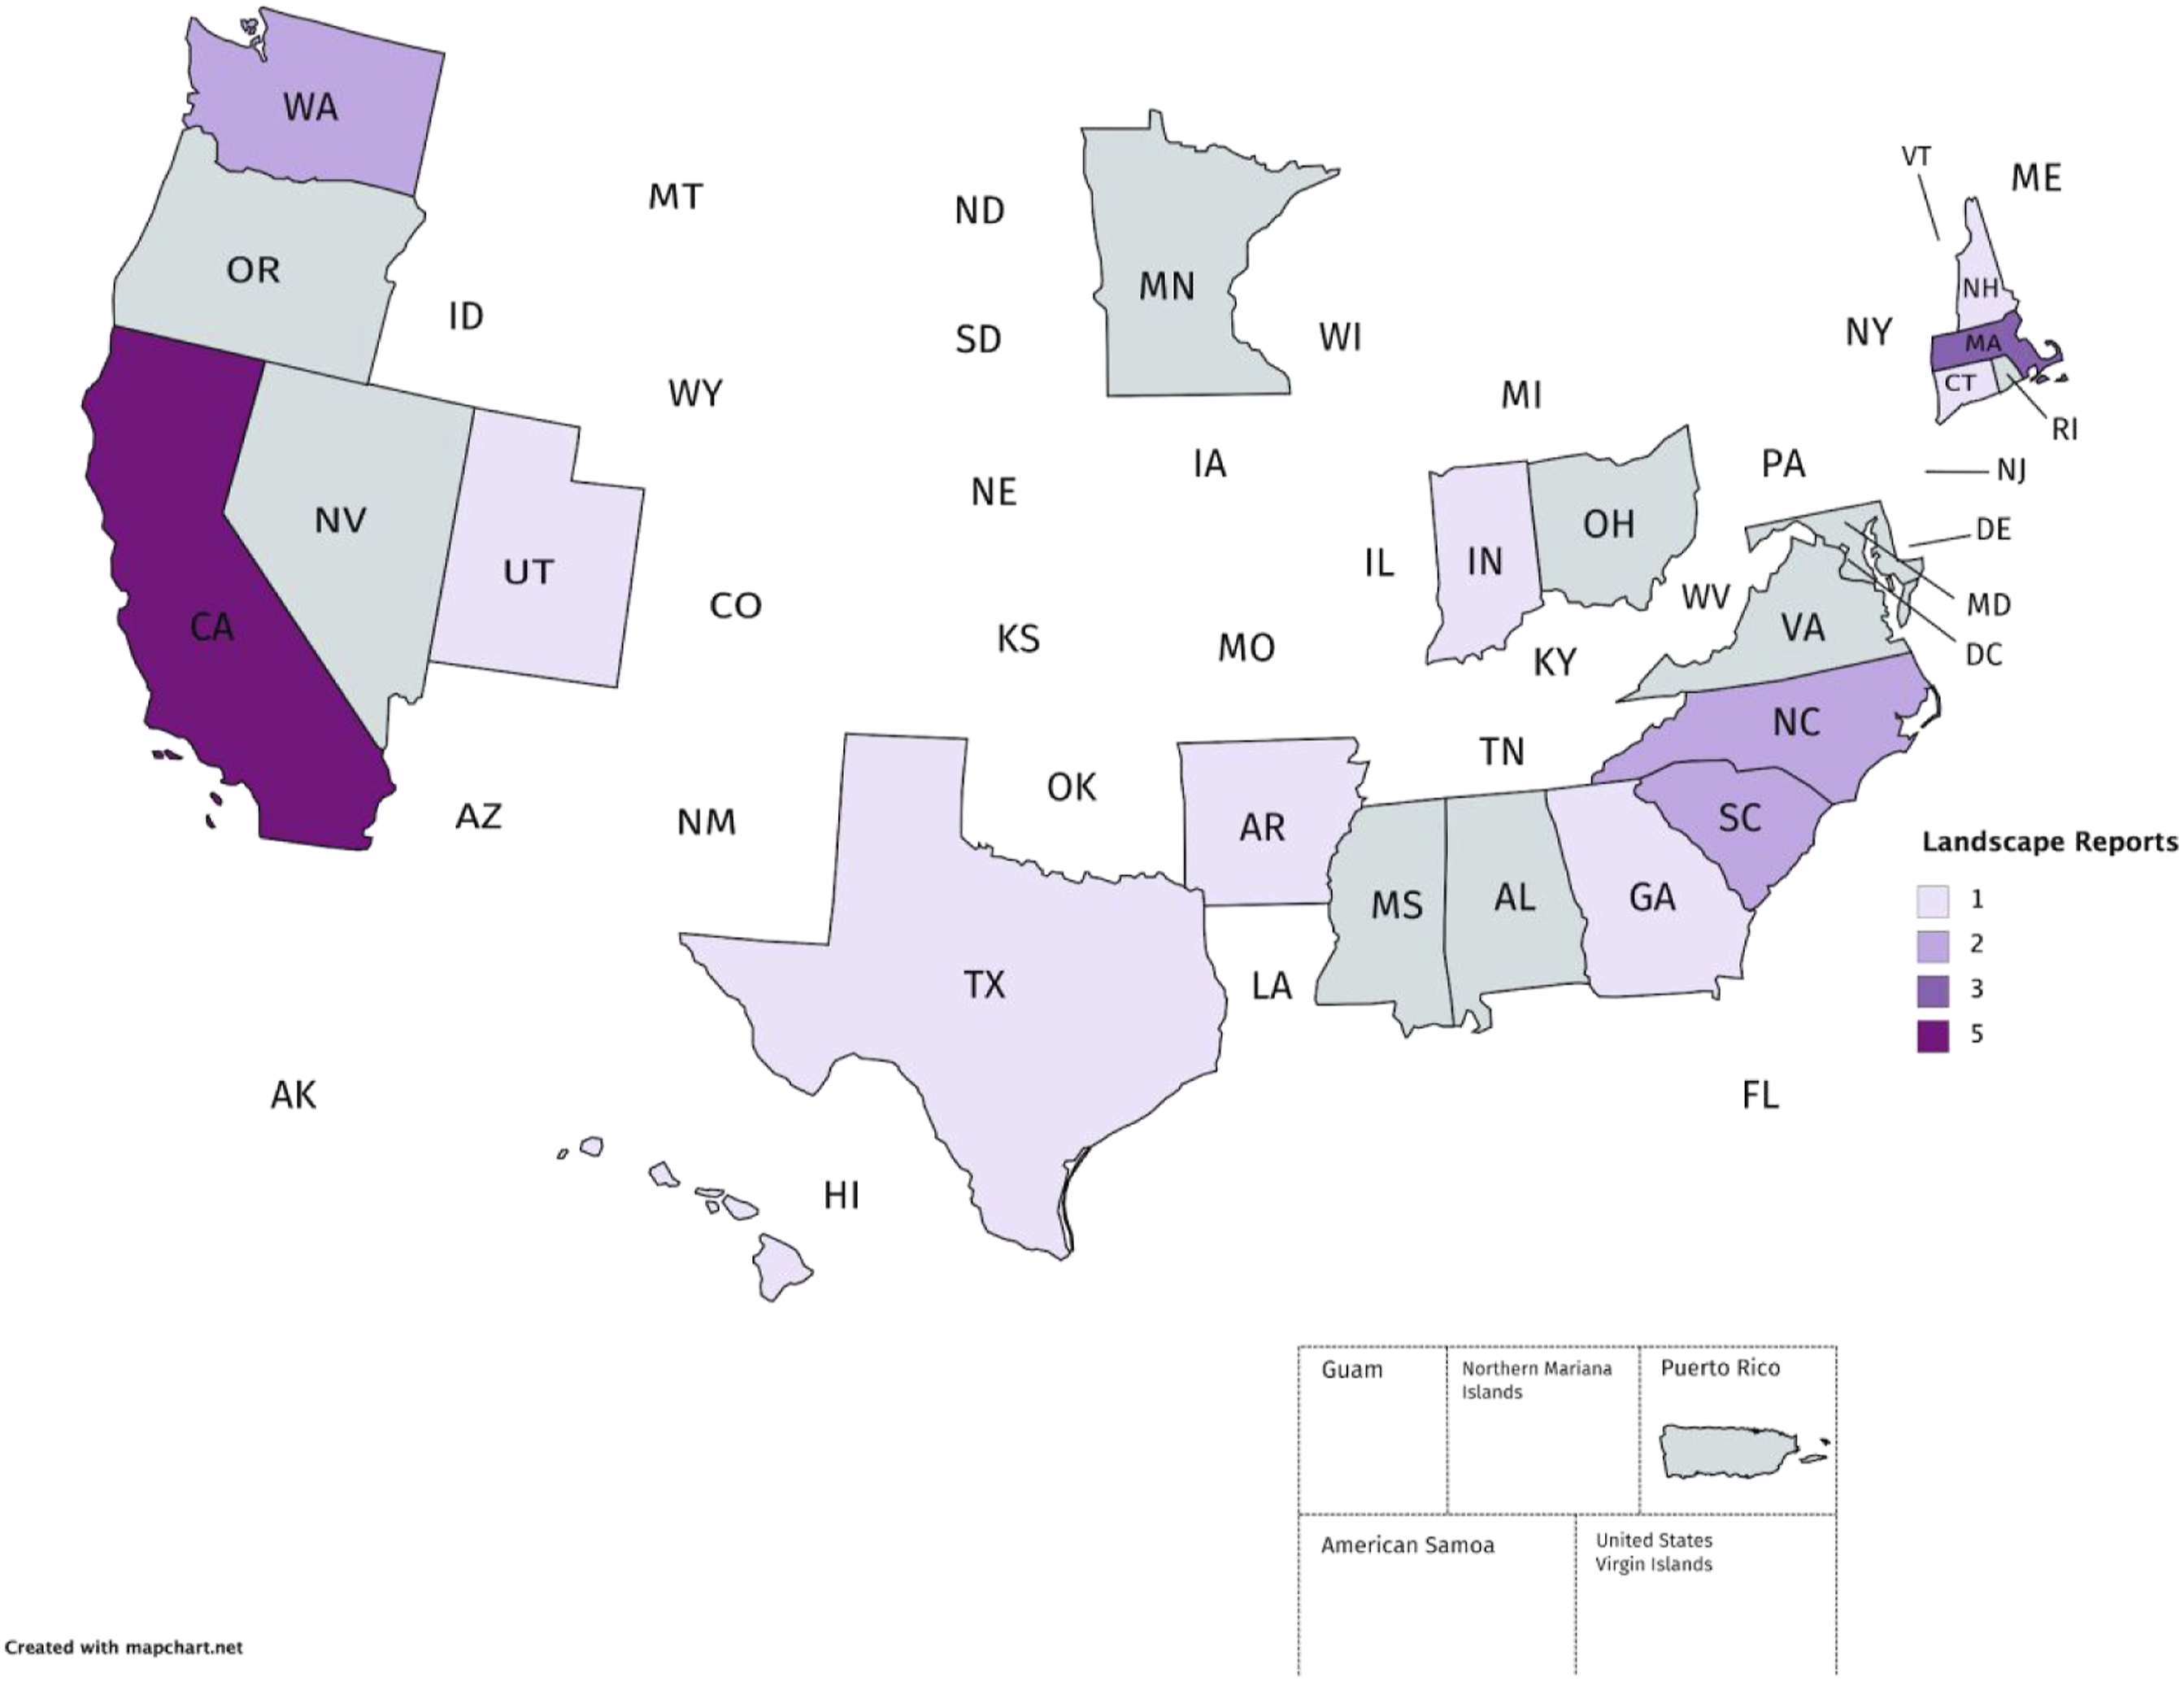
Seen as an important tool for state BPC efforts, the landscape report model has caught the attention of non-ECEP states too. In the last two years, ECEP has provided coaching on the landscape model to four additional non-ECEP states (NJ, ME, OK, IL). In general, the landscape reports have become more sophisticated and detailed. As ECEP’s strategies have become more focused on data as a driver for change, ECEP state teams have a greater understanding of how to design better landscape reports. Reports have started to provide more comprehensive state stories. This could be due, in part, to BPC indicators becoming more accessible or more state teams seeing a return on their investments.
Since 2018, ECEP has pushed data as a core strategy in state change, because of this, states are focused on identifying data that shows the impact of their BPC efforts, but also surfaces the work still to be done. States continue to express that landscape reports are critical to their understanding of the current status of CS education in their states. One state described the importance of conducting the landscape report, particularly as it relates to their understanding of the data:
“At first glance, our enrollment data for high school computer science classes made it appear that the demographics for all CS classes matched the demographics for our state. But when we dug deeper into our data, we saw troubling trends, where advanced classes had much less diversity than introductory courses. In particular, the enrollment in Exploring Computer Science matched our state’s demographics, but all CS classes had more white and Asian males than ECS, and advanced CS classes had the most white and Asian males” (Utah, Mini-Survey, 2019).
Another state described the importance of the landscape report in creating resources that can be shared and used to shape the CS education conversations and advocacy work: “The data points you highlight as callouts, images, or infographics will be the only thing remembered by many. They will become others’ talking points and shape many conversations around CS Education” (North Carolina, Mini-Survey 2019). Those clear and succinct visuals are important to conveying a state’s BPC story: “a simple chart can impress the teacher capacity needs better than words many times” (Georgia, Mini-Survey 2019). In addition, the landscape report helped their state with advocacy work: “partner organizations and industries [used it] to help promote and market computer science education for us...Data analysis and evaluation, aggregated to tell a story, moves mountains” (Nevada, Mini-Survey 2019).
Four states (CT, MD, IN, NH) noted that the landscape report helped convince stakeholders (administrators, teachers, parents) to be involved in the new initiative by clearly documenting an achievement gap: “The main takeaway was there is an achievement gap, which we knew, but the Landscape Report clearly documented it” (Connecticut, interview). Maryland (interview) also mentioned that the landscape report drew their attention specifically to rural areas: “The landscape report helped us make the effort to do more education among parents and teachers and administrators. This needs to happen in the rural areas.”
Landscape reports illuminate the current status of BPC initiatives by providing feedback from varied stakeholders, AP test data, and survey results which demonstrate course enrollments and an achievement gap in CS compared with other subject areas. Two states specifically mentioned that the report cross analyzed subgroups, allowing readers to see the trends or growth of pass rates and participation of underrepresented minorities. Indiana mentioned that the landscape report functions as their baseline to measure impact from where they started with BPC. However, this was also a challenge because to be truly useful, data needs to be collected consistently and constantly: “In a time of fast change and in flux, which we’re in now, it’s something that needs to be continuously updated, at least on some regular schedule, or it starts to be not as relevant anymore” (Indiana, interview).
Stage 3: Summits impact states’ overall BPC efforts
To advance BPC in a state, it is critical to involve a diverse group of stakeholders. The collaboration of diverse stakeholders can be coordinated through strategic meetings, summits, conferences, and convenings. Summits range in size, geographic focus (local, regional, or state-wide), and themes relevant to BPC. Efforts in this stage support capacity building through activities such as the creation of strategic plans.
State summits are an important part of this process and can help to develop and advance a state’s strategy both for expanding computing education access and for broadening participation in computing (BPC). In particular, summits can promote equity and democratize change efforts by giving voice to all stakeholders in a collaborative and action-oriented environment. These summits have resulted in strategic plans for the states or particular action items such as dissemination of state data, leadership team development, resource coordination, and professional development. As the ECEP model matured, more began to establish state-wide summits (See Figure 7). In 2017, the model was being requested by so many states, both ECEP and non-ECEP states, that ECEP partnered with NCWIT to publish the State Summit Toolkit (Expanding Computing Education Pathways & National Center for Women in Information Technology, 2019). Map of the ECEP states that have hosted state summits.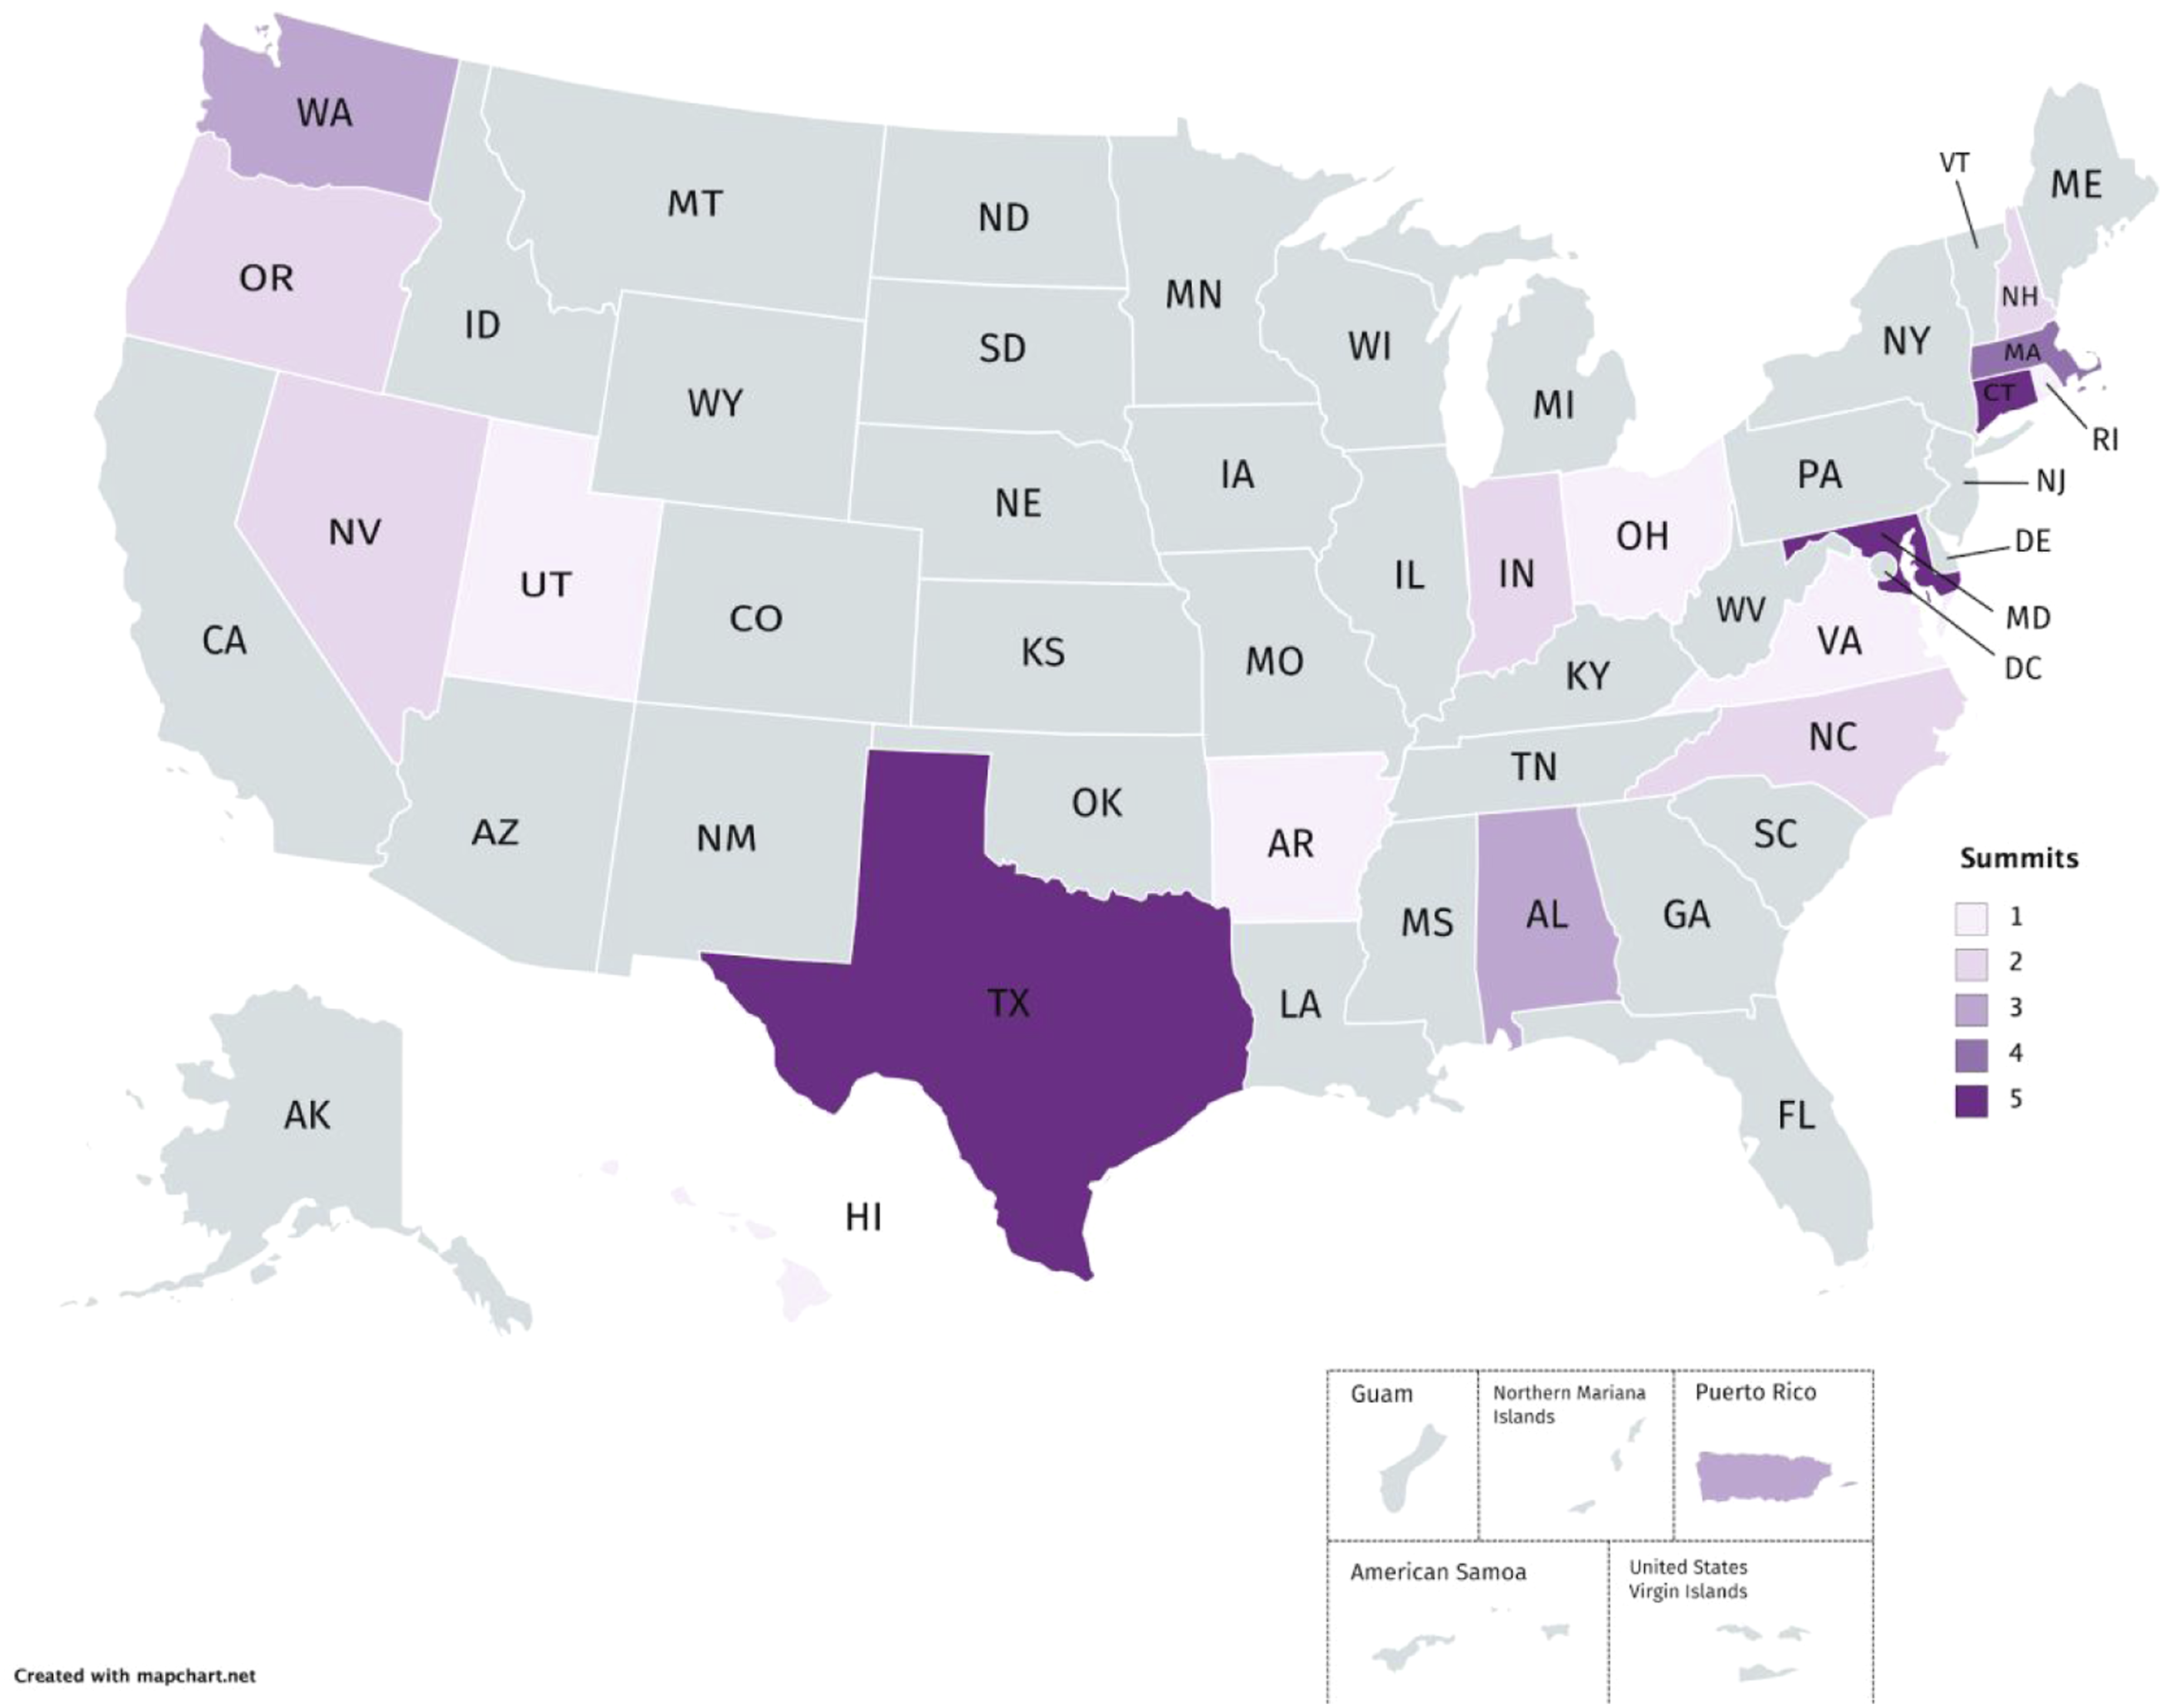
As stated in the State Summit Toolkit, “summits can promote equity and democratize change efforts by giving voice to all stakeholders in a collaborative and action oriented environment” (p. 4). Summits have served as a coordination mechanism as well as a strategic mechanism within the 5 stage model. The goals of the summit typically reflect the readiness of a state. States that are just launching their BPC efforts typically use summits to frame the challenge of BPC, ideate strategies, gather potential leaders and gain a sense of the landscape of CS education in their state. States which have accomplished more within their BPC strategies may use the conference as a dissemination mechanism, building trust in the effort and getting feedback. Summit planning is as valuable to state BPC efforts as the actual summit. During the planning phases, decisions must be made about the makeup of the attendees, the content reflected in the agenda, and the overall goals of the event.
Stage 4: Funding impacts states’ overall BPC efforts
Stage 4 focused on the importance of receiving funding to support states’ overall BPC efforts. Based on our codes, this included the identification and acquisition of funds or resources to sustain all levels of BPC efforts (e.g., teacher-level to state-level). Funding could be in the form of grants, gifts, corporate support, and private foundations to support human resources, activities (PD, trainings, summits), or research.
Although most ECEP states have described receiving funding, this was a difficult metric to collect. Often, the state-level funding is dedicated to CS professional development for teachers. According to Code.org et al. (2020), 16 ECEP states have dedicated state-level funding for K-12 computer science professional learning. These funds were allocated through an approved state budget or state legislation and a description of the funds was publicly accessible. In other examples, both Connecticut (SB280, SB391) and California (AB 2274) received funding from their state government to track equity data related to CS enrollments. Although receiving state funds are helpful, states can use other funding sources to achieve BPC efforts. Texas received funding from a wide range of sources including the U.S. Department of Education Title II grants for teacher professional development, NSF, 100kin10, Google, AT&T, and Microsoft. Indiana received funding from their state legislature that was distributed through the Department of Education. Some money was dedicated to helping districts develop strategic CS district-wide plans: “That funding gave those schools that are developing strategic plans the ability to attend SCRIPT [CSforAll District Planning] workshops. I definitely think that it’s had an impact” (Indiana, interview). In addition, some of this funding was designated to provide CS workshops and professional development experiences for teachers. In fact, Indiana mentioned that according to the landscape report, most of the schools that were offering CS had completed professional development activities that were sponsored by this funding.
One of the benefits of ECEP membership for states is being able to apply for co-sponsorship funding. Typical funding has ranged between $5000 and $25,000. States can apply for funding that focuses on BPC strategies that will impact BPC across the Alliance. The most common proposals include the funding of strategic planning, state-wide summits or creation of landscape reports. Connecticut has applied for and received multiple co-sponsorships from ECEP. The CS education advocacy initiatives in the state, formal (led by the SEA) and informal (led by CTCSTA and other orgs), have not received state funding for their coordination work. They have strategically utilized the ECEP co-sponsorships to fund a series of activities, including a summit in 2018, that indirectly led to legislation that supports CS in K-12, and two data efforts, the first focused on collecting detailed information on CS course enrollments and the second designed to identify models for achieving high participation among historically marginalized populations.
Since 2015, ECEP has awarded 29 co-sponsorships to 20 states. Several states received this funding multiple times (see Figure 8). Co-sponsorships were initially designed to “support expenses related to statewide CS education reform” (Expanding Computing Education Pathways Annual Report, 2015). As the funding was developed into an RFP, ECEP ensured that states were utilizing the funds to address BPC within all aspects of their reform efforts. Co-sponsorships often legitimize state efforts, and help them to formalize leadership groups, strategic plans, and launch or expand BPC strategies. ECEP states that received co-sponsorship awards and how many.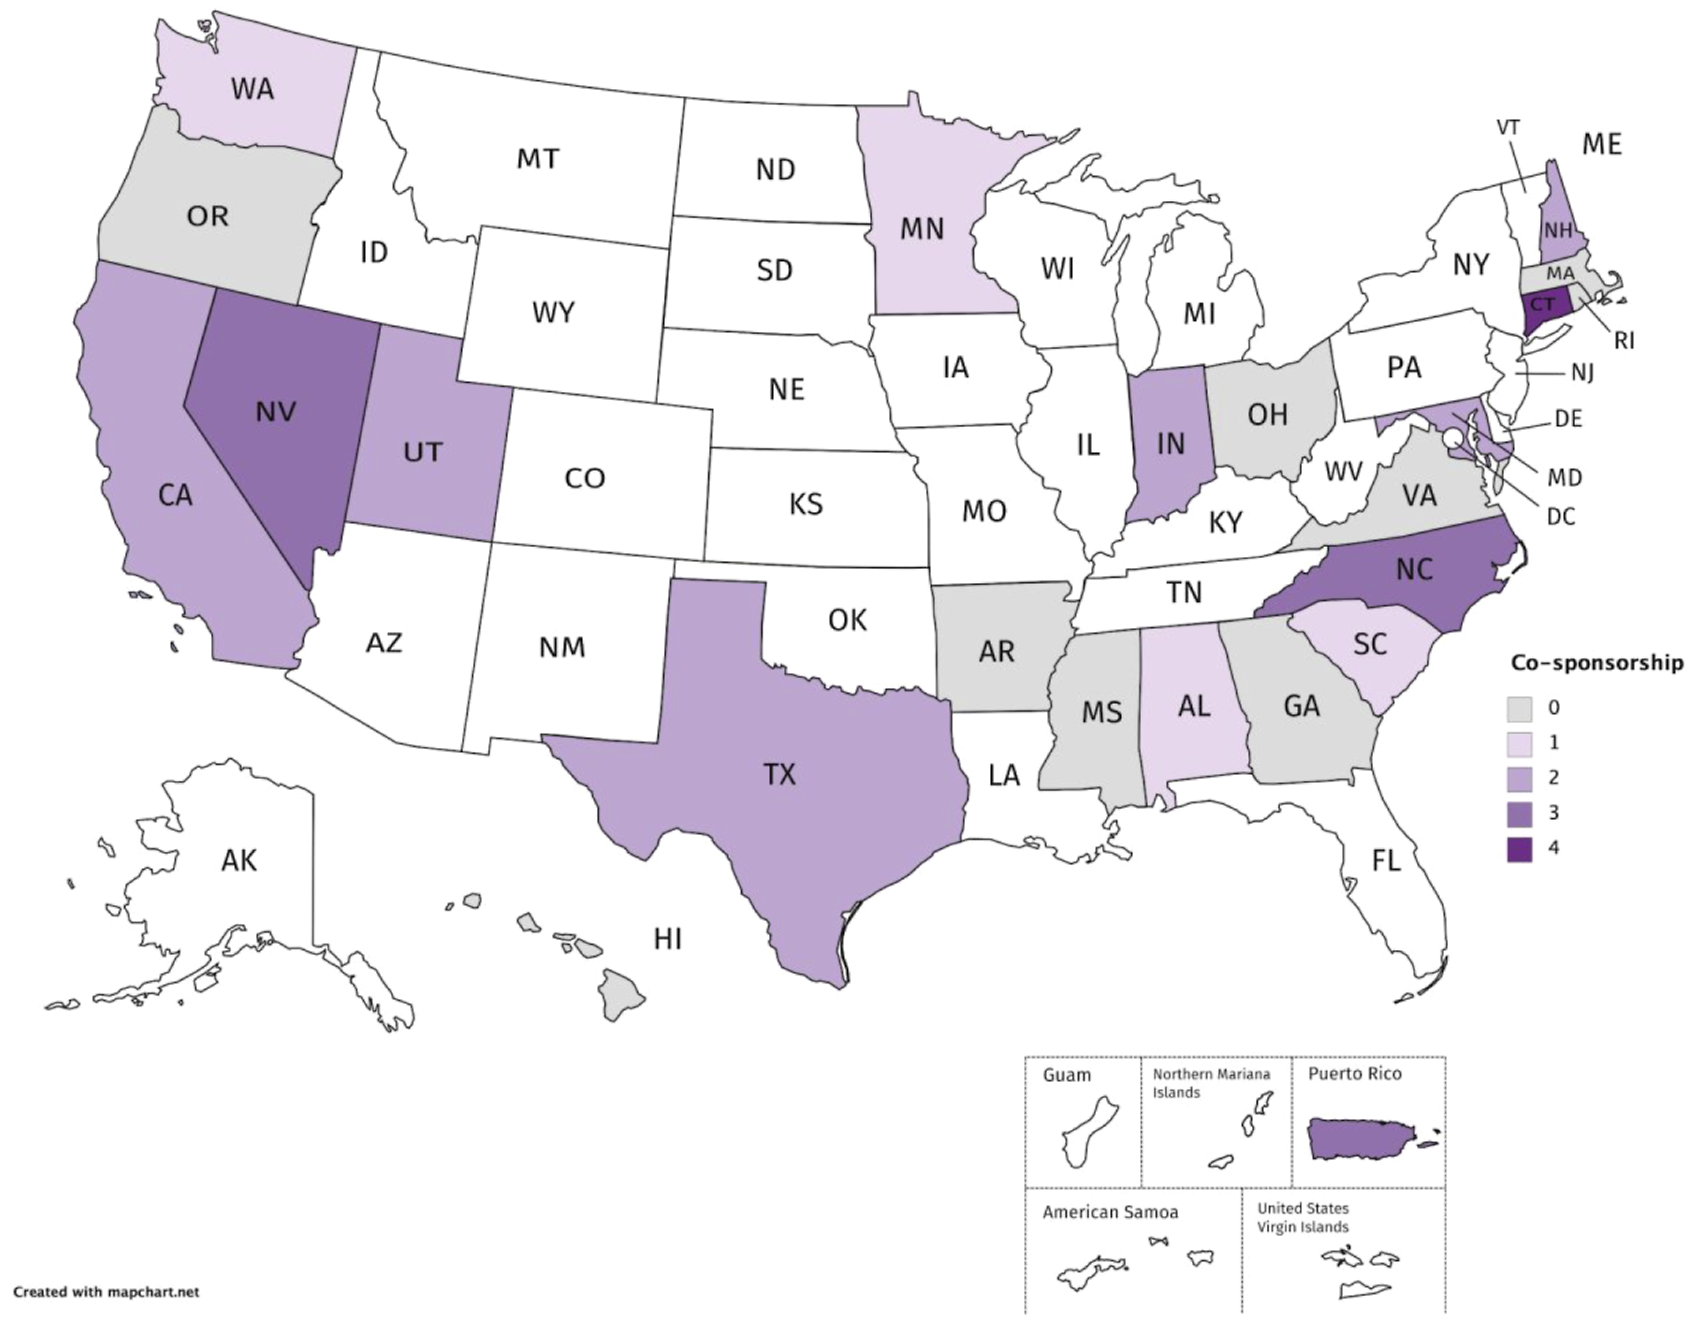
Stage 5: Evidence-based data and the impact on states’ overall BPC efforts
Stage 5 focused on the importance of using evidence-based data to support states’ overall BPC efforts. This stage focused on the creation of measurable goals and agreement on BPC-focused metrics. State teams used data to identify specific high-need underserved populations, establish measurable goals to serve these populations, and track the impact of BPC efforts for policy-makers, funders and other stakeholders. This stage was added in 2018 to begin tracking how our strategies were impacting our BPC efforts. In short, it is at this stage where the impact of states’ efforts in stages 1-4 can be measured.
Prior to the addition of Stage 5, state efforts had been focused primarily on laying the foundation for collecting disaggregated data to measure BPC progress. For example, to set goals around BPC for student access to and enrollment in computer science courses, many states had to first establish standards for computer science courses for consistency in data collection. States also needed to establish the appropriate data systems for measuring where courses are taught and specifically which students are enrolled. Only after these foundational steps have been taken are states ready to establish goals for access and participation of underserved student populations across the state and then begin to measure changes in those data longitudinally.
Several states explicitly mentioned the need for a data dashboard. Utah (interview) described the need for gathering data on a consistent basis and viewing how the data changed each year: “Our greatest difficulty in collecting data was getting consistent course enrollments. The state has different methods of reporting course enrollments, so while it was comparatively easy to get several years’ data at once to view a trend, it was more difficult to add the next year’s data to this data later.” This data is often difficult to gather. North Carolina (interview) pointed out that data collection and sharing was a priority for them: “Often the data we needed to create a well-informed landscape report is simply not available. We acknowledged this issue in our report rather than skip important pieces of the landscape, and now the issue of data collection and sharing is a priority area for our state CS initiative.”
To address this problem, a few ECEP states have developed data dashboards: California, Georgia, and Texas. California’s data dashboard is public and interactive, using Tableau to provide interactive visualizations of the CS data on their CSforCA website: https://csforca.org/the-data/) (see Figure 9). Example of California’s Data Dashboard.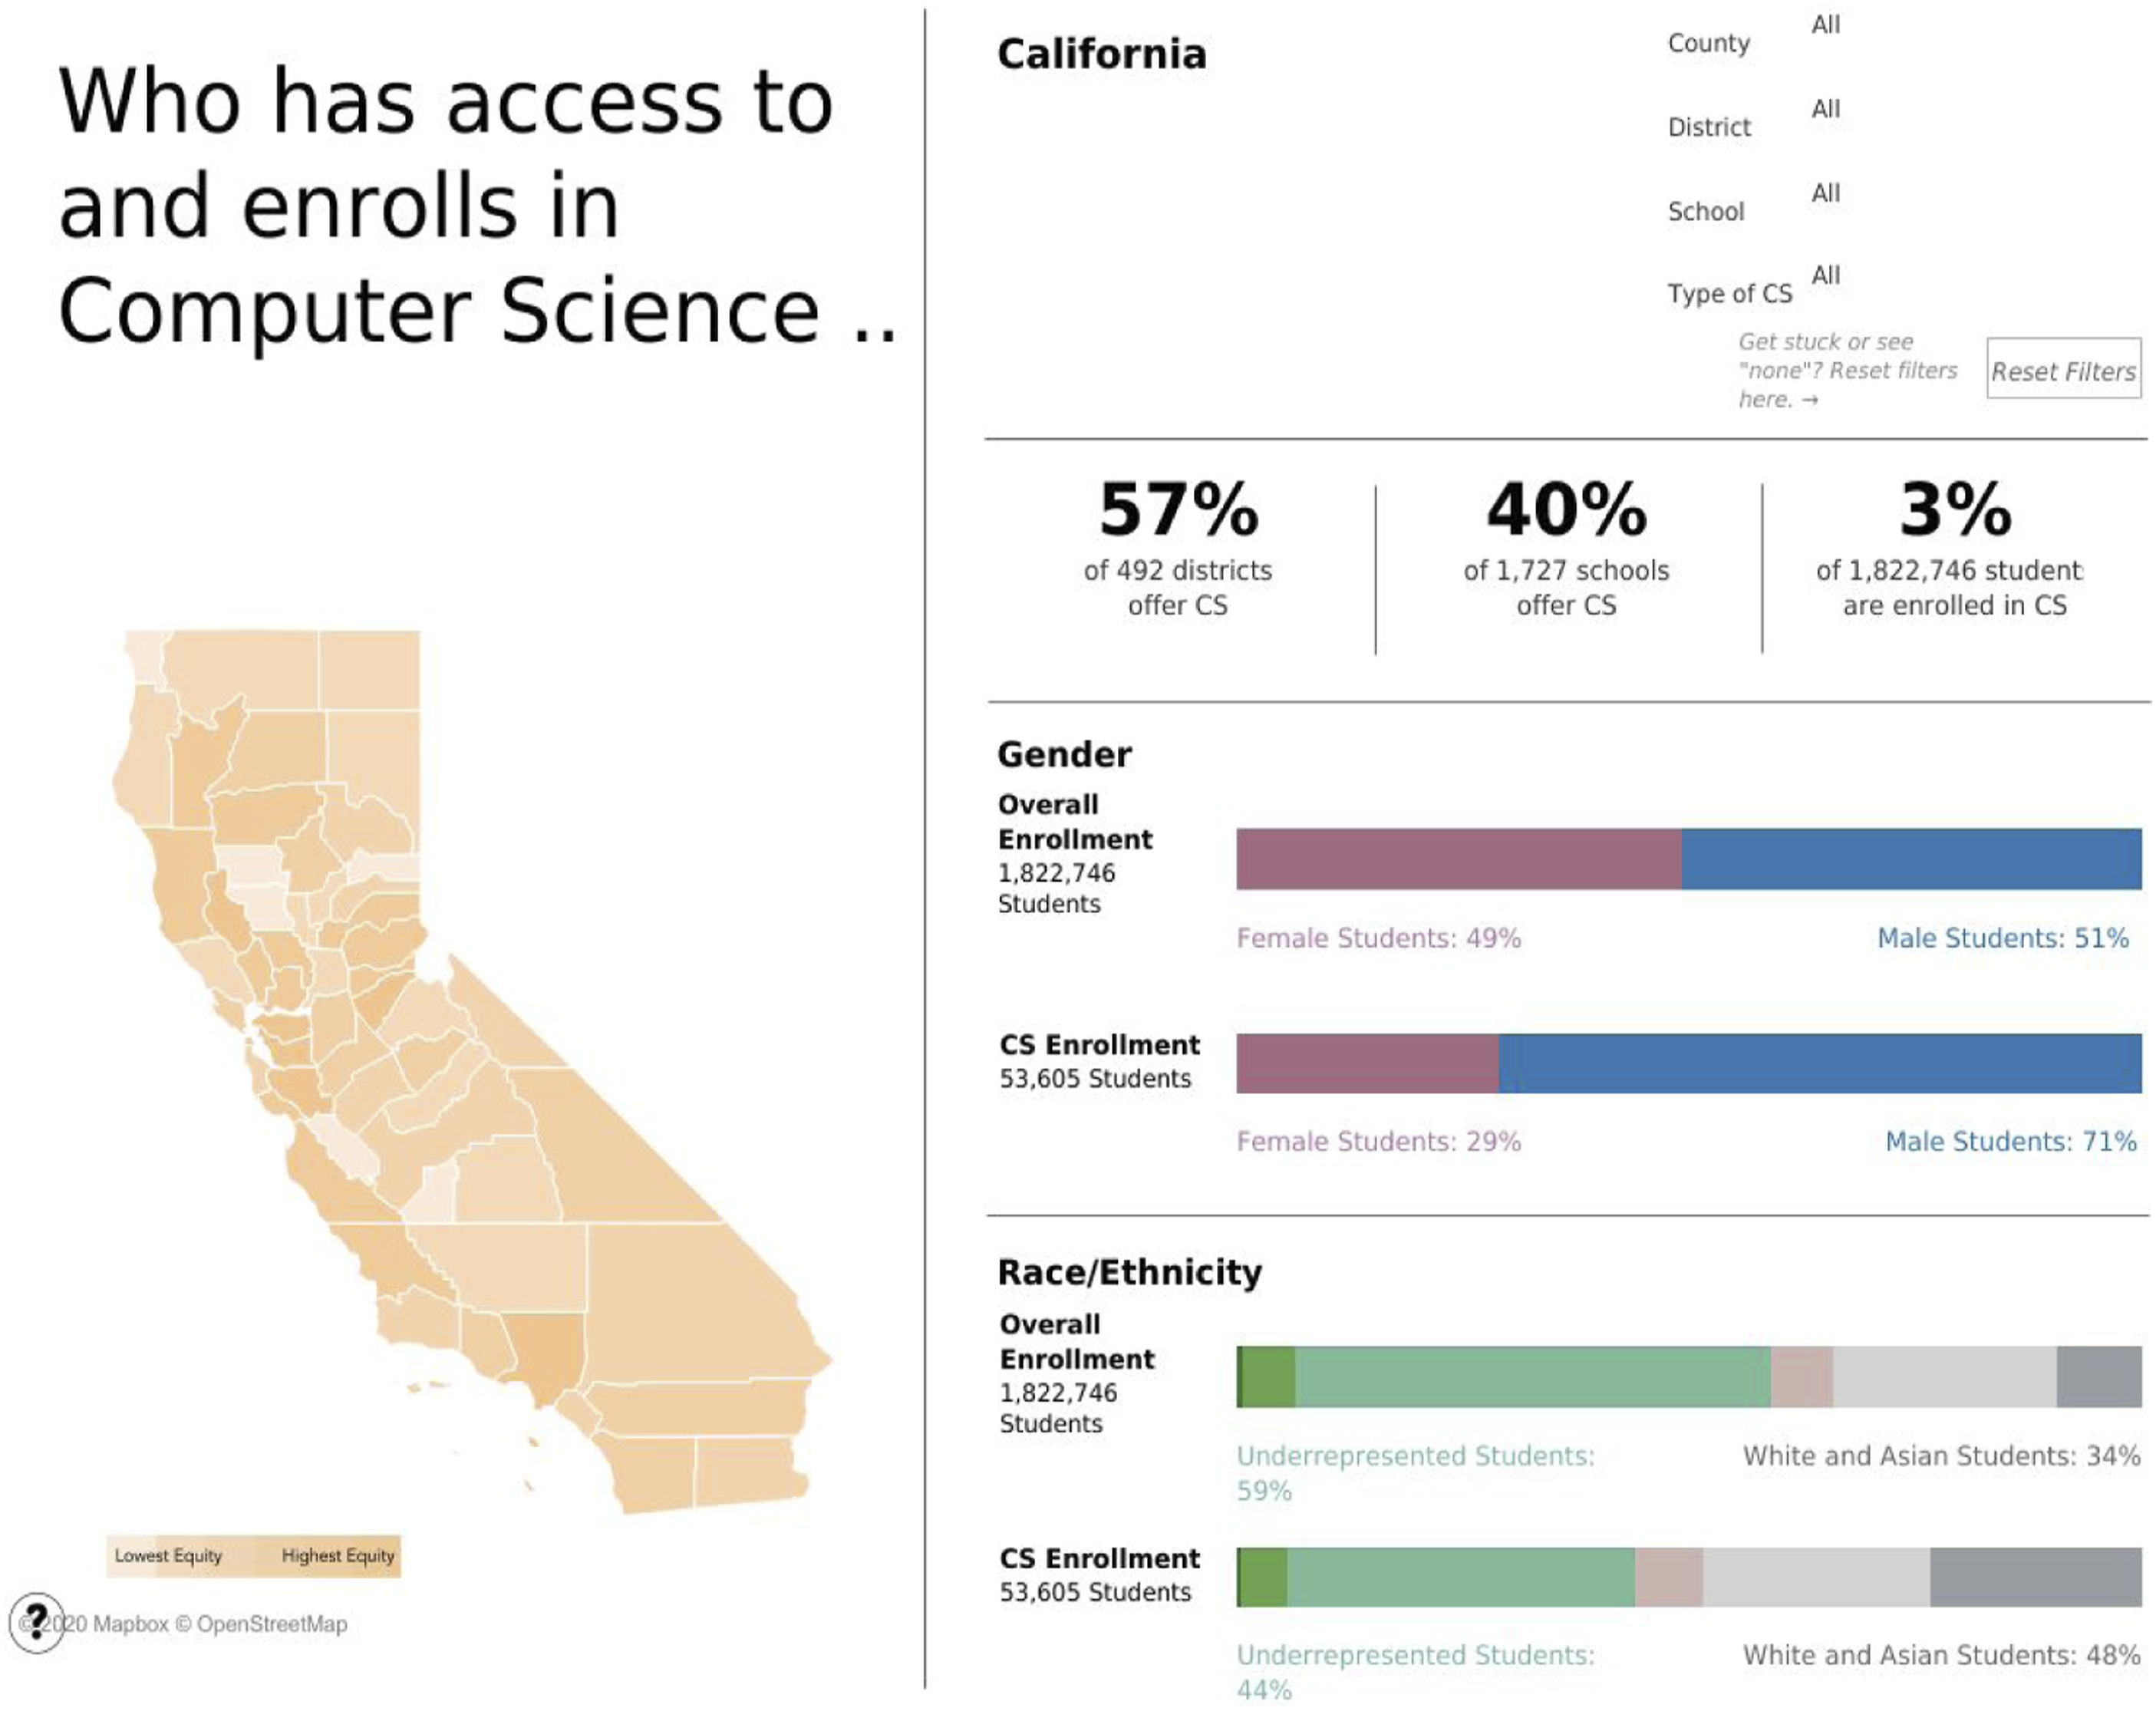
Texas utilizes a slightly different format, with short reports that can be easily shared and disseminated. The data reports can be examined by state or region, and even provide individualized school data. Texas created these Regional Data reports to help educational service centers (ESCs), school districts, and anyone interested in the progress of computer science education in Texas to document the disparities in access, participation, and experiences of CS for students at a very fine-grained level. One positive outcome of using this approach is it leverages the natural competitiveness of school and district leaders who are incentivized to improve their CS opportunities as a result of comparing themselves to their neighbors. Georgia (interview) created an internally available data dashboard as the state’s department of education was receiving “a dozen emails a week that can be greatly diminished if the data was publicly available in a format that is easy to digest. I found myself going to my dashboard every other day to answer someone’s question that could have been answered more efficiently with a public data dashboard.” Georgia plans on making their K-12 CS education dashboard public soon.
Discussion
Based on our review of ECEP’s data, the five stages appear to have evidentiary support in furthering states’ BPC goals. States reported, and we observed, a connection between each of the five stages and the states’ BPC progress. However, we still are unclear as to what those five stages mean in regard to our overall impact on BPC. For example, if we removed one of these stages, can states still accomplish BPC? Do states need to implement all five stages in a particular order? Our suggestion is that states will constantly flow between these stages, revisiting these stages as needed. For example, states may often need to revisit stage 1, to add new members to the team, or initiative task forces to focus on a particular issue. In another example, many states hosted multiple summits. These summits often took different roles, or examined different perspectives, or just included new voices. Future research should investigate whether there are patterns or whether particular stages require foundational efforts prior to engagement. Furthermore, as we examined the five stages, it became abundantly clear that states did not progress through the stages in a sequential fashion. Based on the evidence in this paper, heretofore we plan to describe our five-stage model as dimensions. Dimensions provided a more fluid representation of how states can change their K-12 CS education stories: five Dimensions of How to Change a State.
There seems to be another category or action that was not captured within the five stages. States specifically mentioned that certain activities were instrumental in their BPC efforts, but were not easily categorized into the five dimensions. These included teacher professional developments, K-12 standards development and implementations, and assessments. We considered whether these activities could become their own dimension: implementation. Or perhaps these activities could be described as the instantiation of another category. However, many of the initial work in ECEP was focused on these implementations such as teacher PD. Future research should consider where and how these activities fit within the five dimension model.
This paper provides evidence that the ECEP Alliance is continuously evaluating their BPC efforts and progress, as individual states, and as a collective impact network. ECEP is a backbone organization that helps support individual states’ plans. For collective impact to work, we needed states to investigate their own five dimensions around BPC. We still need to consider how these five dimensions for each state fit within our larger ECEP organization? How do the results from an individual state contribute back to the larger organization and movement forward? As a collective impact network, ECEP serves as a catalyst for states to discuss and advance their own BPC efforts through collaboration and sharing. Therefore, future investigations should focus on how individual states’ BPC efforts contribute back to the ECEP’s larger organization impact.
Footnotes
Declaration of conflicting interests
The author(s) declared no potential conflicts of interest with respect to the research, authorship, and/or publication of this article.
Funding
The author(s) disclosed receipt of the following financial support for the research, authorship, and/or publication of this article: This work was supported by the National Science Foundation (NSF-CNS-1822011, NSF-CNS-1228355 and NSF-CNS-12283).