
Abstract
The push to make computer science (CS) education available to all students has been closely followed by increased efforts to collect and report better data on where CS is offered, who is teaching CS, and which students have access to, enroll in, and ultimately benefit from learning CS. These efforts can be highly influential on the evolution of CS education policy, as education leaders and policymakers often rely heavily on data to make decisions. Because of this, it is critical that CS education researchers understand how to collect, analyze, and report data in ways that reflect reality without masking disparities between subpopulations. Similarly, it is important that CS education leaders and policymakers understand how to judiciously interpret the data and translate information into action to scale CS education in ways designed to eliminate inequities. To that end, this article expands on recent research regarding the use of data to assess and inform progress in scaling and broadening participation in CS education. We describe the CAPE framework for assessing equity with respect to the capacity for, access to, participation in, and experience of CS education and explicate how it can be applied to analyze and interpret data to inform policy decisions at multiple levels of educational systems. We provide examples using large, statewide datasets containing educational and demographic information for K-12 students and schools, thereby giving leaders and policymakers a roadmap to assess and address issues of equity in their own schools, districts, or states. We compare and contrast different approaches to measuring and reporting inequities and discuss how data can influence the future of CS education through its impact on policy.
Keywords
“If the ladder of educational opportunity rises high at the door of some youth and scarcely rises at the doors of others, while at the same time formal education is made a prerequisite to occupational and social advancement, then education may become the means, not of eliminating race and class distinctions, but of deepening and solidifying them.”
The above statement, made over 70 years ago to date in a federal report on education in the United States (President’s Commission on Higher Education, 1947), was quoted recently in another national report by the National Academies of Sciences, Engineering, and Medicine (2019) entitled, “Monitoring Educational Equity,” which was aimed at policymakers and designed to provide the structure for a systematic approach to addressing issues of educational equity. The report was commissioned on the premise that, despite the longstanding knowledge of inequities in education, extensive disparities persist in the nation’s educational system. The authors of the report call for a system of equity indicators that can provide measures of “valid comparisons of schools, districts, and states across a number of important student outcomes” (p. 1). The report proposes that these indicators be regularly and systemically collected and reported with the goal of illuminating disparities and tracking progress for students belonging to one or more minoritized groups. Similarly, we aim in this article to provide insight on measuring equity at multiple levels of the computer science (CS) education ecosystem, not just for policymakers but for CS education researchers and practitioners as well. Educational equity is an important issue for every discipline, but the CS discipline is unique in that we must confront inequities while simultaneously grappling with the challenge of expanding and scaling the discipline itself. Less than half of the high schools in the country currently offer CS courses (Code.org, CSTA, & ECEP Alliance, 2020), but this share is rapidly growing. We must develop systems for measuring and addressing equity in CS education before existing disparities are propagated through scaling efforts. In the push to institutionalize CS education in all schools, we face an increased risk of “deepening and solidifying” existing disparities, but we also have a greater potential to take action—through policies and practices—that will help mitigate and even eliminate those disparities.
Many inequities in CS education are systemic, and they are manifested and compounded at multiple levels. In order to equitably scale and broaden participation in CS education, we must develop a more nuanced view of what equitable CS education entails. Equity is a multi-dimensional concept that cannot be adequately assessed by unidimensional metrics, such as whether all students have the opportunity to enroll in CS courses. As noted by Goode et al. (2021), equity involves “interlocking issues,” which include access (opportunity to learn CS), diversity (enrollment rates that reflect school demographics), and inclusion (culturally responsive and inclusive teaching). To achieve equity in CS education, we need to understand the multitude of factors that have contributed to the disparities we see in student outcomes in CS and identify where the educational system is falling short of supporting all students. In this study, we applied the CAPE framework (Fletcher and Warner, 2021) to examine how issues of equity play out across the CS education landscape. The CAPE framework (Figure 1) is a lens to assess equity in the unique context of CS education by suggesting a holistic approach to understanding inequities at multiple levels of the educational system rather than focusing on siloed problems. It conceptualizes equity with respect to capacity for, access to, participation in, and experience of CS education. Capacity entails that schools have the resources (e.g., teachers, funding) needed to offer CS courses. Access refers to whether students have the opportunity to learn CS, often defined as attending schools that offer CS courses. Given the opportunity to take CS, participation in CS education signifies that students actually enroll in CS courses/programs. Finally, experience refers to what happens in a CS learning environment, including students’ learning, engagement, and sense of belonging or self-efficacy in CS. In this paper, we describe how the CAPE framework can be applied to analyze and interpret data to inform policy decisions across the various interconnected components of educational systems. Capacity, access, participation, and experience (CAPE): A framework for assessing equity in CS education.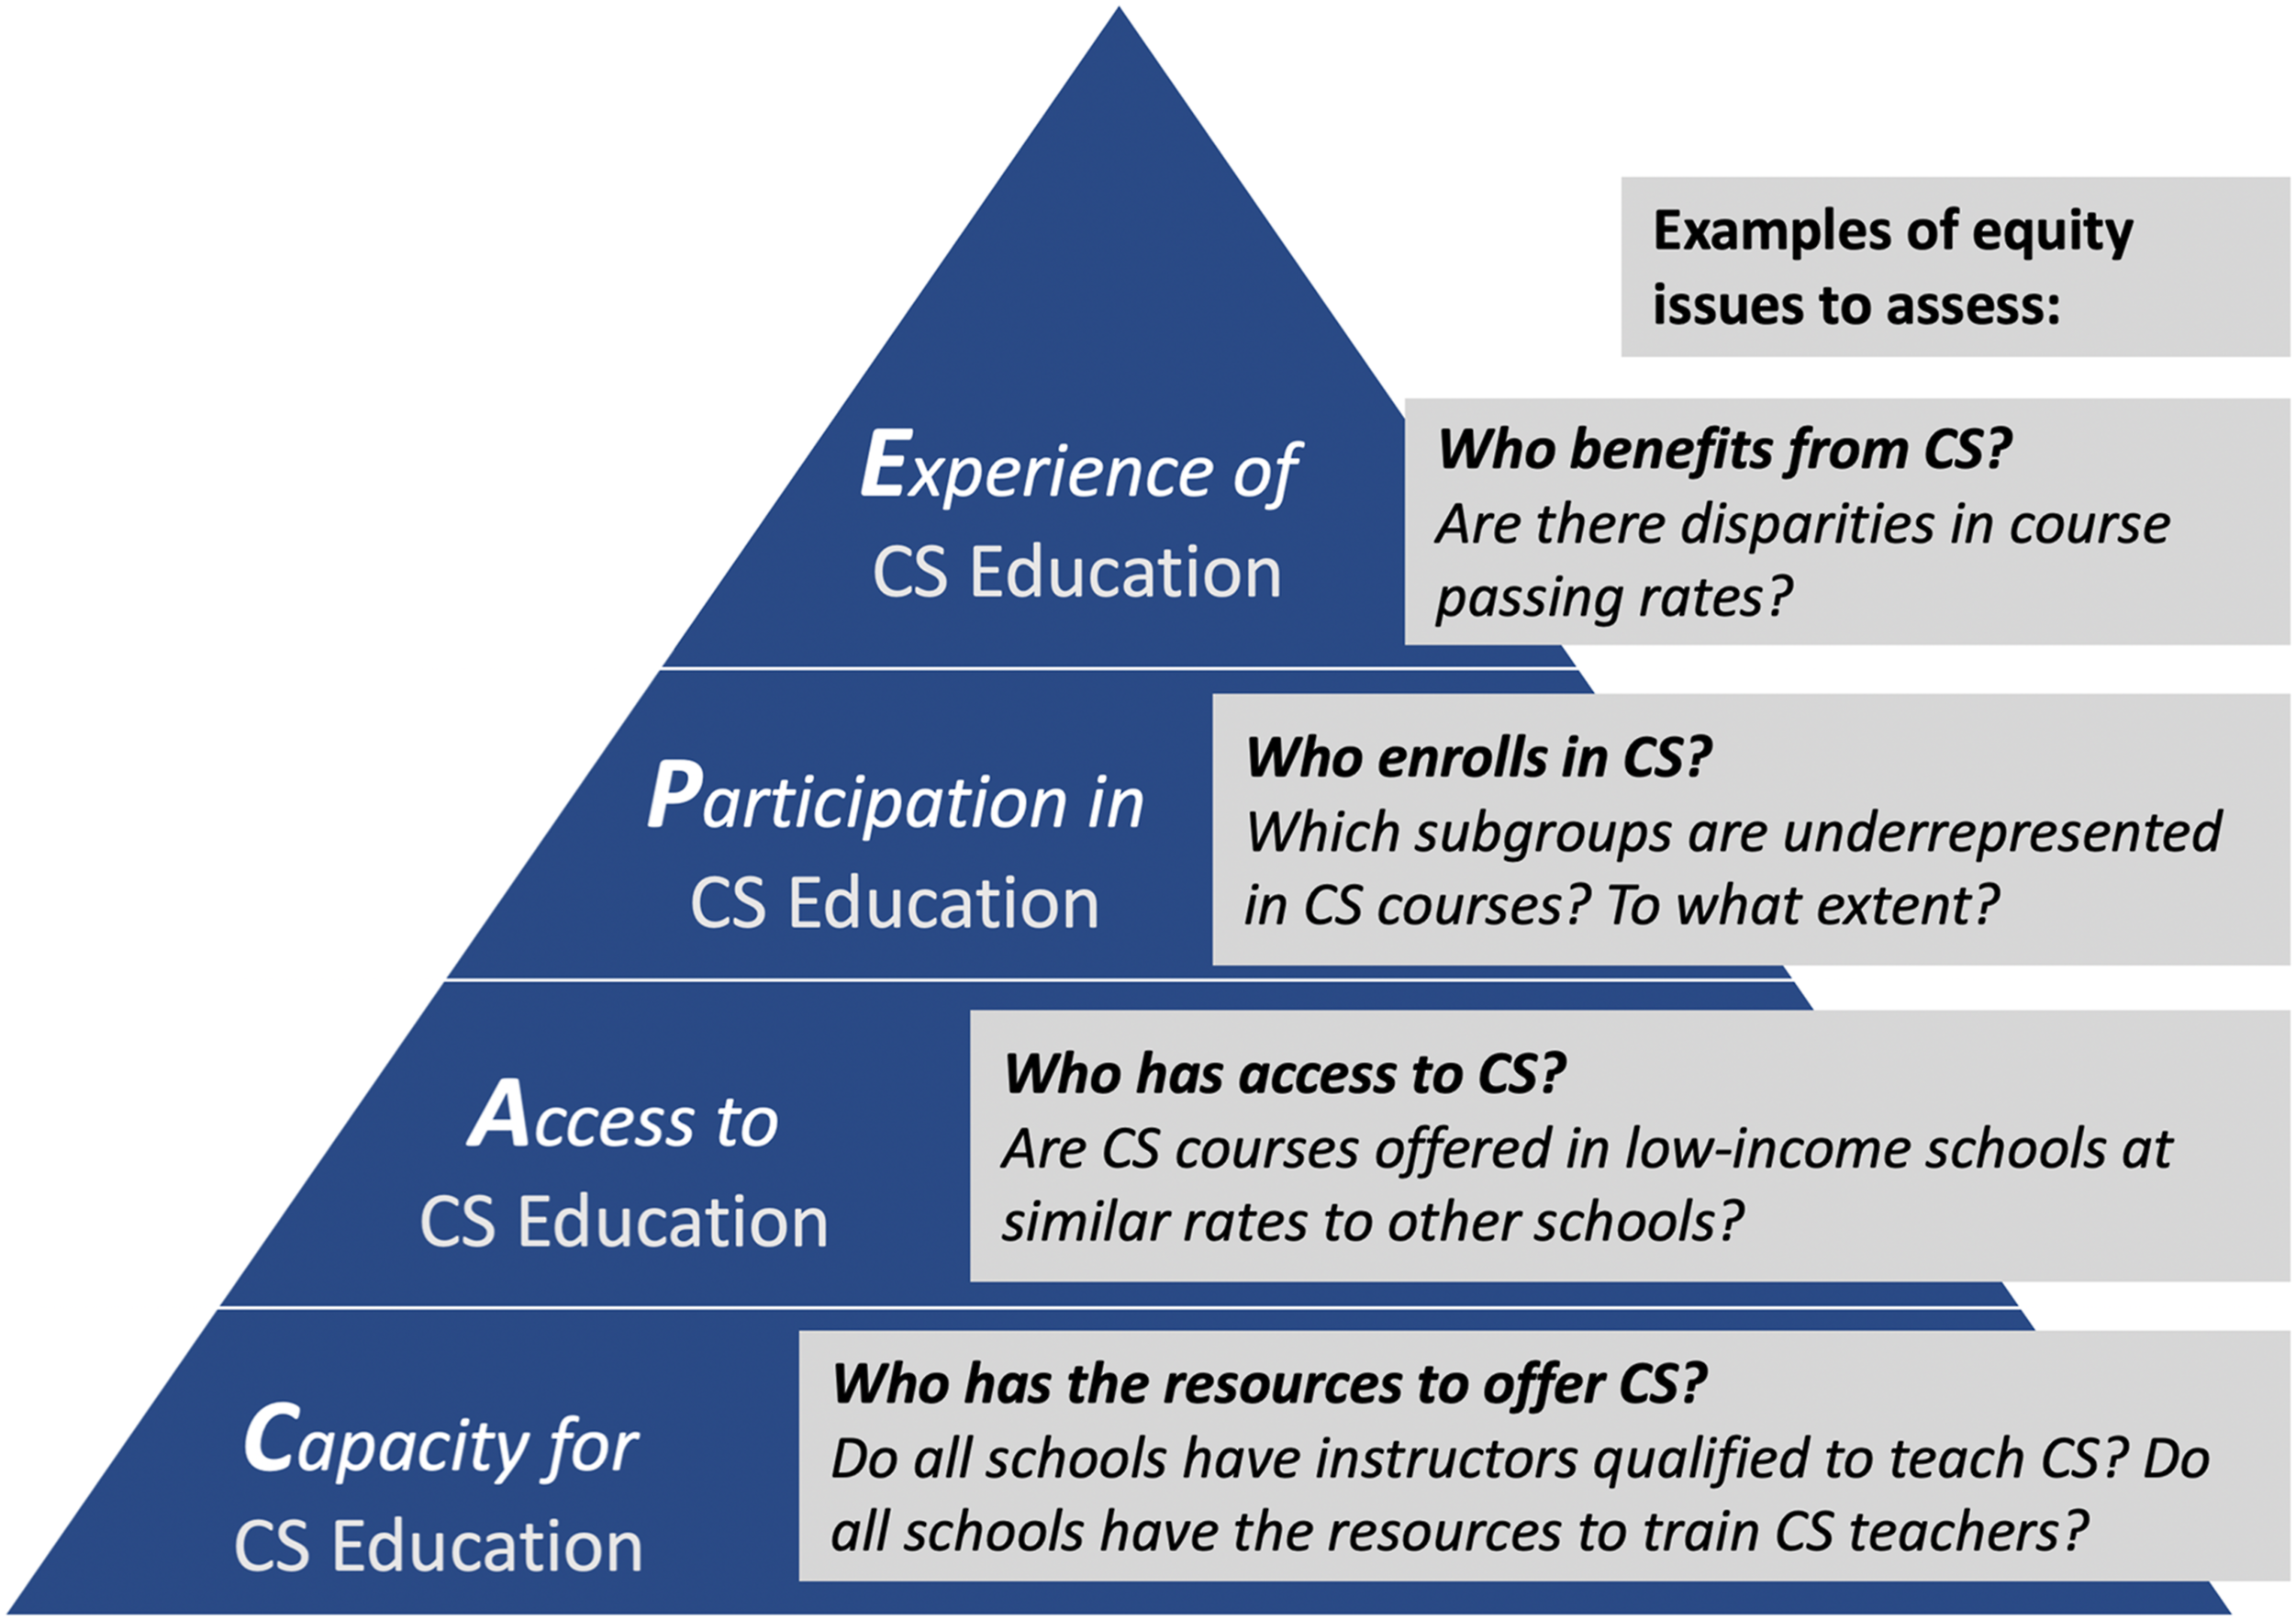
Background
Monitoring and assessing equity in CS has been prioritized by several national organizations invested in computing education. The National Science Foundation (NSF) stressed the importance of broadening participation in computing by taking meaningful action to address the longstanding underrepresentation of certain populations (National Science Foundation, 2020). The NSF funded the Expanding Computing Education Pathways (ECEP) Alliance principally to increase the number and diversity of students in the pipeline to computing and computing-intensive degrees by supporting state-level computing education reforms. ECEP actively supports state teams in their efforts to measure and address inequities in CS education in their states (Adrion et al., 2020). CS for All and the Computer Science Teachers Association (CSTA) focus on supporting districts and teachers implementing CS programs. Other organizations, such as Google and the Code.org Advocacy Coalition, regularly produce national reports on K-12 CS education that highlight the barriers faced by minoritized student subpopulations (Code.org, CSTA, & ECEP Alliance, 2020; Google LLC & Gallup Inc., 2020). Across the United States (U.S.), many organizations develop similar reports at the state level (Scott et al., 2019; Texas Advanced Computing Center, 2020). Most of the work to identify and address inequities in CS education at scale have come in the form of these institutional reports and have focused on access and participation. In this section, we review past and current efforts to monitor and assess equity in CS education in terms of capacity, access, participation, and experience.
Capacity
Large-scale empirical analyses of school, district, or state capacity for CS education are limited. This may be due to the difficulty in measuring the capacity of a school, district, or state to provide CS learning opportunities. Capacity for CS involves multiple factors, including having teachers with the necessary CS knowledge and skills, funding for technology and professional development, and time to include instruction in what is perceived by many as an elective subject. On a Google LLC, & Gallup Inc. (2015). national survey of K-12 administrators, 42% of principals and 73% of superintendents who did not offer CS in their school or district cited a lack of teachers with the necessary CS skills as one of the reasons they did not offer CS. Results from that same survey showed that 44% of principals and 57% of superintendents felt they did not have enough money to hire a teacher for CS. However, both principals and superintendents cited pressure to devote most of their time to courses that were part of the standardized testing regimen as the main reason they did not offer CS. By 2016, when the survey was repeated, the main reason cited by both principals (63%) and superintendents (74%) for not offering CS was a lack of skilled teachers (Google Inc. & Gallup Inc., 2016). Although these data document issues of capacity to offer CS, there remain unanswered questions concerning equity in this area. For example, which types of schools have teachers with the requisite skills to teach CS courses? Do schools in low-income communities have sufficient resources to start CS programs? Are there location-based disparities in terms of which districts are able to recruit and train CS teachers?
Access
Numerous publications have documented the disparities in students’ access to CS education in K-12. The aforementioned Google LLC, & Gallup Inc. (2015) survey showed that Black and Hispanic students were less likely than White students to attend a school that offered CS courses. They also noted a relationship between access and household income, with the chances of attending a school that offers CS being greater for students in households making over $54K and greater still for students in households grossing over $105K. Similarly, Margolis et al. (2008) reported that the proportion of low-poverty high schools in California that offered Advanced Placement (AP) CS was over three times greater than the proportion of high-poverty high schools that offered the course. This disparity seemed to increase in the ensuing years, as Martin et al. (2015) later reported that California high schools whose student body was comprised of less than 25% low-income students were approximately 11 times more likely to offer AP CS than schools with over 75% of students identified as low-income. When considering the likelihood of offering any CS course, the researchers found that more affluent schools were over twice as likely to offer CS. This suggests that inequities in access may tend to be greater for more advanced CS courses. More recently, Code.org, CSTA, and ECEP Alliance (2020) reported that only 34% of U.S. schools with at least 75% of students eligible for free and reduced-price meals (FRM) offered a CS course, whereas 55% of schools with FRM rates lower than 25% offered CS courses. With respect to race and ethnicity, they reported that 85% of Asian students in the U.S. attend a high school that offers at least one CS course compared to 74% of White students, 71% of Hispanic/Latino students, and 66% of Black students.
Participation
Equity in terms of student participation in CS education is generally assessed by comparing the proportions of students who enrolled in CS courses for different subgroups. However, these metrics are often computed by including the entire population of students (usually high school students) in the denominator rather than limiting the base population to students who attend schools that offer CS courses. The resulting metric is then a conflation of access and participation. For example, Scott et al. (2019) reported that “Black, Latinx, and Native American/Alaskan Native students represent almost 60% of California’s high school population ... but just 16% of students enrolled in AP CS A” (p. 12). This represents a significant disparity in terms of participation in AP CS A, but because the article does not provide the percentages of students who attend a school that offers AP CS A for these race/ethnicity groups, we cannot tell from the data alone whether this disparity is due to under-enrollment in AP CS or a lack of access to AP CS courses or both.
Sometimes this blending of access and participation is further complicated by a lack of context when context is needed to make valid comparisons to gauge the presence and magnitude of inequities. For example, the 2019 State of CS report provided five years of data on the number and percent of AP CS exams taken by several racial and ethnic subgroups that tend to be underrepresented in computing courses in the U.S. (Code.org, CSTA, & ECEP, 2019). Although these data give an indication of the extent to which participation rates in AP CS exams increased over time for these groups of students, they do not provide any information on whether and to what extent there were disparities in participation among racial subgroups. This was changed in the report for the following year (Code.org, CSTA, & ECEP Alliance, 2020), where AP CS exam participation data were given for each of seven race/ethnicity groups alongside the breakdown of these categories for schools that offered AP CS courses. Here, the disparities in participation rates were clear: Hispanic/Latino students represented 26% of students at schools offering AP CS but only 17% of students taking AP CS exams, and Black students comprised 13% of all students at AP CS schools but only 6% of students taking the exams.
Because the proportion of female students to male students is roughly equal at most schools, metrics showing disparities in participation along gender lines usually do not require these extra steps to distinguish them from measures of access. Gender disparities are persistent over time and across geographic boundaries. The 2020 State of CS report showed that, nationally, over twice as many male than female students took the AP CS exam, and in no state was the number of female students taking the exam close to the number of male students taking the exam (Code.org, CSTA, & ECEP Alliance, 2020). Other reports have documented gender disparities in terms of participation in AP CS courses and exams (e.g., Heitin, 2015; Loewus, 2014; Nager and Atkinson, 2016), but few have included other types of CS courses when assessing participation.
Experience
As compared to access and participation, less work has been done to quantitatively assess and monitor issues of equity regarding students’ learning experiences in CS. Many discussions of equity in CS education are limited to increasing the enrollment of minoritized groups of students who are underrepresented in CS. But increasing participation of these students does not necessarily mean that they are engaged, receiving high-quality instruction, or having positive experiences in CS (Margolis et al., 2012). Achieving equity requires that all students feel a sense of belonging and self-efficacy in CS, instructional practices and curricula are culturally responsive, and student learning outcomes and future course-taking patterns are similar for all students.
Efforts to assess equity in students’ experiences in CS have predominately utilized learning outcome data such as AP exam scores and passing rates, disaggregated by various demographic characteristics. These data are often used to compare learning outcomes for different groups of students and explore how minoritized students in CS perform compared to their peers. For example, Scott et al. (2019) identified inequities in students’ experience of AP CS courses in California by comparing AP CS A exam passing rates for Hispanic/Latino (40%) and Black (39%) students to passing rates for Asian and White students (over 75%). These data suggest that Asian and White students in California may have had more positive learning experiences in CS than their Hispanic/Latino and Black peers, perhaps due to higher-quality instruction or coursework that better prepared them for the exam. These disparities in AP CS exam passing rates, however, have not been found for gender. In the same study, Scott et al. reported that females and males had similar passing rates for the AP CS Principles and AP CS A exams, suggesting that once females enrolled in CS (an area of large disparity), they did as well academically as their male peers.
However, exam scores do not capture the entirety of students’ experiences. These metrics do not tell us whether students are engaged, interested, confident, supported, or feel a sense of belonging in CS, all of which may affect whether they pursue additional CS courses, degrees, or careers. Some large-scale reports have sought to document these other factors. Google Inc. and Gallup Inc. (2016) found that male students were more likely than female students to be told by a parent or a teacher that they would “be good at CS.” This implies that, although female students perform on par with their male peers, they may receive differential encouragement or treatment from teachers and parents based on perceptions of who will be successful in CS courses.
Using CAPE to inform policy
Although some effort has been directed at assessing issues of equity at each level of the CAPE framework, unanswered questions remain, and the field of CS education research lacks consistency in the methods used to measure and report disparities. Moreover, little has been done to synthesize the work in a way that ties the various measures and indicators together to form a holistic picture of equity in CS education. This represents a significant gap in our collective understanding of equitable CS education, especially from a policy perspective, as systemic thinking is vital to effective policy implementation. The purpose of this article is to begin down that path by examining how the CAPE framework can be used not only to assess equity at multiple levels of educational systems, but also as a guide for considering how implications at each level can work together to inform policy. The following subsections each address a different level of CAPE (i.e., capacity, access, participation, or experience). Within each subsection, we pose one or more research questions that align with the given level of CAPE. These research questions were selected to provide examples of the kinds of metrics that could be examined at each level of CAPE, and thus they represent only some of the many different questions that could be asked at each level. We then answer each research question by presenting the results of analyses we conducted using data from one or more states in the U.S., including Texas, Indiana, Connecticut, Massachusetts, Rhode Island, and Vermont. Although we hope this study provides insight into how CAPE can be used to assess equity within education systems, our purpose here is not to evaluate any one state or education system. For that reason, we intentionally avoided using data from only one state. Each set of results is then followed by a brief discussion of the policy implications of the findings. Finally, we conclude the paper with a discussion of how these policy implications are interconnected across the levels of CAPE.
Capacity for CS education
At its most basic level, equitable CS education cannot be realized if schools do not have equitable capacity to teach CS. One way to measure capacity for CS is to examine whether schools have teachers with the requisite CS knowledge, skills, and, if necessary, certification to teach CS courses. Assessing capacity in this way makes sense, given that, as noted previously, principals and superintendents have cited a lack of qualified teachers as a primary reason their schools did not offer CS courses. However, little empirical research has been conducted to determine how teacher capacity varies by school type.
Research questions
With more states defining who is authorized to teach CS, researchers can investigate how credentialed teachers are distributed across schools. In this study, we considered differences in terms of locale type. 1. Does teacher capacity vary across schools based on locale type (e.g., city and suburb)?
Research has shown that access varies across school type (Code.org, CSTA, & ECEP Alliance, 2020), and exploring potential causes of these disparities by examining teacher capacity can help us understand empirically the relationship between teacher capacity and access. Thus, we asked a second research question to explore the relationship between the requirement for teacher certification and access to CS in schools. 2. Are schools that are not required to employ certified CS teachers more likely to offer CS courses?
Data sources and analysis
To answer these questions, we examined data from all Texas high schools and students for the 2018-19 school year. For over two decades, the state of Texas has had a CS teacher certification requirement for public school teachers. In order to teach courses like Computer Science I, Computer Science II, or AP CS A, teachers in Texas public schools must have earned a Grades 8-12 CS Certification. For the vast majority of certified CS teachers in Texas, the pathway to earning this certification has involved in-service teachers passing a rigorous certification exam to add the licensure to their existing credentials (Texas Advanced Computing Center, 2020). Data were obtained through the Texas Education Research Center, a repository for all public education data collected by the state. In the 2018-19 school year, there were 2084 high schools in Texas serving over 1.5 million high school students.
As shown in Figure 2, there is a clear distinction between the city/suburban areas and town/rural areas in terms of the percent of schools that employed a CS-certified teacher. A chi-square test for independence confirmed the statistical significance of this difference (χ2 = 145.61, p < 0.001). For non-charter public schools, 43% of the 476 schools categorized as “city” and 52% of the 333 “suburban” schools employed a CS-certified teacher. In comparison, only 22% of the 266 “town” schools and 18% of the 673 “rural” schools employed a CS-certified teacher. These data appear to align with prior research that indicates that rural schools are less likely to offer access to CS courses, both in Texas (Texas Advanced Computing Center, 2020) and nationally (Code.org, 2018). In other words, there seems to be a clear relationship between the types of schools that employ a certified CS teacher and their likelihood of actually offering a CS course. Percent of texas high schools with and without a CS-certified Teacher (2018–19).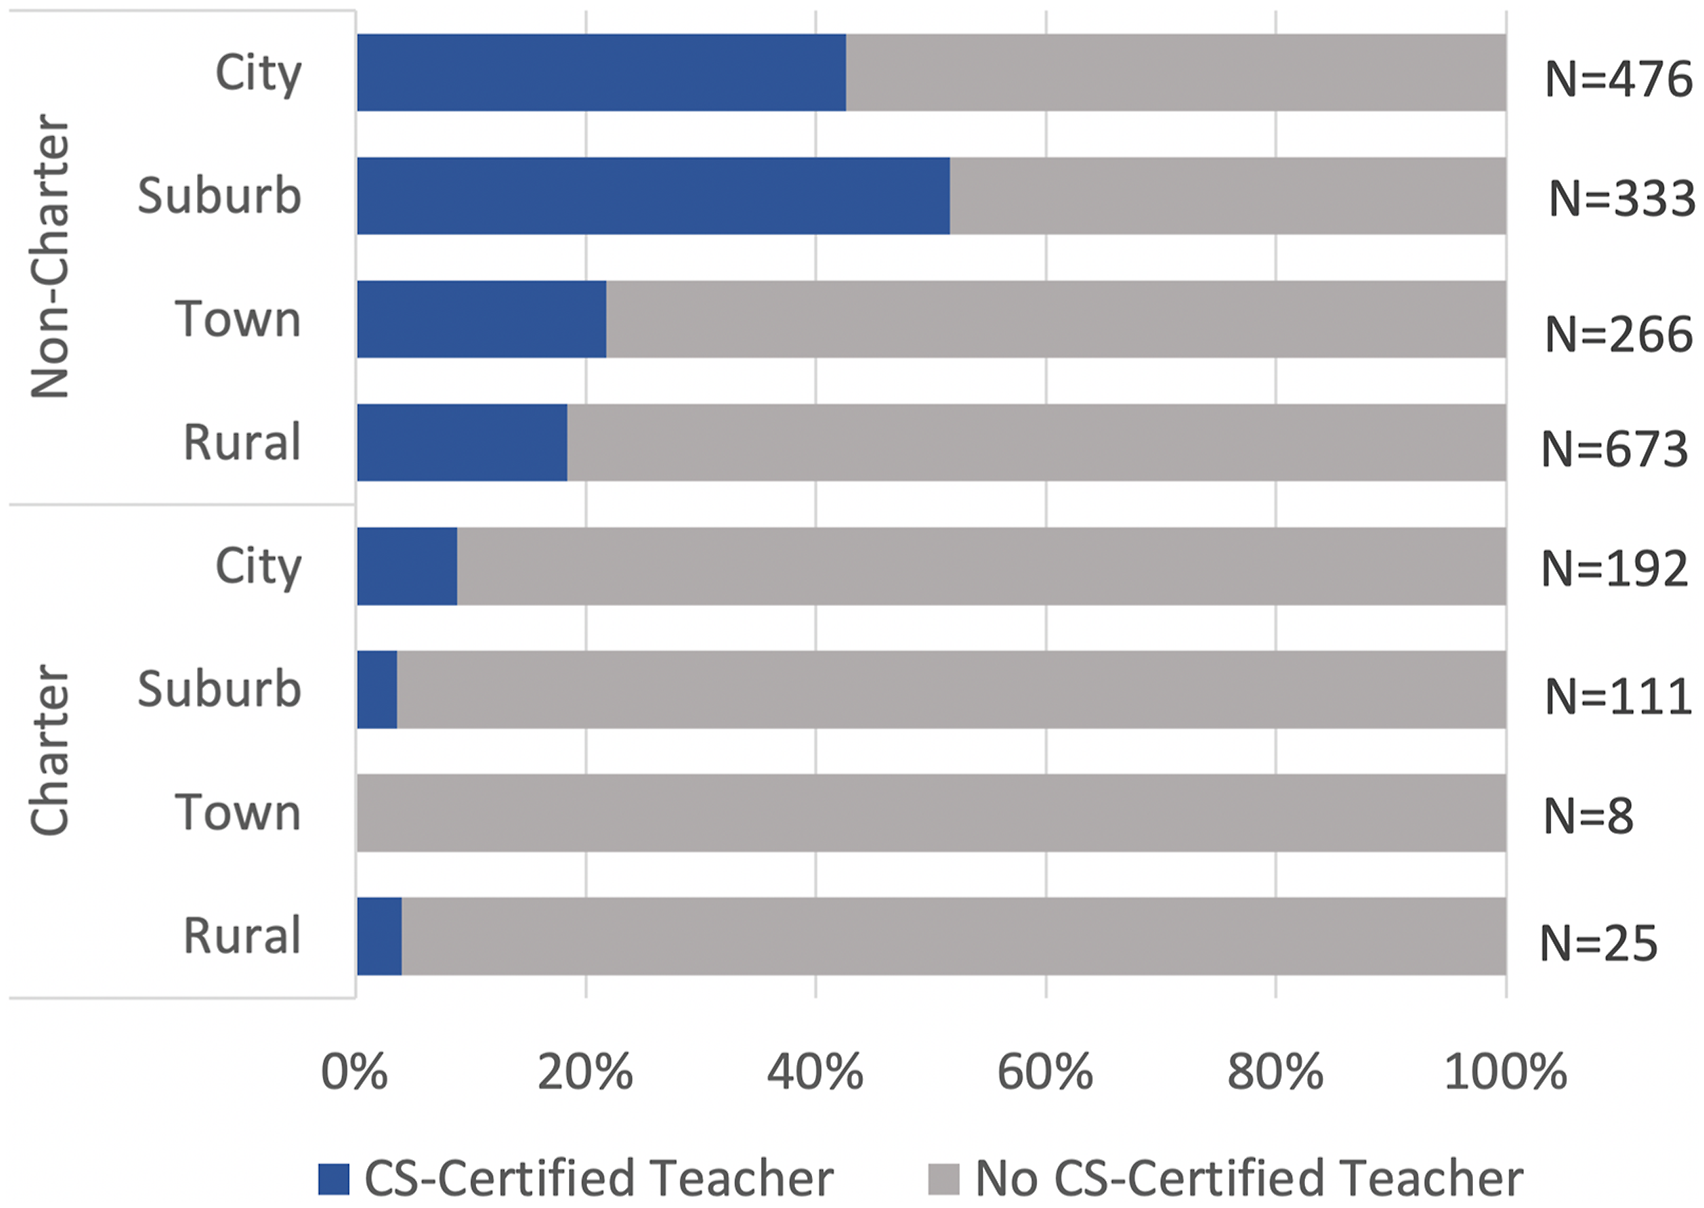
What is most interesting to note from a policy perspective, however, is that teacher capacity differs between charter and non-charter schools (χ2 = 90.03, p < 0.001). In Texas, charter schools are not required to employ certified teachers in most subjects, including CS. The logic behind this policy is that charter schools would serve as laboratories for innovation and that freeing them from state regulatory requirements would promote greater innovation. Our second research question is meant to test this logic. If the lack of a requirement for teachers to hold a CS certification provides charter schools with greater freedom, we would expect that charter schools would offer CS courses at greater rates than non-charter schools.
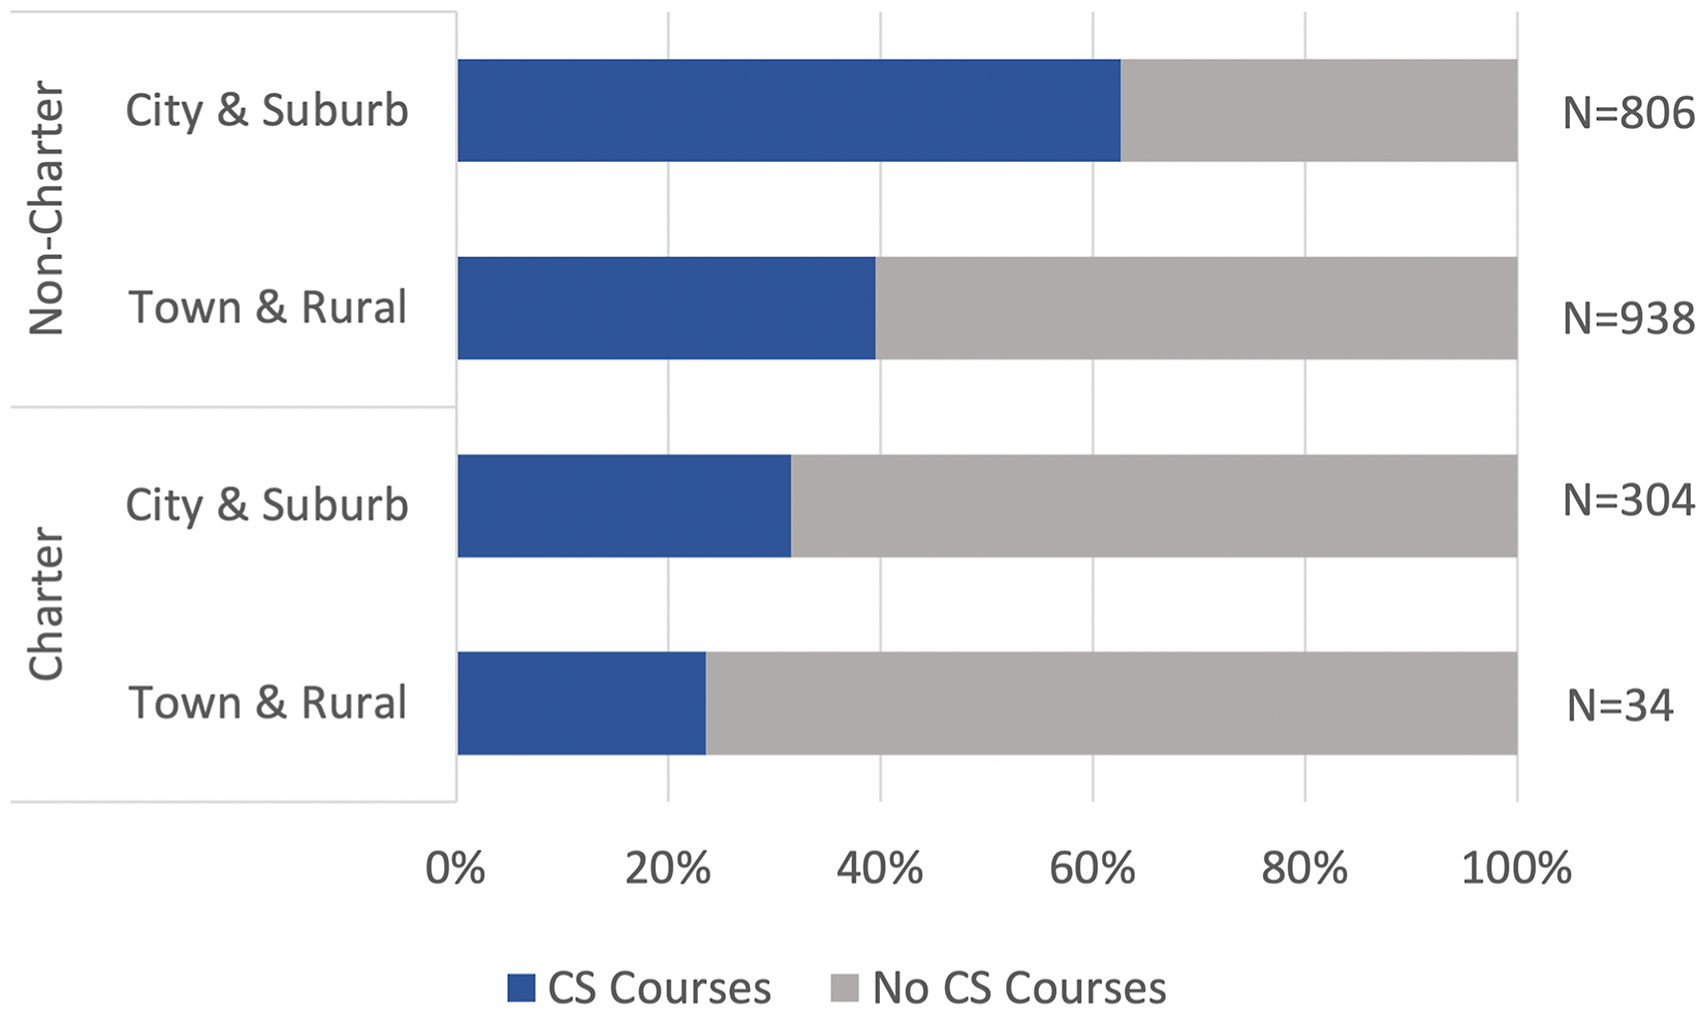
Because the vast majority of charter schools (91%) are in urban or suburban locales (Figure 3), we have simplified the comparison between charter and non-charter schools by combining locale types (i.e., city with suburban and town with rural) in Figure 4. Contrary to what might be expected, charter schools are less likely to offer CS than non-charter schools (χ2 = 43.04, p < 0.001). For non-charter schools, 63% of city-suburban and 40% of town-rural schools offered CS courses. Meanwhile, only 32% of city-suburban charter schools and 24% of town-rural charter schools offered CS courses. Charter high schools in texas (2018–19). Percent of texas high schools that do and do not offer CS courses (2018–19).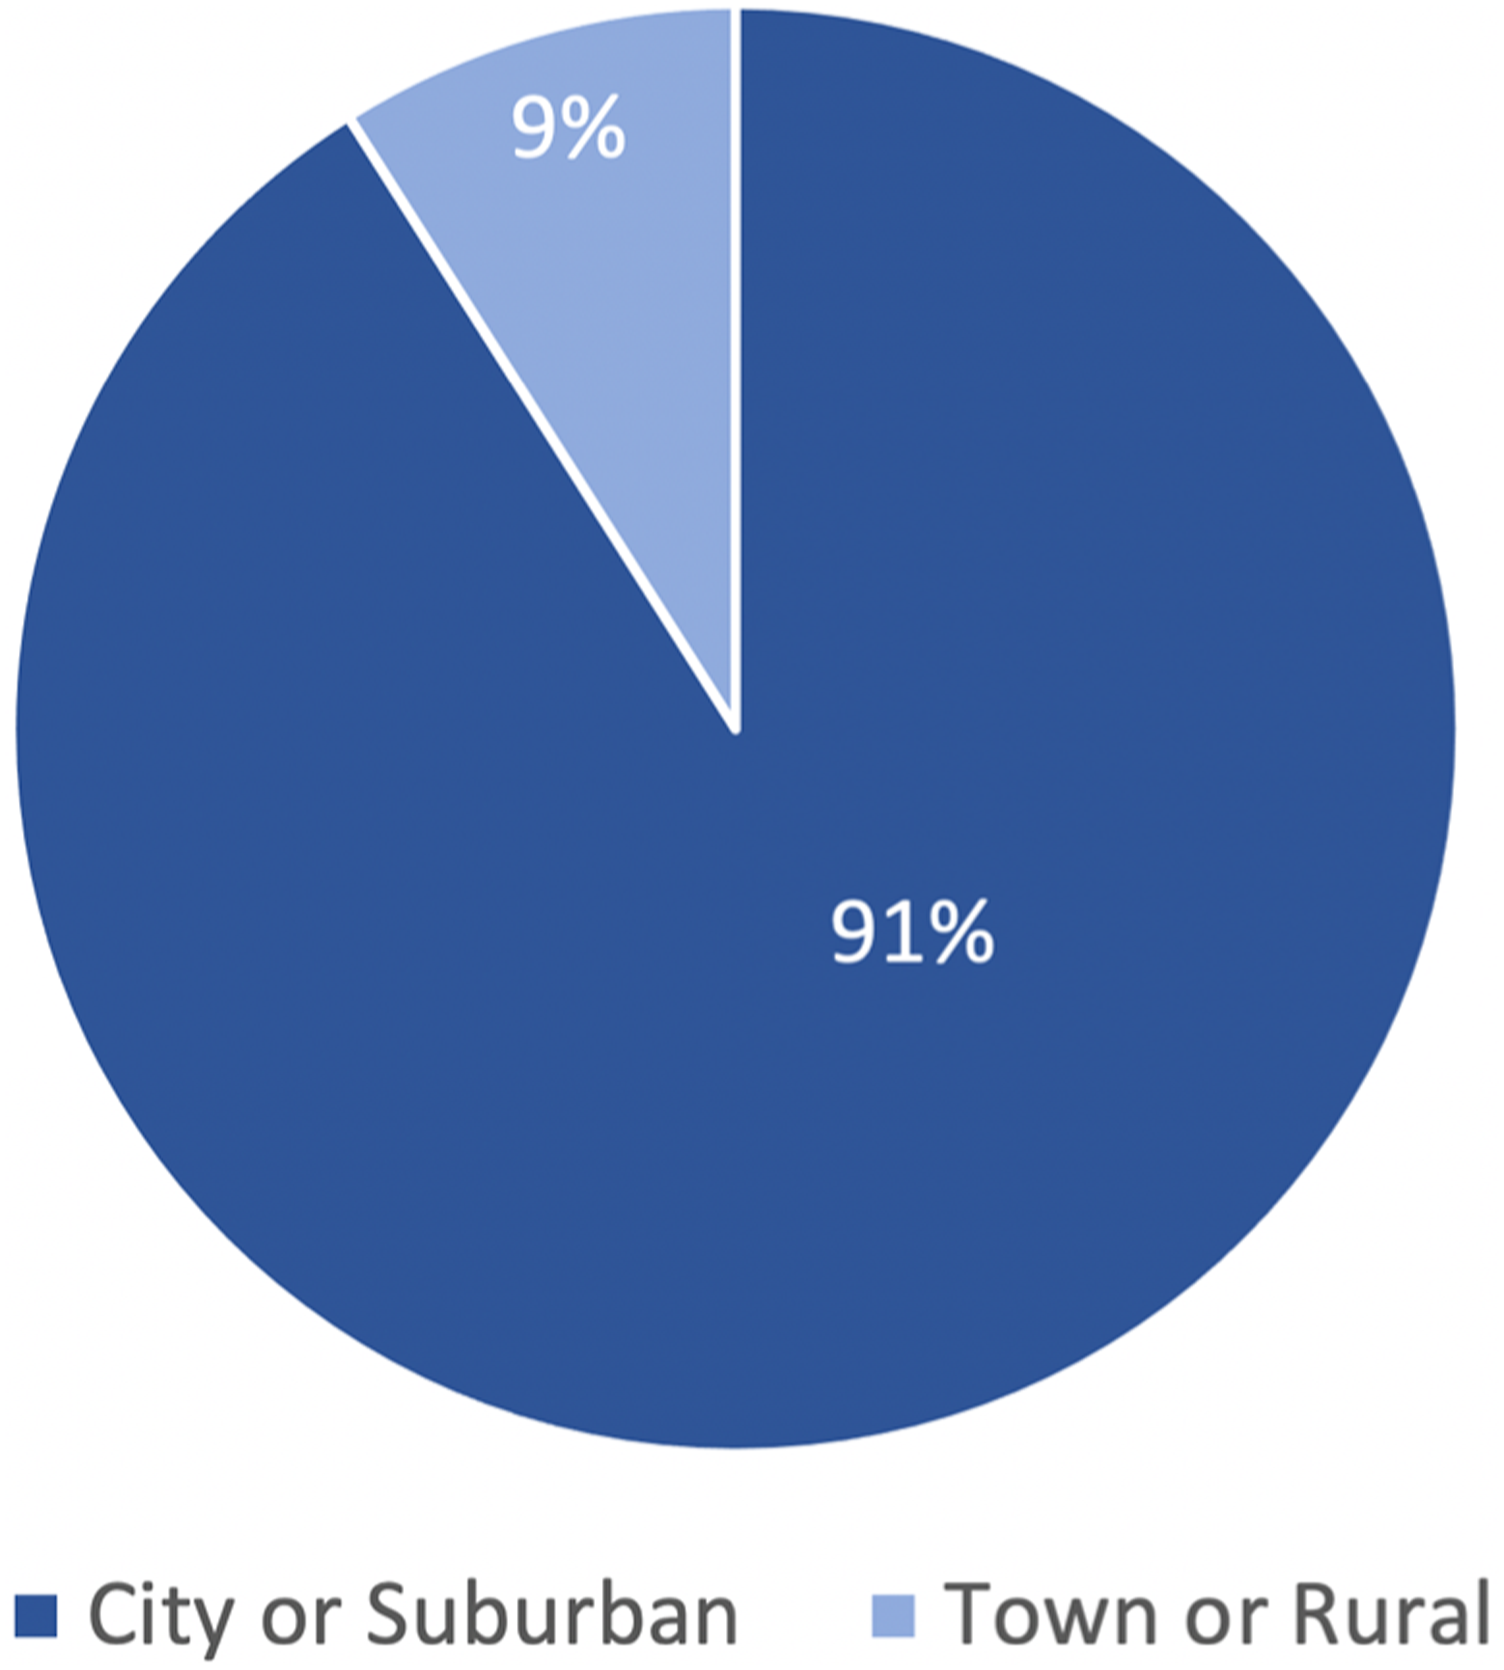
Policy implications
The disparities in teacher capacity between rural and non-rural schools suggest that rural communities may need additional support to grow their teacher capacity in CS. Policies related to funding for teacher professional development should explicitly address the needs of rural educators, for example, by including virtual or online options for CS teacher training that are more accessible to rural communities.
Unlike other core subject areas such as math and science, or even electives such as music or art, many states have only recently begun defining pathways and criteria for secondary CS certification. In 2015, only 51 college graduates across the nation received an initial certification in CS according to the U.S. Department of Education Title II Report (U.S. Department of Education, 2016). In 2017, only 28 states had some kind of CS teacher certification or endorsement process. This number increased to 40 states by 2020 (Code.org, CSTA, & ECEP Alliance, 2020).
One of the reasons states have not established formal CS teacher certification or credentials may be the concern that more barriers to teaching CS would reduce the number of teachers able to teach CS courses, thus reducing access for students. For example, in 2017, Michigan phased out its rigorous pathway to CS certification because, according to the Michigan Education Agency, subjects like CS were “hard to fill or do not attract enough teaching candidates” (Michigan Education Agency, 2017; 4th paragraph). As such, Michigan now allows any certified teacher who “displays strong computer science skills” to teach CS. Other states, such as Nebraska, which has no formal CS teacher certification, authorize teachers who are certified in mathematics or business to teach CS. Each state works to balance the quality assurance that a formal certification process provides with regulatory flexibility to avoid putting in place too many barriers to teacher certification that could result in limiting student access to CS.
However, our findings suggest that such an approach may not produce the intended results. Reducing the barriers to teaching CS by eliminating the requirement that courses be taught by certified CS teachers has not resulted in increased access to CS courses for students in Texas. In fact, because charter schools are likely to serve a larger percentage of Black students, Hispanic/Latino students, and students from economically disadvantaged backgrounds than their non-charter counterparts (Texas Charter Schools Association, 2016), it is possible that these student populations have been negatively impacted by the fact that some may take it for granted that deregulation fosters innovation. However, further research is needed to determine whether the relationship identified here is a causal one.
Access to CS education
Prior research has underscored the disparities that exist between subgroups of students in terms of who has the opportunity to take CS courses. As noted earlier, inequitable access to CS education has been reported for various subpopulations of students, including Black and Hispanic/Latino students, students from low socioeconomic backgrounds, and students living in rural areas.
Research question
In addition to examining which students have access to CS courses in general, data on course offerings can be analyzed to identify disparities in terms of the number and type of CS courses to which students have access. Prior research suggests that such disparities exist. Margolis et al. (2008) examined disparities in terms of the types of schools that offered AP CS and computer literacy courses in California. They found that schools with low levels of poverty were about three times more likely than high-poverty schools to offer AP CS but less likely than high-poverty schools to offer a computer literacy course. As CS education continues to expand into more and more schools, examining issues regarding the quantity and quality of courses to which students have access is becoming increasingly important. In addition to identifying disparities in terms of the quality of courses offered, it may also be helpful to investigate issues of equity in terms of the number of courses offered. Thus, we asked the following question. 1. What is the relationship between the number of CS courses that schools offer and the proportion of students who are economically disadvantaged?
Data sources and analysis
To answer this question, we examined data from four states: Connecticut, Massachusetts, Rhode Island, and Vermont. These data were collected as part of the New England Common Metrics Project (Dunton et al., n.d.). In that project, teams from each state provided data through the state departments of education for every public high school in the state, including school-level demographic numbers and information on the number of CS courses offered by each school. In Figure 5, we present data for each state, showing the relationship between the percentage of students who were economically disadvantaged and the number of CS courses offered at each high school in the state. (Each dot in the plots below represents a different high school.) School percentages of students who are economically disadvantaged and the number of CS courses offered at the school.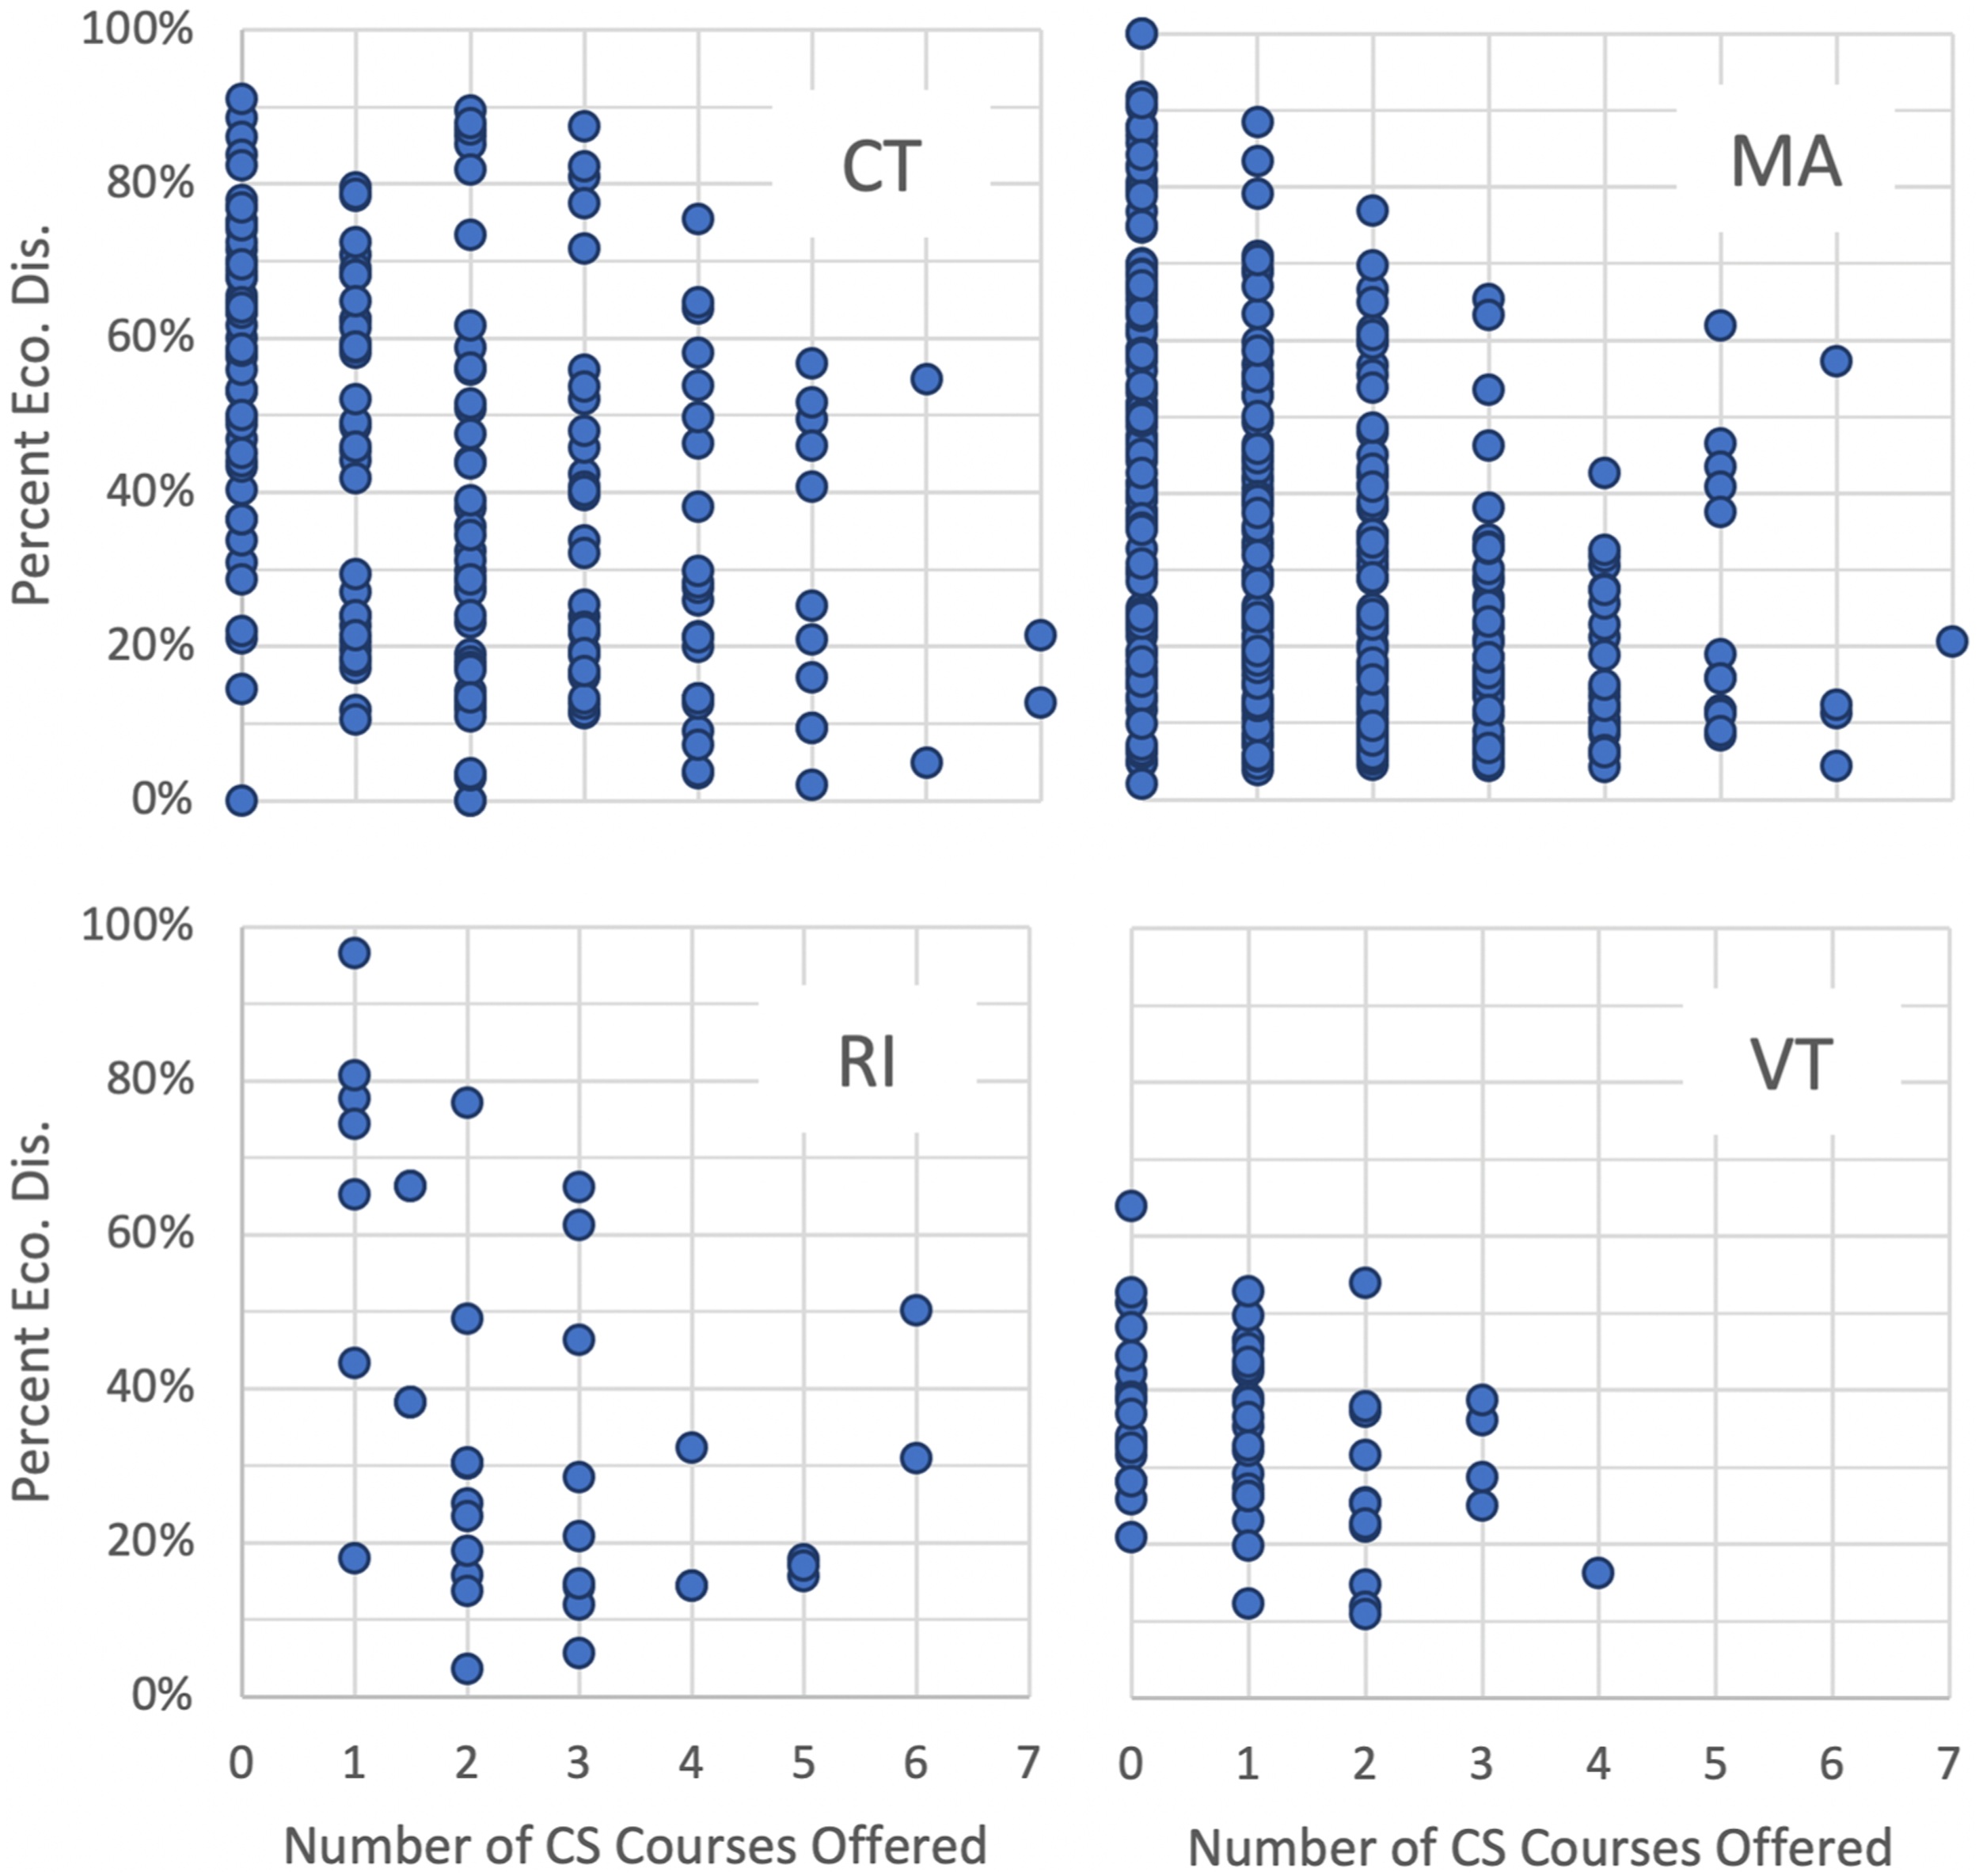
Pearson’s r correlations between these variables for each state and overall confirmed what seemed apparent in the charts: there is a clear negative relationship between the percentage of students who were economically disadvantaged and the number of CS courses schools offered. The overall correlation was r = −0.37 (p < 0.001), and state-level correlations ranged from r = −0.35 to −0.43 (p < 0.01).
Policy implications
These data reveal a striking disparity that appears to be consistent across at least some states, as schools with lower proportions of economically disadvantaged students tended to offer more CS courses than schools with higher proportions of economically disadvantaged students. This finding, which underscores one institutional barrier faced by students from low-income backgrounds, signals a few important implications for educational policy. First, it suggests that policies requiring schools to offer at least one CS course may still fall far short of eliminating the access gap between students from different socioeconomic backgrounds. Even when all schools offer CS courses in general (as is the case in Rhode Island, for example), disparities may still exist in terms of the number, diversity, and rigor of CS courses that are available to students. Policies should go beyond a simple requirement to offer “some CS,” and instead further define the number and type of CS courses that should be offered.
Second, these disparities may also have repercussions for students’ postsecondary access to CS. Given that students from low-socioeconomic backgrounds tend to have access to fewer CS courses in high school, universities that use prior course-taking experience as criteria for admission to CS majors may be more likely to disproportionately exclude economically disadvantaged students. But even in the absence of such requirements, this disparity in access at the high school level has the potential to foster and perpetuate knowledge and ability gaps (real or perceived) between low-income undergraduate students and their peers due to the simple fact that, in general, affluent students have more opportunities to take CS courses in high school. Thus, a third implication for policy here is that the realization of positive outcomes resulting from policies aimed at narrowing and eliminating gaps in access to K-12 CS education has the potential to reverberate into postsecondary contexts.
Participation in CS education
As described above, researchers have consistently found disparities in terms of who participates in CS, with CS course and exam enrollment rates tending to be lower for students who are female, economically disadvantaged, or racially minoritized.
Research question
As previously discussed, it is important to limit the examination of equitable participation in CS education to students who have access to CS education. Teasing apart access to and participation in CS provides a more comprehensive picture of the educational system and can enable targeted policy changes. Here, we considered differences in CS participation among students from different demographic backgrounds who attend high schools that offer one or more CS courses. 1. What, if any, differences exist in participation rates in terms of students’ gender and race/ethnicity?
Data sources and analysis
To answer these questions, we use data from the 167 grades 9–12 high schools in Indiana that offered CS courses in 2018-19. These data were provided by the Indiana Department of Education, and they are disaggregated by gender and race/ethnicity. Forty-nine percent were female. Figure 6 shows the number of students by race/ethnicity across high schools. Only a small proportion of the 212,118 students were American Indian (n = 459) or Native Hawaiian or Other Pacific Islander (n = 115). Number of Indiana high school students attending schools that offer CS by race/ethnicity (2018–19).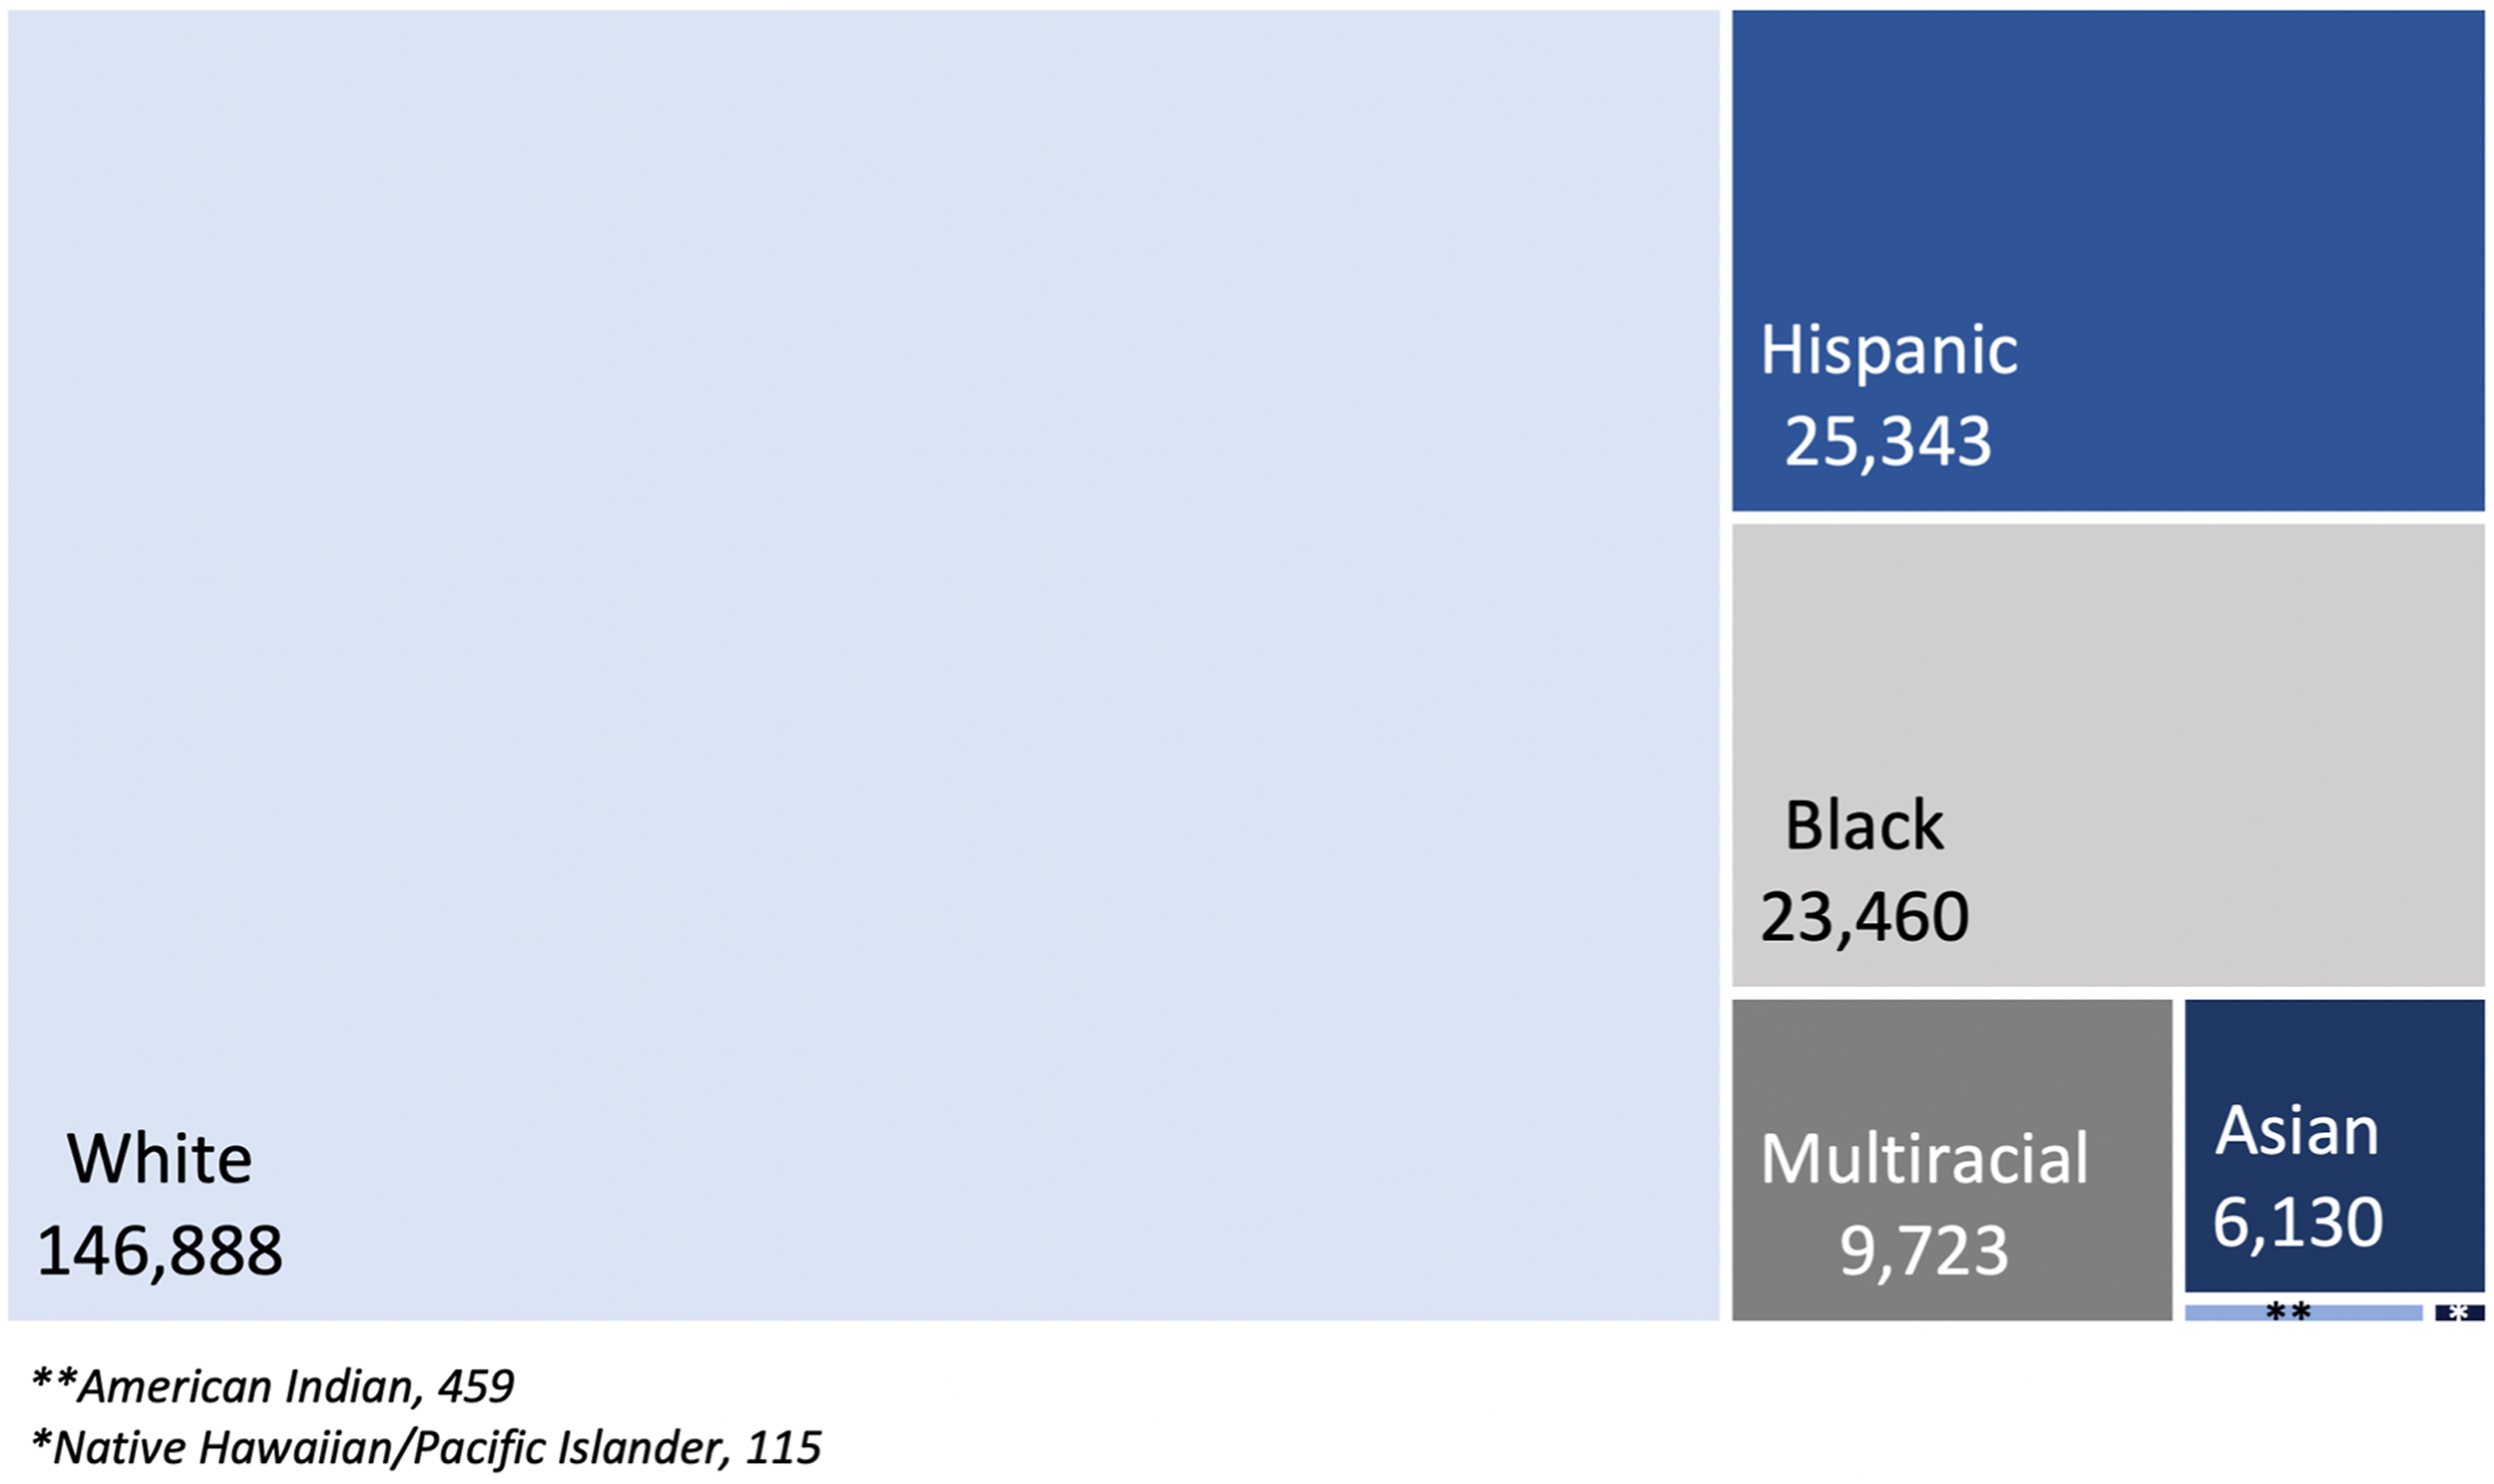
Figure 7 shows the CS participation rates of students by gender and race/ethnicity. The participation rate for each subpopulation was calculated by dividing the number of students in that subpopulation who took CS by the number of students in that subpopulation who attended high schools that offered CS. For example, the participation rate for Hispanic/Latino students (4.10%) is the number of Hispanic/Latino students who took CS courses (n = 1,038) divided by the number of Hispanic/Latino students who attended high schools that offered CS (n = 25,343). Comparing the participation rates across subgroups allows us to determine whether the demographic makeup of CS classes matches the demographic makeup of the schools’ populations. CS participation rates by gender and race/ethnicity.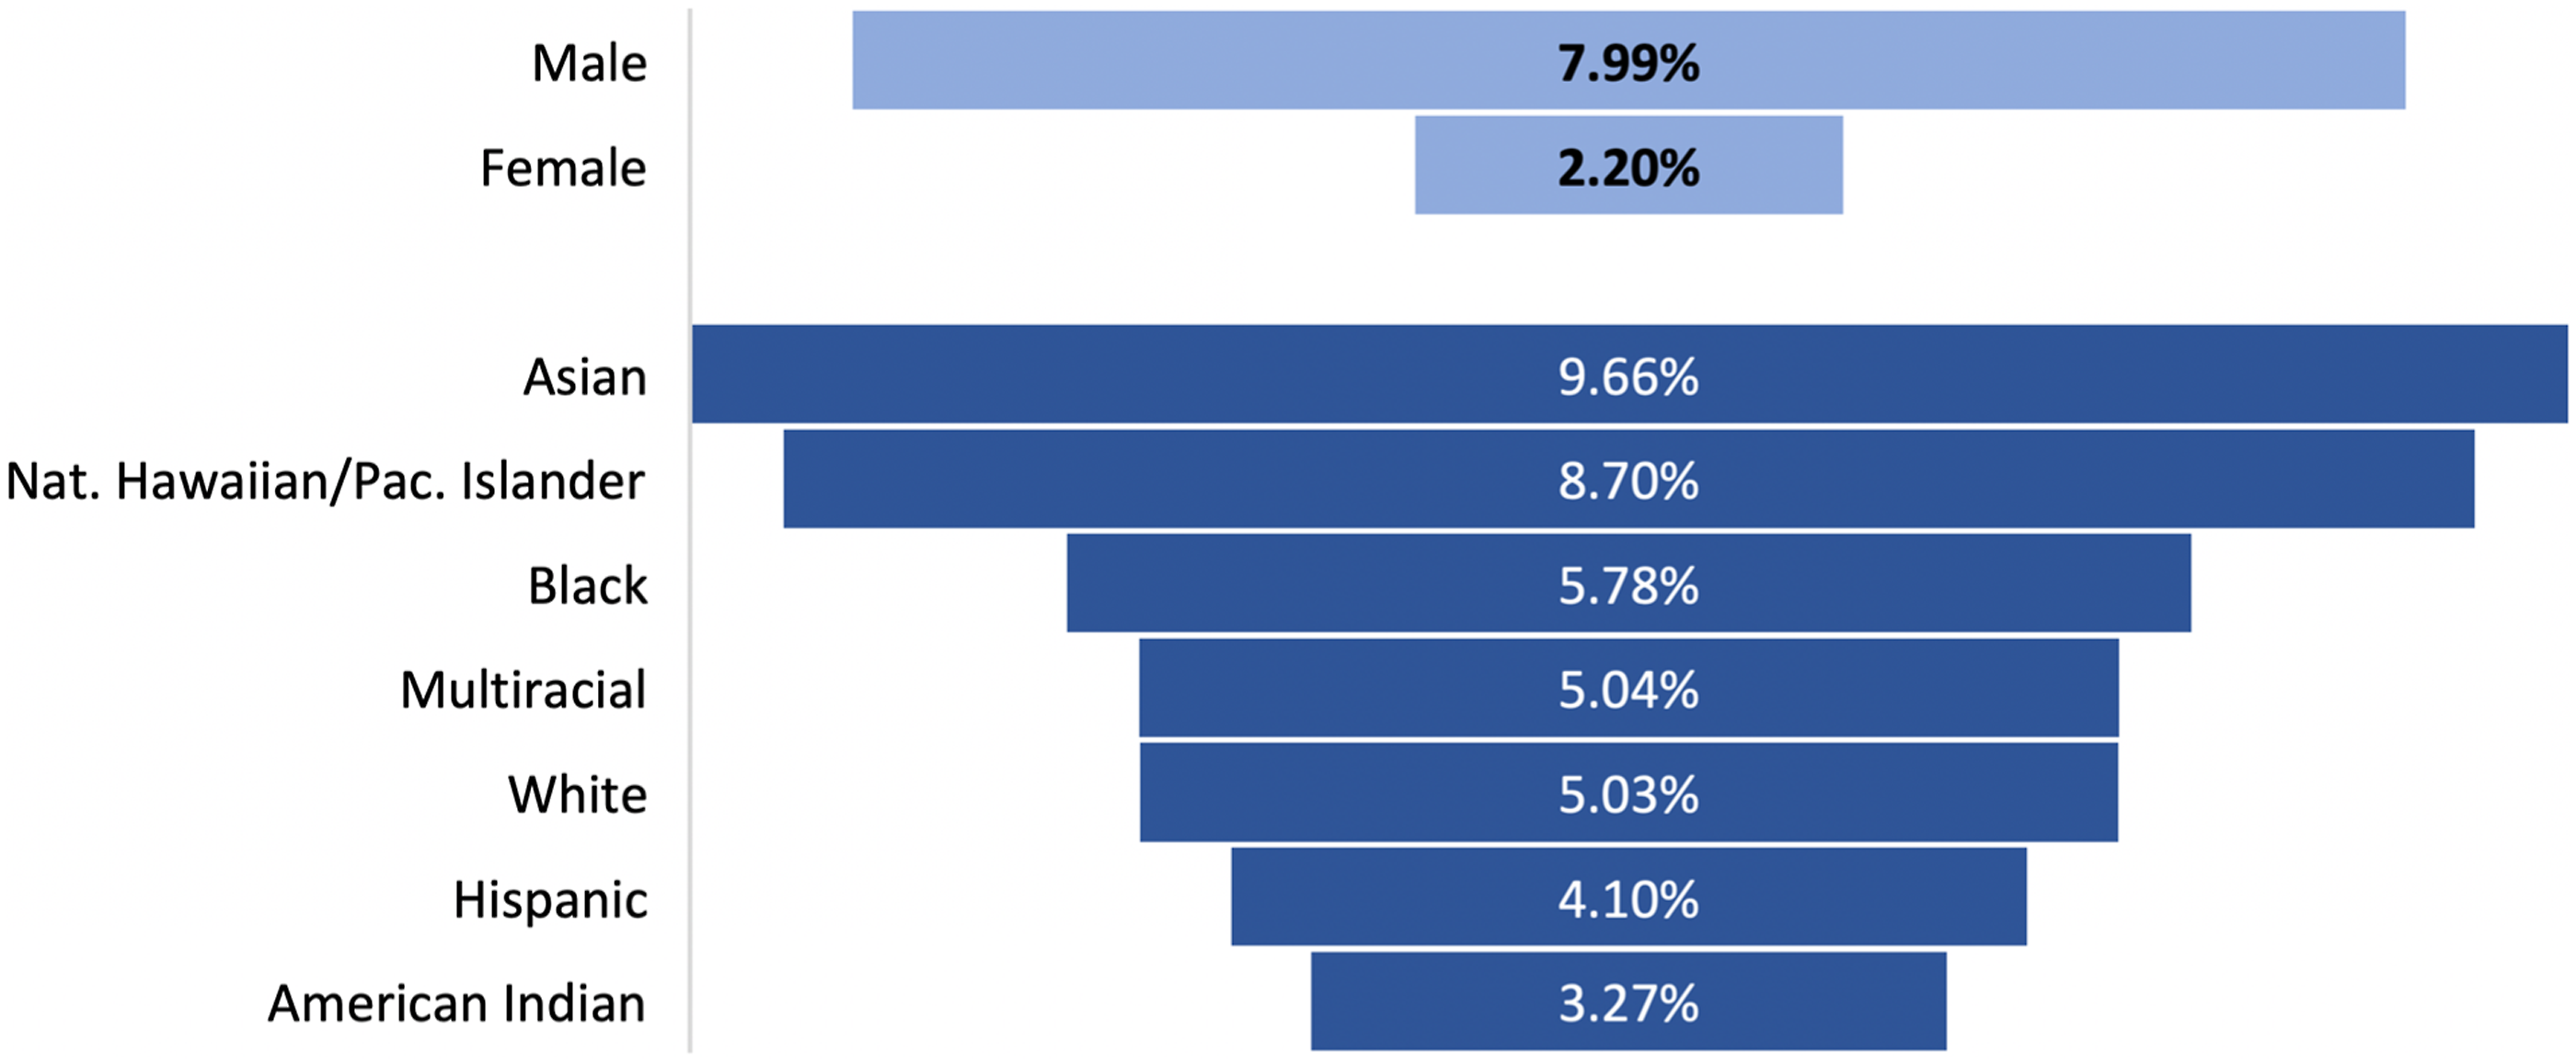
The magnitude of disparities between groups can be assessed by computing the disparity index (Warner et al., 2021). The index is calculated as the ratio of two groups’ participation rates. For example, the ratio of Asian participation (9.66%) to Hispanic/Latino participation (4.10%) is 2.36, indicating Asian students were 2.36 times more likely than Hispanic/Latino students to participate in CS. The disparity among genders is even greater, with males being 3.63 times more likely to participate in CS when it was offered.
We investigated this gender disparity in participation further by considering the types of CS courses taken. Figure 8 shows the enrollment distribution of males and females in CS courses. When we group CS courses by entry-level (Intro to CS, AP CS Principles, and CS I) and advanced (AP CS A, CS II, CS II: Special Topics, CS III: Databases, CS III: Informatics), we see that the distribution of male and female students is similar for both types of courses. This suggests that, although female participation was low, their rate of participation once enrolled in CS remained relatively stable. Number and percentages of male and female CS course enrollees by course type.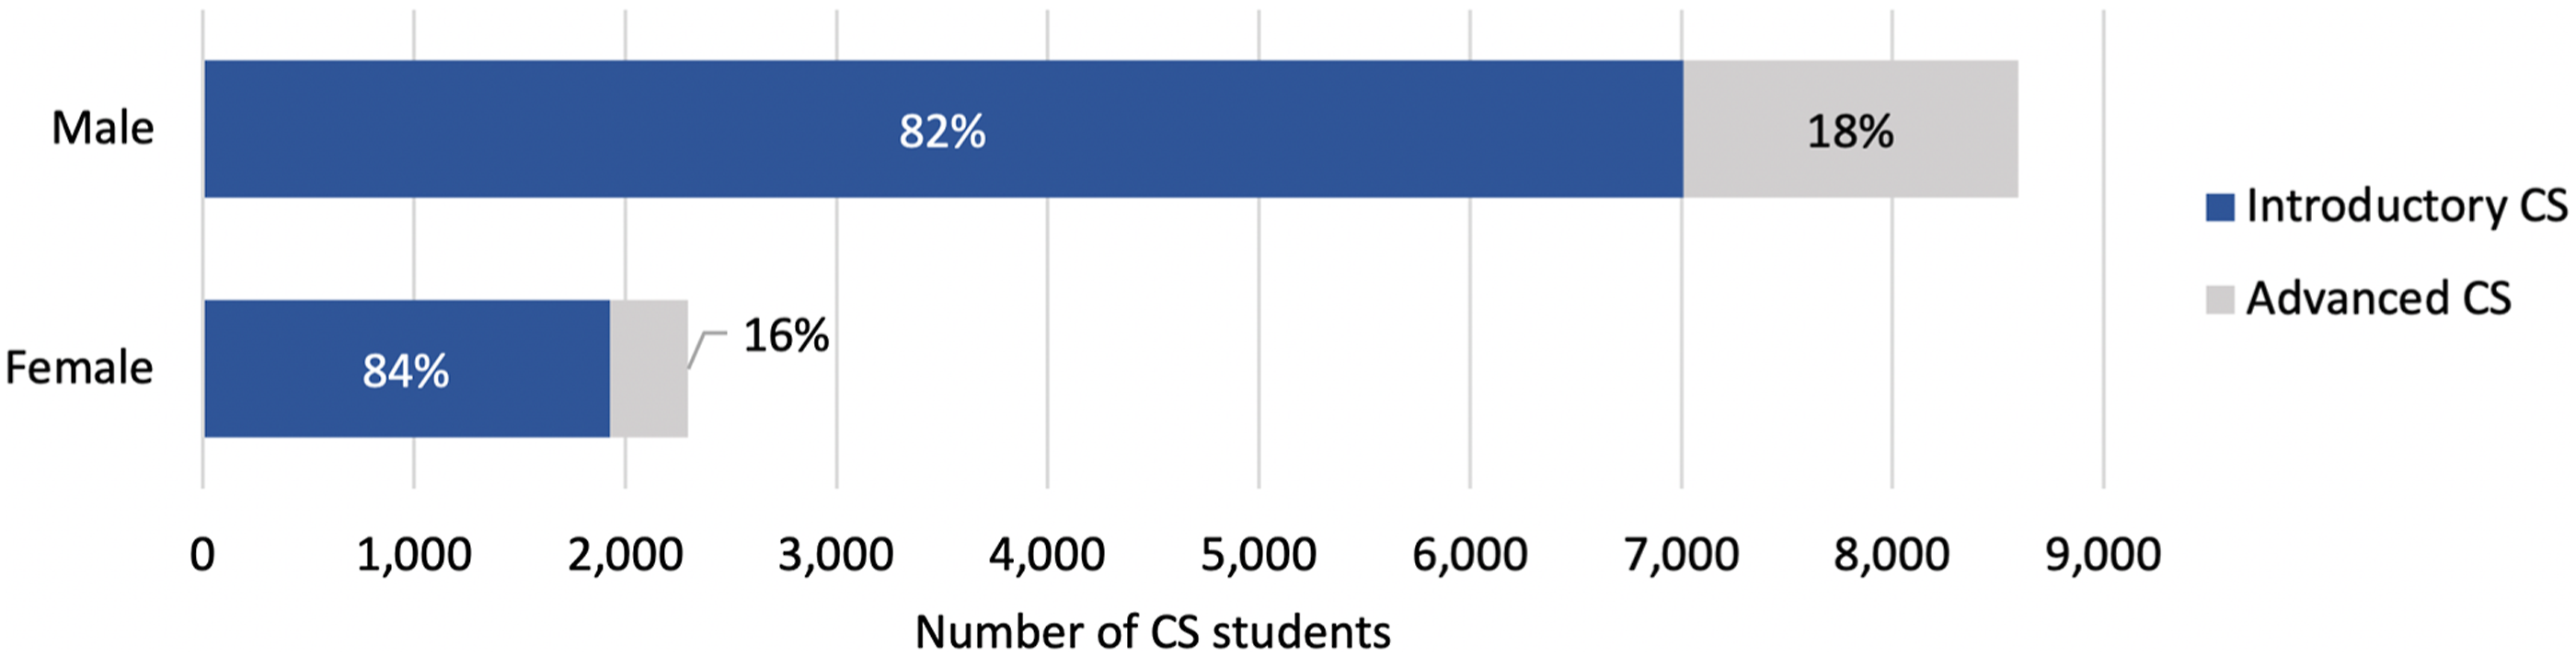
Policy implications
The 2020 State of Computer Science Education report (Code.org, CSTA, & ECEP Alliance, 2020) showed that 72% of Indiana high schools offered CS. Only eight other states offer greater access to high school CS education than Indiana. The large majority of Indiana students have the opportunity to participate, but there are disparities in participation among race/ethnicity groups and between genders. The larger disparities are among genders, with females participating at much lower rates than their male peers. However, when females do participate, they appear to continue in CS at similar rates as males. Given these findings, it is clear policymakers aiming to reduce disparities must focus their attention on creating policies that promote female enrollment in CS courses when they are offered. Simply put, recruitment is key. Policy changes could include those which dictate what type of recruitment occurs and how recruitment is undertaken. For example, diversity recruitment training could be made a requisite part of teacher professional development. Rather than looking at disparities in participation and concluding that female students are not as interested in taking CS courses as their male peers, it is important to consider how policies and practices may be hindering female enrollment.
These findings also have policy implications at the postsecondary level. As noted in the section on access, underrepresentation in high school CS education can negatively impact representation in postsecondary CS education, as high school CS course taking is typically considered in college CS major admissions. Institutions of higher education have the power to change their admissions policies and improve participation at the postsecondary level by focusing on recruitment of females and providing equitable CS education experiences.
Experience of CS education
As discussed earlier, one commonly used metric for assessing equitable learning experiences in CS is AP CS exam scores disaggregated by subpopulations of students. This measure alone does not provide a comprehensive assessment of student experience, but it is a good starting place, as AP exam scores are widely available and comparable across all U.S. states. We use the metric here as one example of many ways that students’ experiences can and should be assessed.
Research question
Whether a student who is enrolled in an AP CS course chooses to take the AP exam for that course may be an additional insightful measure of students’ experiences in CS courses. In this section, we explore differences between subgroups of students with respect to the percentages of students enrolled in AP CS A and AP CS Principles (AP CS P) who take an AP CS exam and how those students perform on the exam. 1. What, if any, differences exist between subgroups of students based on race/ethnicity with respect to the percentage of AP CS course enrollees who take and pass the AP exam?
Data sources and analysis
To answer this question, we used 2018–19 AP CS exam data for Texas from the College Board and 2018–19 course enrollment data from the Texas Education Research Center (ERC). The College Board data are publicly available and include the number of students who took the AP exams and the number of students who received each score on a scale of 1–5, by state and race/ethnicity. As mentioned previously, the Texas ERC data are secured, student- and school-level data for all public schools in Texas. From this source we obtained the number of students enrolled in AP CS A and AP CS P, disaggregated by race/ethnicity.
From the College Board data alone, one can calculate the percentage of AP exam takers who scored a three or above on the exam (i.e., a passing score). This is the calculation for AP exam passing rates typically used to document differential student performance. Replicating findings mentioned previously in this paper, Figure 9 shows that a larger percentage of Asian and White students scored a three or above on both the AP CS A and AP CS P exams compared to their Hispanic/Latino and Black peers. These data highlight important inequities in students’ learning experiences as captured by their exam performance. CS AP exam passing rates by race/ethnicity.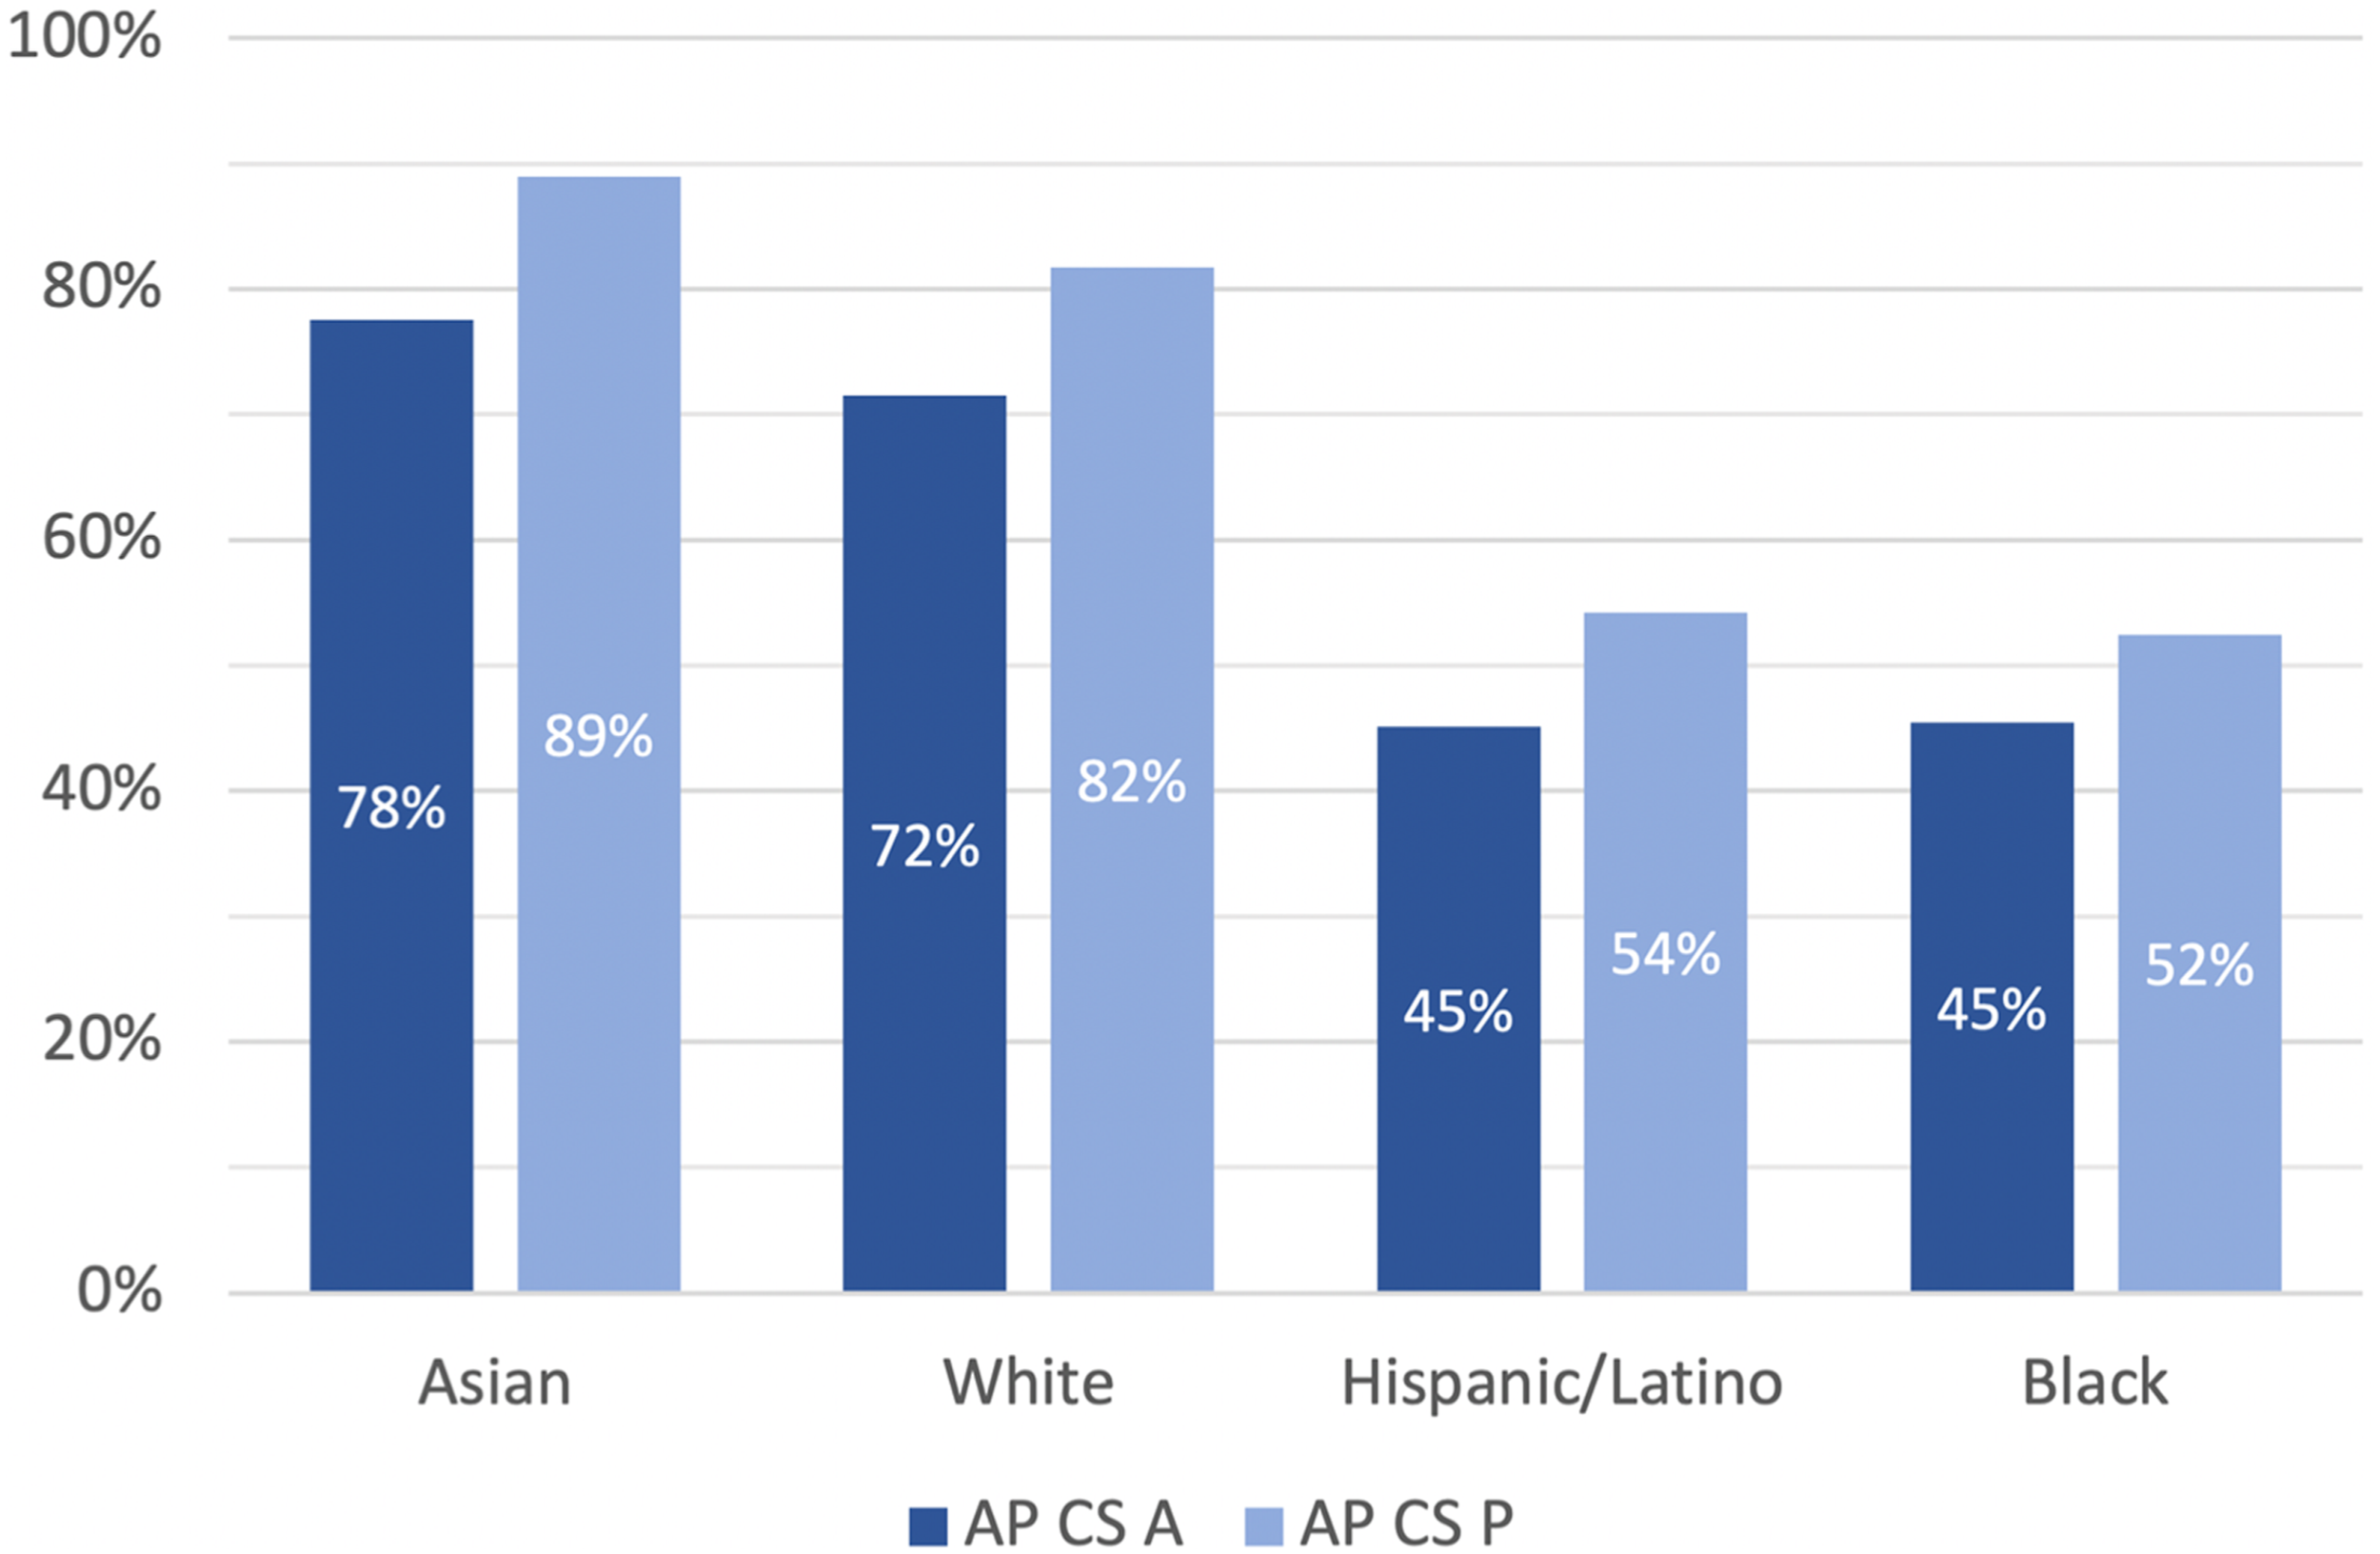
The disparities in passing rates shown in Figure 9 are even more marked when viewed in the context of which course enrollees actually took the AP exam. Using the College Board and Texas ERC data sets together, Figure 10 shows the percentage of students enrolled in each course who (i) did not take the corresponding AP exam, (ii) took the exam and did not pass (scored lower than 3), and (iii) took the exam and passed (scored three or greater). Each full bar (100%) represents all of the students for each subpopulation who were enrolled in AP CS A or AP CS P, with the total numbers of students provided below each bar. Exam-taking and performance by race/ethnicity for students enrolled in AP CS A and AP CS P.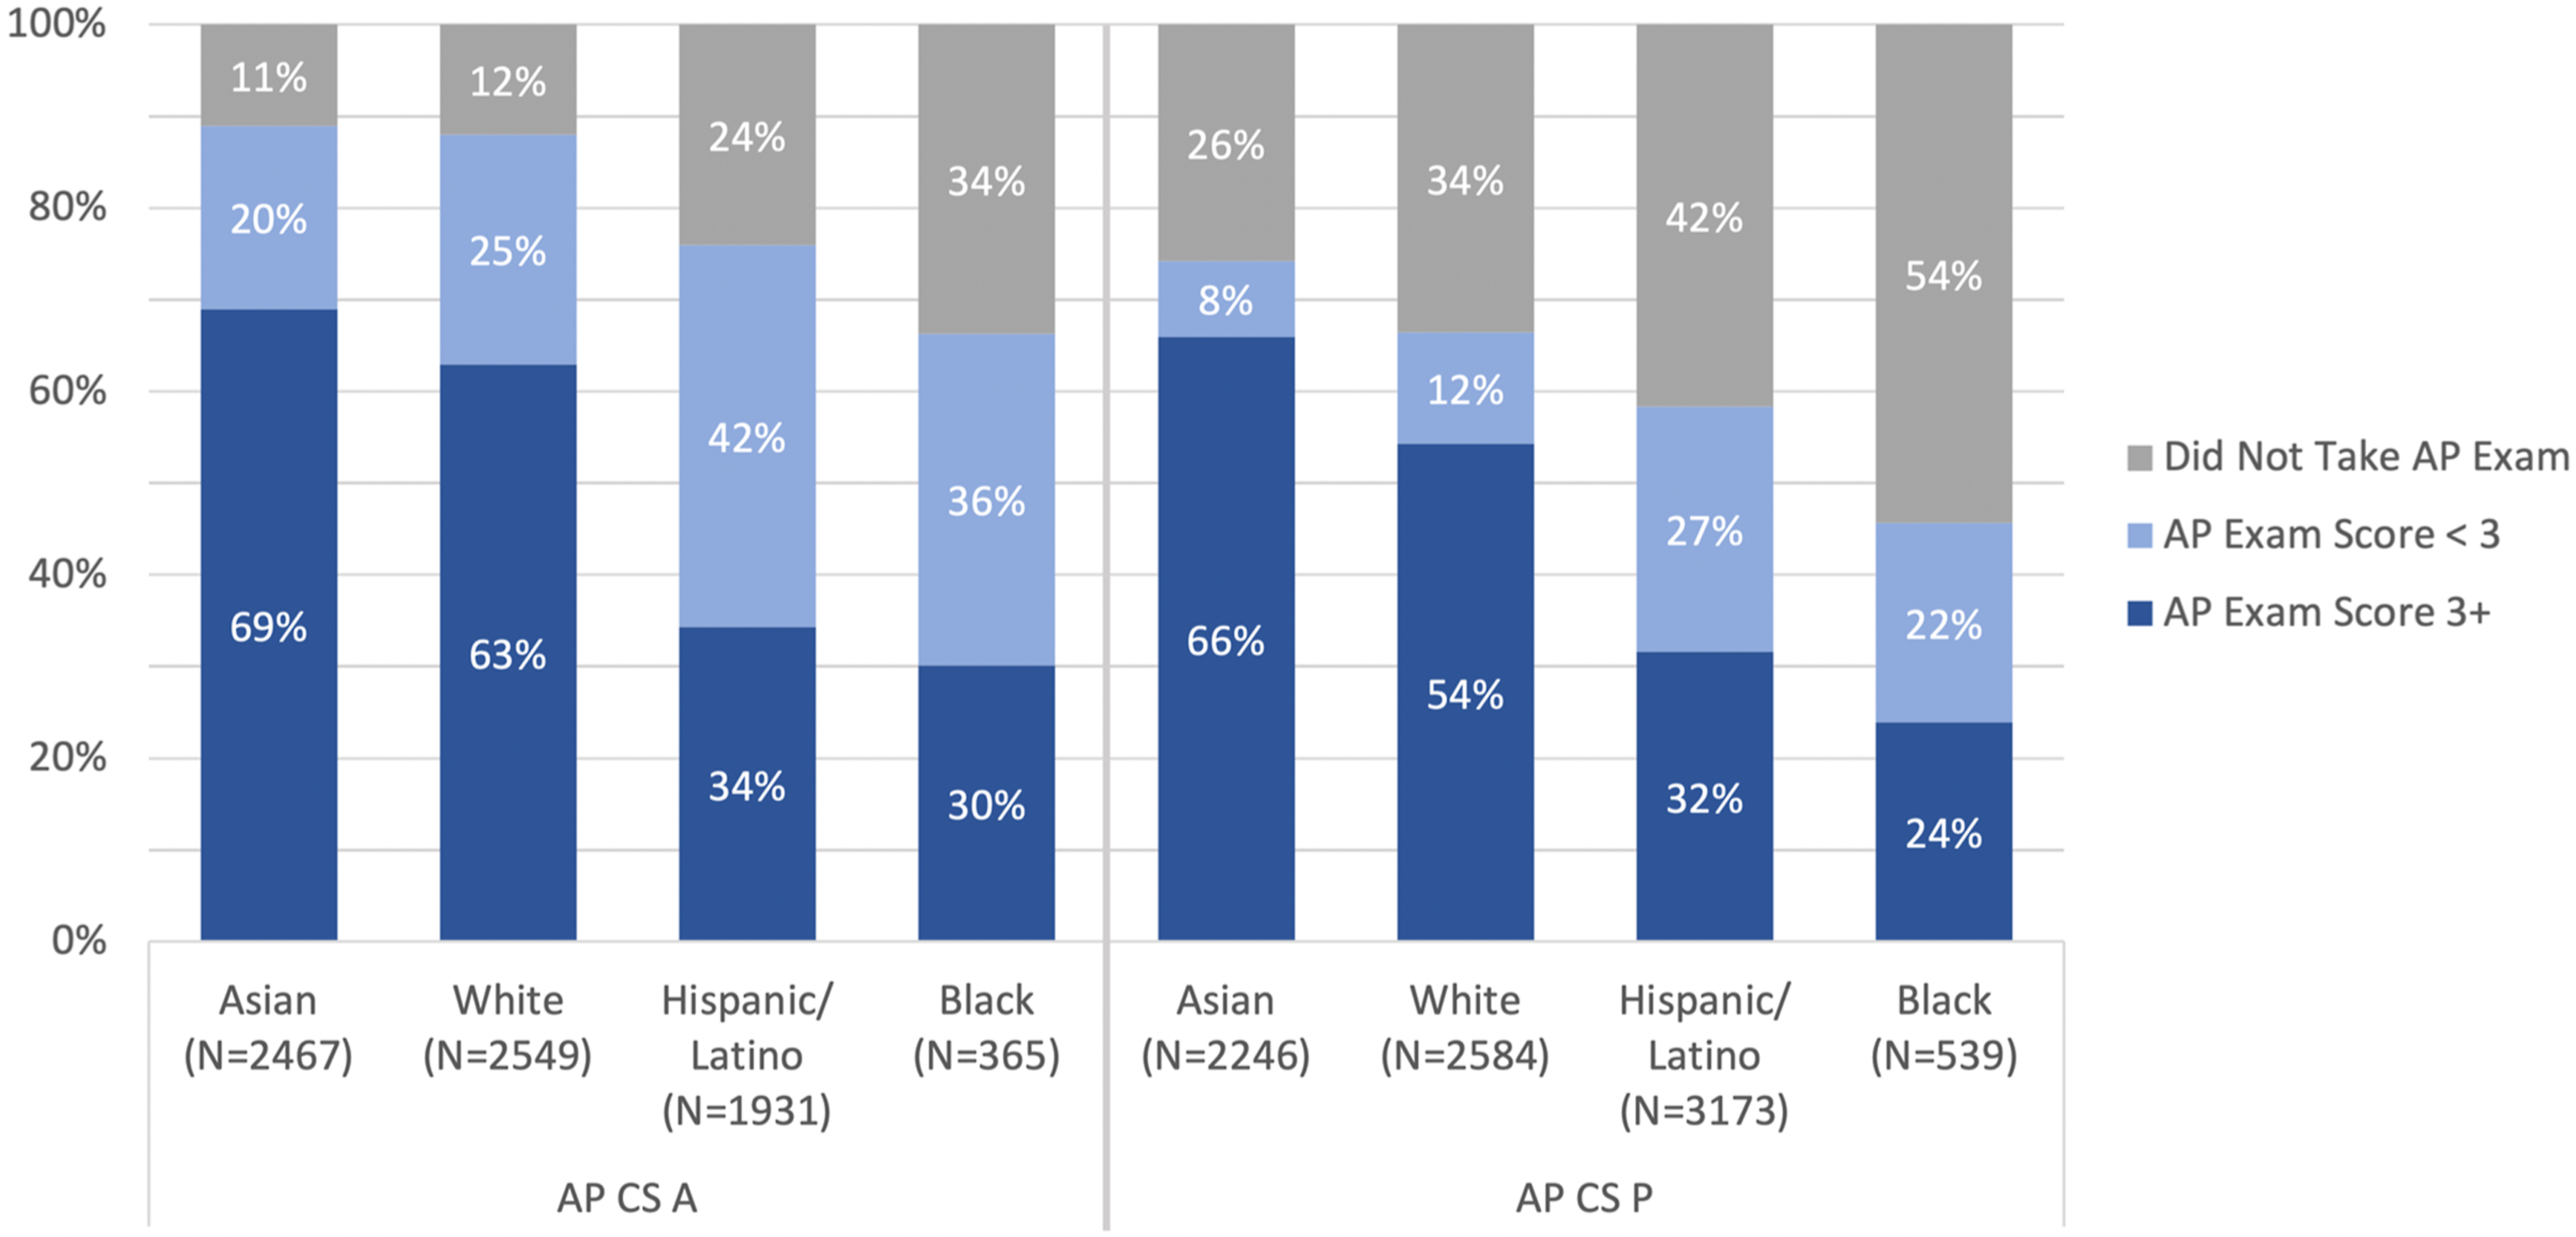
The figures show that Hispanic/Latino and Black students not only scored lower on the AP exam than their Asian and White peers, but they were also less likely to take the exam in the first place. In AP CS A, 34% of Black and 24% of Hispanic/Latino students did not take the AP exam compared to only 11% of Asian and 12% of White students. In AP CS P, almost half of Black (54%) and Hispanic/Latino (42%) students enrolled did not take the AP exam. Further, of all the students in Texas enrolled in AP CS A in 2018-19, only 30% of Black and 34% of Hispanic/Latino students scored a three or above on the exam, and for those enrolled in AP CS P, only 24% of Black and 32% of Hispanic/Latino students scored a three or above on the exam.
Policy implications
These data highlight disparities in AP exam test taking and performance for students from different backgrounds, suggesting additional disadvantage for Black and Hispanic/Latino students in college, as they are less likely to receive credit for AP CS than their peers. Rather than viewing these findings as simply a reflection of student performance, we see them as lagging indicators of students’ experience in CS and education policies that may have unintended consequences that prevent students from taking the exam or does not prepare them well.
Ideally, educational policy would promote positive experiences for diverse students in CS courses. State policy surrounding academic accountability systems, for example, may give schools credit or points for having diverse students enrolled in AP CS or dual credit courses. Such policies may encourage schools to proactively recruit diverse students to enroll in CS courses but do not necessarily incentivize schools to ensure that all students have a positive and rigorous learning experience that prepares them to succeed on the AP exam. Other policies, similar to that of Texas, give schools accountability credit for students who score a three or above on AP exams. Such policies incentivize schools to ensure that all students enrolled in AP courses have high quality experiences that prepare them for the AP exam. However, if a state has policies that penalize schools for students taking but not passing AP exams, some schools may only encourage students they think will be successful to take AP exams or even discourage other students from challenging exams. Although we cannot claim from our data that the current policies in Texas discourage certain students from taking AP CS exams, we recommend that policymakers consider the potential unintended consequences of policies on students’ experiences in CS. Policymakers should also examine the extent to which AP exam subsidy policies for low-income students are effectively addressing the financial barriers of AP exam-taking, as subsidies in some states do not fully cover the exam costs.
Conclusion
The CAPE framework can serve as a guide for assessing equity in CS education because it draws attention to different levels or aspects of educational systems where inequities may exist, highlighting the fact that enacting change in CS education is enacting change within an ecosystem. A more complete version of this conceptual description of the CAPE framework has been given elsewhere (Fletcher and Warner, 2021). In this article, we have demonstrated the application of the CAPE framework using a variety of data sources in order to exhibit the different types of data that can be used to explore issues of equity at each level. In doing so, we aimed to inform research on equity in CS education and highlight some of the many implications that the analysis results have for educational policy.
This paper informs research on equity in CS education by expanding on the types of analyses and metrics typically used to assess equity. We introduced a way to assess equity in capacity for CS education, an area often overlooked in efforts to monitor equity, by examining differences in the number of certified CS teachers in rural/town versus city/suburban schools. The results of this analysis suggest that rural communities may need additional support to grow teacher capacity in CS, that deregulating certification requirements may not result in greater capacity, and that minoritized student populations may be negatively impacted by the lack of capacity in charter schools. Equity in access was assessed not just by looking at disparities in whether schools offered CS but also in terms of the number of courses offered, providing a glimpse at the complexity involved in issues of access. From this analysis of data from four New England states, we noted how policies that only require schools to offer some CS are likely to fall short of ensuring equitable access to CS, as disparities also exist in the number of CS courses available to students.
We examined disparities in participation rates in Indiana by first limiting the population to students attending schools that offer CS and then by looking at participation across all CS courses, not just AP courses. These participation rates confirmed what prior research has shown to be persistent over time: female students are far less likely than male students to enroll in CS courses. The fact that this disparity was not exacerbated for advanced courses signifies that the main issue resides in how females initially are (and are not) recruited into CS courses. Lastly, we analyzed exam-passing rates in conjunction with exam-taking rates for AP CS courses to provide a more complete picture of the disparities in CS learning experiences between students who are Asian or White and students who are Black or Hispanic/Latino. Results of this analysis raise the question of whether unintended consequences may result from policies that are coupled with incentives for schools to either increase the number of exam takers or improve aggregate exam performance.
Because the CAPE framework is structured around important levels or aspects of educational systems, it provides a lens for making the connection between analysis results and practical implications for educational policy. We have demonstrated that here by situating a set of equity-focused research questions within each level of CAPE and discussing what the answers to those questions mean from a policy perspective. We utilized data from different states to help illustrate how CAPE can be applied in different contexts. The tradeoff in doing that, however, is that it limited our ability to draw conclusions from the data about the connections between levels of CAPE. In other words, conducting similar analyses at each level of CAPE but for a single state or district may yield additional insights into how the connections between levels of CAPE can inform policy. Thus, we encourage such an approach in future research. Nonetheless, the findings from the current study, which make clear the fact that disparities between student subpopulations tend to exist at each level of the CAPE framework, underscore a key point: effecting meaningful change requires designing and implementing policies that target inequities across the various aspects of educational systems.
Footnotes
Declaration of conflicting interests
The author(s) declared no potential conflicts of interest with respect to the research, authorship, and/or publication of this article.
Funding
The author(s) disclosed receipt of the following financial support for the research, authorship, and/or publication of this article: This work was supported by Google CS-ER Award (93661901).