
Abstract
Facilitating the development of a common framework for monitoring progress in K-12 computer science (CS) education and advocacy with an emphasis on broadening participation is the key to constructing strong CS education policy. Based on a project that brought together leadership teams from six states, a framework for measuring broadening participation in computing (BPC) and setting the foundation for national scaling was developed. Built around a collaboration of leaders representing experience in data gathering, data analysis, data reporting, and data utilization, this project applied the tenets of collective impact to address the challenge of consistently measuring progress toward BPC across state contexts. By establishing a common agenda, including mutually agreed upon definitions of computer science education and broadening participation, these leaders guided the selection of metrics. This led to the development of shared measurement systems and built a deeper understanding of state data systems across the participating states. This phase resulted in common goals and a monitoring system to measure BPC efforts that could inform state policy efforts. Mutually reinforcing activities included the development and sharing of tools, allowing stakeholders to quickly and accurately analyze and disseminate data that drives BPC measurement and policy work. Guided by backbone support to coordinate the work and continuous communication, meaningful participation of all stakeholders was central to the project. Making the case for CS education policy via common metrics and measuring progress across a region stands to impact BPC policy efforts across the United States. The common framework developed in this project serves as a call to action, especially for state and local education agencies committed to increasing diversity in computer science pathways.
Keywords
Introduction
Computer science (CS) education policy reform is a complex undertaking. Ensuring that reform is focused on equity requires a common language, bolstered by data-driven models that are easily understood, scalable, and accessible to stakeholders representing K-12, higher education and research, government, and industry. State and local education agencies, curriculum developers, government leaders, and community members invest a significant amount of time, effort, and money into advocating for and designing policies that address the educational needs of students, families, and ultimately society at large. At the same time, the United States federal government and institutions of higher education are engaged in countless research projects focused on CS and CS education that address topics such as how students learn computing, new tools of instruction, and how to scale computing education efforts that could inform public policy. Recognizing the need for alignment among the multiple communities engaging in this work, complete with coordinated strategies and outcome tracking, new education policies aimed at increasing diversity in CS education can be achieved.
CS education, while a relatively new addition to the educational portfolio and policy discussions taking place in the United States, has the opportunity to integrate data in strategic decision-making as it seeks to become a fundamental subject alongside math and English in K-12 education. Since the 1980s, CS has been slowly gaining traction in K-12 education, at first as an outlier and now as a national movement with champions in K-12, higher education, industry, and the federal government (Cuny, 2015; Google and Gallup Inc, 2015). As CS education is a relative newcomer to the K-12 space, CS advocates and policymakers have a unique perspective, being able to learn from the growth and development of other subjects. At the same time, CS is unlike any other core subject, implying that CS needs to chart its own path. In 2020, a limited number of state departments of education utilized a common definition of CS education, and only 37 states have established K-12 standards (Code.org, 2020). This lack of uniformity implies major challenges for CS policy efforts. Without agreement on the definition of CS education, how can policy be developed and interventions be measured? Without policy ensuring that CS is a K-12 subject that will be taught, why focus on building the teacher preparation programs, graduation requirements, and other infrastructure necessary for CS to become a core subject?
In the absence of structures typically associated with other core subjects, data allow stakeholders involved in broadening participation in computing (BPC) to share a unique story, one that has the potential to build support for the development of policy that accounts for the multifaceted aspects of CS as a new subject. Data allow us to focus on recruitment, retention, and interventions designed to meet the unique needs of each group of students underrepresented in CS pathways. Data also allow CS policy advocates to look beyond simple categorizations, such as “underrepresented minorities,” instead surfacing the intersectional identities of the students absent from CS. Policies can be developed and strategies to expand CS can be built in the absence of data, but the potential for recreating inequitable systems is significant (Margolis et al., 2008).
With over 50 states and territories, multiple state and national non-profits, and significant amounts of federal funding (Code.org, 2019; National Science Foundation, 2020) seeking to advance CS for all students through advocacy and policy, relevant data are necessary to ensure that efforts are strategic, appropriate, and working. Increased attention is being paid to the importance of changing state and national policy to enhance BPC efforts, but existing data at these levels tend to be lagging and coarse. With data sitting in silos at the state level or limited to Advanced Placement courses, policymakers’ ability to have comprehensive, data-driven dialogues about the status of CS education across states is limited. If education leaders cannot agree on common data collection approaches, definitions of CS, what data should be utilized to measure BPC, or what counts as CS across K-12, our collective ability to make valid comparisons is diminished, and our capacity to represent the inequities in computing pathways advance efforts nationally is weakened.
In response to this need for a uniform approach to measure the impact of broadening participation BPC in computing efforts in the United States, the Expanding Computing Education Pathways (ECEP) Alliance, a National Science Foundation (NSF) funded Broadening Participation in Computing Alliance, launched the New England Common Metrics Project (NECMP). This article explores a methodology for a common, cross-state data system that, through further iteration, could serve as a national model for driving a cohesive dialogue for equity-focused CS education policy reform efforts.
In the first section of this paper, we discuss the role of data as an organizing principle for CS education with an eye toward how data can be utilized in CS education policy reform. We then introduce the NECMP project as an approach for testing the feasibility of creating a common set of CS education metrics intended for cross-state CS education policy efforts. In the final sections, we describe the process as experienced by the six New England teams six state teams and the lessons learned when working with state education data across the states. The discussion and conclusion include a vision for scaling the effort as well as a call to action.
Data as an organizing principle for computer science education policy
Data play a crucial role in education policy. In CS education, a clear set of metrics are critical for supporting the BPC movement but face unique challenges in the education landscape. The collective impact model can provide a structure for organizing data and establishing common metrics across organizations. The following section outlines the role of data in CS education policy efforts, as well as the need for higher level organizational structures to coordinate teams and data.
The role of data in computer science education policy
Multiple global organizations have emphasized the need for robust data systems that can be used to inform policy decisions and drive change in education systems (UNESCO, 2020; World Bank, 2018; see also, Custer et al., 2018). Research has shown that the consistent, proactive collection and use of data is one characteristic that separates countries with the more successful education systems from others (Mourshed et al., 2010). Across the United States, state governments have constructed data reporting systems that allow them to examine educational outcomes and track progress of schools, teachers, and students. The data collected through these systems help policymakers identify areas to address and create or modify state education policies accordingly. However, the data available within these systems are often limited to gender, race, ethnicity, and socioeconomic status, providing little or no information on students with disabilities, LGBTQ+ students, or intersectionality. Efforts to ensure educational equity are highly dependent on these data systems as they allow education leaders to identify areas of disparity between student subpopulations or across schools and districts in different regions of the state. Federal efforts to monitor educational outcomes capitalize on and reinforce the data infrastructure of states through accountability requirements such as those mandated by the No Child Left Behind and Every Student Succeeds acts in the United States. These federal accountability requirements have helped to homogenize the ways that student enrollment and achievement data are collected and reported across states for the core subjects (e.g., math, reading, and science) targeted by these mandates. As a result, valid comparisons of student outcomes in these subjects can be made across states, and educational researchers have even been able to construct national-level datasets such as the Stanford Education Data Archive (Reardon et al., 2019), which allows important indicators of equity in math and reading to be measured and tracked at a national level.
In contrast to these core subjects, data collection and reporting for CS is anything but consistent across states. No federal laws exist to govern the collection and reporting of data on CS education, resulting in large variation in what states measure and how. The National Survey of Science & Mathematics Education (NSSME), a federally funded study providing data on the state of math and science education for over 40 years, only began including CS in the 2018 NSSME+ report (Banilower, et al., 2018). Some states include CS in their comprehensive statewide reporting systems, collecting information on which courses are offered and where, who teaches the courses, who enrolls, and who passes. Part of the issue is the fact that CS is a relatively nascent discipline for which many schools still do not offer any courses. When schools do offer and report data on computing-related courses, which courses are categorized as “CS” is not always clear. States may differ not only in how they define CS but also in how courses are named and coded, and whether they have approved K-12 CS standards associated with the courses. as well as the standards, if any exist, associated with the courses.
Efforts have been made by education leaders and researchers to measure and track equity issues in CS education, but consistency in the methods used across states is lacking. Education researchers and leaders in many of the ECEP Alliance states have developed CS education landscape reports that use data to describe the status of CS education in their state. Some of these reports present the results of surveys administered to teachers and administrators asking them to provide, among other things, information on the CS courses taught at their school and the students who enrolled in those courses. These reports represent early attempts at collecting statewide data, and vary in the extent to which they provide an assessment of the diversity of students who have access to and enroll in CS courses. In order to address a lack of state-level data, researchers in Maryland developed and administered a survey to teachers across their state, but included items that asked CS teachers to provide student enrollment numbers by demographic categories for the courses they taught (desJardins & Martin, 2013). As a result, the report identified significant gender disparities in participation, as female students were less likely to take CS. However, although data were provided on the number of racial/ethnic minority students enrolled in CS, these data were not coupled with overall numbers of students, and so they did not provide an indication of whether student enrollment reflected equitable participation in CS. Other states, including California (Scott et al., 2019) and Texas (Texas Advanced Computing Center, 2020), analyzed public school data collected by the state education agencies. Thus, the landscape reports for these states utilized actual enrollment counts to describe the disparities that exist between students of different gender, race, ethnicity, and socioeconomic categories. However, because these reports were developed independently, differences in the way CS was defined and the courses that were included in measures of access and participation make it unclear whether and to what extent the results from these states are comparable.
Some steps toward a national-level system of monitoring equity in CS education have been taken. In 2019 and 2020 Code.org, the Computer Science Teachers Association (CSTA), and ECEP collaborated to produce a report on the state of CS education in the United States, which includes snapshots of students’ access to and participation in CS. The (2020) report compared rates of access and participation for the two Advanced Placement (AP) CS courses broken down by gender and race/ethnicity. Data were limited to the two AP CS courses because state-level data for those courses are publicly available. As a result, the report provides valid comparisons across states of student access to and participation in CS. One drawback of this approach, noted by the authors, is that the measures of access and participation do not account for any other CS courses offered in K-12. Thus, it is unclear whether and to what extent the disparities identified in this report are representative of what would be identified if all CS courses were considered.
Google LLC and Gallup Inc. have taken a different approach to understanding the state of CS education in the United States by analyzing data from a series of surveys designed to gauge interest, access, and participation in CS (Google and Gallup Inc, 2015, 2016b, 2016a, 2016c, 2017, 2020). In contrast to the Code.org, (2020) report, the Google and Gallup reports identify disparities across all CS courses. However, these reports are not without their limitations as well. As the reports utilize survey data, they provide estimates of access and participation based on self-reports rather than actual counts of students. Although such information still can provide valuable insights, they lack precision and thus are not ideal for monitoring inequities systematically over time.
It is clear that attempts at CS education landscape reports up to this point have been useful for purposes of specific state-level contexts and policy needs. Landscape reports tend to provide broad, state and national-level data, but suffer from a number of limitations including a lack of BPC-focused data and the ability to report data in a uniform manner. The NECMP work, at least in part, is an enhancement of the state landscape report work in that it addresses the past limitations and provides a consistent way to collect data year over year. It also allows for cross-state examinations of trends and works toward the key issue of creating common definitions of CS education and determining what data best serves BPC. This is potentially significant not just across states but also within states as uniform data collection guided by common templates, a common language, and course categorization can increase a state’s ability to develop data-driven CS education policy strategies.
Building a community approach to broadening participation in computing data in support of computer science education policy
Building a common, multi-state methodology for measuring advocacy and policy efforts focused on BPC has proven to be elusive to researchers and project evaluators (Decker, et al. 2018; Stanton, et al. 2017). Recognizing this challenge, ECEP leadership, in collaboration with SageFox Consulting, initially attempted to create a cross state measurement system at the 2018 ECEP annual convening Measuring What Matters: Broadening Participation in Computing (BPC) in the States, which brought together leadership teams from ECEP’s 16 states and the territory of Puerto Rico. This undertaking yielded a significant amount of information about state data structures and collection methods, yet it did not show clear enough similarities that would lead to a common metrics system.
The process, launched at the 2018 ECEP annual convening, led some states to focus on developing better data systems, while others sought continued guidance. If the ECEP membership was not quite able to collaborate on cross-state systems, they recognized that they could refine local systems. At the same time, ECEP’s leadership continued to formulate potential frameworks for a multi-state metrics system. Included in the on-going development were templates to self-assess the value of and access to specific data elements related to course offerings, teacher capacity and student participation to help states prioritize efforts. These templates, along with templates for data collection, suggestions for team membership, as well as working definitions of equity and CS provided initial structural commonalities that could be tested, challenged, or adopted. Common methods and templates removed the tendency to fall back on siloed efforts.
In response to the continued drive to develop a measurement system that would show progress and gaps in BPC efforts, ECEP launched the NECMP in early 2019. As a collective impact project, ECEP’s experience providing backbone support (Kania, J and Kramer, M., 2011) for state teams developing BPC advocacy and policy strategies informed the structure and design of the NECMP. Through the combination of states developing their own BPC framework, and ECEP working to make sense of the data from the 2018 annual convening, a system started to come into view at the 2nd Annual Computer Science Teachers Association New England Regional Conference: Equity in Computing. A panel of department of education leaders from Connecticut, Massachusetts, New Hampshire, Rhode Island, and Vermont, with a non-profit leader representing Maine opened the conference. With each panelist sharing data highlights and strategic efforts, there was growing evidence that these states were ready to collaborate. A closing question from the audience asked if the New England states had ever considered collaborating on CS education equity efforts. When multiple panelists responded that they were open to such an idea, ECEP began developing a plan to launch the NECMP.
Based on the knowledge and experience of the leadership team, and initial iterations of templates and process, the NECMP approach centers on four goals: 1. Establish a common agenda, including shared definitions of computer science education and broadening participation to guide the selection of metrics. 2. Develop shared measurement systems, built on a deeper understanding of state data systems across the participating states and a common goals/monitoring system to measure BPC efforts. 3. Create mutually reinforcing activities that include the development and sharing of tools that will allow stakeholders and change makers to more quickly and accurately analyze and disseminate data that drives BPC work. 4. Engage in the process of data discovery with regard to BPC and K-16 CS education change efforts.
As a pre-existing community, there was firm understanding of what building a common metrics project to inform policy would entail. Learning from the attempt to maneuver 17 state teams as at the 2018 convening, it was evident that structure in the form of definitions, team design, and templates would be required at every stage. Knowing that the collective impact framework had limitations around its focus on equity and social justice (Wolfe et al., 2020), and given that the NECMP work was centered around BPC metrics, the team wanted to ensure that BPC was held as a central principle in all data collection and was uniformly implemented. The team operationalized BPC through the Capacity, Access, Participation and Experience (CAPE) equity framework (Fletcher and Warner, 2021, Warner et al., 2021), which provided an organizational structure for understanding the available data through a BPC lens. The CAPE framework defines four components or levels of educational systems that should be considered when assessing equity in computing education. There are equity issues to address in terms of schools’ and districts’ capacity to offer CS (e.g., smaller schools may lack the faculty or other resources needed to offer CS courses) but also in terms of students’ access to CS (e.g. students from low socioeconomic backgrounds may be less likely to attend a school that offers CS), students’ participation in CS (e.g., male students may enroll in CS courses at higher rates than female students), and students’ experiences in CS courses (e.g., some CS students may receive better instruction than others or experience a higher sense of belongingness than others). The NECMP aimed to use the data collected by teams to understand BPC needs at each of CAPE’s four levels. In other words, using the CAPE framework to operationalize BPC helped the NECMP teams to view BPC as more than simply a CS enrollment issue
Cross-state collaboration for data-driven policy reform efforts
Developing and implementing education policy is a multifaceted process, and with the novel and multi-dimensional nature of CS education (Ericson et al., 2016) there is a risk of unintended consequences that may differentially affect students that are underrepresented in computing (Zarch et al., 2020). In Texas, for example, although efforts to broaden participation have begun closing the gap between students who are Black or Hispanic/Latino and students who are Asian or White, the gap between male and female students has actually widened (Fletcher et al., 2020; Texas Advanced Computing Center, 2020). In Georgia, Senate Bill 108 (2019) requires all middle and high schools to offer CS by 2025; however, the definition of what would count as a CS course lacked consensus with some advocates in support of IT support, Web Design and Networking courses to fulfill the requirement (Zarch et al., 2020).
Diverse teams representing state-level context
Pairing data with BPC policy reform efforts needs to be a collaborative effort. ECEP, as well as other collective impact models, are designed to include broad-based teams with diverse stakeholder representation. Broad-based teams need to reflect a demographic diversity, and diversity within the fields represented. Diverse teams ensure that multiple voices, from a variety of stakeholder groups inform the project direction, while at the same time avoiding a dominant voice. Because CS impacts K-12, higher education, industry, and research, it is vital that representatives from these groups are developing strategies collaboratively. In order to build a common metrics system and ensure that the data collection, interpretation, and use were coordinated, the NECMP outlined four distinct categories of leaders: (1) data gathering, (2) data analysis, (3) data reporting, and (4) data utilization. Stemming from ECEP’s past attempts at common data efforts, there was an assumption that anyone with access to data or researchers with data collection experience could support a project. However, gaps in a team’s ability to access, analyze, and utilize data were quickly exposed without a complete data team.
Over the course of the NECMP, when gaps were identified, teams rapidly expanded to include leaders with more data responsibilities or expertise. When obstacles were encountered, there always seemed to be another level of ‘data specialist’ who could step in to inform data collection, or design a data query. Figure 1 shows the depth of stakeholders, with departments of education making up the bulk of the leadership followed by researchers in higher education, non-profit leaders, and teachers. NECMP Team Development, increase in data expertise over time.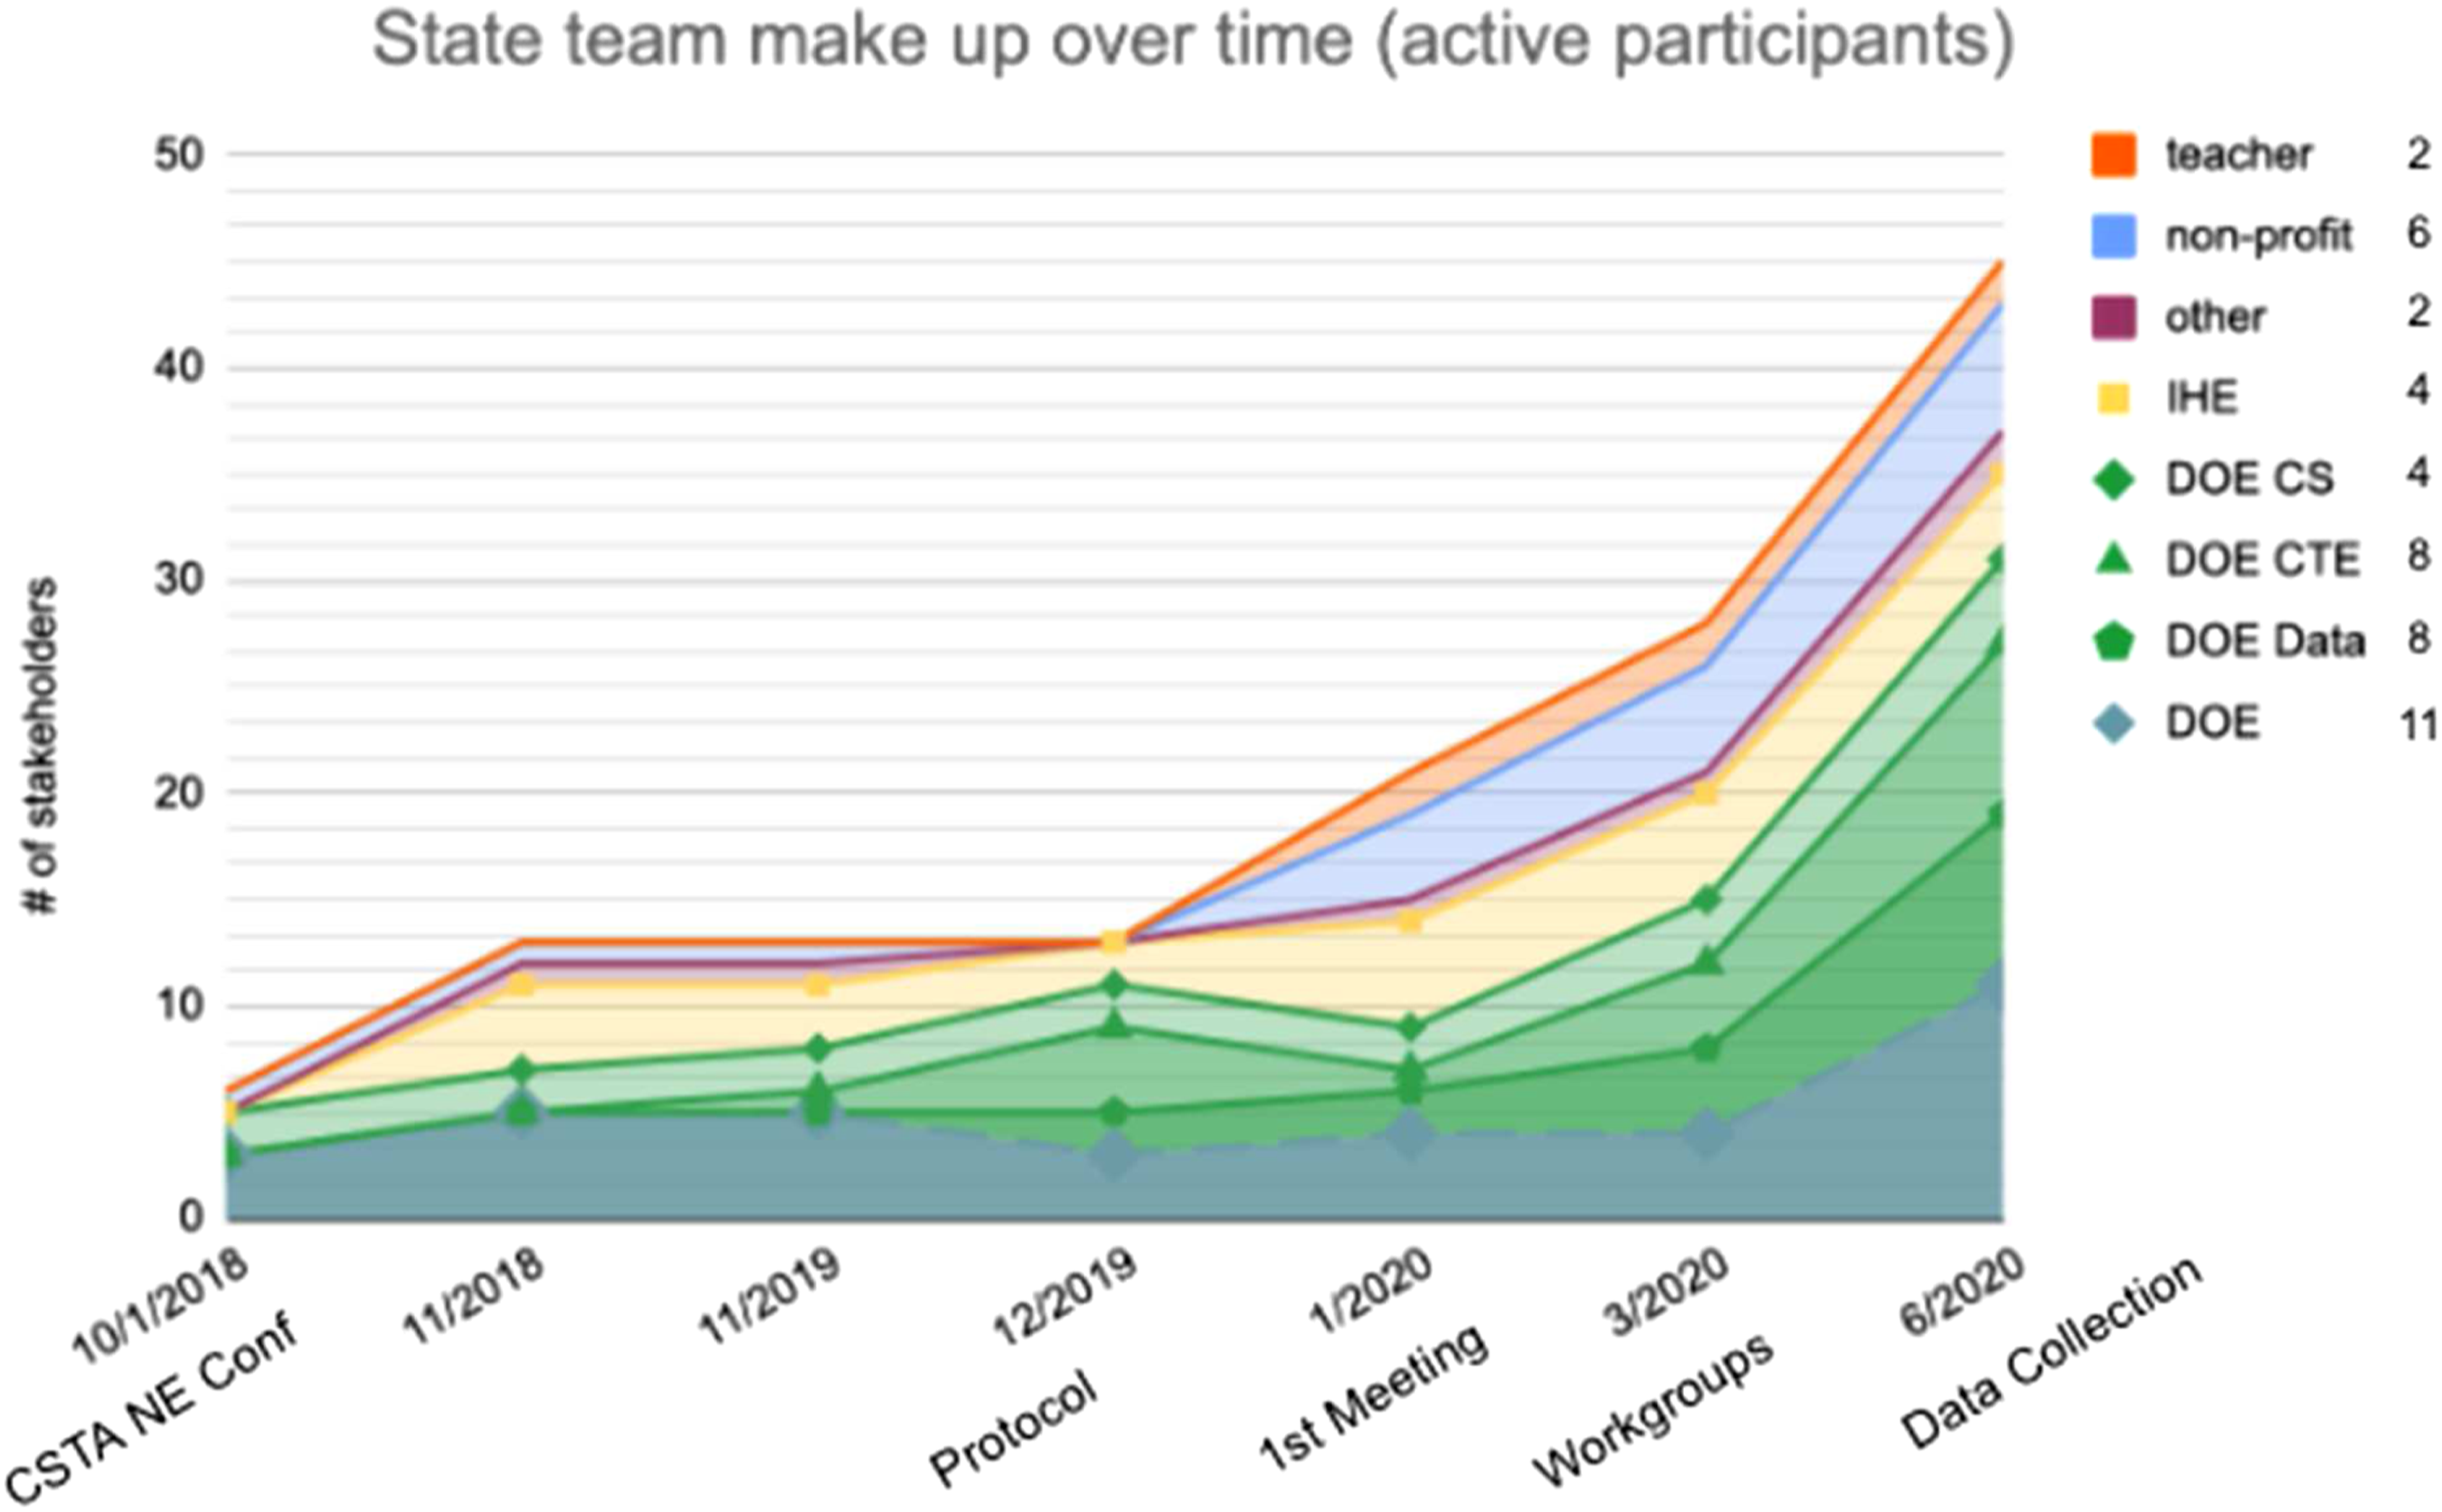
State team members’ perspective, roles, and contributions.
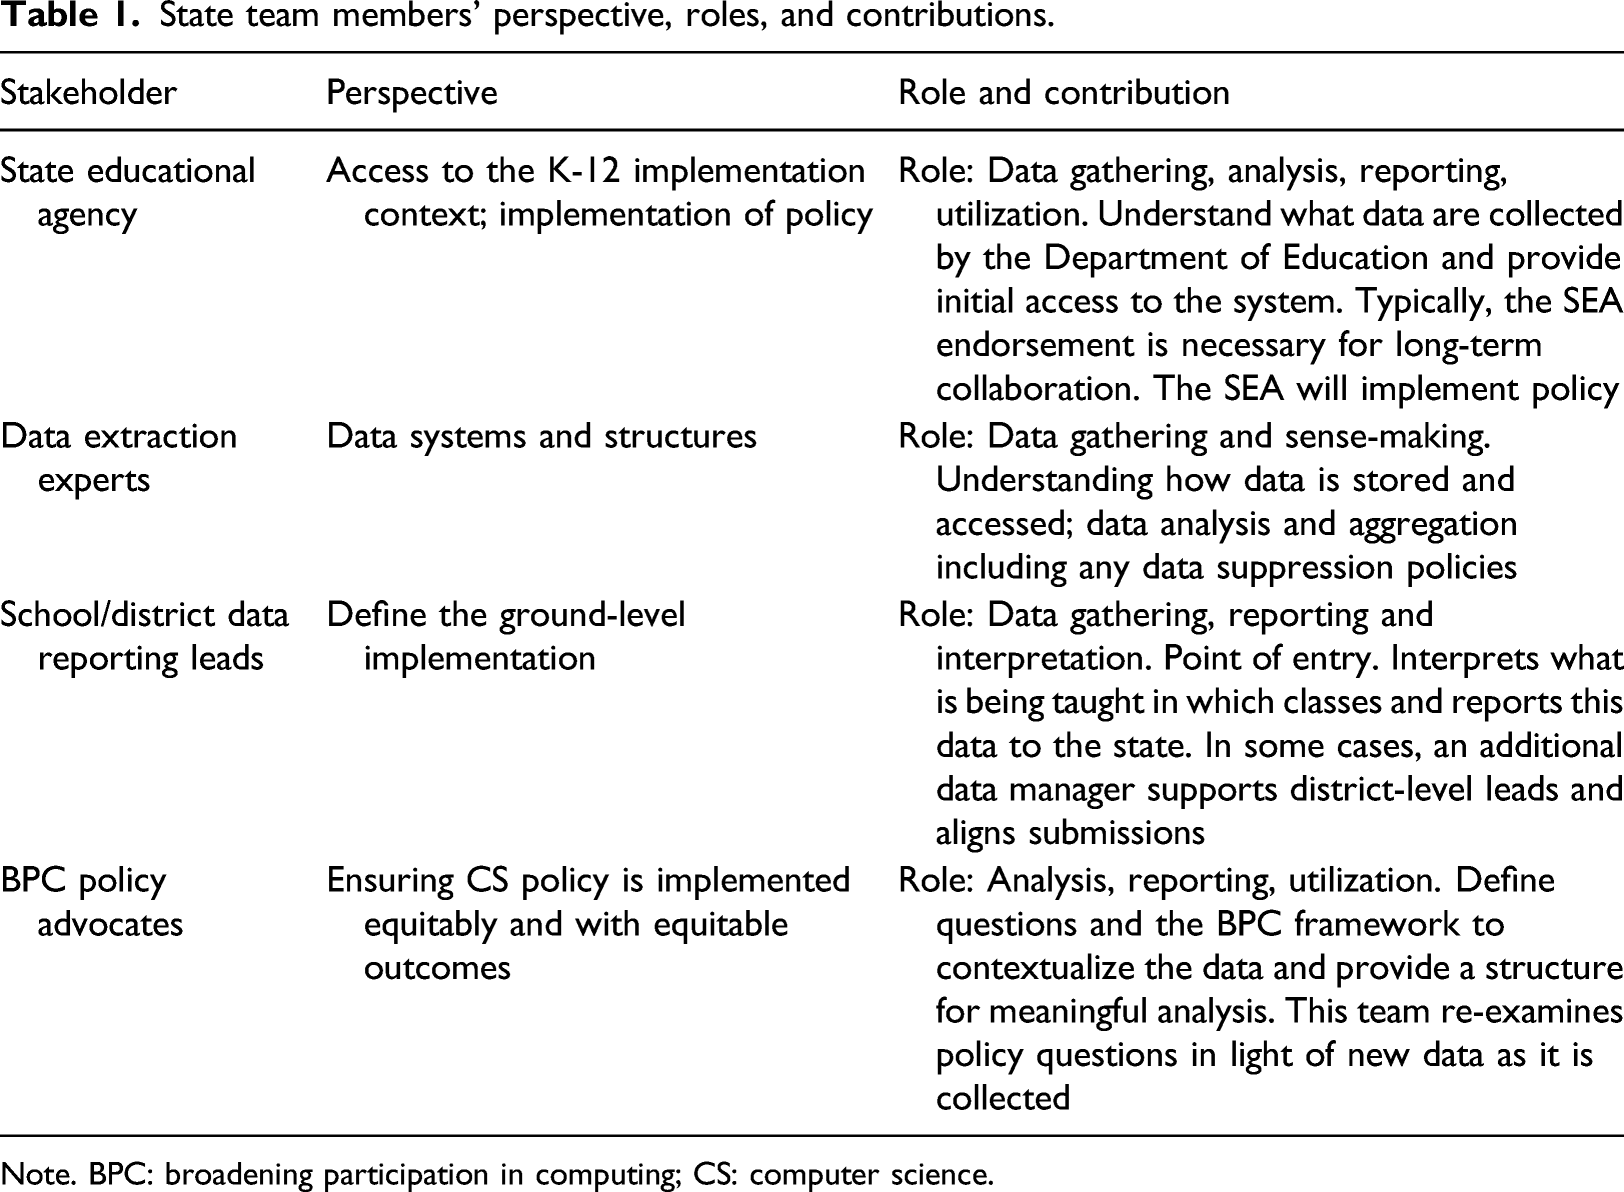
Note. BPC: broadening participation in computing; CS: computer science.
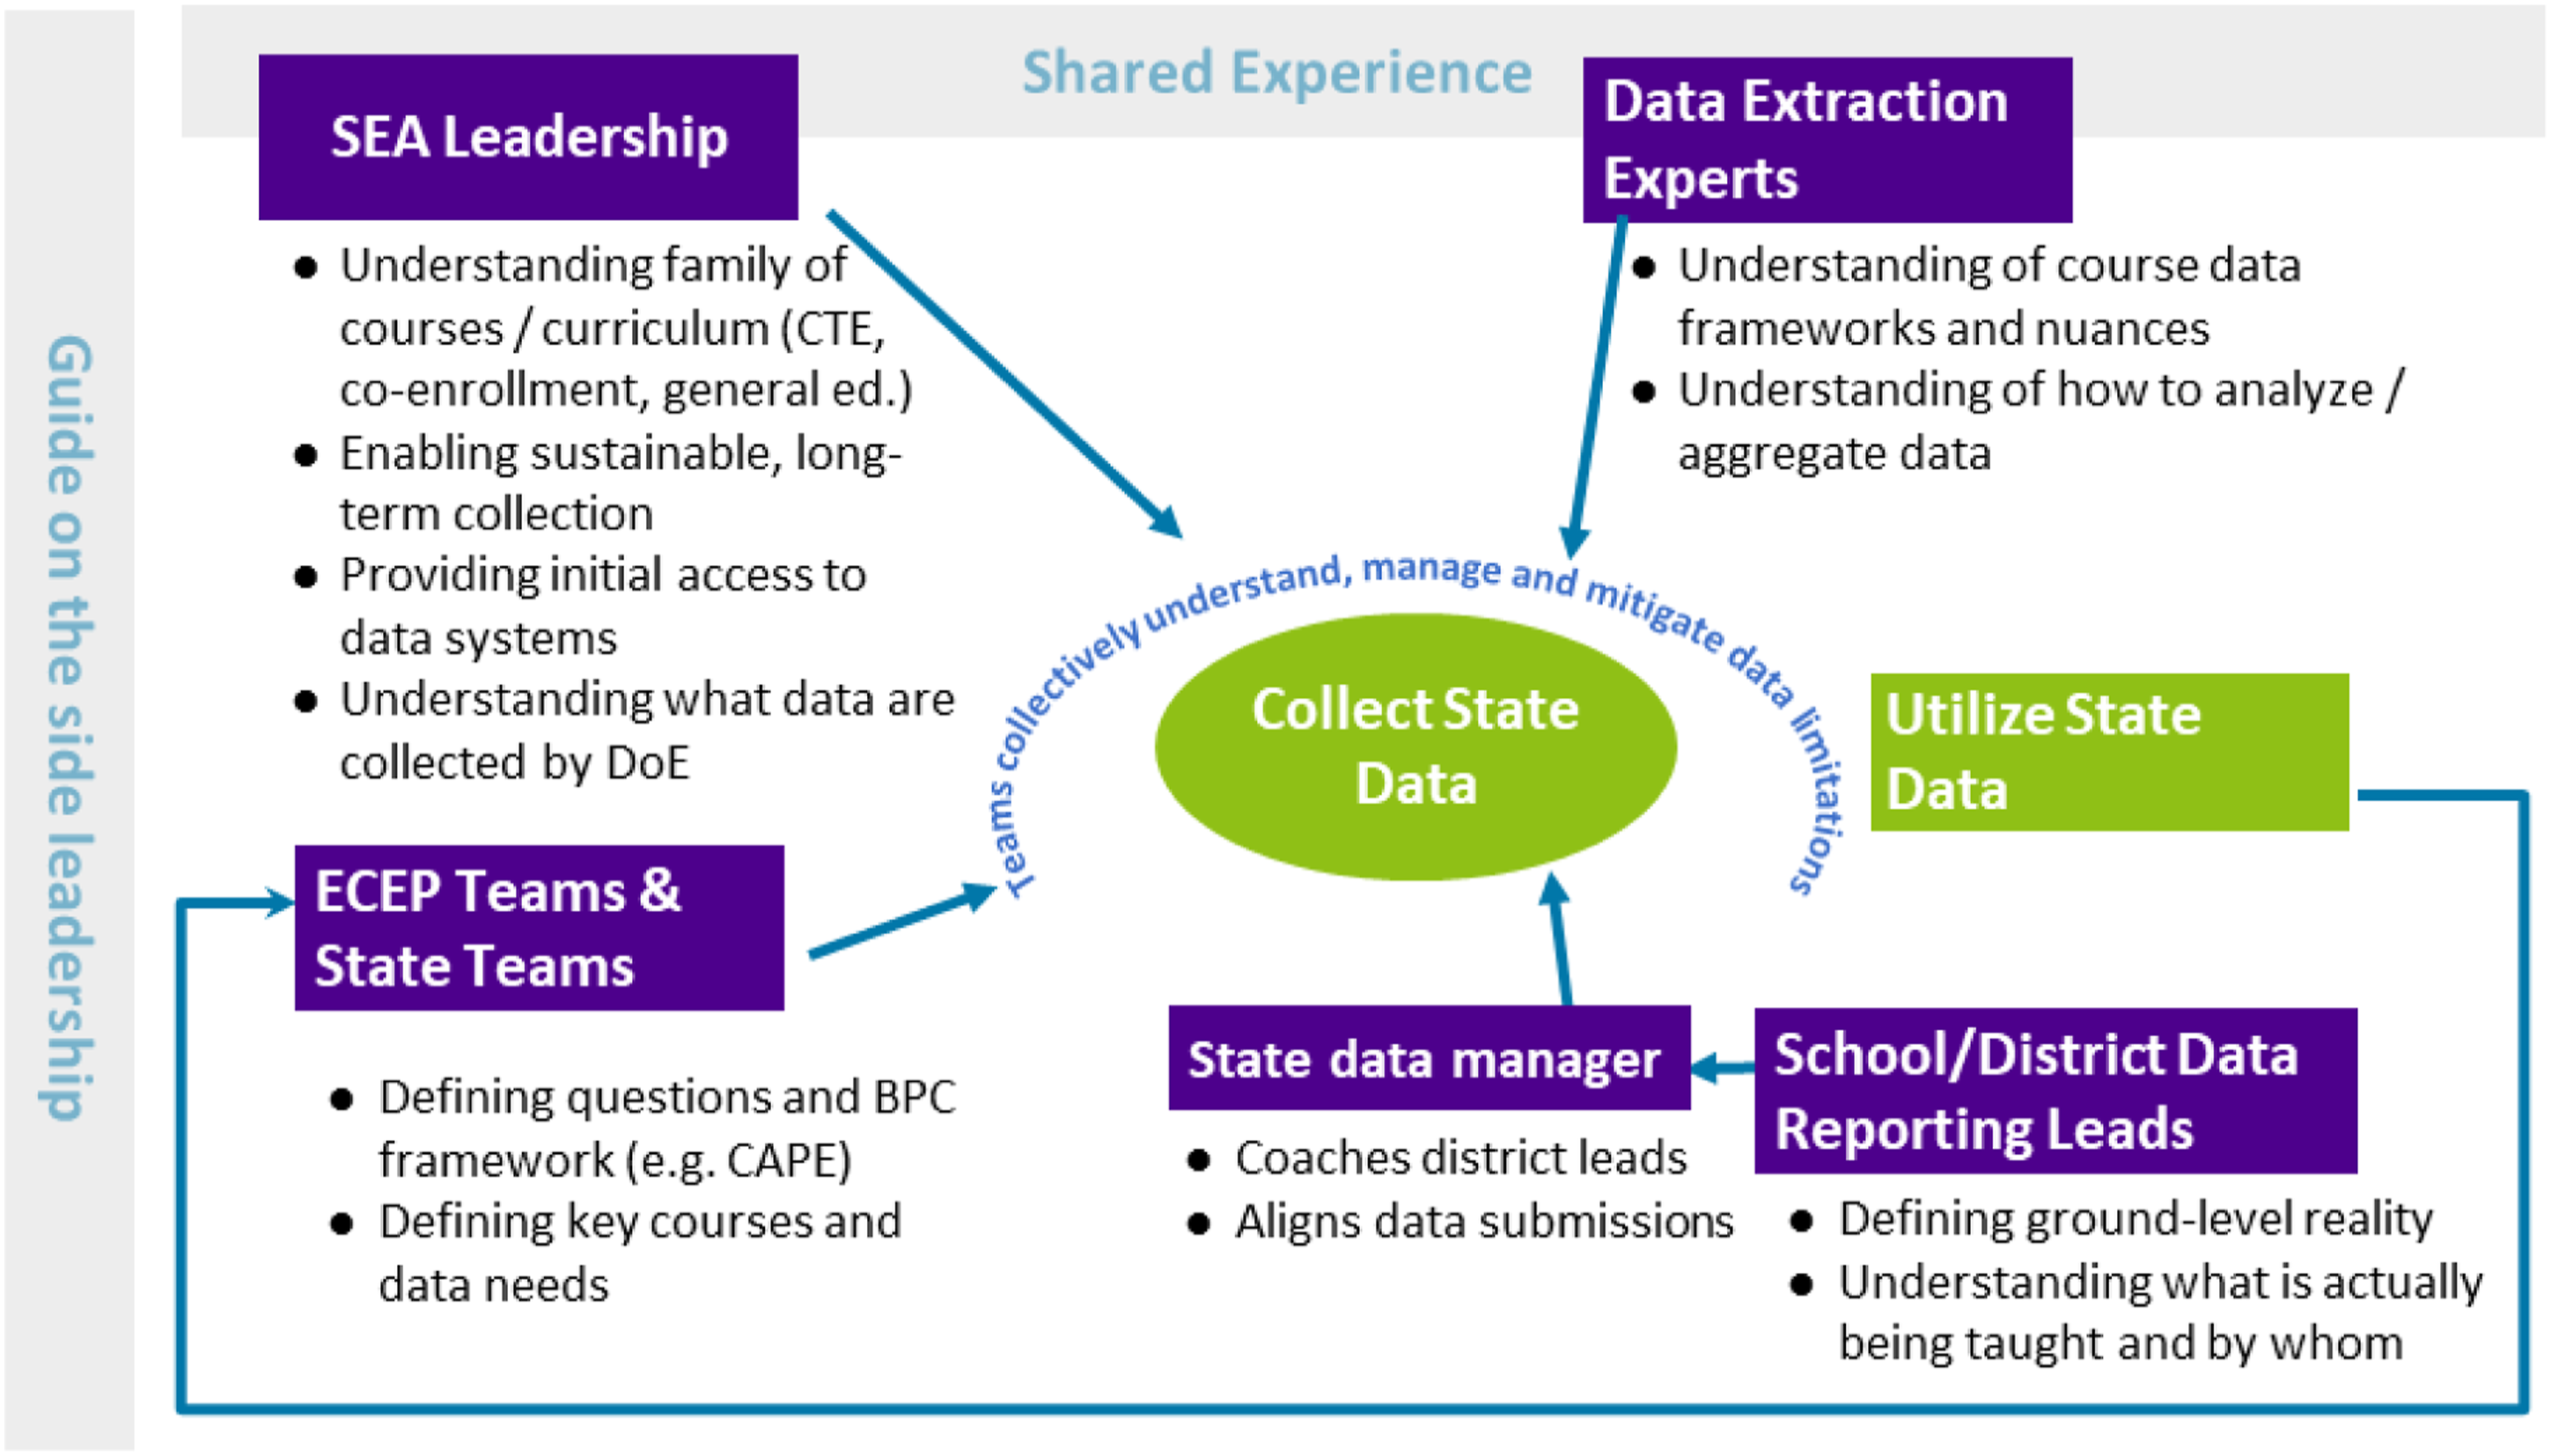
Process of bringing experts from multiple states together to collect state BPC data.
Working across states
The NECMP project brought together states with distinctly different educational contexts including how policy decisions were made (state, district, or school level), approaches to state educational data input and management and how CS education is defined and supported. Engaging in this process, which is complex at a state-level, across six distinct states accelerated the understanding of the challenges and opportunities of utilizing state data in support of BPC policy goals. Each state has a unique educational context and differs in how data is captured and used: 1. Connecticut has a robust data system; however, their CS policies are relatively new. With Senate Bill 957, An Act Concerning the Inclusion of Computer Science Instruction in the Public School Curriculum, Programs of Teacher Preparation and Alternate Route to Certification Programs and the Creation of an Adjunct Computer Science Instructor Permit and a Computer Science Endorsement, being passed in 2019 their CS policies and data systems require alignment (S.B. 957, 2019). 2. In January 2020, Maine passed a resolution directing the Department of Education to study and develop a state plan for computer science instruction and professional development passed LD 1382 (2019) An Act to Establish Computer Science Courses and Content in Kindergarten to Grade 12 Schools which will require a focus on equitable access to CS across the state. 3. Massachusetts has the longest timeline of CS advocacy and policy efforts among the New England states. Having passed H. 3650 (2015) H. 3800 (2017) and H. 4800 (2018), Massachusetts policymakers and advocates have addressed policies supporting strategic planning for CS education, teacher professional development, as well as teacher certification. The recently adopted DLCS standards (2016), facilitated the identification of CS courses, however, as one participant noted “we collect a lot of data but we haven’t put it to use yet.” 4. New Hampshire had conducted a state landscape report covering the 2015–16 academic year. In 2018, the NH State Board of Education adopted the Academic Standards for CS, and NH H. 1674 (2018) certified CS and digital literacy as a K-12 subject. In 2018, a CS teaching endorsement was created. The state also has a well-developed sequence of computing in the CTE pathways that has not yet translated to the general education offerings. Without consistent course names or numbers, it is difficult to know if “computer programming 1” at one school is similar to “computer programming 1” at another. 5. Rhode Island, like Massachusetts, was an early front runner in the CS education movement. Rhode Island’s Governor, Gina Raimondo Raimando, was one of the first governors to join the bi-partisan Governors for K-12 Computer Science and launch a CS4State initiative (About. Govs for CS, 2021; Overview. Govs for CS, 2021)). The Rhode Island Council on Elementary and Secondary Education endorsed the RI K-12 CS Education Standards and the CTE CS Industry Standards in 2018 (State of CS. CS4RI, 2021). 6. Vermont is a newcomer to the CS education and BPC table. They have not moved forward on legislation supporting CS in the state, but have been engaging in local and national CS education policy discussions. Prior to joining the NECMP, Vermont had recently gone through a reconfiguration of the state database that linked previously disconnected systems.
Working together to define a BPC measurement framework, mutually defining the data request, and reporting the available data accelerated the state-specific BPC data efforts. With great transparency, state teams shared the benefits and limitations of their current systems including data entry, access, and interpretation. Teams challenged their peers to think critically about the quality of their data, how they were utilizing the data, and how they could take their data collection to the next level. Being explicit with the process and attempting to collect data surfaced a range of issues that had previously been ignored or avoided by some and, more importantly, identified opportunities for others. Each state left with plans improving the data collection and utilization based on what they had learned from their neighbors.
Operationalizing broadening participation in computing data to inform policy
Orienting stakeholder perspectives
Through their extensive work with state teams in the ECEP Alliance, the leadership team knew that the NECMP teams would need to include a wide array of stakeholders with different perspectives and expertise. As described in Table 1 section 3, there were four major groups of stakeholders who were brought in, each with a different understanding of what data were needed and available and what limitations they came with for representing BPC. Figure 2 demonstrates the process that the project undertook in bringing key groups of team members together and the relationships they shared. This process often required teams to re-evaluate who was engaged and add or replace existing members to best meet the needs of the project.
Defining a shared data request
Stages of the data process for NE Metrics teams.
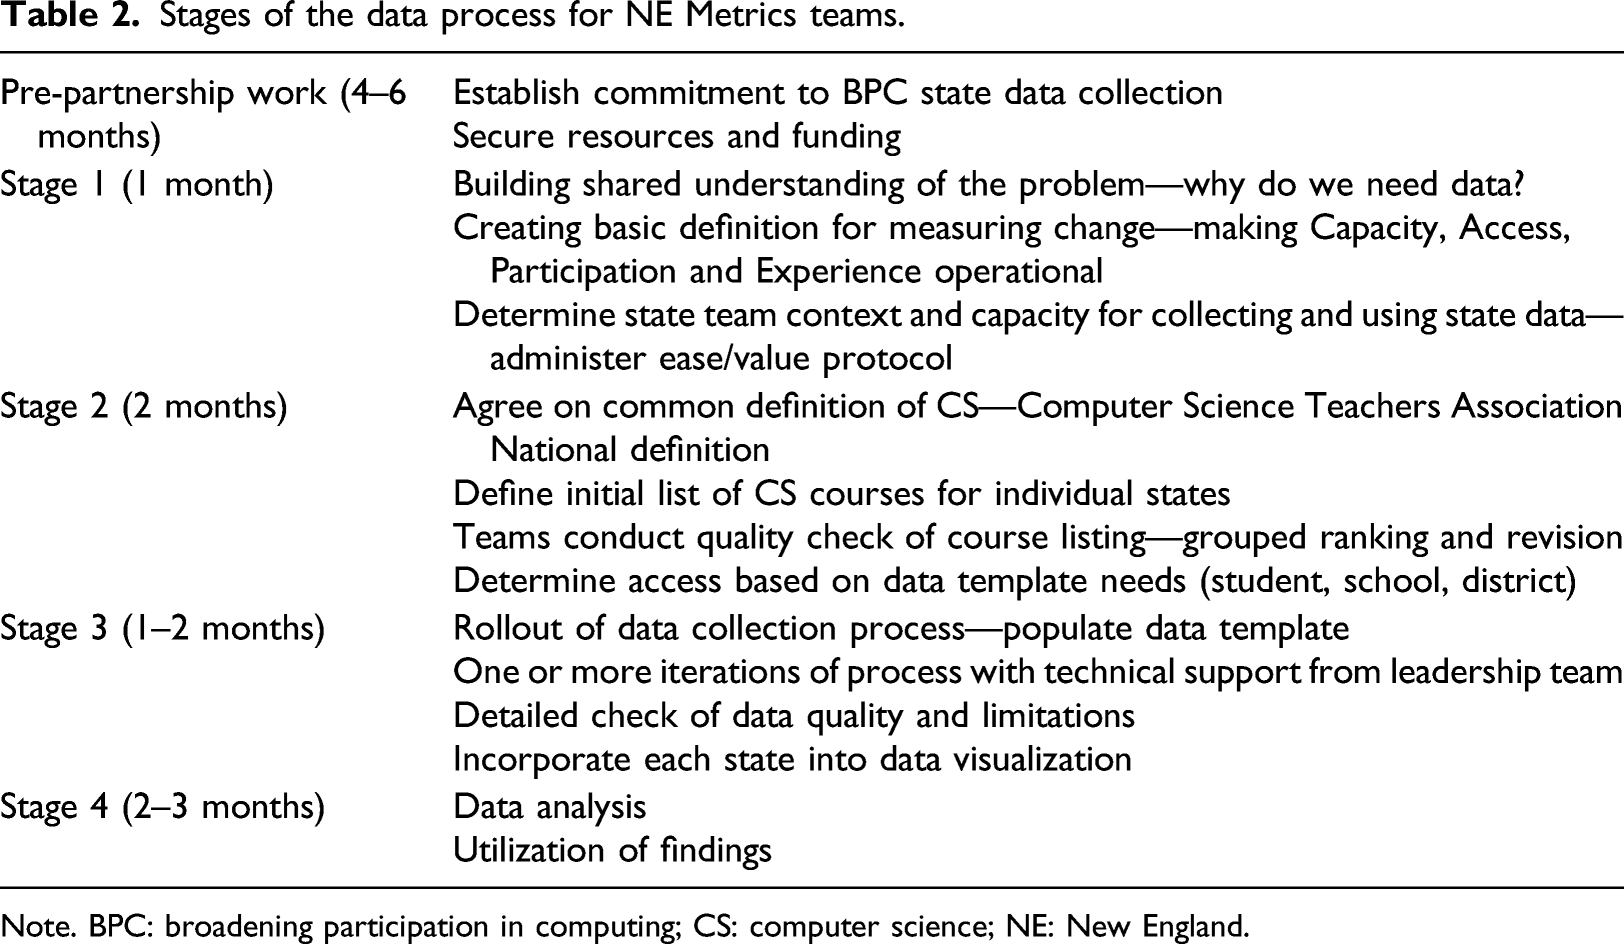
Note. BPC: broadening participation in computing; CS: computer science; NE: New England.
Though the end product of this work was designed to create a set of state-specific data for each team, the cross-state process revealed important information along the way, creating additional opportunities to highlight commonalities across states. For instance, state teams learned what BPC data issues other teams were addressing and struggling with, helping to bring their own efforts into focus. Similarly, they were able to examine definitions of CS courses across multiple states, which often helped to ground their own definitions.
Data collection and interpretation
The project initially attempted to collect data to demonstrate state status in each of the four areas of CAPE. However, early efforts revealed that, given the data then available across all New England states, with currently available data, only access and participation could be examined with fidelity. The project’s progress and vision of each of the areas of CAPE is described below: 1. Capacity: Capacity hinges primarily on being able to obtain consistent and reliable data around teacher training and background. The project considered assessing equity in terms of capacity for CS by comparing the availability of qualified CS teachers across different types of schools. A work group was convened early in the project to think about collection of teacher background and training data, but the group concluded that it could not feasibly be collected. 2. Access: Access was determined by comparing the characteristics (e.g., geographic locale) and demographics (e.g., percent of students who are economically disadvantaged) between schools that did and did not offer CS courses, determined by collecting data around how many schools offered CS courses versus how many did not. 3. Participation: Participation was assessed by comparing enrollment rates between categories within different types of student demographics (e.g., gender and race/ethnicity) for students who attended schools that offered CS courses, based on student-level that was tied to courses and schools (i.e., for schools that had access to courses, how many students participated and were they representative of the school’s population?). 4. Experience: Experience in CS hinges on data around course fidelity and student progression through sequences of courses. The project considered the possibility of assessing equity in students’ experiences of CS by collecting and analyzing data on student progression through sequences of CS courses and on course fidelity (i.e., the extent to which instruction and learning experiences align with the standards and objectives of the course). Though a work group was convened to develop an understanding of course pathways, it was determined that it was not feasible to collect data on course fidelity or student progressions as there was little evidence of actual pathways.
Focusing on the access and participation issues that were feasible within the scope of this work, the project proceeded by identifying the focusing on which CS-focused courses were offered across at which schools within each state, with the hope of being able to make determinations about the students who are participating in those courses by disaggregating numbers into several categories relevant to BPC. Because of the difficulties associated with classifying CS at the K-8 levels, the team decided to focus the efforts of this initial work on high school only.
Two group CS course classification.
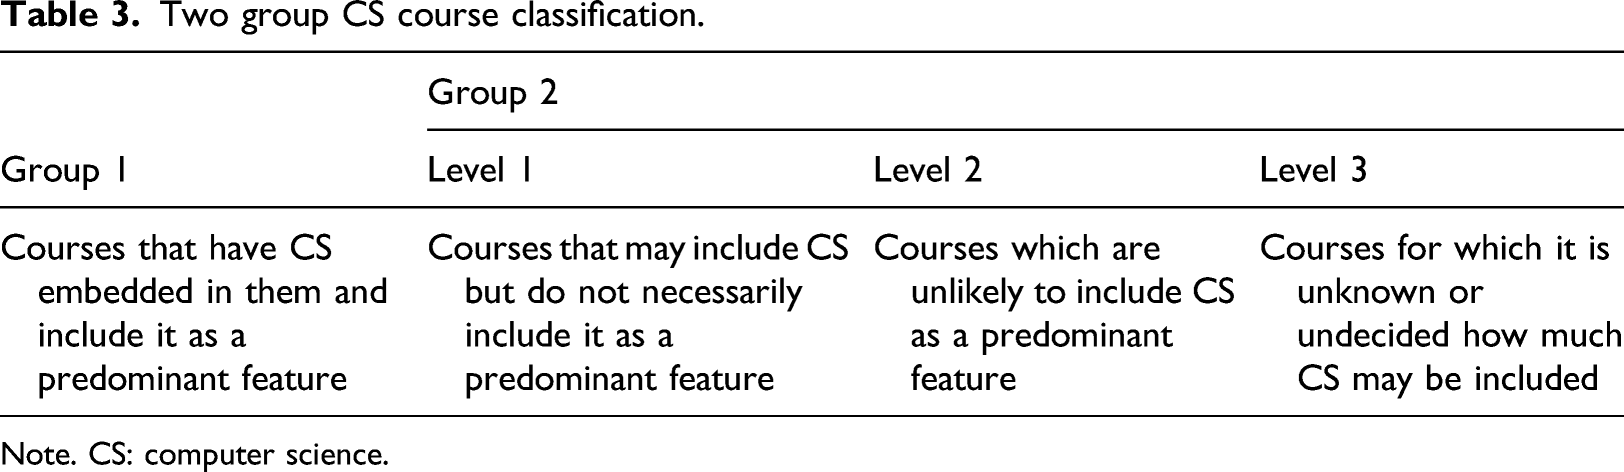
Note. CS: computer science.
Teams were asked to think about which of the courses from their list they would classify as “Group 1” and which they would classify as “Group 2” (any courses placed in “level 3” of Group 2 were discarded from the lists). Once each team had classified their courses, the project leaders used this information (along with their own background knowledge of STEM courses) to create a master list of Group 1 courses that would be shared across states. Group 2 course lists (those in “level 1” or “2”) were meant to include other high school courses that were known to have an emphasis on CS within an individual state, but that may not have this emphasis (or even be offered) outside of the state. The process of selecting and agreeing to codes across state teams was critical to advancing the work, even if teams needed to compromise to create a master, New England list. As the MA team described, “it is only when you get to the SCED codes [that] you really make the decisions of what is and isn't CS. I would tell states not to sweat the SCED codes. Pick the codes most people agree to and start reporting.”
Teams were then asked to use the above list of Group 1 courses for their primary data visualizations. They were given more latitude with Group 2 courses and were allowed to include additional courses based on their background knowledge of state offerings. Additional courses were more likely to include courses in other STEM areas, such as engineering and natural sciences.
Schools were described based on the districts in which they were situated. The National Center for Education Statistics (NCES) makes available a public data system that the NECMP team used to create a basic profile of each school based on the socioeconomic status of their district.
Through this work, the project team was able to create a set of common protocols and reporting tools, resulting in a set of shared language which enabled the teams to discuss goals and actions within a shared framework.
Identifying common challenges
A number of challenges and limitations emerged in the work to identify courses and link them to schools and students. These included the following: 1. Course naming challenges: Though SCED codes are common nationwide (notwithstanding differences between the different SCED code versions), there is inconsistency in how the codes are applied at both the local district level as well as the state department of education level. 2. Student aggregation challenges: When data were being aggregated, questions sometimes emerged about the unit of analysis. Some data systems allowed analysts to create data tables that only included unique, individual students. However, in some states, for schools that had multiple CS courses, there was a risk of duplicating counts of students who were in more than one class. 3. Course definition challenges: Career and Technical Education (CTE) courses and co-enrollment courses varied across states in terms of whether and how they were offered and were sometimes included (or excluded) in datasets in different ways. In addition, the presence of things like independent study, honors, and experiential learning courses resulted in some sections that were very small and raised questions about what is meant by the term “course.”
Finally, the notion of Group 2 courses showcases an example of the challenges related to capturing and counting courses with integrated CS components versus those with CS featured prominently as part of the title (a significant challenge that would need to be addressed if gathering data at the K-8 level). These courses were very important to include because they may represent how CS is taught to a wider audience beyond Group 1 courses. However, the amount of discretion needed on the part of state team members in deciding which courses to include raised the possibility of significant inconsistencies over time if there was change in team membership.
Even with the above limitations, though, the NECMP leadership team is confident that this was a powerful approach that likely collected upward of 90% of total high school CS enrollment within and across states.
Discussion and vision for scaling
Scaling computer science education with a focus on equity is complex, with additional challenges related to the lack of data around the capacity to offer high quality CS education opportunities, inconsistent data on access and participation, and further challenges in measuring equity in student enrollment and retention. This project was designed to understand and build the capacity of states to access and use available data internally and to pilot cross-state analysis by developing a shared vision for why we need to develop common BPC metrics and test some “good-enough” models across states.
Though there have been efforts to understand the landscape of CS education nationally, nothing has come close to the systematic and robust nature of other core subjects such as reading and math, both of which have high-stakes accountability. Without a federal accountability mechanism, monitoring equity in CS over time becomes a grassroots effort. This effort requires a data infrastructure that is valid across multiple states and useful enough for individual states to encourage participation. The NECMP has begun to identify the elements of a data infrastructure that meets state’s needs and can aggregate across states to inform national policy.
Valuable lessons emerged from this effort particularly concerning the challenges across the lifecycle of data collection, starting with the fundamental issue of defining computer science. The six New England states readily agreed to a “common enough1” definition of CS1 but operationalizing it with confidence varied by state. Similar to past efforts to measure BPC in computing, the interpretability of the data is difficult when working within and across states. Having people involved in defining, managing and interpreting the data that represent an array of stakeholders helps to build a common understanding for what is being measured and how it will be used; this critical dialogue leads to an appreciation of the connectivity of data to policy and can help support states in operationalizing the data process.
Individual states reported different approaches at the point of entry, the timing of data collection and certification of the data by the state’s departments of education, and the variables contained within their systems. Extracting the data for a cross-state comparison is burdened by this variation. That said, the state participants uniformly agreed that finding commonalities is critical for BPC related policy and monitoring efforts. What did show impact on data was the collaboration, the time allowed for the project, the structure created through templates, and the space made for community discussion and accountability.
Though the end goal of collecting state BPC data is often to drive policy within an individual state, the lessons learned across states often help to inform a broader set of issues and reveal what may be possible in terms of collecting and analyzing data that an individual team would not have considered on its own. Without a drive for a multi-state consortium engaging in this work, that agrees on templates and overall structure, it will be hard to move beyond where the CS policy and national data efforts are now (i.e., multiple indicators that are not cohesive, temporally aligned, or linked to policy efforts).
Conclusion
The NECMP work demonstrates the potential of a multi-tiered, template-driven approach to developing a data infrastructure in support of BPC monitoring and data-informed policy efforts. This process began with high-level vision setting for BPC which was then executed with a low-level understanding of what the data are and how they can inform an operationalized system for BPC.
This work also demonstrates the need to simultaneously honor the individuality of each state’s BPC strategy and student needs, their data mechanisms from the building level (schools) to the state databases, and the policies already in place, or in development. By recognizing standing efforts, the project developed a sense of goodwill and trust, making it easier to obtain investment from all key stakeholders. Proceeding toward a regional-level examination of data by using the bar of “common enough” allowed state leaders to shed the long-standing commitment to siloed practices, collectively understanding that we were going to build a stronger system in the service of BPC.
By working toward the collection of concrete, quantitative data, the work that the NECMP engaged state teams in represents the culmination of a series of stages that indicate their readiness to meaningfully explore BPC within their own context. It promoted this readiness by requiring them to: 1. Settle on a shared definition of computer science which led directly to the selection of a discrete set of courses as the state’s CS offerings; 2. create and continually refine a diverse team of stakeholders, including department of education representatives, data experts, K-12 administrators and BPC experts who could examine all aspects of the BPC data problem; 3. visualize which incorporate data visualization methods to clearly show the specific demographics of students did and did not participate (or have access) to CS across their state; and 4. understand and discuss the strengths, weaknesses, and limitations of data collection systems, including a. centralized, state data systems and the data elements they have or lack. b. The data collection infrastructure and personnel that link K-12 districts to state data systems. c. The definitions and assumptions surrounding CS education that may or may not align across different groups.
By forcing the issue of creating shared definitions and concrete understandings around CS education, as well as convening the appropriate set of team members, the project touched on the key precursors that are required for being able to envision, write, and track effective CS education policy. The ability to take on this work likely required a certain amount of “readiness” on the part of state teams prior to becoming engaged (e.g., by having the necessary buy-in and understanding of the importance of BPC from many team members in advance).
There are several important next steps revealed by this work: 1. A thorough understanding of BPC at the state level requires the ability to collect data on capacity and (student) experience (in addition to access and participation), yet the necessary data was largely unavailable within current systems. This indicates a need for further exploration of the capabilities of state data systems as well as ideas for their probable expansion. 2. One of the major challenges of defining CS within a state and identifying which courses fit within that definition is the inconsistency with which codes are applied at the local level. There is a secondary issue created by the disconnect between state-level data systems and local data systems. Further efforts (such as the one currently being undertaken by the CT team) to increase alignment and transparency in this process will be key to informing the development of future data collection processes. 3. Though this work demonstrated that it is possible to enable statewide collection and aggregation of data at a regional level, there is still additional work required to scale at a national level. This work should lead toward the development of a national BPC repository that not only showcases national-level data but also helps individual states identify their own lack of student diversity in CS education, building a case for BPC-focused educational policy. a. Even if the initial launch of a national repository does not contain all states, it is likely that if it contains a majority, others will be inclined to accelerate their data gathering efforts to be able to join.
BPC and social justice are a matter of national importance. By envisioning and creating data systems with a predefined BPC lens, the work begun in the NECMP can help state teams and, eventually, the nation more broadly understand the full spectrum of groups of people who are in (and absent from) computing pathways. Securing buy-in from the high-level stakeholders is needed to construct an effective BPC data system; diverse teams will naturally be poised to strategically propose and measure the impact of the policy needed for positive change in computing education.
Footnotes
Declaration of conflicting interests
The author(s) declared no potential conflicts of interest with respect to the research, authorship, and/or publication of this article.
Funding
The author(s) disclosed receipt of the following financial support for the research, authorship, and/or publication of this article: This work was supported by the Directorate for Computer and Information Science and Engineering (1822011).