
Abstract
Paper provides an attempt to create a methodology for automated structure health monitoring procedures using vibration spectrum analysis. There is an option to use autoregressive (AR) spectral analysis to extract information from frequency spectra when conventional Fast Fourier transformation (FFT) analysis cannot give relevant information. An autoregressive spectrum analysis is widely used in optics and medicine; however, it can be applied for different purposes, such as spectra analysis in electronics or mechanical vibration. This paper presents an automated structural health monitoring approach based on the algorithm-driven definition of the first resonant frequency value from a noisy signal, acquired from traffic-created bridge vibrations. We implemented the AR procedure and developed a peak detection algorithm for experimental data processing. The functionality of the proposed methodology was evaluated by performing research on six bridges in Vilnius (Lithuania). We compared three methods of data processing: FFT, filtered FFT and AR. Bridges vibrations under different excitation conditions (wind, impulse and traffic) in normal direction were measured using accelerometers. AR provided one peak representing the lowest resonant frequency in all cases, while FFT and filtered FFT provided up to 12 peaks with similar frequency values. Such results allow implementing our method for remote automated structures health monitoring and ensure structures safety using a convenient and straightforward diagnostic method.
Keywords
Introduction
Technical diagnostics, including monitoring, detection, and prognosis, has been an area of interest for researchers for many years. Despite numerous researches in this area, there are still many unanswered questions: which method is the best, how to automate all processes, and so on. According to the application type, there are two main directions of technical diagnostics: monitoring and diagnostics of rotating machinery, 1–4 and structural health monitoring (SHM), which is defined as a process of implementing a damage detection and characterisation strategy for various engineering structures. 5–8 According to the used technique, diagnostic methods can be divided into: destructive technique when maximum load or fatigue test of samples are performed 9,10 ; and non-destructive technique when the state of the structure is evaluated without causing damage to it. 11,12 Due to this advantage, the non-destructive technique has become the most common technique for technical diagnostics nowadays.
The selection of diagnostic method and its parameters depends on many circumstances (a type of structure, materials, available equipment, expenses, etc.), and each particular case can have an individual solution. Usually, for diagnostics are used: Visual diagnostics, Ultrasonic testing, Thermography; X-Ray testing, Eddy current; Electromagnetic Testing, Acoustic emission measurements, measurements and analysis of vibrations. 8,13–17 Comparing all mentioned methods can be stated that vibration analysis is one of the most universal and commonly used methods of technical diagnostics since it is suitable for diagnostics of rotary machinery and for SHM. 15 Moreover, these methods allow evaluating the state of the object of interest by various parameters obtained from the measurements of vibrations 18 under different excitation and payload conditions. 19 These vibration parameters analysis procedure is called Operational Modal Analysis (OMA), 20 which identifies the modal properties of a structure based on vibration data under its operating conditions. These modal properties of a structure are the natural frequencies, damping ratios and mode shapes. OMA covers many available methods, including spectrum obtaining procedures, filtering of the spectrum or selectively picking spectrum peaks for analysis. The most popular spectrum obtaining procedures, in addition to the Fast Fourier transformation (FFT) and Auto-regression analysis (AR) are periodogram, 20 MUSIC (Multiple Signal Classification) algorithm, 21 matched filtering, 22 Welch’s method, 23 Bartlett’s method, 24 SAMV (iterative sparse asymptotic minimum variance) 25 and a pitch detection algorithm (PDA). 26
Known and well-tested procedures often provide spectrum, which is not suitable for automatic spectrum analysis, especially in the case of transient vibration. Moreover, real sensor data signal often contains momentarily peaks, caused by external excitation rather than structural response. As a result, ‘fault’ frequency peaks appear in the spectrum and cannot be easily recognised using typical techniques.
Common bridge structural health evaluation methods deal with static deflections, and there is no dynamic content; dynamic methods deal with FFT, which is used for the validation of our method. More to say – we deal with running load over the bridge and obtain transient process rather than free not-disturbed natural vibrations. Therefore, many technologies, like periodogram and their derivatives here, have a poor basis for implementation. Analysing the transient process, FFT creates a lot of non-existent frequencies. The spectrum becomes unsuitable for automatic extraction of natural frequencies from actual vibration, represented as a sum of natural vibrations (altered in time with varying load form traffic), and exciting vibrations (chaotic excitement from bumps and passing mass). Another diagnostic method deals with steady vibrations without excitations or measures vibration amplitudes from real load cases that require special preparation and obstructs normal exploitation.
Generally, the task of this research can be expressed in two separate problems – finding the lowest resonant frequency of the structure and obtain rectified frequency value, independent from the environment and actual load impact.
The aim of this paper is to create a new methodology for automated structural quality evaluation and health monitoring of complex engineering structures based on natural frequency shift monitoring using the Autoregressive analysis (AR) method and automated peak detecting technique.
Formulation of the research
Obtaining natural frequency values
Most of the vibration-based diagnostic methods are based on detecting the natural frequency of the investigated object since the natural frequency is the essential parameter for structural health evaluation and damage prognosis. 27,28 The idea of applying modal analysis methods for technical diagnostics of the structure is based on the fundamental statements of vibration theory, declaring that the static deflection shape of the structure from its own gravitational force is proportional to the first natural vibration shape. Deflection values of structures from live and dead loads are also related to the first natural frequency of the structure. The higher carrying facility of the structure is indicated by higher first natural frequency, according to Rayleigh theorem. 29 Experimentally obtainable lowest resonant frequency, which, in case of low friction, could be estimated as first natural frequency, can be defined using theoretical or computation methods. 30 Evaluation of damping in researched structures is not required for proposed methods; even resonant frequency is always lower than natural frequency and can differ significantly in the case of big damping values. Usually, the damping of complex structures (buildings, bridges and heavy machines) depends on construction material, damping is below the critical level, and resonant frequency can be treated as natural with minor deviations. In such a case, the lowest resonant frequency of a structure corresponds to its static deflection, and this frequency is used as structure quality indicator. 29 In addition, structure monitoring techniques of bridges 29 or complex buildings require the initial test of structure to obtain reference parameters which latter will be used to compare it with operating one defining structure load limit and structure degeneration.
Dynamic analysis of light structures like bridges are well known and performed as a part of a dynamic behaviour test. 31–36 A typical procedure to obtain the structure’s resonant frequency is to measure vibrations in the time domain and proceed obtained results by applying Fast Fourier transformation (FFT) defining the vibrations spectrum. 36 Recent technical diagnostics applications, which use the change of natural vibration frequency as the diagnostic parameter, face the problem of extracting the natural frequency value from experimentally obtained vibration spectrum . 15,37 Difficulty in extracting the correct frequency from FFT generated spectrum is caused by the fact that dynamic response of the structure to excitation – wind, shocks and other impacts – consists from the excitation itself, dynamic structure response and ceasing of vibrations. 38–40 The resulting vibration spectrum contains multiple frequencies, and the natural ones are hardly distinguishable. Prove of the desired peak in spectrum requires additional analysis. In this case, implementing automatic diagnostics of structures became impossible because the change of excitation mode can generate overlapping frequencies. Another significant issue is vibration amplitude values in the vibration spectrum. Exists many real cases when expected frequency amplitudes became lower than accidental peaks; thus, the stability of spectrum amplitudes is also an important issue.
Another possible solution to perform a frequency-based vibration analysis is to apply the autoregressive (AR) technique. This idea came from, 41–46 where biomedical ultrasonic imaging spectra analysis was used instead of FFT. It was defined that the AR model gives better resolution and reduces bias and variance of scattered spacing estimates. The autoregressive technique demonstrates better resolution of sharp peaks in the ultrasonic picture. 47 When applied in biomedical ultrasonic imaging, it was found that resolution was improved, bias and variance of scattered spacing was reduced and greater resistance to ringing artefacts was observed. 41 Application of second-order AR model and Burg algorithm to biomedical ultrasound imaging data caused a shift of the centre frequency on echo signals. This frequency evolution versus measured depth in biological tissue was analysed. 42
The idea of an automated structure diagnostic system is based on the hypothesis, which includes mentioned statements and assumptions. Our proposal to apply the AR technique for the analysis of vibrations rather than FFT opens the possibility to create a new method for automated structural health monitoring based on vibrations output-only (without knowing the exact input exciting the system) measurements under various environmental conditions. The use of AR will allow obtaining a frequency spectrum of the vibrations with clearly defined peaks. This will provide the preconditions to implement an automated algorithm to detect and track peaks 48 , corresponding to the structure’s natural frequency. Research presented in 49 shows that AR can be successfully implemented for the time-frequency analysis of civil engineering structures. An idea to create automated SHM is provided in. 50–53 These approaches are based on modal analysis and frequency spectrum decomposition method. Therefore, they face correct peak recognition problems and use mathematical or machine learning-based methods to separate real peaks from noise. Comparing to them, AR eliminates the need for further complex analysis when frequency spectrum is obtained. Therefore, proposed method requires much less of computational power and can be more easily implemented using embedded electronics. Moreover, using the AR method, it is possible to minimise the amount of data obtained from vibration analysis.
Rectifying frequency value from ambience influence
The use of the AR technique to estimate natural frequency value allows the implementation of various machine-learning methods for the analysis of vibration spectrum in order to define frequency components and create models for structural health evaluation and damage prognosis, similarly as in.
54–57
In general, the vibration of the bridge could be described by Lagrange II type equations

The additional new variable is denoted to normalise and transform second order differential equation (1) to the first order. As a result, the vector of coordinates and their derivatives gets a form

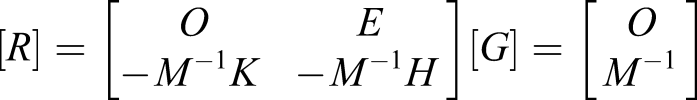
The combination of (1) and (2) equations allows to define the system in the normalised form
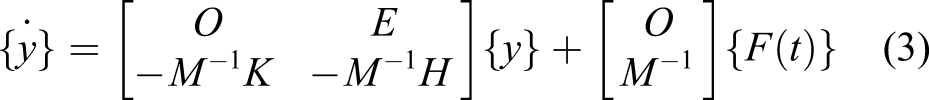
By noting
The equation gets form

It is known from vibration theory and linear algebra that eigenvalues of matrix [R] are characterising roots of the analysed system (equation. (1)).
Eigenvalues of the matrix found as a complex form
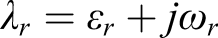
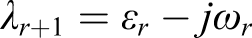
The system’s natural frequency depends on changes of values of elements in the matrices [M] and [K]. These changes are caused by environmental factors, such as temperature, humidity and additional load from the snow. Temperature and a load of snow affect the bridges internal stresses, which is related to system stiffness. The load caused by snow or environmental humidity affects the bridge mass, which influences elements values in the mass matrix [M] (equations (3) and (4)).
Although the internal behaviour of structure from ambient conditions remains unknown or requires unique research, we suppose to use the machine-learning approach to bypass such analysis. Using a machine-learning algorithm without a model, we can eliminate or at least minimise environment influence to the bridge resonant frequencies and thus obtain the latter as its quality parameter. In this case, our proposed method allows us to collect data from long-period observations and decide on the lowest frequency shift during a significant amount of time – a year or more. In opposite, a fast frequency drop will signal the situation when attention to the bridge structure is necessary.
Our proposed methodology is presented as the algorithm in Figure 1. A automatic SHM algorithm consists of four main steps. The first step is data collection in a significant amount of time. During this procedure, vibration measurements of the bridge under various weather and load conditions should be performed. The result of this measurement will be a set of data representing the variation of vibration acceleration amplitude in respect of time under varying conditions. In the second step of the algorithm, the data conversion procedure from the time domain to the frequency domain should be performed. For this conversion, we offer to implement the autoregressive analysis. The third step of our methodology requires implementing an automated peak detection algorithm (Figure 1(b)), which extracts a single value of natural frequency in the desired frequency range. The last step performs the implementation of the ML algorithm for the analysis of obtained results and extraction of natural frequency values. Algorithm of the bridge quality evaluation: (a) composition of the algorithm and (b) algorithm of an automatic peak detection.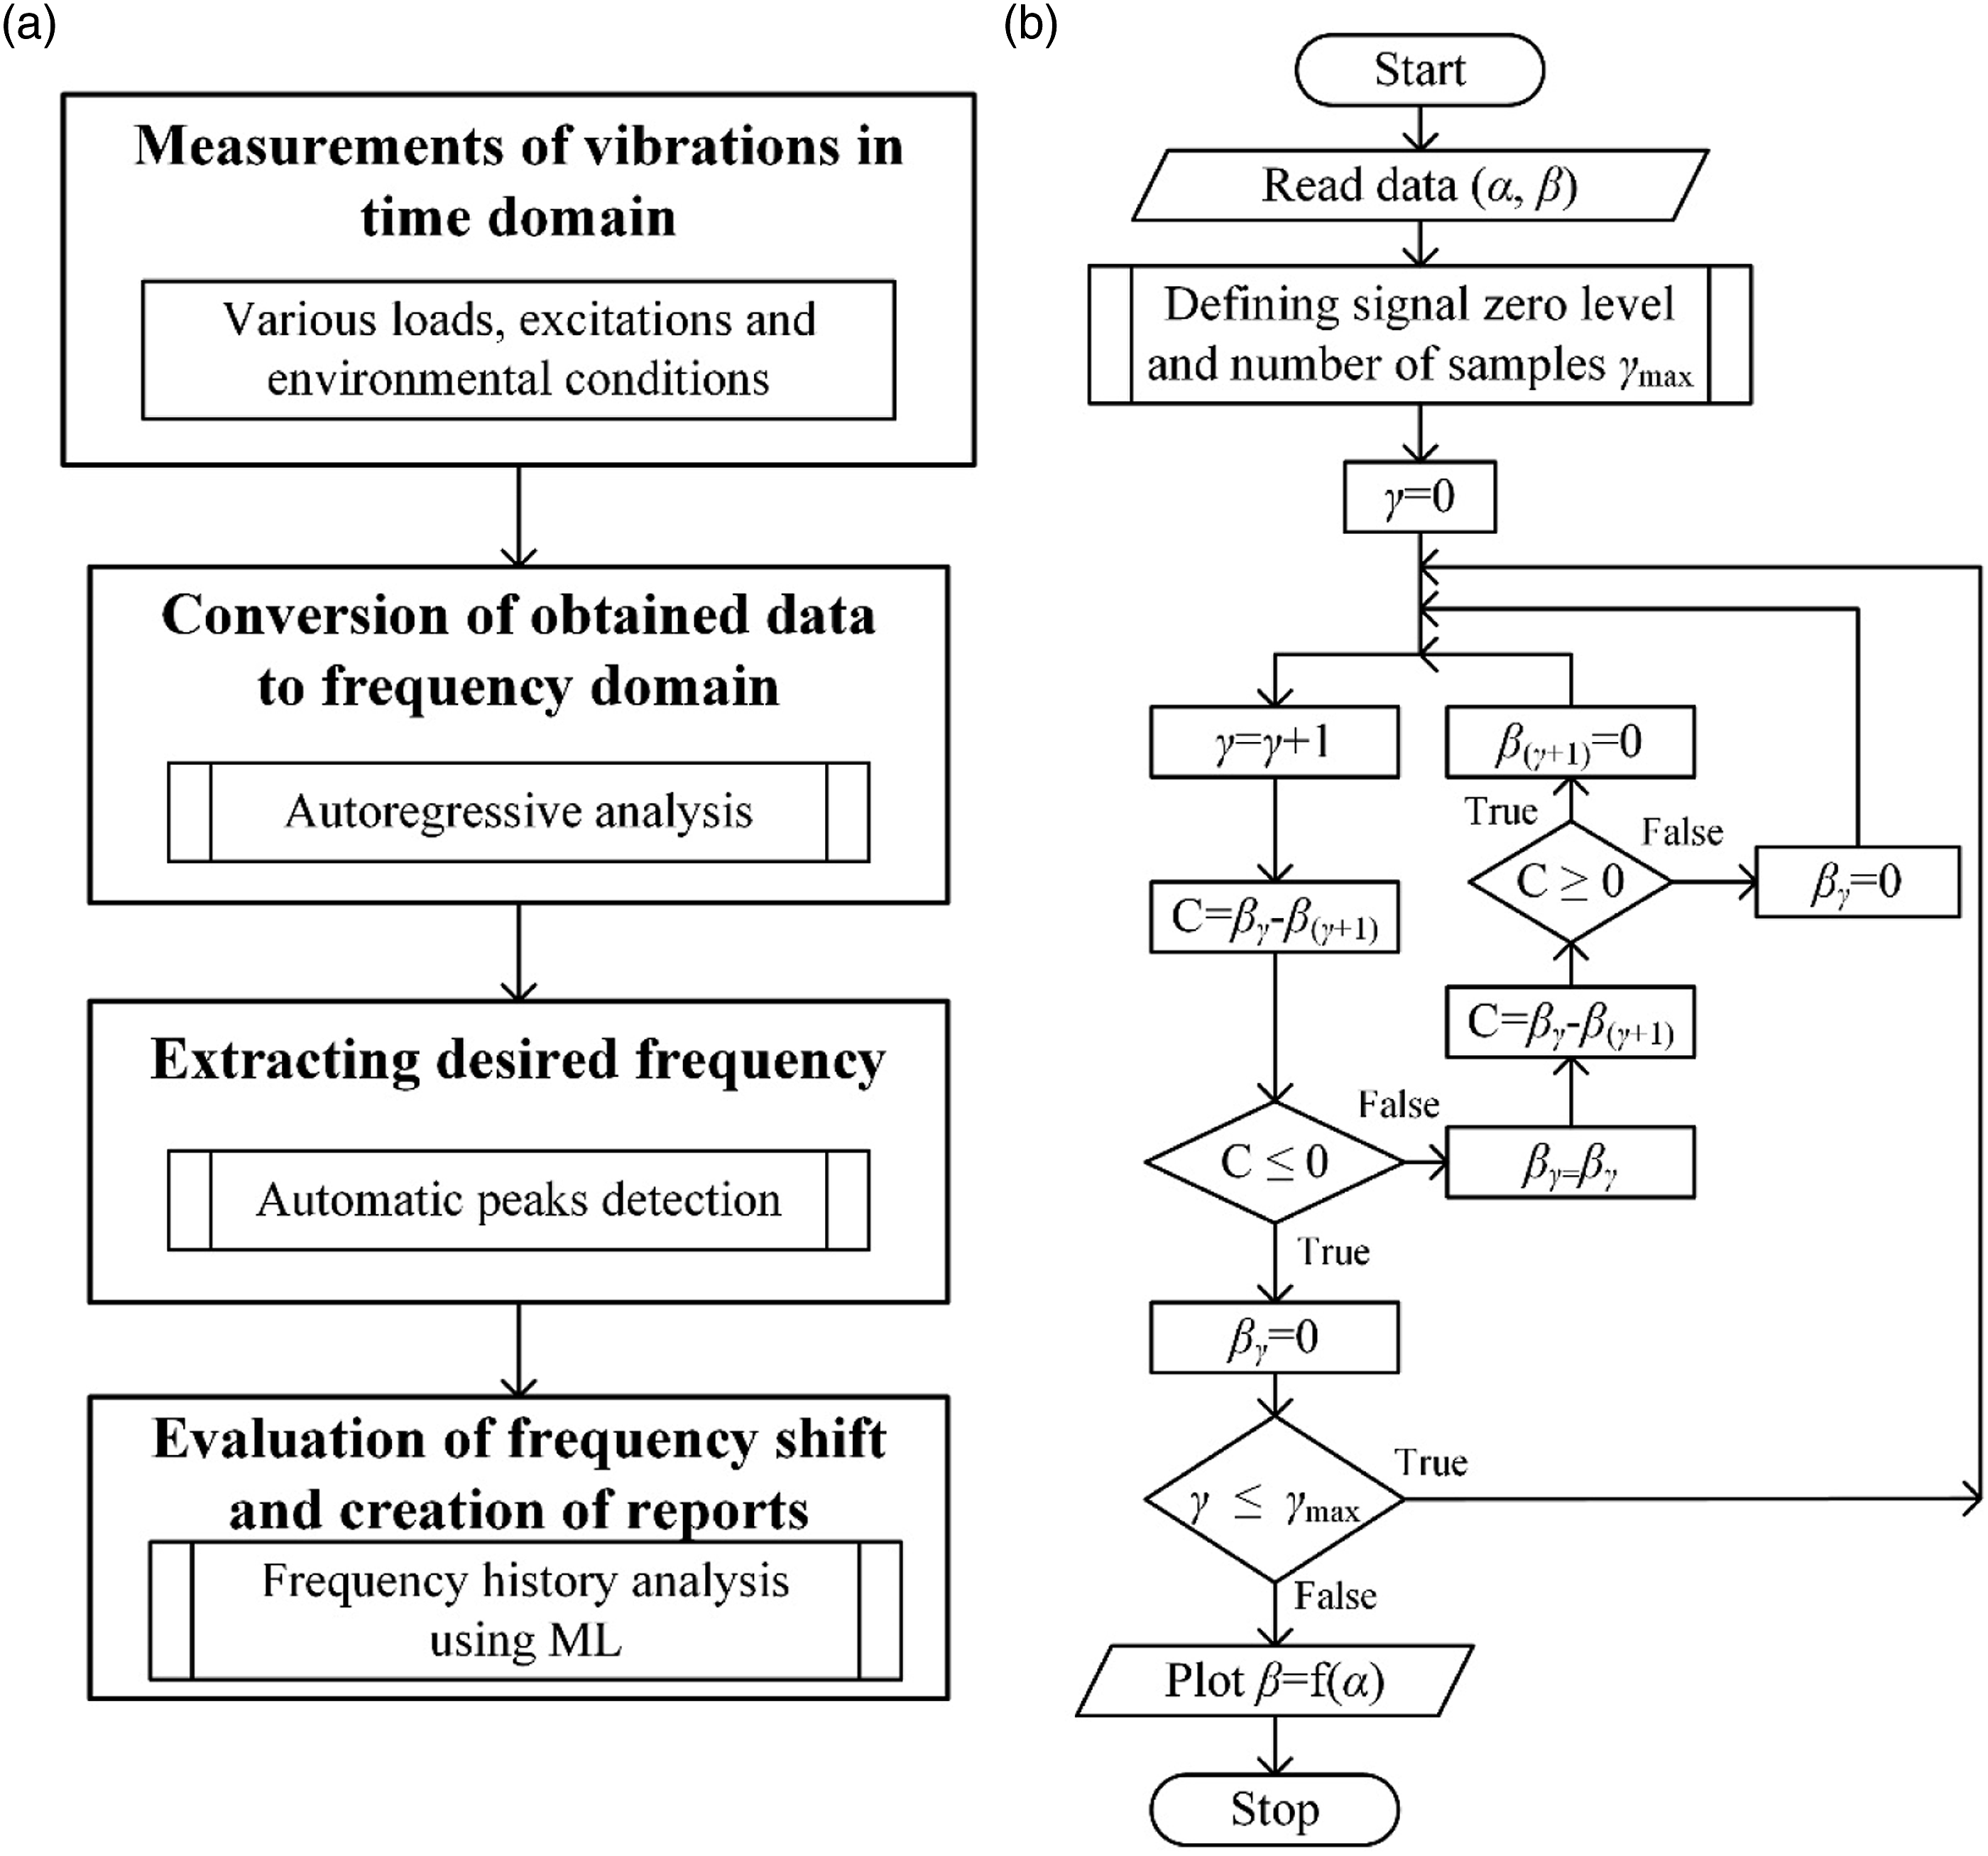
Experimental research
To prove the functionality of our proposed automated SHM methodology, we performed a set of experiments with real objects. Those experiments had several aims: (i) to prove the possibility of successful implementation of autoregressive analysis for the vibration spectrum determination in the field of mechanical engineering, providing much clearer results comparing to traditional technique (FFT) used in this field; (ii) to prove the efficiency of proposed peak detection algorithm from frequency spectrum; and (iii) to prove the possibility of implementing ML-based analysis to extract true natural frequency from vibrations measurement performed under unstable conditions of excitation and load.
Bridges under investigation
Main parameters of bridges.
Experiments
Vibration measurements of the bridge were performed using a vibration measurement system, consisting of accelerometers Ini 603C01 (PCB Piezotronics, Depew, USA) with a measurement range of 0.5 … 10,000 Hz, (spectral noise of 8 μg/√Hz (10 Hz), acceleration limit of 51 g), data acquisition system NI USB-4432 (National Instruments, Austin, USA) and computer with LabView software (Figure 2). Two sensors were fixed to the structure of the bridge using magnetic pads. They were mounted in the middle of the bridge span in the vertical and horizontal directions. Sensors mounting place were selected, considering bridge properties and expecting that the highest acceleration values would be obtained in the middle of the span. The experimental arrangement on Zveryno bridge: 1 – bridge span, 2 – attached sensor, 3 – data acquisition system, and 4 – computer.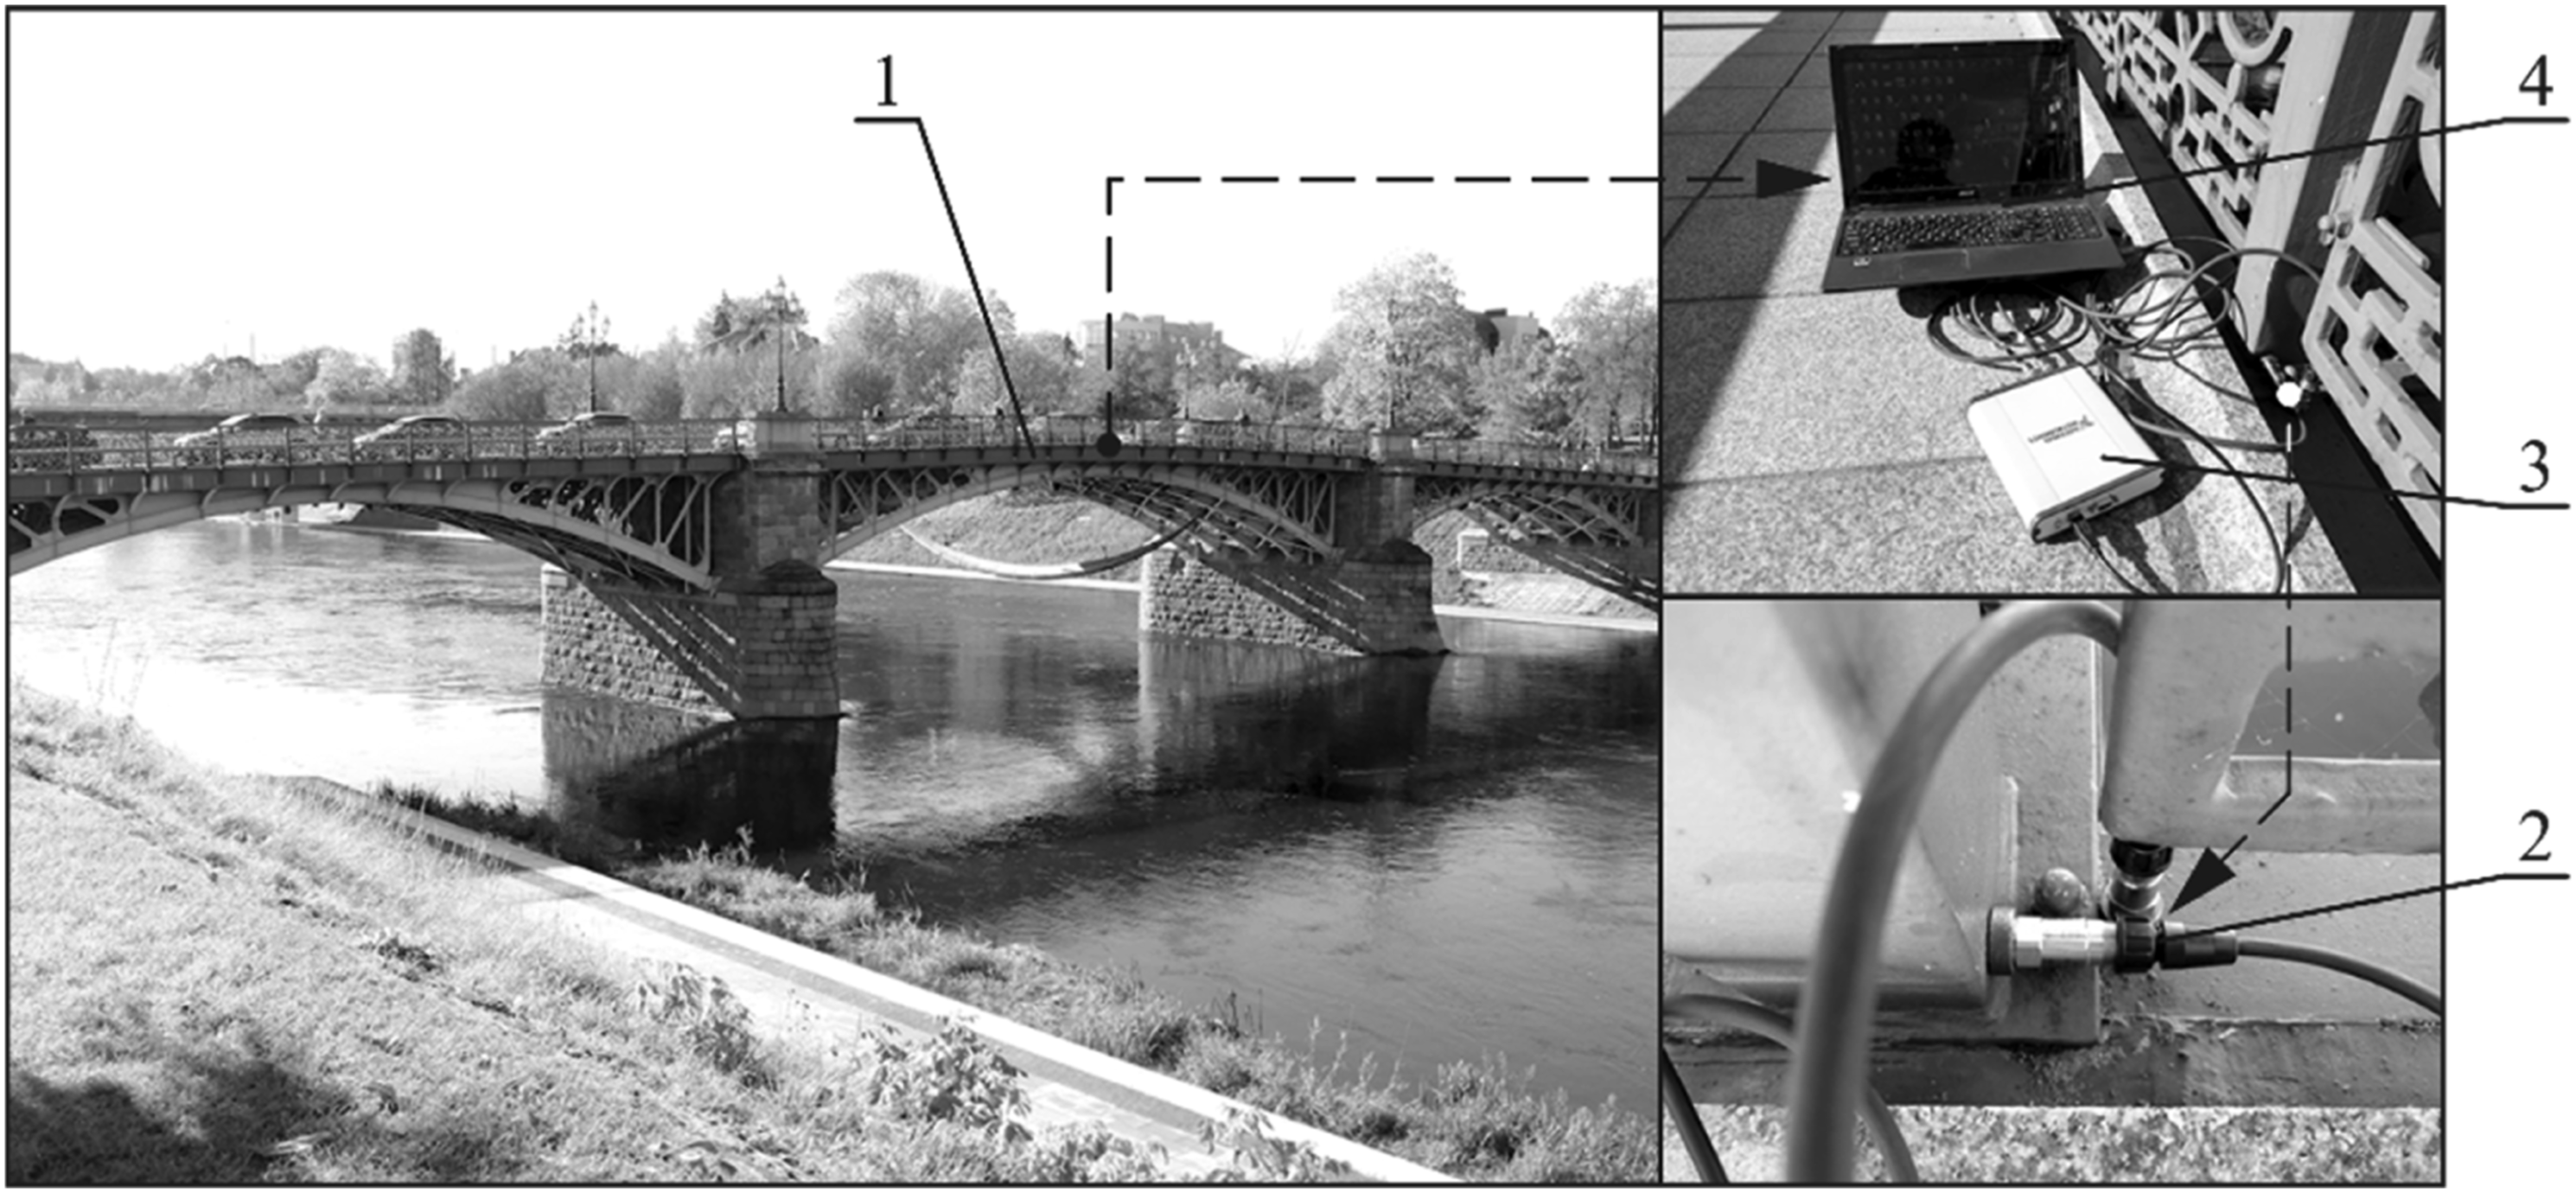
The signal sampling rate in the measurement system was set to 20 kHz, that’s far higher than the highest frequency, which we can expect in the bridge vibration spectrum where a typical limit for the frequency is up to 100 Hz. In this case, frequency resolution error remains negligible in the interested frequency range.
The same measurement technique was applied to all researched bridges. Vibrations were measured under various cases of payloads (empty bridge, static load created by stopped cars, randomly varying dynamic loads from passing cars and trucks) and excitations (environmental excitation from wind, forced excitation produced by the jump of the human).
Signal processing
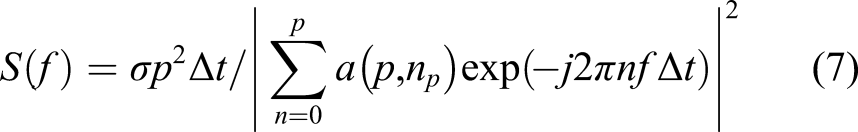
We applied three different signal processing methods for the experimental data, measured by accelerometers (Figure 3). We used FFT (equation (5)), FFT analysis with additional filtering (equation (6)) in the frequency domain (FFT + filter), and AR (equation (7)) to get the vibration spectrum. Typical experimentally obtained data. Bridge ‘Zveryno’.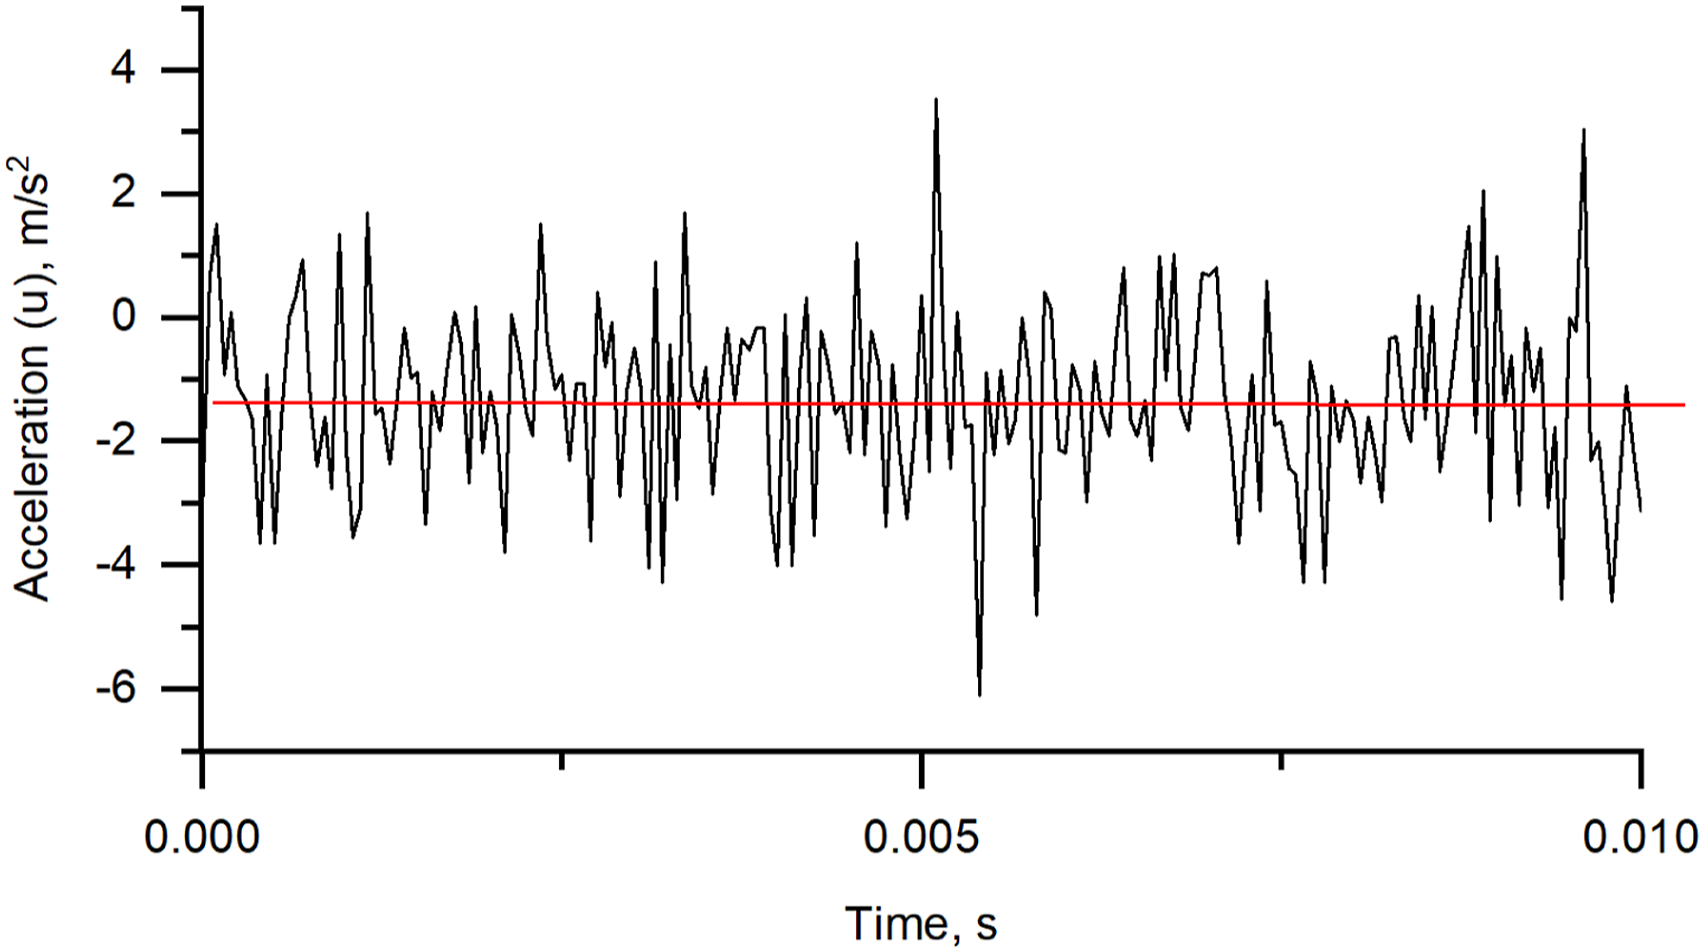
FFT analysis was performed using discrete Fourier transformation
60
procedure in Matlab
61
according to the equation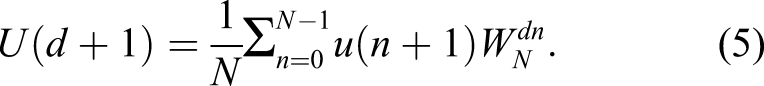
For filtering the FFT spectrum, the smoothing procedure in Matlab based on the Savitzky–Golay method was applied.
62,63
This method is defined as generalised moving average filtering (equation. (6)), where filter coefficients are determined by performing unweight linear least-squares fit using a polynomial of a given degree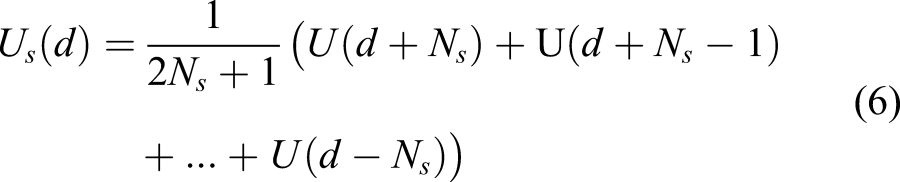
In our case, we used 15 data points of moving average and polynomial of sixth degree. These parameters were determined experimentally. We found that increase of an order of polynomial magnitude brings no increase in accuracy. Therefore, we limited it by 6. Filtering lag, defined by the number of data points, was determined using Bias–variance trade-off procedure.
The auto-regression procedure was processed using the AR model (equation. (7)) with the Yule–Walker procedure in MatLab. The autoregressive analysis involves a selection of the appropriate model order and estimation of model parameters from the available data. The power spectrum was calculated
64
Example of the frequency spectrum obtained from raw data from measurements of Zveryno bridge by using listed methods provided in Figure 4. Comparison of two signal processing ways: (a) FFT, 1 – FFT spectrum, 2 – filtered FFT spectrum, and (b) auto-regression of the same raw data.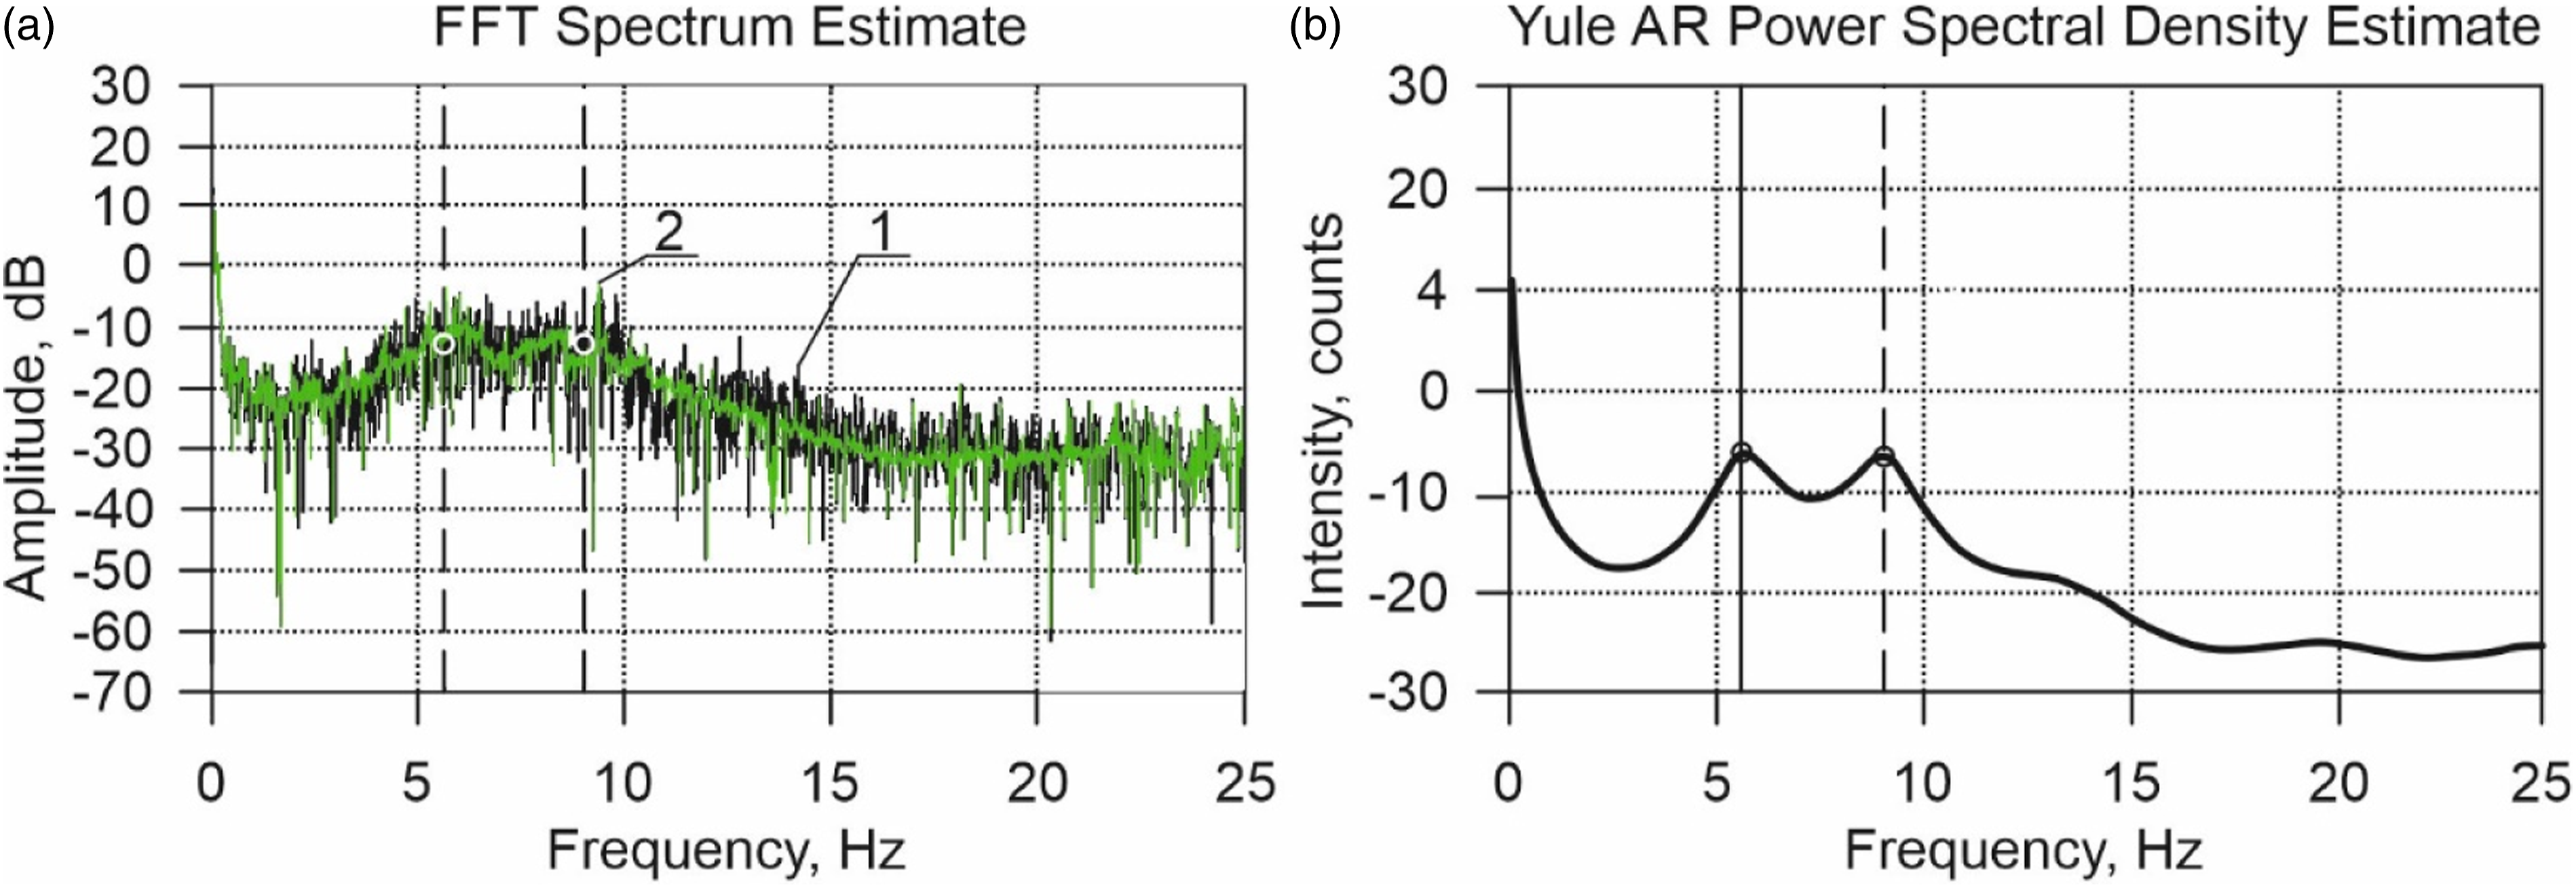
FFT retrieves frequency values of all vibrations that occurred in the bridge but picking essential resonant frequencies from the graph remain impossible (Figure 4 (a)) due to ambiguity of the picture. Filtering of FFT data improves situation, nevertheless, the filtered spectrum still has many peaks, therefore, definition of the resonant frequency is complicated. AR procedure provides completely different results; in the obtained vibration power spectrum, first (6 Hz) and second (9 Hz) resonant frequencies are clearly seen (Figure 4 (b)). Although the spectrum shows clearly expressed peaks, still it is not clear which peak represents the true first natural frequency. To define the correct peak, firstly, it is necessary to determine the range of interested frequency values and extract peaks from this range. Selection of the required frequency range based on the technical documentation of the object under investigation, 65,66 but we defined it by performing additional research determining the resonant frequency of the object. 35,67
After converting measurements results into the frequency domain and obtaining vibration spectrum, for further signal processing, we implemented a peak detection algorithm (Figure 1 (b)) to retrieve values of resonant frequencies. This algorithm is based on the analysis of signal amplitude variation. It provides a transformed spectrum where spikes under exact frequency represent peaks (Figure 5(b)) from the previously obtained spectrum. Comparison of three signal proceeding ways: (a) vibration spectrums and (b) spectrums processed by peak detection algorithms (Fig 1 (b)). The experiment was performed on the Liubarto bridge.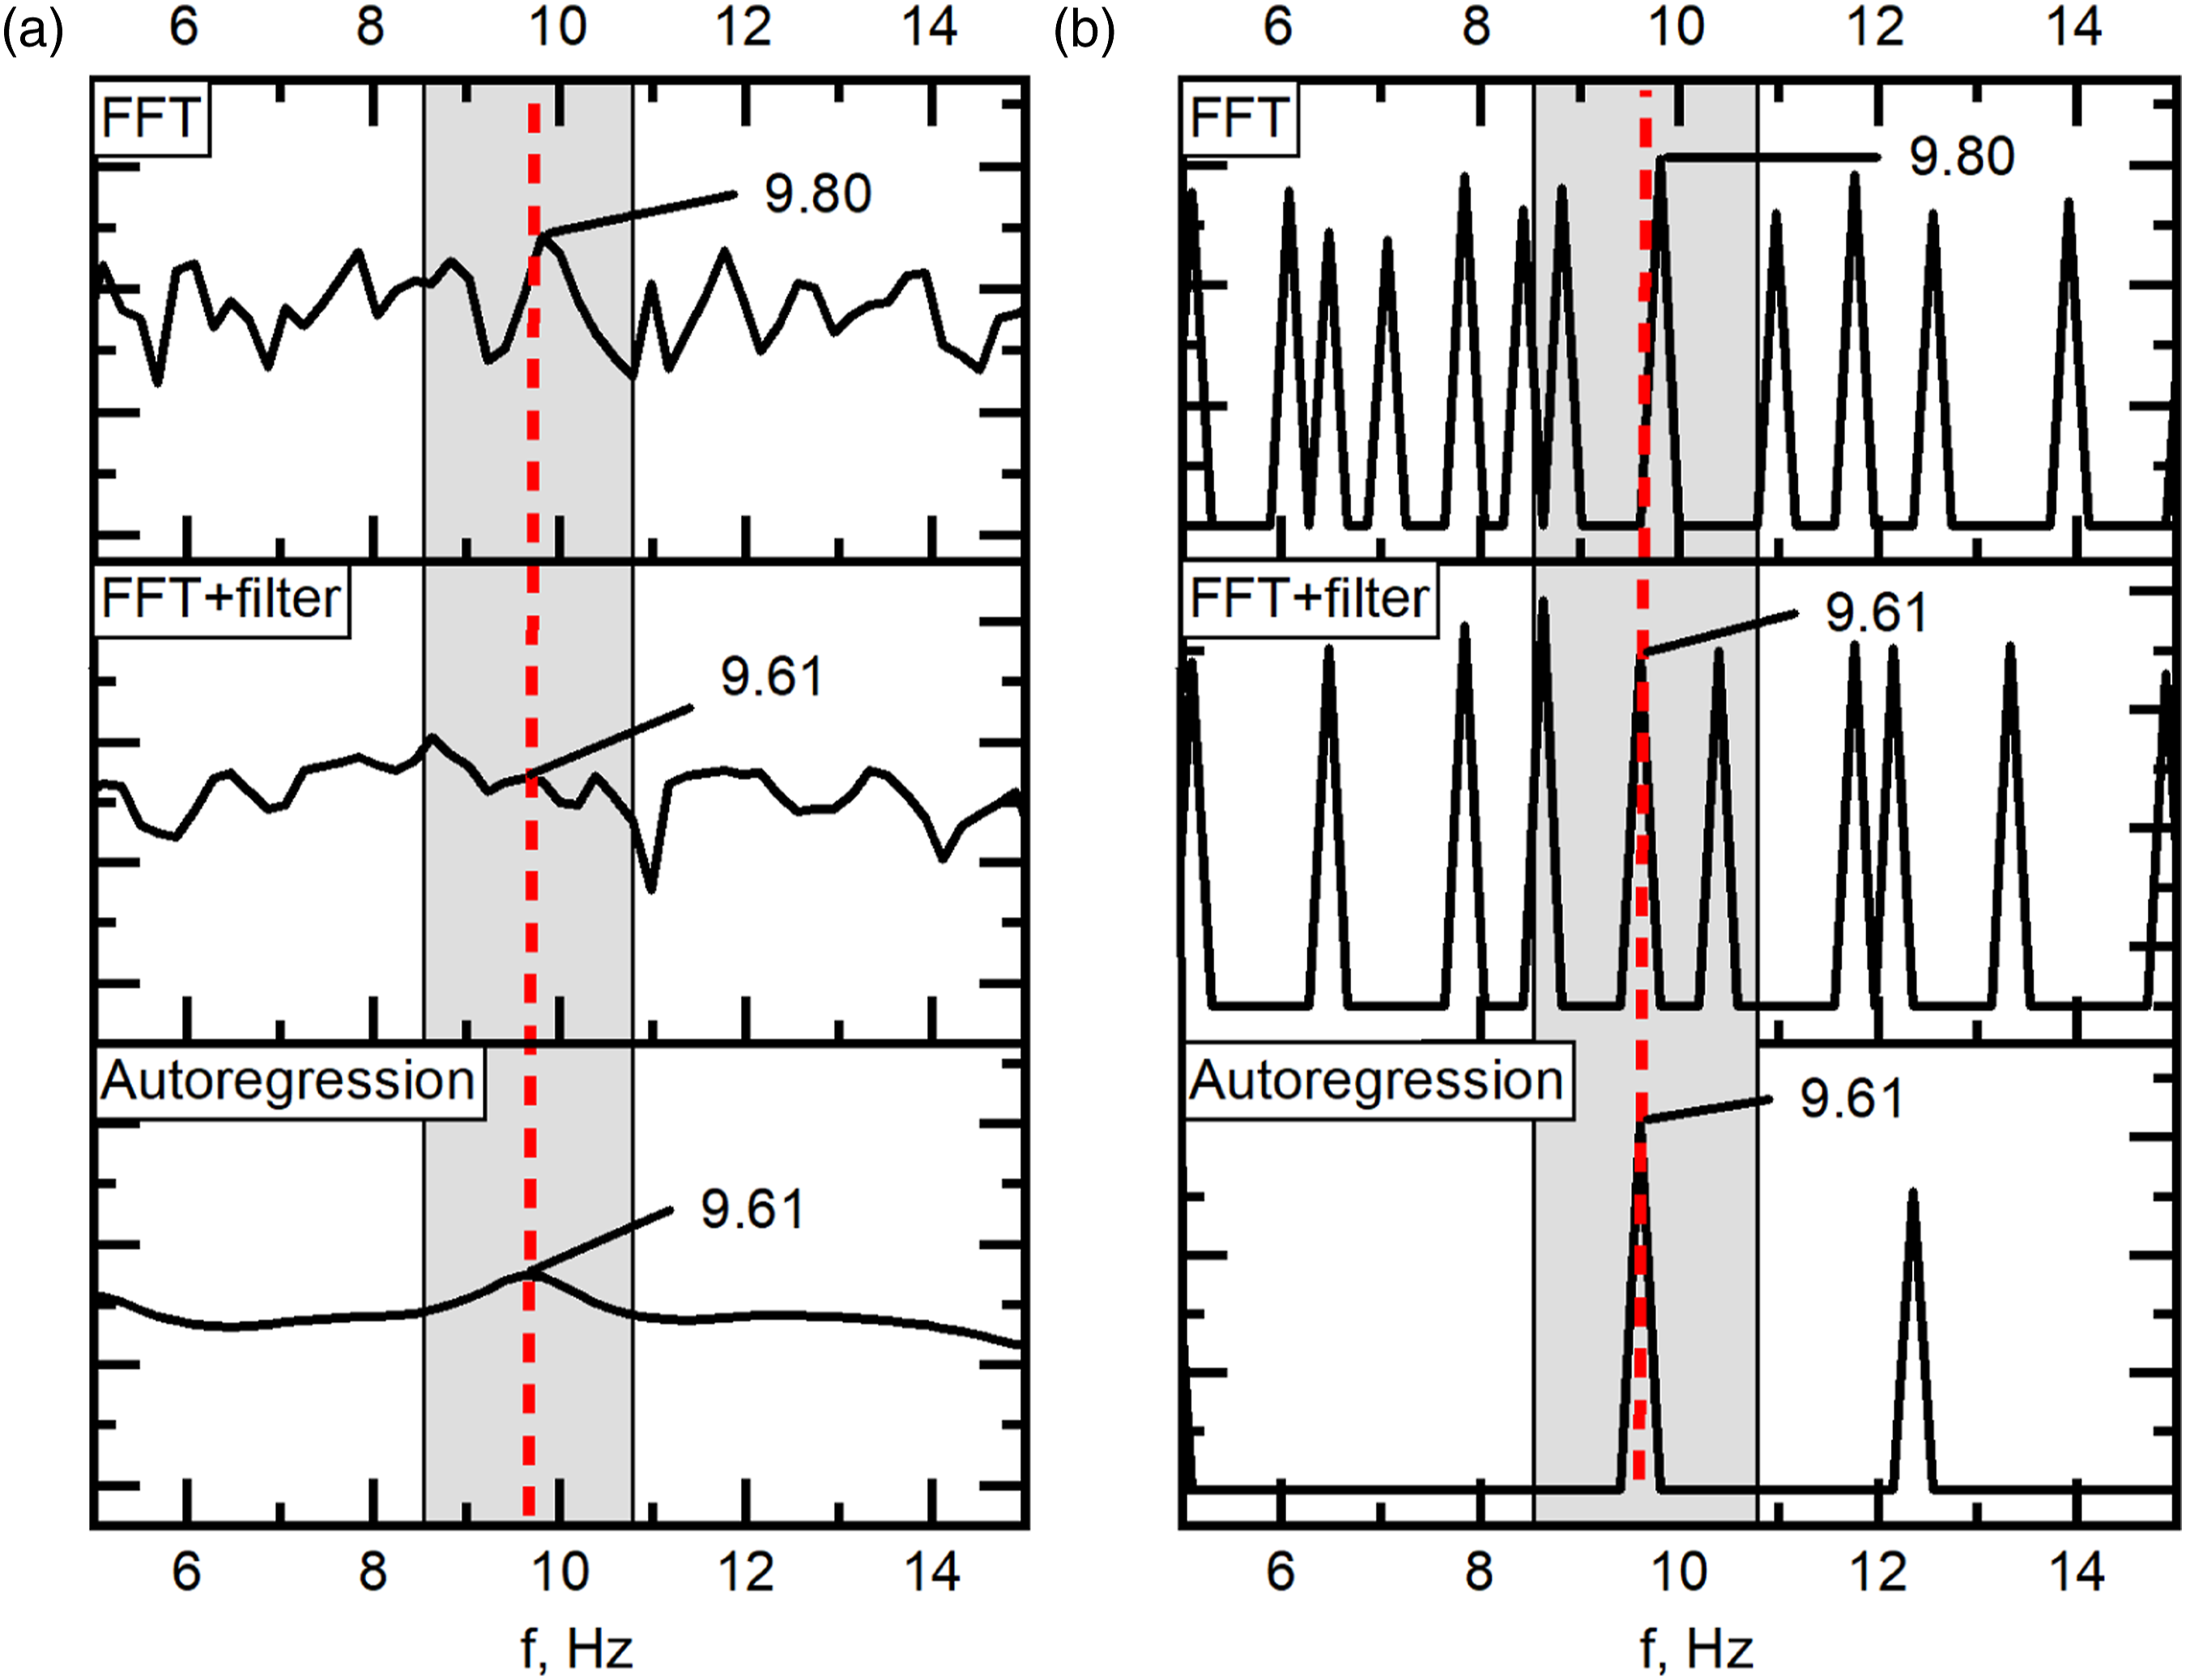
After this procedure that corresponds to the third step of our proposed SHM algorithm (Figure 1(a)), we can declare that the required peak is recognised and its frequency value is defined. But the problem is that frequency value depends on different excitation and load conditions persist. In this case, manual or computer-based algorithms cannot identify frequency shift sources. Therefore, it is unclear which effect influences frequency shift: environment change or degeneration of bridge structure. This issue could be solved by implementing the machine-learning (ML) technique to analyse a large amount of data to define relations between weather, load conditions and frequency shift to eliminate their effects. ML-based data analysis algorithm could automatically detect natural frequency shifts and monitor their changes for a certain period.
It is essential to note that the application of ML for data analysis is not unambiguous and strictly defined. First of all, to realise ML-based data analysis, it is necessary to get information about weather and traffic conditions. Information about weather conditions could be collected by mounting meteorological stations near the object of interest or using freely available online databases. The network of installed traffic cameras could provide data about traffic conditions. Secondly, determining the most suitable ML-based data classification technique requires additional research and the collection of a huge amount of experimental data. Regarding the mentioned issues, we are considering the implementation of ML as a separate research object that goes beyond the scope of this report.
Results and Discussions
Analysing the behaviour of the bridge or other engineering structure, the main structural properties diagnostic parameter is the first resonant frequency since it shows the behaviour of bridge dynamics and allows us to acquire information about bridge quality. 29 Calculated first lowest frequency is a first resonant frequency, which, if friction is very low and can be neglected, could be equal to first natural frequency. 68 By Rayleigh theorem, the frequency of system vibrations is decaying together with stiffness 30 ; therefore, all amplitudes of other following frequencies should be lower than the first one.
Figure 5(a) shows the response to wind caused excitation of empty Liubarto bridge, obtained by all three analysed methods. It is seen that in the spectrum received using FFT, there are many peaks, and even in the range 8.5–10.8 Hz, there are two peaks (8.9 Hz and 9.8 Hz) that could be considered as resonant frequencies. In the same case, filtered FFT shows even worse results – three clearly undefined peaks (8.6 Hz, 9.6 Hz and 10.5 Hz) in the same range. In this case, the filter implementation caused minimisation of amplitude variations and shift of peak frequencies to the lower side (from 9.8 Hz to 9.6 Hz compared to FFT). Such results suggest that using a filter would be appropriate only in cases where we have clearly expressed peaks in the FFT spectrum. Overwise filtering could create some mismatch. AR gives completely different results throughout the range from 6 Hz to 14 Hz – it obtains only one peak (9.6 Hz). Results obtained applying peak detection algorithm (Figure 5(b)) shows all automatically detected peaks expressed as separate spikes. In the case of the AR procedure, the peak under 12.3 Hz is detected, which was not well defined in the original AR spectrum. This peak could be assumed as an indication of parametric vibrations, not related to natural frequencies since the amplitude of higher frequencies is much lower due to damped oscillations. Detection of weakly expressed peaks proves the validity of our proposed algorithm and its usefulness for the automated AR spectrum analysis; especially when, it is challenging to manually identify sloppy peaks representing low vibration power regions in the spectrum.
To prove that the proposed method is suitable for the determination of first resonant frequency under various excitation cases, we performed research on six bridges, which represent complex structures of different designs. From all sets of obtained results, we focused our point of view on the three types of mostly frequent excitations types (empty bridge excited by the wind; impulse excitation caused by the jump of human; excitation caused by the moving traffic). Such excitation cases were chosen due to our intent to evaluate the impact of the live load on the structure (empty and loaded).
Summarised research results.
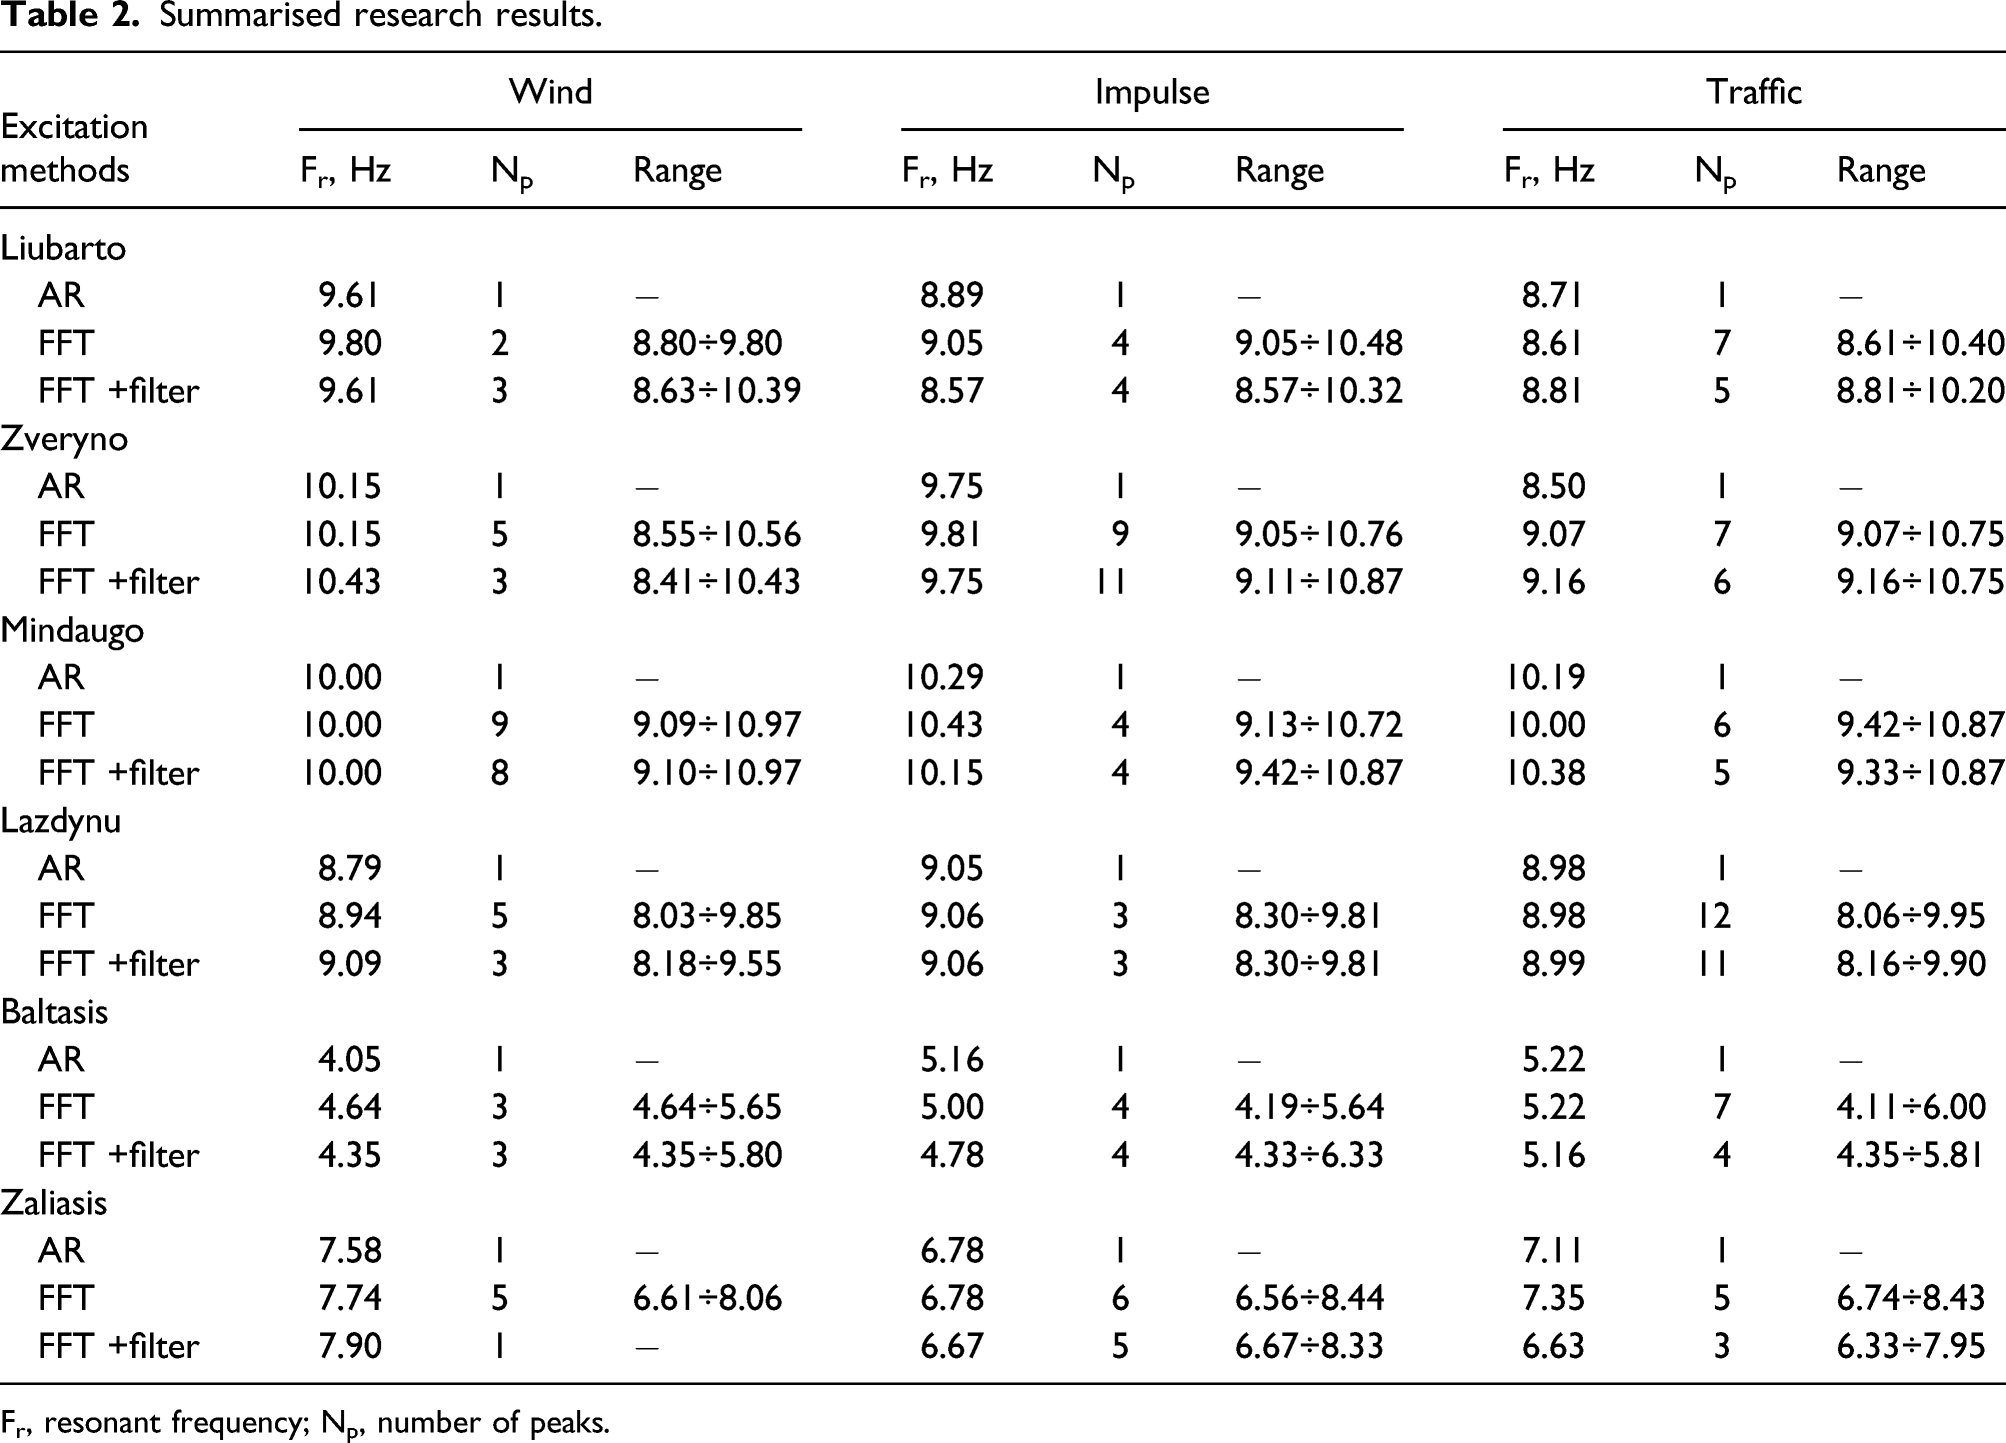
Fr, resonant frequency; Np, number of peaks.
For each excitation case, we provide three parameters that characterise the obtained results. Each line of the table contains the value of the main peak representing the first resonant frequency (F r ), the number of peaks (N p ), that appeared in the frequency range of the interest and the frequency range between those peaks.
From the results provided in Table 2, it is seen that in all researched cases, the AR data processing method gives only one resonant frequency value, while FFT gives up to 12 possible values. Filtering of FFT sometimes minimised the number of possible values, but in all cases, it was more than one and even reached up to 11. Moreover, it is seen that filtering gives unambiguous results. In some cases, it generates significant errors comparing to direct FFT (up to 0.48 Hz); in other cases, it minimises the number of peaks by one or two.
Vibration spectrum from the Liubarto bridge (Figure S1), obtained using all three methods provide similar results. The highest difference of first vertical natural frequency was 0.48 Hz between FFT and filtered FFT spectrum in the case of impulse excitation. This difference can be considered as a filtering error of low-pass filter. FFT and AR methods showed the same tendency of obtained resonant frequency value variation regarding the excitation conditions. The highest value (AR 9.61 Hz, FFT 9.80 Hz) was obtained when the bridge was excited by the wind; the lowest value was obtained when the bridge was loaded by the passing vehicles (AR 8.71 Hz, FFT 8.61 Hz). The different bridge stiffness in transverse and normal directions could explain the difference between the response to the wind and impulse excitation (AR 0.61, FFT 0.75). The wind mostly acts on the side of the bridge while impulse acts in the normal direction.
Results from the Zveryno bridge (Figure S2) shows a similar tendency: the highest resonant frequency values (10.15 Hz) were obtained when the bridge was excited by the wind. The lowest resonant frequency was defined when the bridge was loaded and excited by cars (AR 8.5 Hz, FFT 9.07 Hz, FFT+filter 9.16 Hz). Correspondingly AR provided one peak for each excitation case comparing with nine peaks from FFT and 11 peaks obtained in the filtered FFT spectrum. Peaks number increase after filtering could be caused by the nature of the implemented filter. In this case, the moving average filter shifted the peaks, and as a result, more peaks were detected in the range of the interest.
Investigation of Mindaugo (Figure S3) and Lazdynu (Figure S4) bridges provided more exciting results; in all cases, AR provided one peak for each excitation comparing with 12 peaks from FFT and 11 from filtered FFT. However, bridge responses for different excitations showed unexpected results. Higher resonance frequency values were obtained analysing the response to impulse (10.29 Hz) and traffic excitation (10.19 Hz) comparing to the wind (10.00 Hz). Lazdynu bridge showed 9.05 Hz, 8.98 Hz and 8.79 Hz, respectively. Such results may have been obtained due to the structural features of the bridges; it is a guess that there are insufficiently loaded elements in the structure. When the bridge is loaded, it slightly deforms, therefore joint gaps are closed, and the overall stiffness of the bridge increases. This assumption is also confirmed by the finding that all three data processing algorithms show the same trend, only the detected frequency values differ.
Analysing results of pedestrian bridge Baltasis (Figure S5) a similar tendency was found: 5.22 Hz for the loaded bridge, excited by traffic, and 4.05 Hz for unloaded excited by the wind. Such results may be affected not only by structural defects but also by the bridges length and their resistivity for the side winds. In order to more accurately assess the behaviour of the bridge structure and determine the cause of the atypical dynamic response, it is necessary to perform long-term research under various conditions.
Results from Zaliasis (Figure S6) bridge were quite typical. The highest resonance frequency value obtained then the bridge was excited by wind (7.58 Hz), lowest when it was excited by the impulse (6.78 Hz).
Summarising all performed research, we could state that our proposed method for automated structure health monitoring, based on AR and automated peak detection algorithm implementation, proved its efficiency. All the experimental data, processed by AR methodology, gives the lowest resonant frequency independently of the type of excitation. Thus, this methodology can be used in light structures, where monitoring and diagnostics are needed, and the FFT procedure does not give accurate diagnostic information.
Practical implementations of the proposed method require independence of diagnostic parameters to the exciting vibration mode. Typically for the case of the automotive bridge, it can be (i) jump of a human, (ii) truck drive, (iii) column of cars and (iv) wind (empty bridge), therefore the implementation of FFT requires knowing the spectrum of excitation, otherwise close resulting frequencies can nullify the diagnostic results.
The proposed method for the structures and bridge monitoring and early defect finding has prospective for real implementation as providing real values of resonant frequencies, which can be treated as natural with very small error for under critical damping vibration systems. The first lowest frequency shows the behaviour of structures (bridges, buildings, etc.) dynamics and allows us to acquire information about structure quality.
AR procedure with adjusted parameters accounts multiple periods of vibrations and provides resulting frequency average as max power of lowest vertical resonant frequency. Using the FFT procedure, similar situation is not possible, while each frequency is accounted for, and their amplitude is expressed as a point in the spectrum. In this case, AR provides reliable frequency because momentarily obtained spectrum pictures are retrospectively integrated with previous vibration periods. In case of significant load fluctuation on the bridge, which influences resonant frequency, spectrum peak will provide a mostly occurred frequency.
Comparing our approach to existing techniques, we can state that periodogram and its derivatives are valid for steady-state vibration situations and well works finding deviations from leading frequency. Therefore, it is possible to have high sensitivity. However, in the case of transient mode, this method is not efficient. FFT – superior tool, accurate and fast, but in this task momentarily spectrum contains components, preventing spectrum analysis (recognising right frequency from neighbouring ones), and this especially covers the case of automatic spectrum analysis in SHM. Finalising – in the case of steady-state vibrations, the AR procedure provides similar results as other methods, but it better suits to analyse transient processes.
Conclusions
We proposed a novel methodology for automated SHM based on the implementation of AR and an automated peak detection algorithm. The proposed method allows retrieving resonant frequencies, which indicates the quality of bridges or other structures using real (wind, impulse and traffic) cases of structure excitation. Comparing to the traditional FFT and discrete FT analysis, the implementation of the AR procedure is much more promising in distinguishing the first resonant frequency from the obtained vibration spectrum. The methodology consists of simple procedure: measuring the vertical vibrations of the bridge span, and signal processing using the AR model with automated peak detection. The evaluation of bridge condition is based only on monitoring of lowest resonant frequency. Therefore, the signal can be directly processed. Moreover, the excitation type is not important using AR since this procedure extracts resonant frequency from several types of excitations: human jump, car riding or wind.
In all researched cases, our proposed method provided one peak, while FFT and filtered FFT offers up to 12 peaks with similar values in the range of less than 2 Hz.
Furthermore, the proposed method has proved its sensitivity. We detected the shift of resonance frequency of investigated object caused by the varying live load conditions. Using AR procedure, the frequency spectrum of unloaded Liubarto bridge excited by the wind provided peak of 9.61 Hz, while excited by the passing vehicles provided peak at 8.71 Hz frequency. The Zveryno bridge excited by the wind provided 10.15 Hz, by cars – 8.5 Hz frequency value. Mindaugo bridge responses for different excitations provided peaks at 10 Hz and 10.19 Hz for the wind and traffic excitation, respectively. Lazdynu bridge showed peak at 8.79 Hz from the wind, and 8.98 Hz from the traffic excitations. Pedestrian bridge Baltasis showed peak at 4.05 Hz for the unloaded bridge, excited by wind, and at 5.22 Hz for the loaded bridge, excited by traffic. Results from Zaliasis bridge showed peak at 7.58 Hz when bridge excited by the wind, and 5.22 Hz – by the traffic.
Also, our developed peak detection algorithm showed its functionality. It correctly detects slopy peaks, even if they are hardly noticeable for the human eye. Our method allows monitoring the health of the structures using an automated procedure. Since it is possible to obtain the lowest natural frequency of the structure directly from the vibration power spectrum, and shifts of resonance frequency values could be registered automatically. Such monitoring allows ensuring the safety of the structure by convenient and straightforward diagnostic methodology.
Moreover, the proposed method does not require regular operator supervision due to implemented automated peak detection algorithm. This feature allows using such a system for long-term automatic structure health monitoring in remote or hardly accessible areas, especially taking into account that accelerometers and data transmitters could be powered using various vibration energy harvesters. In urban regions, the proposed method has superior application perspectives; here, it is possible to collect vibration data and relate it with traffic and weather conditions using data fusions algorithms. Traffic conditions could be obtained from city safety cameras, weather conditions from installed metrological stations. The creation of a unified monitoring system would provide comprehensive information analysis capabilities, allow to perform structures health monitoring and detect its changes in the initial stage.
The proposed methodology showed broad implementation perspectives, and we plan to continue its development in the future. There are two directions for further development. First, to test its efficiency by performing long-term structural health monitoring in automated mode. Second, to implement sensor data fusion algorithms to combine SHM, weather and traffic conditions monitoring system to obtain a more precise evaluation of reasons causing shifts of resonant frequency value.
Supplemental Material
sj-pdf-1-shm-10.1177_14759217211061518 – Supplemental Material for Automatic quality detection system for structural objects using dynamic output method: Case study Vilnius bridges
Supplemental Material, sj-pdf-1-shm-10.1177_14759217211061518 for Automatic quality detection system for structural objects using dynamic output method: Case study Vilnius bridges by Vytautas Bucinskas, Andrius Dzedzickis, Nikolaj Sesok, Igor Iljin, Ernestas Sutinys, Marius Sumanas and Inga Morkvenaite-Vilkonciene in Structural Health Monitoring
Footnotes
Declaration of conflicting interests
The author(s) declared no potential conflicts of interest with respect to the research, authorship, and/or publication of this article.
Funding
This project has received financial support from the Research Council of Lithuania (LMTLT), Nr. P-LLT-21-6, State Education Development Agency of Latvia, Ministry of Science and Technology (MOST)) of Taiwan.
Supplemental material
Supplemental material for this article is available online.
Appendix
References
Supplementary Material
Please find the following supplemental material available below.
For Open Access articles published under a Creative Commons License, all supplemental material carries the same license as the article it is associated with.
For non-Open Access articles published, all supplemental material carries a non-exclusive license, and permission requests for re-use of supplemental material or any part of supplemental material shall be sent directly to the copyright owner as specified in the copyright notice associated with the article.