
Abstract
Acoustic emission source localization is a promising monitoring technique for concrete structures. However, the accuracy of acoustic emission source localization is influenced by many factors, such as the presence of cracks, which are commonly observed in existing reinforced concrete structures. In this article, the acoustic emission source localization is evaluated using a numerical model with a total number of 11,827,200 independent simulated tests. In this work, the investigated influential factors include the presence of cracks, arrival time picking error, and senor layout. The accuracy of source localization is quantified by the characteristic error defined in this article. Using the proposed wave propagation properties, a relatively stable characteristic error of 150 mm is estimated in the detection zone with the maximum sensor spacing less than 1 m. The evaluation approach and simulated characteristic error are validated experimentally by comparing the 200 manually generated signals using hammer hits on a cracked concrete beam.
Keywords
Introduction
Acoustic emission (AE) technique shows promising features in detecting damages, such as crack opening/closure1,2 and de-bonding of reinforcement, 3 in concrete structures. Damage is generally caused by irreversible localized structural changes, which emit elastic waves inside the material. The location of these changes can be traced back using different arrival times of the same wave signal at different locations with multiple sensors. The process is called AE source localization. 4 This technique turns out to be efficient in detecting damages in metal structures due to the homogeneity of the medium. 5 However, for many reinforced concrete structures, especially existing concrete structures, the arrival times of waves are influenced by the presence of cracks. 6 A generic methodology to evaluate the accuracy of applying the traditional localization method, which is based on the assumption of constant wave velocity inside the concrete structures, is necessary. In order to verify the accuracy of the source localization, various methods have been introduced in the literature. Schechinger and Vogel 7 approached experimentally by locating AE from cracking. The comparison with the real crack pattern indicated the source localization accuracy qualitatively. Tsangouri et al. 8 assessed the source localization accuracy by locating an embedded transducer inside concrete with known position. The accuracy of the source localization was quantitatively described by the ratio between the spatial error and sensor spacing. Zhang 9 approached numerically by locating the simulated sources in a modeled concrete beam. The source localization accuracy was quantified by the spatial localization error. The inconsistent way of evaluation causes vague understanding of the source localization accuracy. A more consistent manner of evaluation is needed to assess the accuracy of the AE source localization in concrete structures.
The aim of this article is to evaluate the accuracy of AE source localization in concrete structures in a consistent manner and evaluate the effect of possible influencing factors. To do so, numerical models which simulate AE measurement on a hypothetical concrete beam with different crack configurations and sensor layouts are developed. Factors that may influence the source localization results include the position and the height of cracks, arrival time picking error, and sensor layout. The accuracy of AE source localization is quantified by the term characteristic localization error eck. The evaluation approach and the numerically derived eck are then validated experimentally by comparing the manually generated signals using hammer hits with the known locations.
AE source localization and error study
AE source localization technique
Triangulation technique 10 is a widely applied method for AE source localization. The algorithm assumes a constant wave velocity in the medium. For more advanced algorithms taking into account variable wave velocity distribution, studies reported in Shiotani et al. 11 and Pahlavan et al. 12 are referred to, which will not be discussed further in the study.
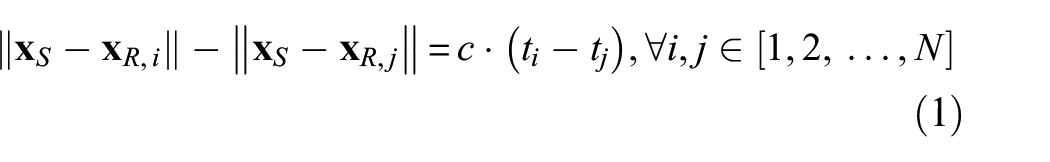
Suppose that an AE event is captured by sensors at different locations with corresponding arrival times of waves, the difference between the travel distances from the source to two arbitrary sensors is expected as
where
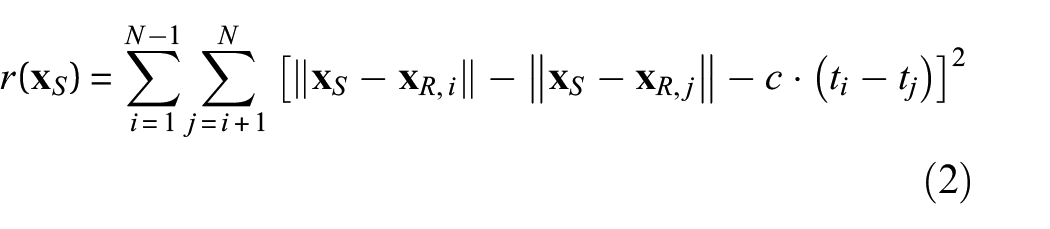
In this study, the grid search method 4 is employed. The measured volume is discretized by a grid of possible source locations (referred as grid search zone). The source location is estimated by searching the grid point which has the minimal residual between the calculated and the measured distance difference from available sensor pairs
An illustration of the source location estimation from the minimal residual in the grid search zone is shown in Figure 1(a). However, the minimal residual in the grid search zone might not be the global minimum in the infinite space. One of the consequences is estimating the source location on the edge of the grid search zone which is further away from the minimum (Figure 1(b)). Those source localization results on the edge of the grid search zone are considered to be not reliable and filtered out in this article.
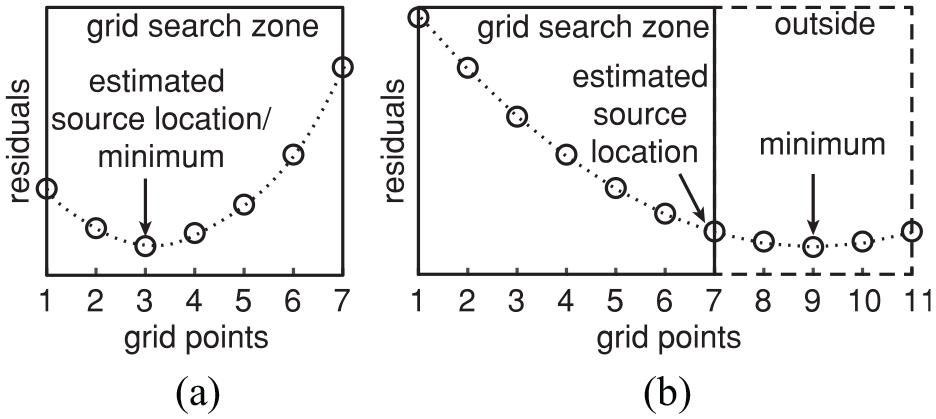
Estimated source location: (a) in the inner part of the grid search zone and (b) on the edge of the grid search zone.
Localization error
In the described source localization procedure, arrival times and sensor layout are the two main parameters for the triangulation method. Factors that may influence these inputs are considered to be the sources of localization errors in this study. They are as follows:
Arrival time picking method, which is regarded as a systematic error;
Cracks through the wave travel path, which is from the concrete structure;
Sensor layout, which on one hand determines the detective capability. Sources outside the sensor enclosed zone could not be located accurately. On the other hand, sensor layout influences attenuation of the wave signal. Too large attenuation of the signal results in missing of AE events or increased errors since less sensors are utilized in the localization procedure.
For arrival time picking method, the widely used methods are fixed or floating thresholds that are implemented in the acquisition system.13,14 The arrival times are decided by the first point that crosses a threshold which is either a fixed value or a floating value relating to the signal amplitude. Schechinger and Vogel 7 quantified the picking error of the floating threshold method by comparing the automatic pickings with the manual pickings. They found that 27.1% of the results had errors less than 1.25 µs, 20.2% between 1.25 and 2.5 µs, 24.2% between 2.5 and 7.5 µs, and the rest were considered not good. Since signals have different signal-to-noise ratios, it is more likely to have larger errors when fixed threshold method is used.
The presence of cracks delays the arrival times due to two possible effects: the reduction of the wave velocity at the region close to the crack or the diffraction of the wave at the crack tip, which will be further discussed in section “Wave propagation in concrete structures.”
For sensors that can capture the AE event, the two sources of errors, which are the arrival time picking method and the presence of cracks, are independent to each other, therefore can be superimposed, resulting in the influenced (actual) arrival times

where
By plugging the influenced arrival times in equation (2), a possibly erroneous source location is calculated. The localization error is defined as the distance between the actual source location and the estimated source location

where
In addition, the presence of steel reinforcements may influence the arrival times due to the local change of wave speed and scattering. Simulations showed an arrival time delay of less than 5 µs. 7 This value may change with dimensions of steel and wave length. It is a complex phenomenon to model. This article does not involve the influence of steel tendon on the source localization. But with the same approach described above, the influence of steel tendon can be included by adding the corresponding arrival time delays in equation (3).
Wave propagation in concrete structures
In concrete structures, the AE signals can experience extraordinary complications on their way from the source to the sensors. Most AE source localization methods including the one adopted in this article only take into account the first arrival of the signals. Thus, proper understanding of the properties of the first arrival part of a wave signal in terms of travel time and amplitude is essential for the analysis of source localization in this study.
In sound concrete, the wave travel paths are assumed to be straight. Waves that travel from the source location of an AE event denoted by
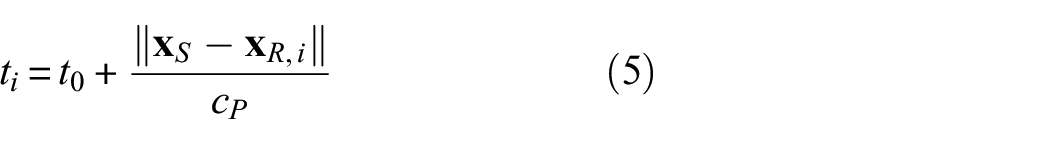
where
The attenuation of the first arrival P-waves in sound concrete generally comes from two sources: the material attenuation and the spherical spreading loss. 9 The decibel value of the amplitude of the signal arrived at the location of sensor i is
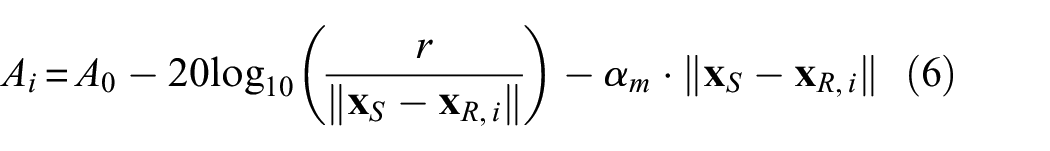
where
When a crack lies between the AE source and the sensor, the first arrival wave may be from one of the two alternatives: (1) waves go through the crack (referred as direct waves) or (2) waves diffracted by the crack tip (referred as tip-diffracted waves), shown in Figure 2.
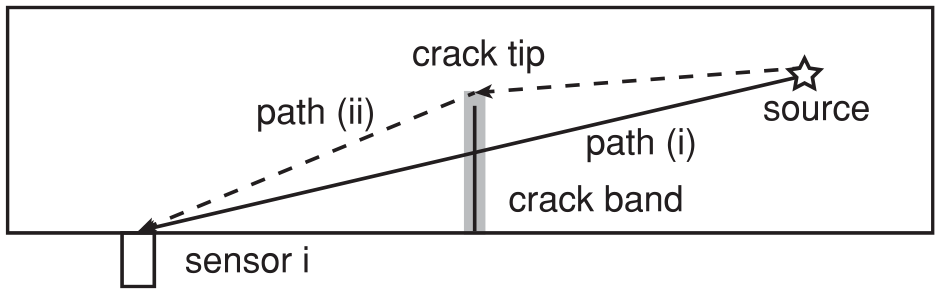
Wave propagation in existing concrete structures with a crack between the source and the sensor.
Generally, the waves which arrive earlier but not yet attenuate below the threshold of the sensor are recognized as the first arrival waves. Hence, the two criteria to determine the first arrival are (1) the arrival time and (2) the amplitude. For tip-diffracted waves, the influence of the crack tip on the amplitude and phase change
16
were neglected in this study with the assumption that the crack tip only changes the wave travel direction. The arrival time and the amplitude of the tip-diffracted waves were estimated using equations (5) and (6) with a travel distance of
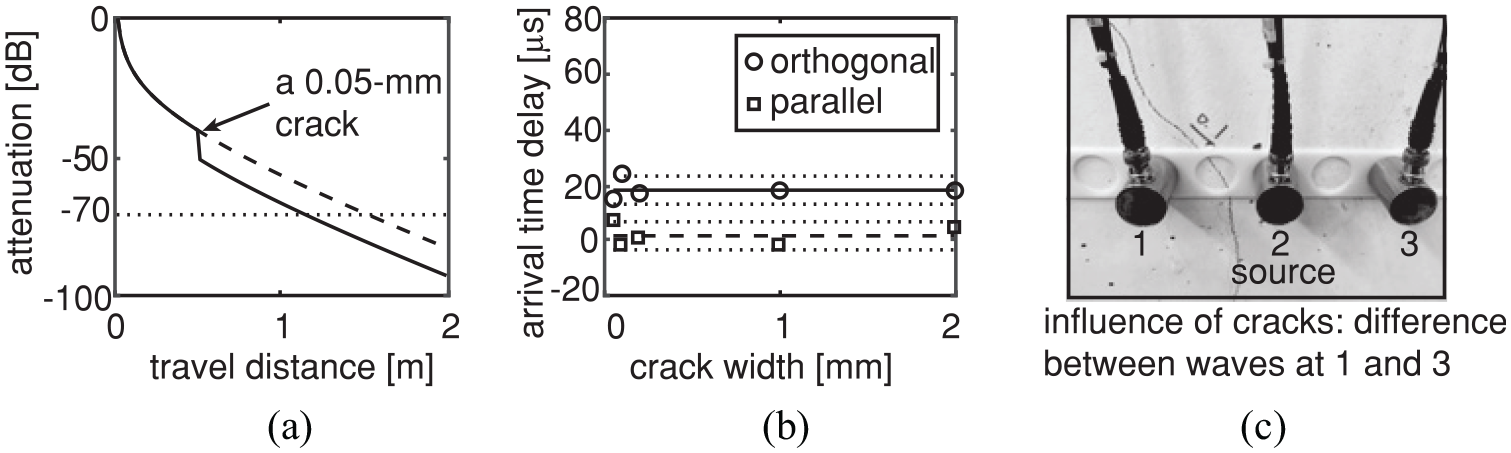
(a) Amplitude attenuation, (b) arrival time delay in travel distance of 80 mm orthogonal and parallel to the crack, and (c) test setup to study crack effect. 6
Simulation of AE source localization in a concrete beam with a flexural crack
A reliable evaluation of the AE source localization in concrete structures, considering the discussed influential factors of the presence of cracks, accuracy of arrival time picking, and sensor layout, requires large quantity of measurements, which is costly and labor-intensive. Besides, in a three-dimensional (3D) measurement, it is generally not feasible to manually and non-intrusively excite a source pulse inside the structure at a predefined position for calibration. Therefore, a more practical option is to simulate the AE source localization process including the possible influential factors based on realistic concrete structures using a numerical model. The source localization errors discussed previously are investigated with the model.
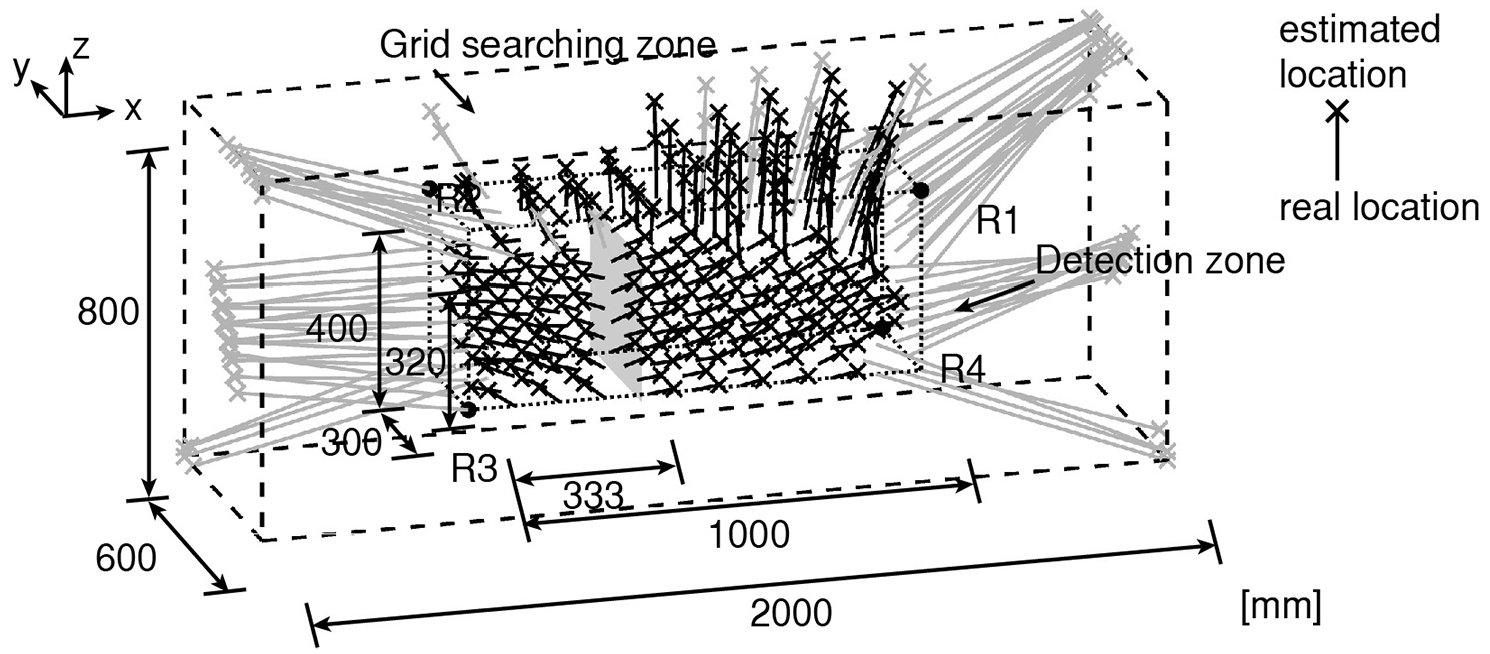
The reference model of this study is a concrete beam with a relaxed crack (Figure 4). The dimension of the beam is 3000 mm × 400 mm × 400 mm. The wave speed of the first arrivals in the sound concrete is obtained through previous experiments being 4100 m/s, and the material attenuation factor is 20 dB/m for signals with frequency centered at 60 kHz. The crack is a typical flexural crack with a surface crack width of 0.05 mm, which propagated from the bottom of the beam and stopped at a certain height of the beam due to force equilibrium along the cross section. 17 The variation of the crack surface at aggregate level is neglected resulting in a plain surface being perpendicular to the longitudinal direction of the beam.
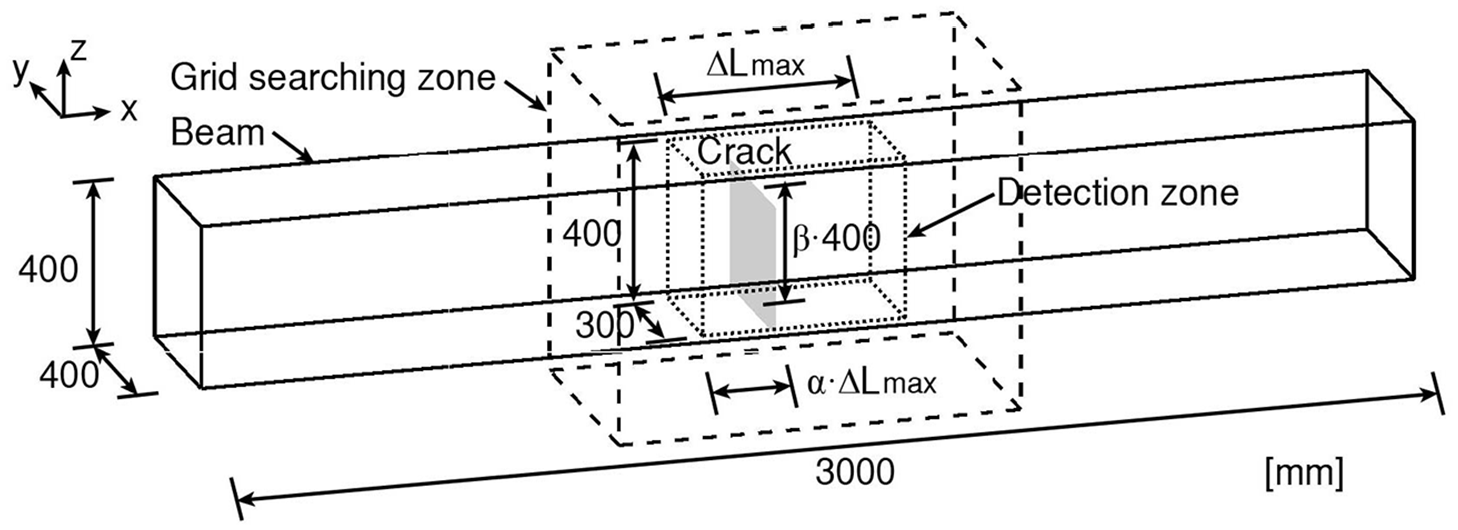
Beam configuration, detection zone, and grid searching zone.
Four AE sensors with central frequency of 60 kHz are applied on the surface of the beam around the crack. Sensors are arranged in eight different sensor layouts, which can be categorized in four groups: in 3D, 2D vertical, 2D horizontal, and 1D (Figure 5). Sensor layouts on the vertical cross section (Group 2) and on the bottom surface (Group 3) are included to simulate the practical cases, when only the side surface or the bottom surface is accessible. Sensor layout of 1D (Group 4) is included to simulate slender structures where only 1D measurement is necessary. Since AE source localization cannot give reliable estimation of the locations of the sources outside the sensor covering zone, 17 the detection zone is defined as the sensor covering zone, which is in a volume, a plane, or a line, when the sensor layout is 3D, 2D, or 1D, respectively (indicated by dashed lines in Figure 5(a)). The studied sensor layouts are considered comparable as they share the same length (for all groups), width (for Group 1 and Group 3), or height (for Group 1 and Group 2).
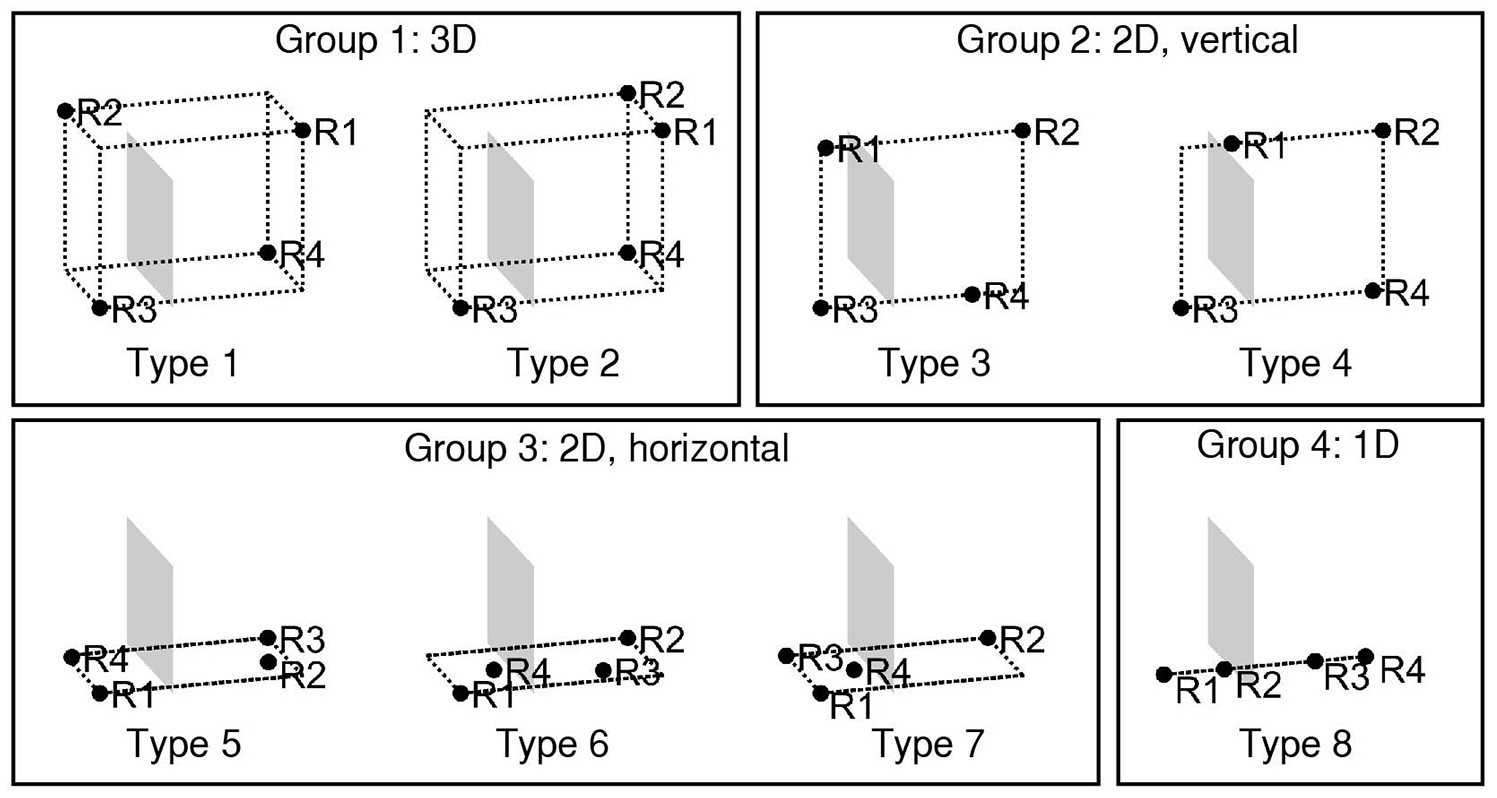
Sensor layouts (R1-4) and detection zone (enclosed by dashed lines) in four groups: 3D, 2D vertical, 2D horizontal, and 1D.
In this model, the maximum sensor spacing in x-direction (see Figure 4 for the directions) can be adjusted to study the influence of wave travel distance on the accuracy of source localization. Since stress state of the beam is plain stress, the crack distribution in y-direction is assumed to be constant. The position of the crack in x-direction and the height of the crack tip in the detection zone are adjustable and evaluated by (indicated in Figure 4)
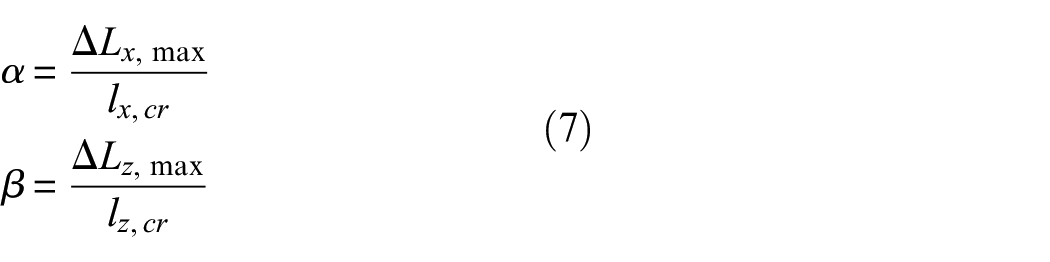
where
For a crack whose middle is 250 mm to the left edge and tip reaches 320 mm in a detection zone with 1000 mm length and 400 mm height,
Twenty-four independent models with eight sensor layouts were built (listed in Table 1). In each model, a total number of 308 (11 × 4 × 7) assumed possible source locations were uniformly distributed in the volume
Configurations and characteristic source localization error in sensor layout Type 1 (see Figure 4).
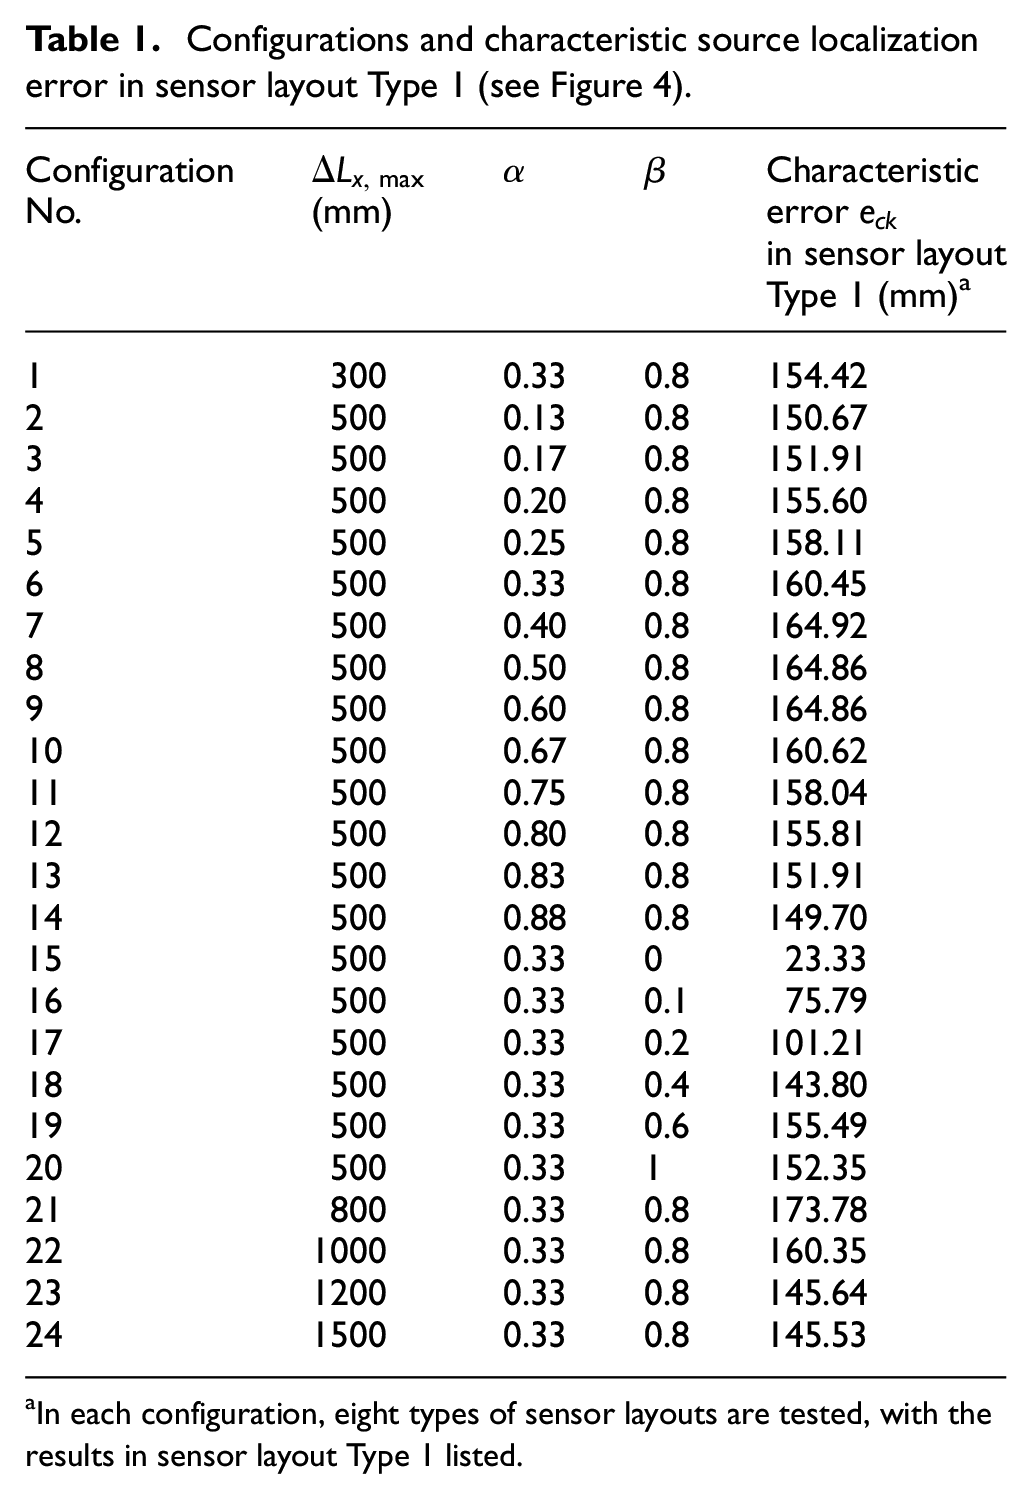
In each configuration, eight types of sensor layouts are tested, with the results in sensor layout Type 1 listed.
The arrival time picking error was assumed to be a uniform random variable with a range of [0, 5] µs. The influenced arrival times, determined with equation (3), were used to estimate the source location with the grid search method outlined in section “AE source localization technique.” The grid searching zone was set to be
For each type of sensor layout, the characteristic source localization error
Results
The source localization results of the test configuration 22 in Table 1 with
Source localization results of test configuration 22, layout Type 1.
The source localization results on the edge of the grid searching zone (in gray) were considered not to be reliable, thus filtered out according to section “AE source localization technique.” In Type 1, around 73% of the source localization results remained. In other types of sensor layouts, around 83% (Type 2), 66% (Type 3), 71% (Type 4), 75% (Type 5), 74% (Type 6), 83% (Type 7), and 73% (Type 8) remained.
The remaining source localization results in the sensor layouts of different dimensions (3D, 2D, and 1D) were compared by projecting to the relative detection zones of the sensor layouts. A projection example in sensor layout Type 1 (Group 1), Type 3 (Group 2), Type 5 (Group 3), and Type 8 (Group 4) is shown in Figure 7. The dot lines enclose the detection zones which are of 3D, 2D vertical, 2D horizontal, and 1D, respectively. The “+” mark indicates the real source location, and the “×” mark indicates the estimated source location. The source localization results in 2D sensor layouts (in x–y plane) were dominated by error component in z-direction. Similarly, the source localization results in 1D sensor layout (in x-axis) had larger errors in y- and z-direction. This was expected since triangulation technique could not locate accurately in the dimensions not covered by the detection zone. Therefore, the source localization results were projected to the detection zone by eliminating the error components in other dimensions. For example, in Type 5 present in Figure 7, only errors in x–y plane were considered. After projection, the source localization errors of the four sensor layouts were comparable, being 43.33, 50.11, 44.72, and 40 mm, respectively.
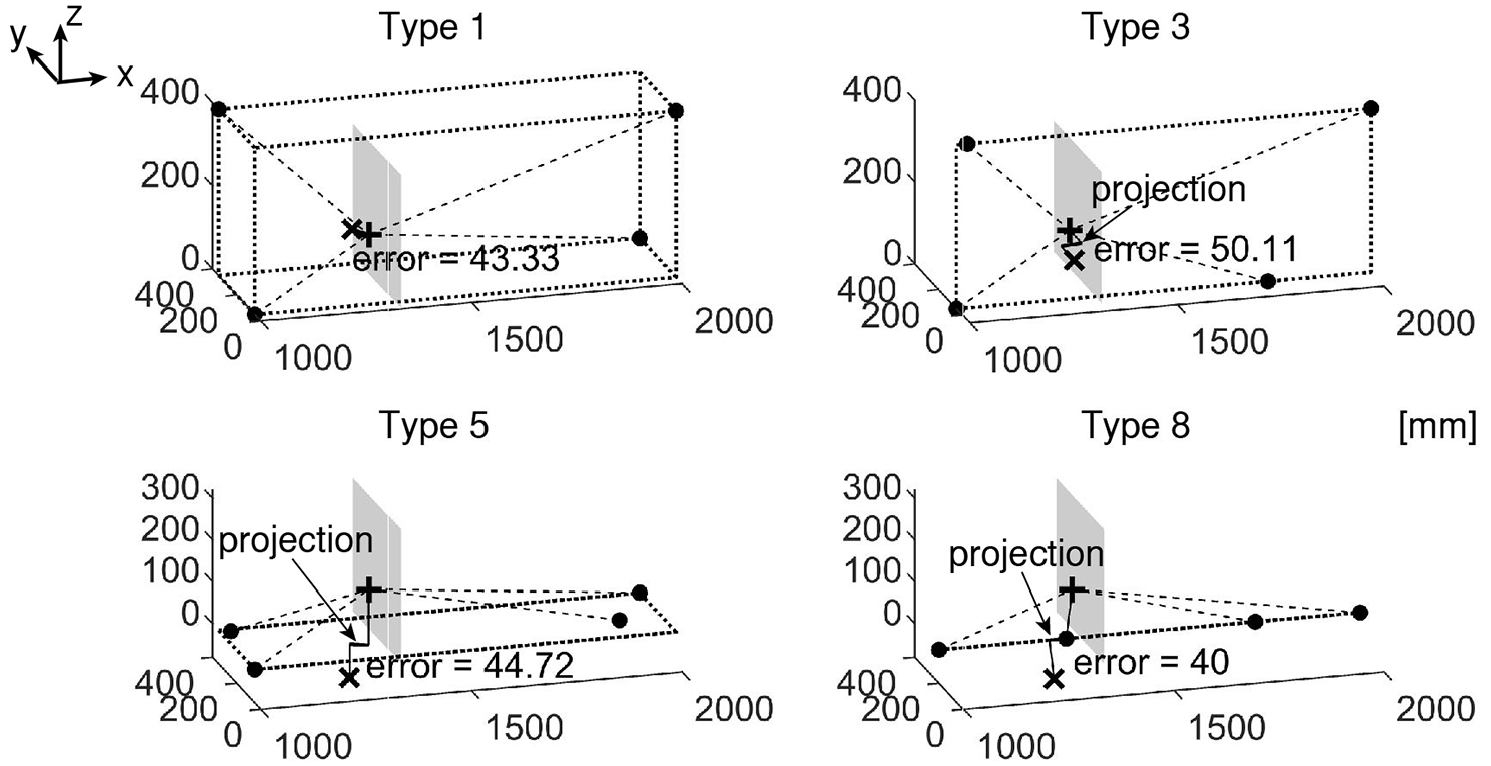
Source localization results of the source at (1300, 150, 133.3) mm of test configuration 22, in sensor layouts: Type 1, Type 3, Type 5, and Type 8.
The source localization results of the 200 repeated tests were assumed to follow a normal distribution. Student’s t-test
19
proved the assumption of normal distribution with a significance level lower than 0.01. The cumulative distribution function (CDF) of the source localization errors for each type of sensor layout is shown in Figure 8. The value of
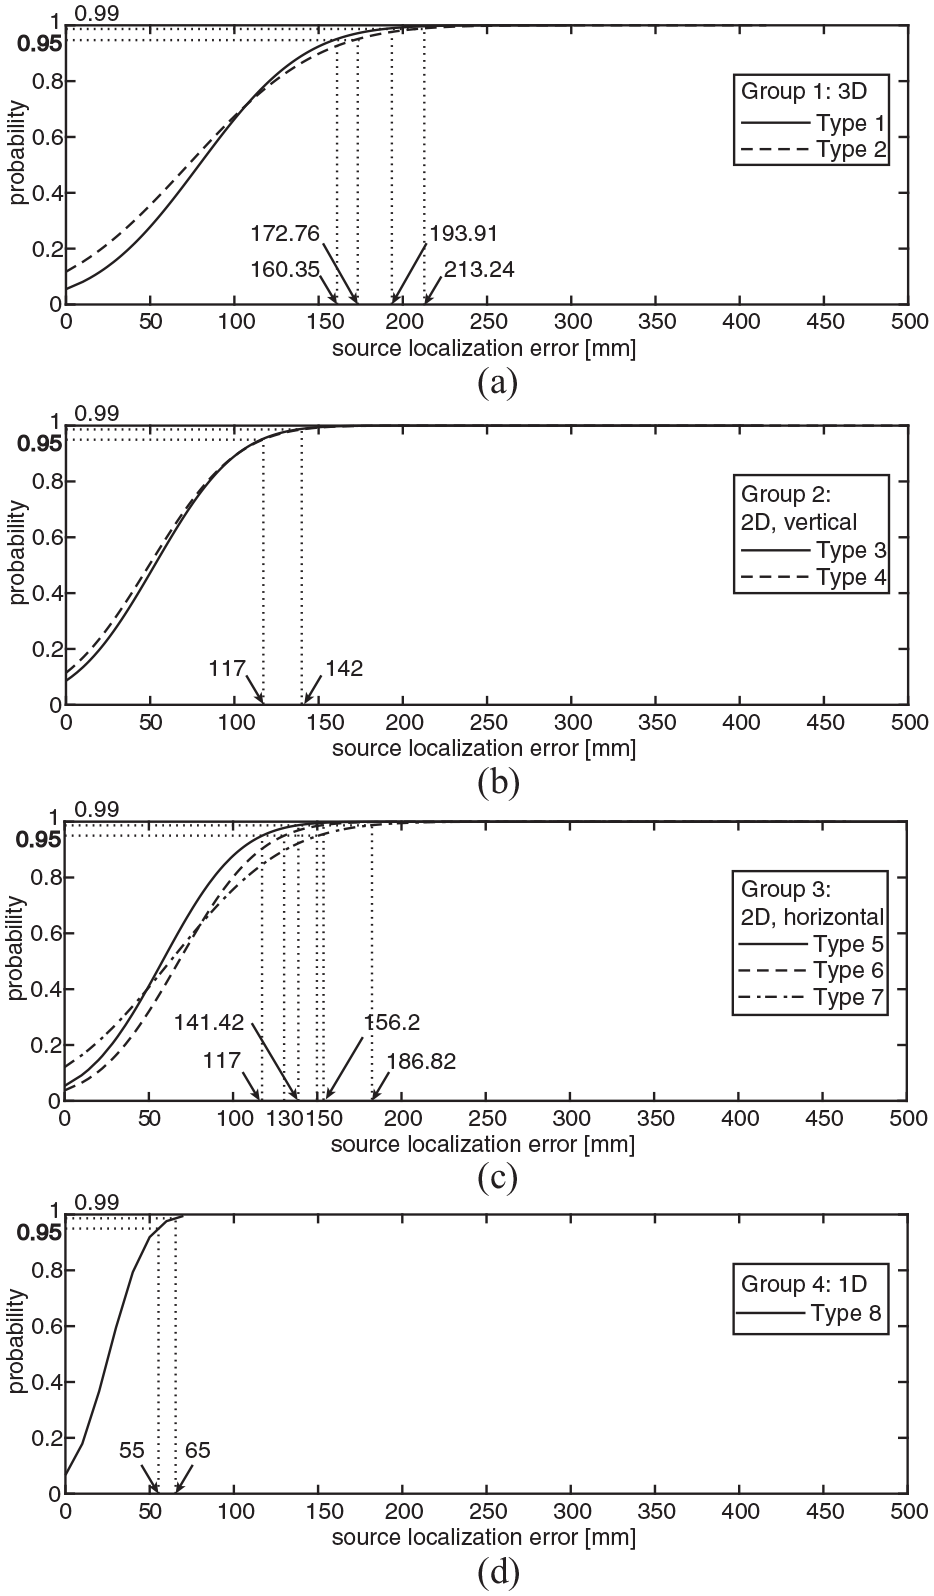
Cumulative distribution of source localization errors projected to the detection zone in sensor layouts: (a) Group 1, (b) Group 2, (c) Group 3, and (d) Group 4 in test configuration 22.
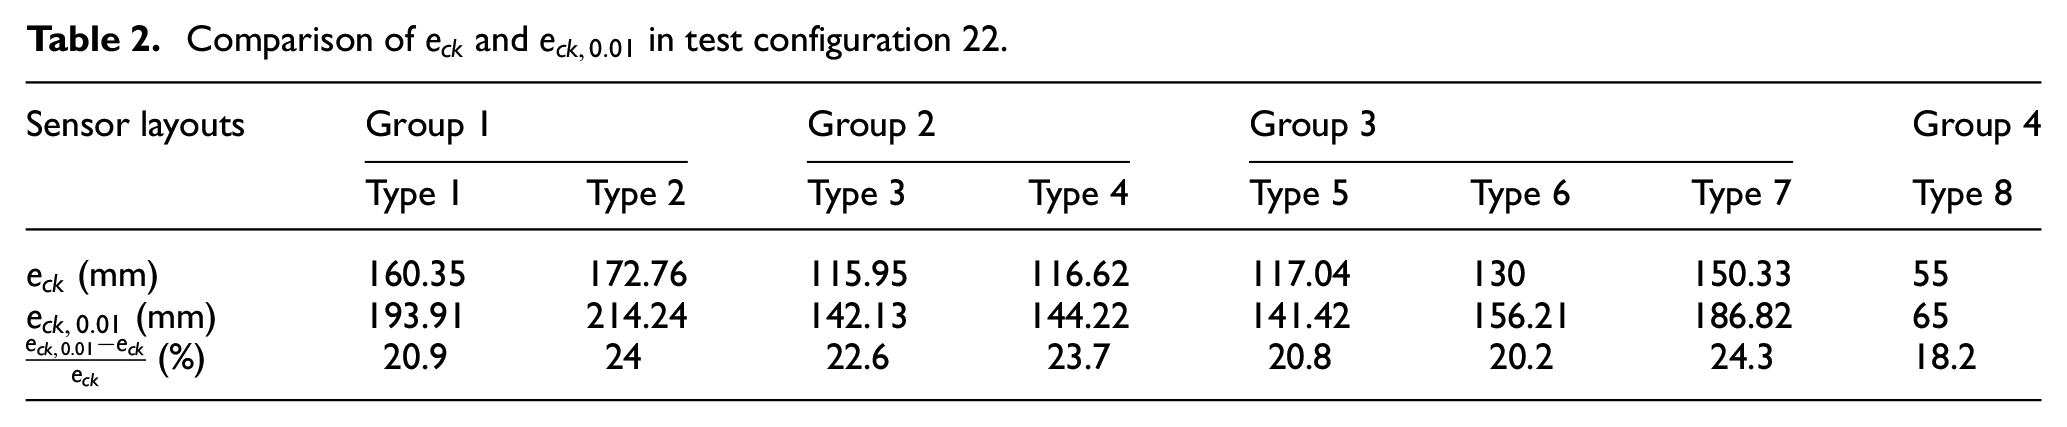
In this test configuration,
Comparison of
The above-introduced analysis procedure was implemented on all the designated configurations listed in Table 1. The characteristic errors
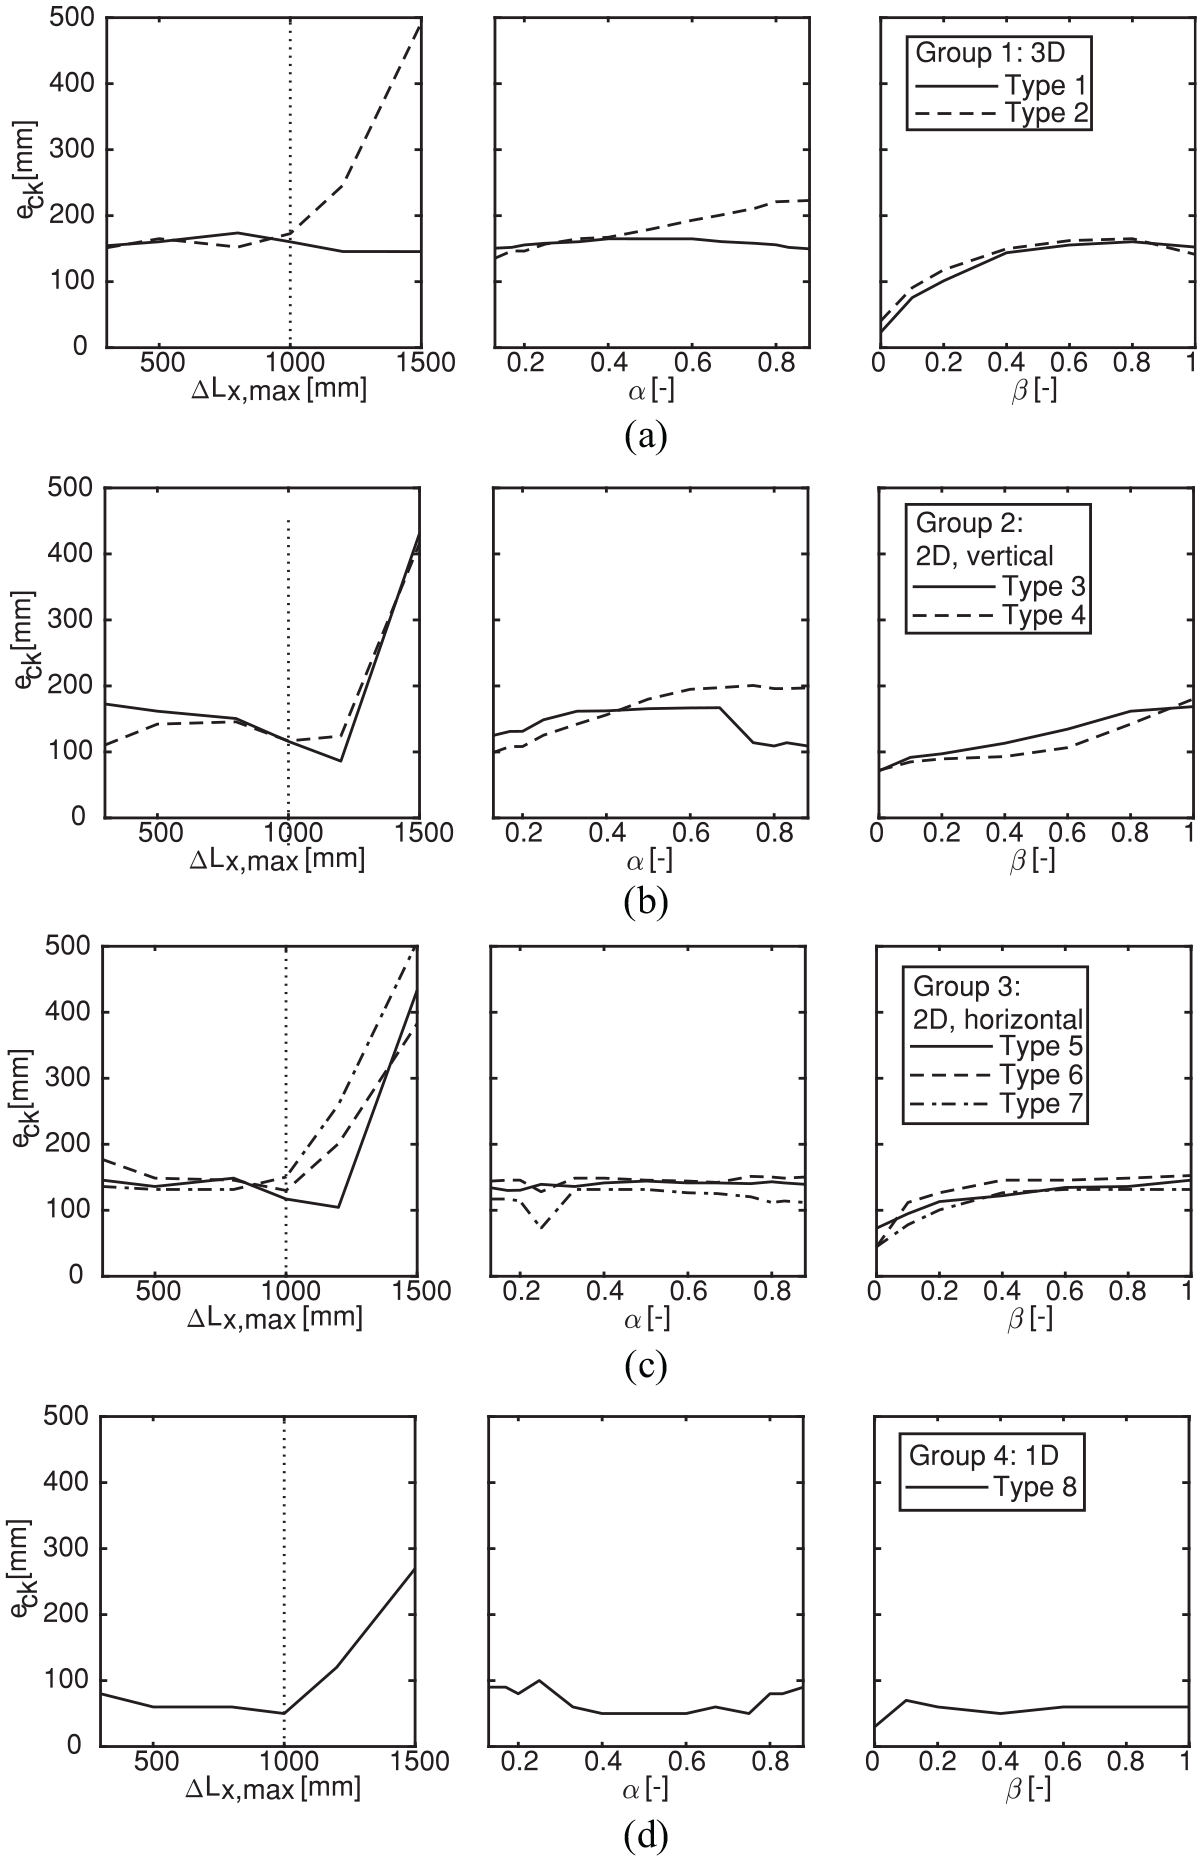
Characteristic source localization errors related to the maximum sensor spacing in x-direction
The middle and right columns of Figure 9 show the influence of crack positions and crack height on
Experimental validation and discussion
An experimental validation of the simulated characteristic error was carried out on a reinforced concrete beam of size 10,000 mm × 300 mm × 1200 mm. The concrete had a nominal compressive strength of 65 MPa. The maximum aggregate size was 16 mm. Reinforcing bars in the beam were 6Ø25, with concrete cover of 25 mm. The beam was simply supported with a span of 9 m and loaded by a point load in the mid-span, as schematically illustrated in Figure 10. The beam underwent a cyclic loading procedure as shown in Figure 11(a). The experimental validation was carried out when the beam was unloaded from a peak load of 250 kN (marked by an arrow in Figure 11(a)), thus the cracks were considered as relaxed, which complied with the assumed crack condition proposed in section “Wave propagation in concrete structures.” The crack pattern at the time of measurement is shown in Figure 12.
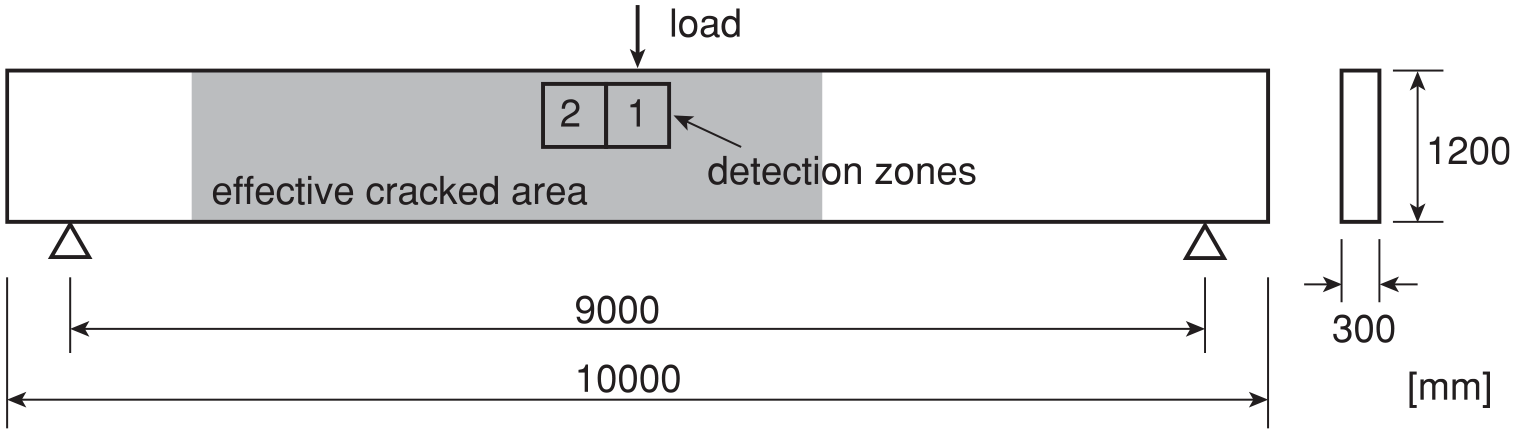
Dimension of the beam, detection zone, and load setup.
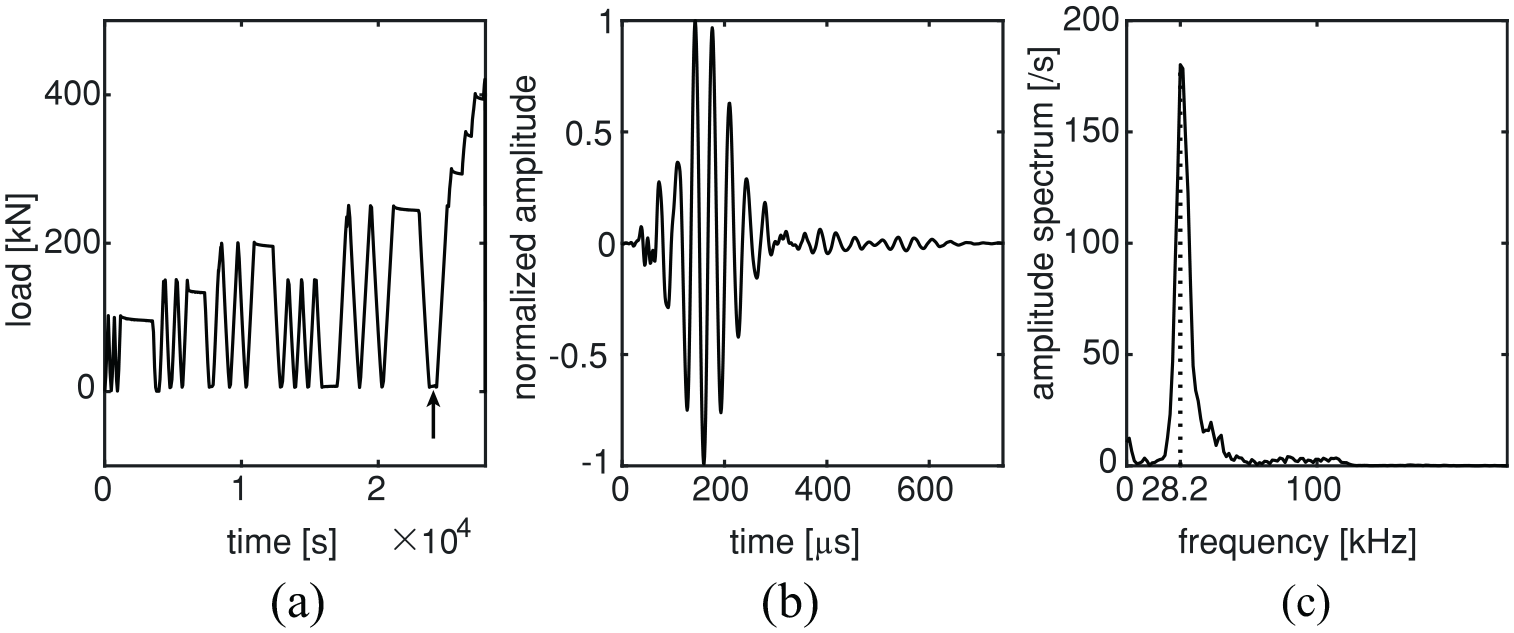
(a) Loading history with the time of measurement indicated by an arrow, (b) normalized hammer hit signal, and (c) amplitude spectrum of the normalized hammer hit signal.
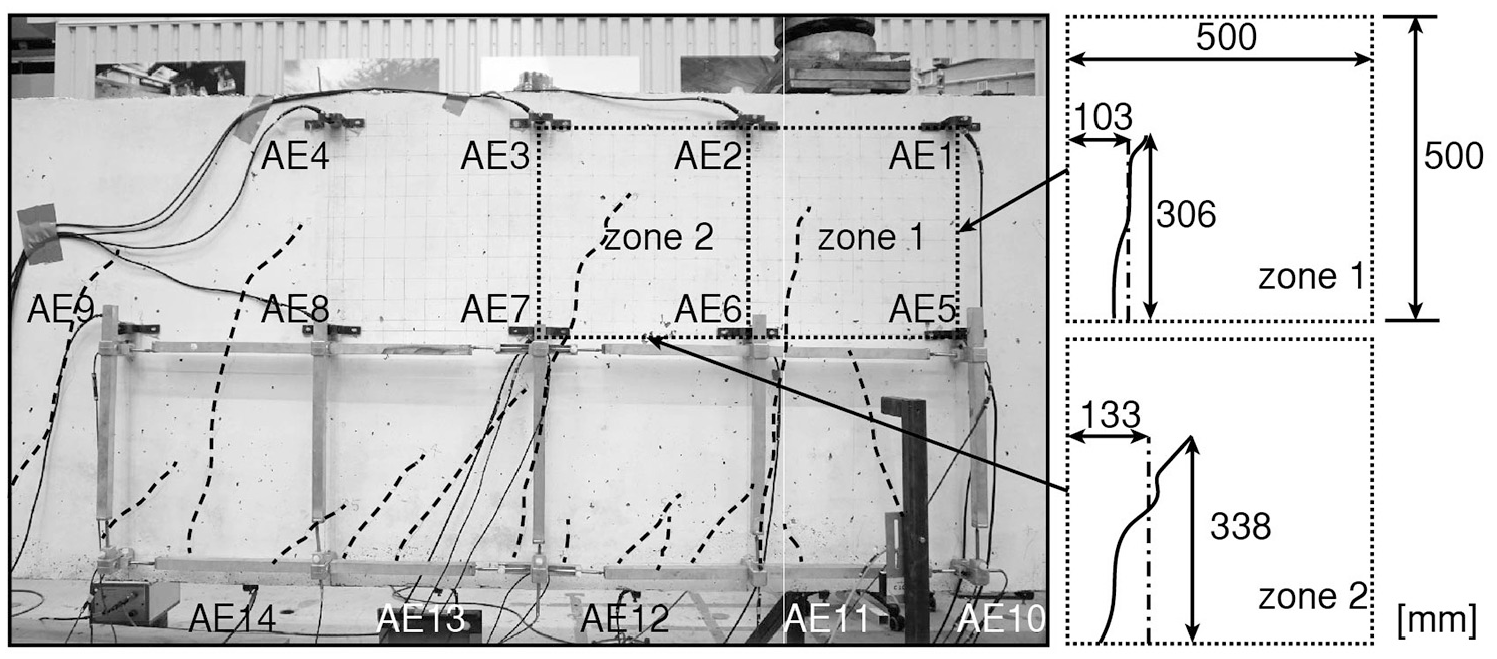
Experimental setup and crack pattern in the detection zones.
The wave speed and material attenuation in the tested concrete are the same as the modeled beam, being 4100 m/s and 20 dB/m at central frequency of 60 kHz, respectively. AE sensors with central frequency of 60 kHz were installed on the surface of the beam (x–z plane). The sensor spacing was 0.5 m. Sensors AE1, AE2, AE5, and AE6 enclosed detection zone 1 with dimension of x×z = 0.5 m × 0.5 m. Sensors AE2, AE3, AE6, and AE7 enclosed detection zone 2 with the same dimension, shown in Figure 12. Cracks in zone 1 and zone 2 had different local profiles and orientations. According to the definition in this article, the crack position factor
In each zone, a grid of 10 × 10 nodes was marked. In the lab tests, the AE signal source was generated by a 10-mm-diameter hammer hitting on the grid node. A typical hammer hit received by an AE sensor 5 cm away is shown in Figure 11(b). The received signal had a main frequency of 28.2 kHz (Figure 11(c)). A 2D source localization of the hammer hits was performed since the sources located inside the 2D detection zone. This was comparable to the 3D localization in the 3D detection zone (Group 1 in Figure 5) in the simulation, where the sources located inside the detection zone and no projection was needed.
The arrival times of each hammer hit at the four sensors in each zone was picked using the floating threshold crossing method to account the unstable amplitude of the hammer hits. The first point crossing 0.02 of the peak amplitude was picked as the first arrival, shown in Figure 13(a). The arrival time picking error in the shown case was around 5 µs when compared to the manual pick. It should be noted that not all the picking errors in this validation test were within 5 µs.
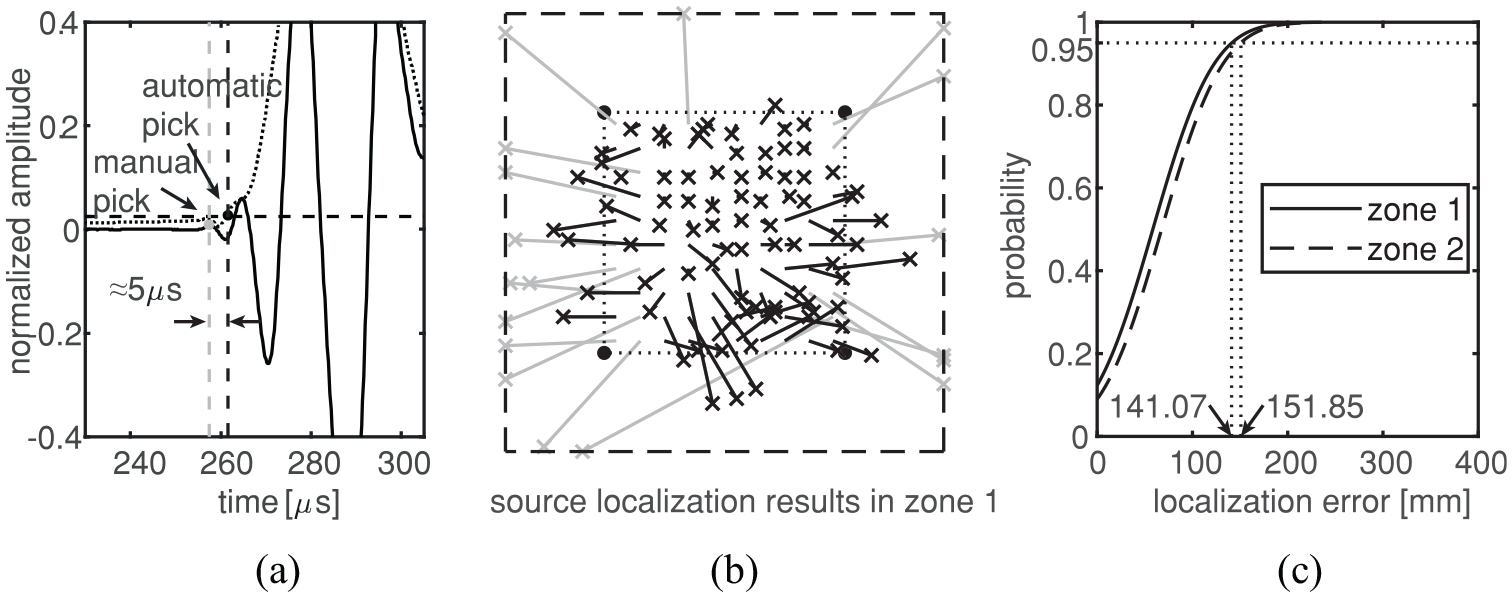
(a) Arrival time picking using the floating threshold crossing method, (b) source localization results in detection zone 1, and (c) cumulative source localization errors.
The grid search method outlined in section “AE source localization technique” was performed with a grid searching zone of x×z = 0.9 m × 0.9 m. The source localization results in zone 1 are shown, for example, in Figure 13(b). The source localization results on the edge of the grid searching zone (in gray) were first filtered out. In zone 1 and zone 2, around 82% and 87% of the source localization results remained, respectively. The cumulative distribution of the remaining source localization results is presented in Figure 13(c). The characteristic localization error
The experimental results gave a promising validation to the numerical model presented in this article, thus showing that the characteristic source localization error
Before AE measurements, it is necessary to measure wave velocity, wave attenuation, and noise level in the concrete. The sensor spacing should be adjusted to allow the waves being received after attenuation;
When multiple cracks exist between the source and the receiver, the influence of each crack on the attenuation of waves is expected to be summed up. This would result in less hits received or more late-arrived tip-diffracted waves;
More sensors will improve the accuracy of source localization;
The arrival time picking method is important for the source localization. In most acquisition systems, the implemented methods are based on the fixed or the floating threshold crossing. The floating threshold method applied in this study is suggested to be compared with the fixed threshold method with smaller time picking errors. A more accurate time picking method, Akaike information criterion (AIC), 20 shows a much smaller error around 1.25 µs. 7 This would improve the source localization results.
Triangulation technique discussed in this article is a simplified method of AE source localization with many strong assumptions such as constant wave speed in concrete structures. For other improved methods which are also based on arrival times, such as those considering variable velocity distribution,11,12 the proposed evaluation approach and accuracy indicator can be used as well. In this way, the accuracy of AE source localization using different methods can be evaluated with a consistent approach. This could be an interesting future study.
Conclusion
This article focuses on quantifying the accuracy of AE source localization in concrete structures. A new methodology has been proposed, including a numerical algorithm to simulate the source localization process, a filtering criterion of the estimated AE location, and an indicator of source localization accuracy, namely characteristic error
When grid search method was applied to do the source localization, the results at the edge of the grid searching zone were not sufficiently reliable and should be filtered out. Around 80% of the results remained afterwards in both the simulation and the validation tests with uniformly distributed sources in the detection zone;
A term characteristic error
The characteristic error
The characteristic error
The experimental validation suggests that the proposed evaluation approach and indicator of the accuracy of the source localization are reliable. To apply the characteristic source localization error obtained in this article in other applications, the inputs, like the material properties, sensor layout, and the crack pattern of the structure, should be first justified. In case of significant deviation, the proposed method should be adjusted accordingly.
Footnotes
Declaration of conflicting interests
The author(s) declared no potential conflicts of interest with respect to the research, authorship, and/or publication of this article.
Funding
The author(s) received no financial support for the research, authorship, and/or publication of this article.