
Abstract
Learning and forgetting curves are not only integral issues for courses in introductory psychology, they are also of high practical relevance to students when it comes to the formation of realistic goals and expectations on learning outcomes. A paper-and-pencil-study investigated how well students of psychology (N = 82) have internalized the concepts of learning and forgetting curves. We developed a vignette-based assessment technique: drawing a hypothetical learning or forgetting curve in an empty coordinate system with time on the x-axis and performance on the y-axis, the starting point and endpoint being fixed. In spite of the free production format answers were quantified in a way that would allow for automated feedback in online teaching tools. For instance, learning which decelerates over time implies a curve above the diagonal while decelerated forgetting implies a curve below the diagonal. Deviating from this optimal solution, about 60% of the drawn learning and forgetting curves were classified as being close to the diagonal axis. Analyses on the individual level also documented poor consistency of knowledge. Students drawing a deceleration in learning were not more likely to also draw a deceleration in forgetting. Implications for future learning aids, for example, online feedback systems are discussed.
To students in introductory psychology, learning curves and forgetting curves matter at least in two respects. The curves such as the forgetting curve derived from Ebbinghaus’ (1885) iconic self-experiments are one core element of the curriculum along with psychological learning and memory theories (cf. Griggs, Bujak-Johnson, & Proctor, 2004; Simon, 1990; Teigen, 2002). On the other hand, understanding learning and forgetting curves is of high practical relevance especially in higher education. Just like epistemic beliefs, that is, “individuals’ beliefs about the nature of knowledge and knowing” (Muis, 2007, p. 173), learning (and forgetting) curve knowledge can guide students’ self-regulated learning. Consider, for instance, a student who assumes to gain knowledge proportionally to the time invested. Detrimental motivational consequences might arise if the student uses this epistemic belief stemming from a (wrongful) lay theory to estimate future progress in studying the subject matter. For instance, expecting that the progress made during the first day of studying will equal the amount of knowledge gained on every subsequent day should result in gross overestimation (cf. Figure 1) and consequently disappointment. Symmetric to large learning gains early in practice, forgetting is steep soon after studying. Accordingly, estimating forgetting based on the loss during the first week might be unduly discouraging – if erroneously a linear projection is used. As psychology students are to learn about the time course of learning and forgetting, a drawing task which maps a person’s assumed learning curve can help to detect deficient knowledge and possibly identify the closely related dysfunctional epistemic beliefs, too.
An idealized learning curve and forgetting curve based on the negative exponential are shown with idealized sketching examples. In order to illustrate the constant relative learning rate, we chose a relative learning rate of 50%. From day zero to day 1 there is a gain of 40 vocabulary pairs (which is 50% of the 80 pairs to-be-acquired) overall. From day 1 to day 2 there is a gain of 20 pairs (which again is 50% of the remaining 40 pairs to be acquired). In sketching, participants faced an empty coordinate system. The only constraints given were the starting point (day zero value) and the endpoint.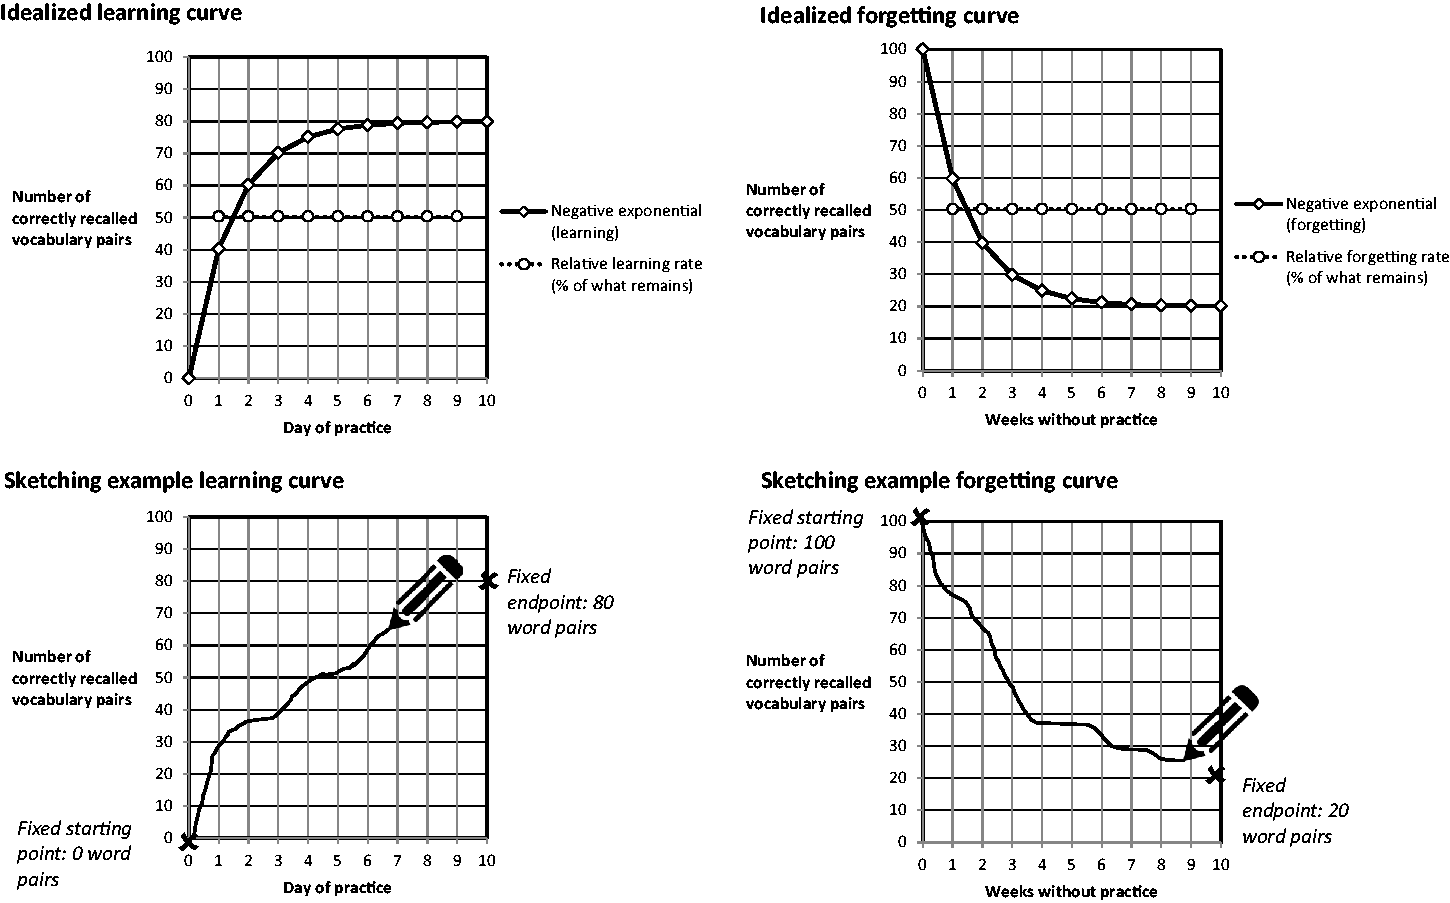
Learning Curves as an Integral Issue in Introductory Psychology
In order to describe and understand the process of skill acquisition as well as its counterpart in cognition, forgetting, learning and forgetting curves can be considered as helpful tools with a long tradition in psychology. Learning and forgetting curves represent the course of a certain performance level over time in a coordinate system (e.g., Gaschler, Progscha, Smallbone, Ram, & Bilalic, 2014), typically with time or practice intensity on the x-axis and an indicator of performance on the y-axis such as the number of learned units, the time to complete a task, or the number of mistakes.
Following controversial debates in cognitive psychology, there has been consensus that individual learning curves (i.e., for one item in one person) may follow diverse trends such as initial lags, sudden onsets of a target behavior (which would be formally equivalent to a step function), and episodes of rather continuous increases in performance (Gallistel, Balsam, & Fairhurst, 2004). Discontinuities average out when aggregating time courses across persons or across to-be-memorized items, resulting in a smooth rising curve with a negative acceleration (Haider & Frensch, 2002). While Blech and Gaschler (2017a) focused on students’ understanding of this difference between individual and aggregate time courses, a drawing task applied in this former study was further developed in the current work to assess different facets of students’ knowledge about learning and forgetting curves more in depth.
Using a vocabulary learning vignette, we focus on beliefs about average learning (and forgetting) curves for vocabulary items so that smooth curves can be expected (see Figure 1, idealized learning curve). The time course can be captured by a rising, decelerated exponential function of the type
Understanding the idea of the negative acceleration, the constant relative learning or/and forgetting rate and the relationship between a jagged individual curve as compared to an ideal, prototypical group average curve are probably the most important challenges to students. Textbooks (e.g., Myers, 2008) teach learning and forgetting curves with the aid of graphical representations in combination with written explanations.
Aim of the Study: A Tool for Knowledge Assessment
The primary aim of the study was to introduce a drawing (or sketching 1 ) task to assess students’ knowledge about learning and forgetting curves. This newly developed tool should be usable in a paper-and-pencil format in the classroom or in online teaching. Crucial analyses should be simple so that students should be able to self-evaluate their results in classroom settings. As we will show in the method section, the visual free reproduction technique is both flexible in its application and nevertheless allows for quantitative analyses; a number of different knowledge facets can be assessed by one single task. Bearing in mind that the exact shape of a learning and forgetting curve matters indeed, we considered a graphical testing format as more appropriate than, for example, a verbal test similar to the (multiple choice) questionnaires by which students’ individual convictions about learning can be raised (Rosman, Mayer, Kerwer, & Krampen, 2017; see also Schommer, 1990). Another difference between the epistemistic belief questionnaires and the present approach lies in the fact, that the focus is – in the first place – on objective learning (and forgetting) curve knowledge rather than on personal convictions about learning issues. Nevertheless, we will take the presented tool and the so assessed knowledge as a starting point to a thorough discussion of potential interactions between knowledge and beliefs in learning contexts, thus highlighting the motivational implications of the tool.
Method
Sample and Procedure
Data were collected from N = 83 students (16 male) at the Fernuniversität in Hagen, aged 20 to 61 (mean = 31.17, standard deviation = 9.48). The subjects took part in a 15-minute-test session embedded in the context of seminars in Berlin and Hagen. 2 The seminars covered topics from cognitive science, learning, and motivation as part of the B.Sc. curriculum in psychology. Learning and forgetting curves were also part of the seminar but were only discussed after the study. Course credit was given for participation. Also, it was highlighted that the sample of psychology students was the appropriate target group for the present study since it should have implications on the teaching of psychology at a university level. Leaving aside one incomplete data set, the drawn learning and forgetting curves of 82 participants were included in the analyses. The paper-and-pencil test started with the vignette tasks (see below) and ended with a questionnaire on sociodemographic variables (age, gender) and two dichotomous control items concerning prior knowledge. In order to assess the amount of attention forgetting and learning curves had caught prior to the testing, students were asked whether they had seen a forgetting curve and whether they had seen a learning curve in the study material distributed in paper and electronically at the beginning of the semester. In that semester, the material did contain a forgetting curve, but no learning curve.
Vignette Technique
To assess students’ knowledge about learning and forgetting curves we developed a vignette technique (see also Blech & Gaschler, 2017a). The participating students were given a paper-and-pencil booklet with empty coordinate system diagrams (see Figure 1, sketching example) and short texts. For the learning curve vignette the text was: “Imagine you are working through a list of 100 word pairs every day. The list consists of 100 words from a foreign language you do not know so far. […] Please assume that after 10 days of rehearsal you are able to reproduce exactly 80 out of 100 words. Please draw what the course of practice could potentially look like. Fixed points are “day 0” = 0 words; day 10 = 80 words. […]”
The learning curve’s counterpart, the forgetting curve vignette, was introduced by the phrases: “Imagine you have studied a list of 100 vocabularies. […] You have been rehearsing for several days. Finally, you can manage to correctly reproduce all 100 word pairs. […] Then you stop rehearsing, yet you are tested again every commencing week. Please assume that after 10 weeks without practice you are able to reproduce only 20 out of 100 words. Please draw what the course of forgetting could potentially look like. Fixed points are: “day 0” = 100 words; day 10 = 20 words. […]”
The complete wording can be accessed online via the Open Science Framework portal (Blech & Gaschler, 2017b). The original test language was German, while the English translation was created afterwards for scientific communication. Important to note, the vignette task did not offer any hints as to the exact shape of the curve. The assumed progress or decline in vocabulary recall had to be drawn freely, differing, for example, from the mere recognition format of a multiple choice question. Nevertheless, quantitative analysis was possible by reading off the numeral values from the manually drawn curves and entering them into Microsoft Excel spreadsheets. This allowed both for curve fitting (Blech & Gaschler, 2017a) and for at least four basic measures and indices that we will outline in the following sections.
Indices to Assess the Quality of Student-Drawn Curves
Mean Deviation from Diagonal Axis
For this index the hypothetical straight line connecting the starting point and the endpoint in the vignette tasks, that is, the diagonal axis, served as a reference standard. Since a drawn learning curve matching the assumptions of a constant relative learning rate implies a negative acceleration, an appropriate learning curve is positioned neither below nor in close overlap to the diagonal axis. Rather, it is placed distinctly above the diagonal axis. A forgetting curve, on the other hand, should be placed below the diagonal axis. The mean deviation from the diagonal axis (MDDA) can be calculated by determining for each time point (x-axis) the corresponding value on the y-axis (based on the straight line connecting the starting- and the ending-point of the vignette), in order to then subtract it from the y-value in the drawing. By summing and averaging these differences one obtains a value which represents the extent to which the drawn curve is below or above the diagonal. Such calculations can be implemented in a computerized online version. When paper and pencil are used in a seminar, students can draw a reference line with a ruler by themselves and visually estimate whether the curve is above vs. below the line. This, too, should be practical and sufficient to fuel an immediate classroom discussion about the topic. For the learning curve vignette, high numerically positive MDDA values indicate that a student-drawn curve follows a plausible course, while for the forgetting curve vignette, small numerically negative values are appropriate.
Figure 2 shows two examples of student-drawn learning curves from our sample together with their MDDA values. Based on the visual inspection of such prototypes, we set the values of +/− 10 as tentative cut points in order to distinguish a more or less linear course from a truly curved shape. Students whose learning or forgetting curve fell within the range between −10 and +10 were classified as having drawn a linear increase. The same scheme was applied for the forgetting curve vignette in which the difference between starting point (100) and endpoint (20) accounted for the same numerical value (80) as in the learning curve vignette. It should be noted, however, that the reference of +/−10 is not a standardized value but depends on the scale of the corresponding vignette.
Two examples of student-drawn learning curves in relation to the linear time course of the diagonal axis (straight dotted line). #1 with a high positive mean deviation from the diagonal axis displays quite appropriate knowledge whereas #2 with a low, even negative value for the mean deviation index displays no accurate knowledge about the learning curve.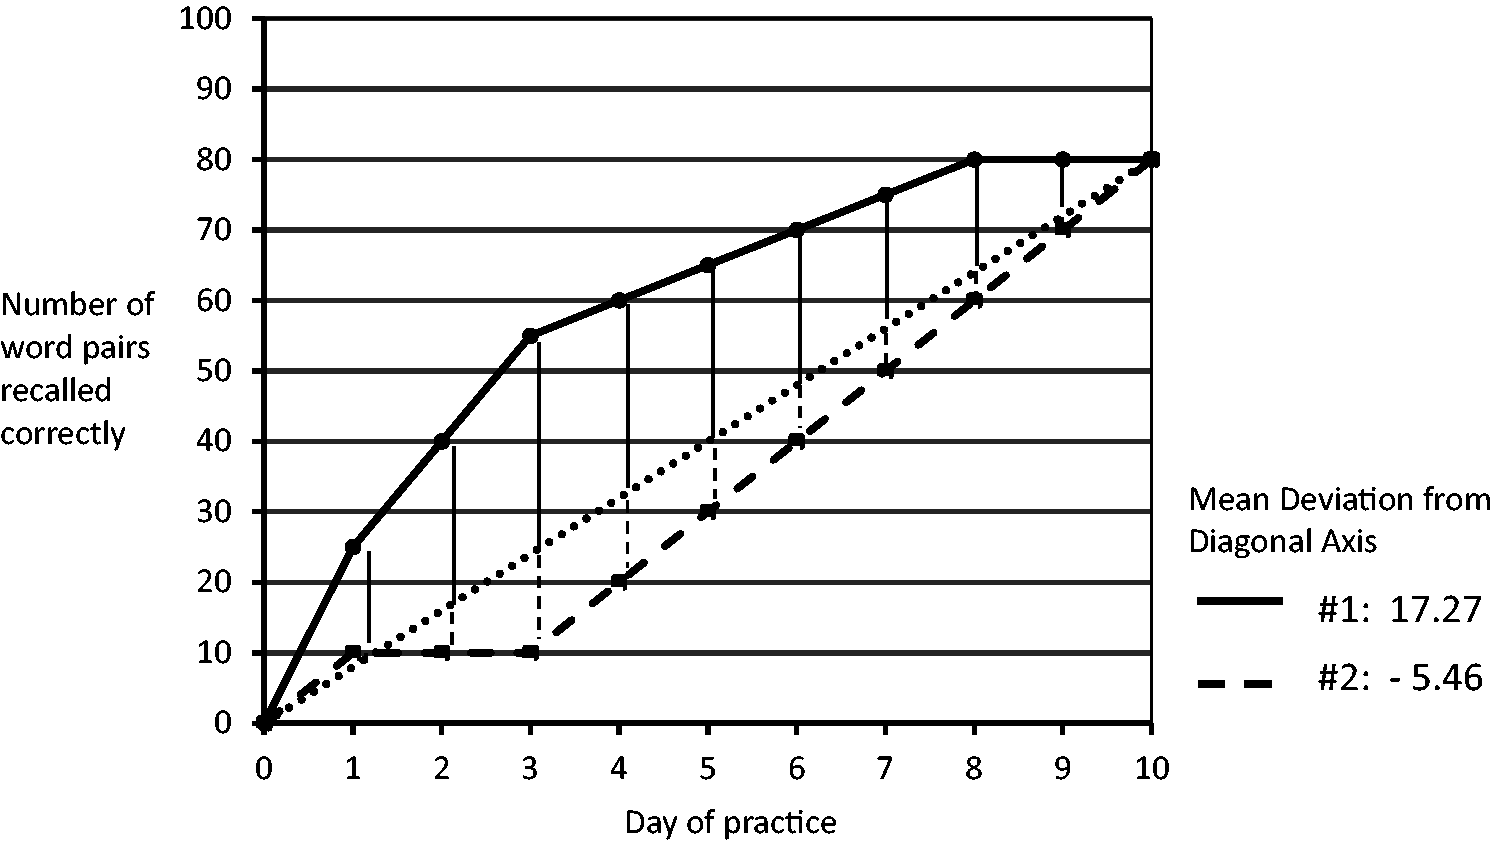
Acceleration Index
The acceleration index (AI) was constructed as a similar, approximate indicator to determine the trend of a drawn learning or forgetting curve. Neglecting all other entries in the chart, the AI was based only on the starting point, the endpoint and on a midpoint, which, for the vignettes at hand, was the y-value of time point number five, right in the middle between time point 0 and 10 from the x-axis. In the formula

ΔH1 is the gain in performance between the starting point and the midpoint, that is, the increase of y-values taking place in the first half of the total learning interval. ΔH2 is the increase of y-values in the second half, the change between the midpoint and the endpoint. A positive value for AI roughly relates to a negative acceleration, while a negative value would be interpreted as a positive acceleration, and the exact value of zero would hint at a constant acceleration.
Step Function Fit
Applying acceleration-based indicators is particularly useful when the drawn learning curves are smooth in shape, lacking abrupt onsets, steep increases, or any other kinds of zigzag-like courses. Student-drawn learning diagrams, however, sometimes display such jagged lines indeed. The current vignette featured learning (forgetting) over many items. Therefore, the time course should be smooth rather than characterized by an abrupt change. We thus expected that the best fitting step function would fit worse than the best fitting negative exponential function. The best fitting step function could be determined by trying each of the time points (x-axis) as a possible change point. The average of the values before the potential change point was used to set a straight horizontal line as description of the data before the change point. The same was done for the data after the potential change point. For one of the potential change points, the sum of the squared deviations of the data from a line before and after the change proved minimal. This identified the best-fitting step function. The best-fitting negative exponential function was

with A = 0, B = 80, and C = 0.30 for the learning curve and A = 20, B = 80 and C = −0.30 for the forgetting curve. The extent of the curve fit was calculated as R2 measures, that is, squared correlations between the actually drawn y-values and the respective y-values predicted by the two competing types of function.
Lags
A lag or delayed onset in a learning or forgetting curve diagram was simply defined as the exact repetition of the y-value of the initial time point 0 in at least one of the time points that followed immediately. For example, if a forgetting curve started with the prescribed y-value of 100 words in week 0, and the drawn curve displayed the value of 100 words also for week 1, we coded the existence of a lag.
Results
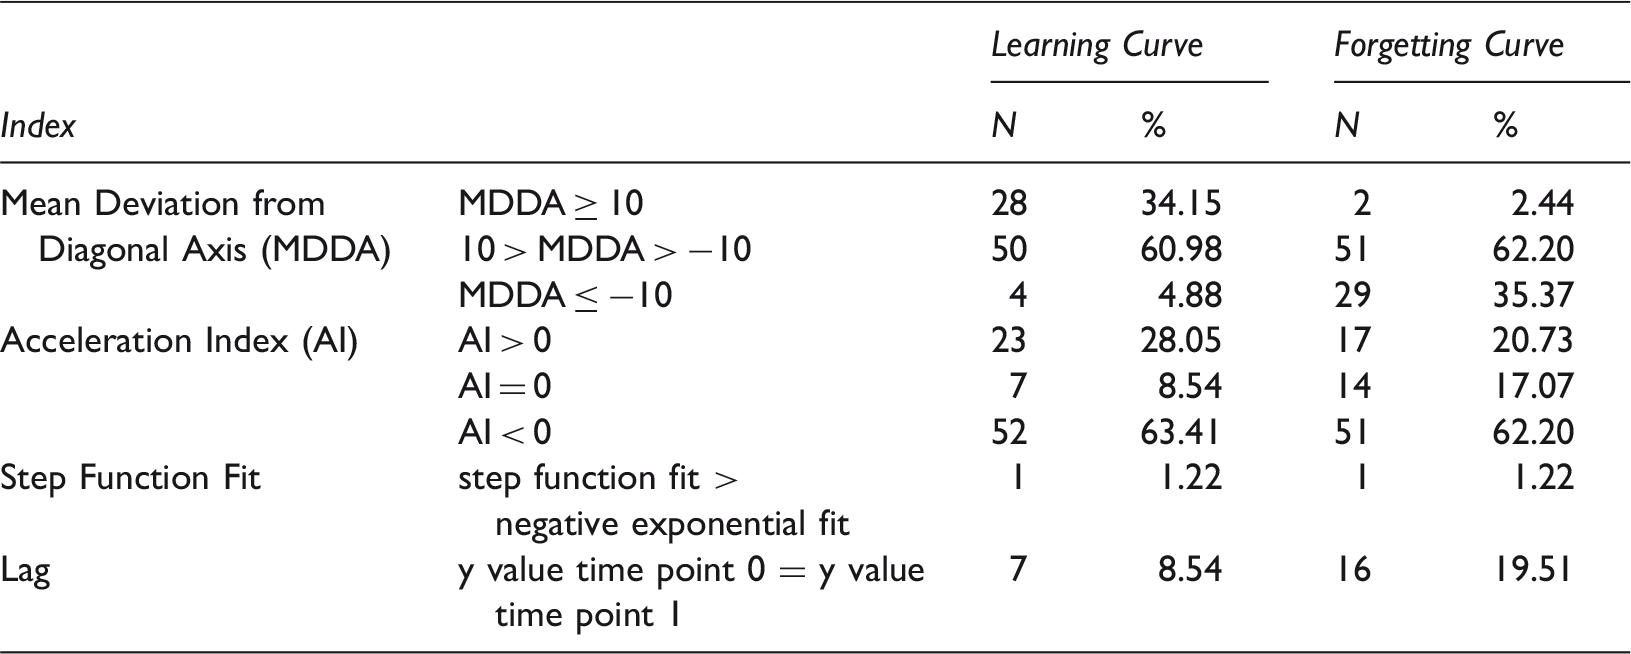
Frequencies and percentages for four knowledge indices in learning and forgetting curves (N = 82). Find further explanations in the text.
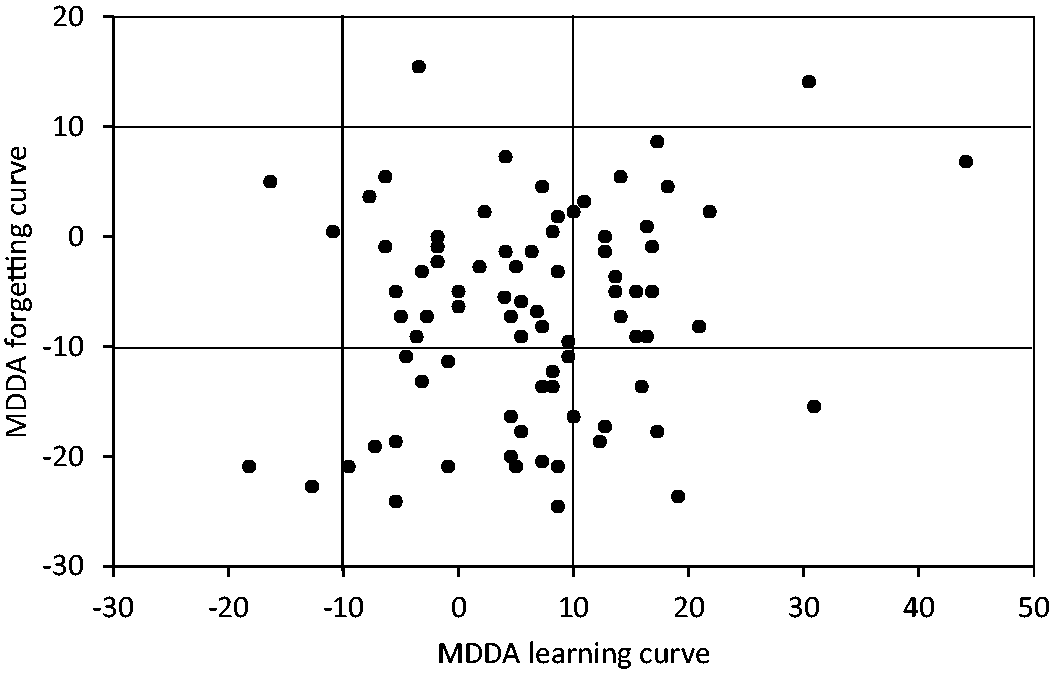
Mean deviations from the diagonal axis (MDDA) for the learning curve on the x-axis with MDDA values for the forgetting curve on the y-axis. One dot represents two facets of knowledge for one participant (N = 82). Subjects scoring in the central square of the scatterplot drew both learning and forgetting curve close to the diagonal axis. Subjects scoring in the right bottom quadrant drew two appropriate curves: a learning curve distinctly above the diagonal and a forgetting curve distinctly below the diagonal. A potential systematic relationship between learning and forgetting curve knowledge should have manifested itself in a narrow point cloud with a falling trend. No such trend is displayed here.
Going beyond the descriptive statistics we also searched for systematic interrelationships between learning and forgetting curve knowledge because this, too, might allow for conclusions about students’ knowledge depth. For example, it might seem likely that students with high learning curve knowledge should also do well on the forgetting curve vignette since the performance in both tasks can stem from one common, comprehensive mental model. We tested for this possibility by means of Pearson correlations. Lag indicators were not included in these analyses since the baseline frequencies were low. MDDA was preferred to AI since the continuous scale level of MDDA should have made it more likely to detect systematic contingencies. The bivariate correlation of MDDA values for each person’s learning and his or her corresponding forgetting curve was, however, only r = .17, and not significant, p = .13, as the scatterplot from Figure 3 indicates. To corroborate the finding, we also correlated the negative exponential learning curve fit (R2) with the equivalent forgetting curve fit, obtaining a virtual zero correlation, r = −.04, p = .71.
Finally, based on the same two dependent variables, we checked for potential effects of prior knowledge (dichotomous items). Using Mann–Whitney-U tests we compared whether students claiming to have seen the forgetting curve in the study material (handed out at the beginning of the semester; n = 41, 50% of the sample) had more negative (i.e., better as the forgetting curve should be below the diagonal) values of MDDA and higher exponential fit indices as compared to students denying it. Equivalently, students confirming to have seen a learning curve in the study material (n = 35, 43% of the sample) were compared with the subgroup of students disconfirming this dichotomous item. No systematic effects were found (all four p > .21). In fact, 43% of students falsely remembered a learning curve which actually did not exist in the study material at that time. This suggests that learning and forgetting curves had caught little attention prior to the testing.
Discussion
To summarize the results, students’ learning and forgetting curves rarely depicted clearly wrong trends such as a positive acceleration where a negative acceleration would have been the suitable choice. Still the psychology students in our sample appeared too cautious to draw their curves with a clear, distinct negative acceleration. The majority assumed a linear rising learning curve and a linear falling forgetting curve. Forgetting curves were drawn with delayed onsets in about 20% of the cases. This might be due to the (refutable) lay theory that forgetting processes need some time to manifest themselves. A lack in consistency between the quality of learning and forgetting curve knowledge suggests that although we cannot rule out individual difficulties in understanding the vignette task with full certainty, there seemed to be misconceptions at work in the students’ minds.
Why Do Students Lack Appropriate Knowledge about Learning and Forgetting Curves?
In order to answer the above question, we suppose that at least four factors may have an impact. First, testing took place before a change in curriculum implying more attention to learning and forgetting curves. In other words: the issue of learning and forgetting curves was only slightly treated in the seminars and study material, so a large proportion of students who obviously confused learning and forgetting curve depictions had acquired merely superficial prior knowledge. Second, the vocabulary learning vignette used did not fully reflect the psychology students’ actual learning context. While university students can look back at many learning-and-testing episodes at school and in higher education, this does not seem to be sufficient to abstract the functional principles of learning and forgetting. As one limitation, one should recognize that rehearsing vocabulary as in the applied vignette refers to a rather elementary type of learning. Students’ everyday experiences in learning imply more than rote learning. Figuring out a learning curve for complex learning issues would be a sophisticated matter: different types of information, dependencies among the learned facts, and also tacit knowledge (Collins, 2013) such as general skills must be considered. Students whose learning experiences are based on such broad perspectives may be irritated when it comes to the unusual, academic scrutinizing of a learning (or forgetting) progress for single, separable units such as word pairs in lists. Admitting that visualizing the learning progress for complex, compound behaviors is not only a challenge to learners, but also to psychologists, this topic might be a future research perspective.
A third point to consider is that from an economic point of view, taking into account information-laden curricula and low time budgets, student learners are well off to set, for example, 80% goals instead of striving for perfectionism. Their characteristic study strategy follows the satisficing principle which means that students merely invest as much effort as necessary to satisfy and suffice the teachers’ demands (Hadar, 2011; Simon, 1955). Doing so, they only experience the progress corresponding to the first, especially rewarding part of the learning curve. In fact, the notion of a linear increase in performance may (almost) be true; the learner simply omits the long-term perspective, that is, the second part of the learning curve diagram in his or her mental model. A fourth potential explanation for our empirical findings concerns the relationship between epistemic beliefs and learning curve knowledge, which will be scrutinized in more detail below.
Two Facets of Metacognition: Epistemic Beliefs and Knowledge about Learning
As briefly touched on in the introduction, epistemic beliefs represent lay theories with respect to diverse aspects of learning and knowledge, for example, whether (1) knowledge changes over time, whether (2) one single correct solution of a problem exists vs. whether alternative approaches may be applied, whether (3) knowledge is provided by authorities in a predefined, unquestionable manner vs. whether it is constructed by the learners’ own critical reasoning, or whether (4) it is made up of from isolated facts vs. from a broad composition of intertwined topics (Hofer, 2004). These assumptions are not necessarily constant but can undergo characteristic developments as the learner matures or becomes more experienced in a field (Hofer & Pintrich, 1997; Kuhn & Weinstock, 2002; Rosman, Peter, Mayer, & Krampen, 2018).
Many researchers expect that such abstract metacognitive convictions affect the learning outcome mediated through self-regulated learning (Muis, 2007): First, the metacognitive frame can simply serve as an aid to select a certain learning approach, to plan learning activities accordingly, and to monitor one’s own progress. Second, beliefs can set standards which regulate learning in terms of goal setting (Carver & Scheier, 1998; Locke & Latham, 2002). Hence, suboptimal learning behaviors and lower performance will arise when the metacognitive beliefs are dysfunctional. Dysfunctionality in the context of the present study would be a mismatch between a student’s individual, subjective learning belief and the general, objective mechanisms underlying a learning curve such as the constant relative learning rate (Heathcote et al., 2000).
Some examples may illustrate that in practice both students’ learning strategies and their beliefs suffer from shortcomings. Dunlosky, Rawson, Marsh, Nathan, and Willingham (2013) note that the popular, frequently used techniques of rereading texts, highlighting or summarizing are rated as ineffective from a didactical point of view. In contrast, the study methods with the most promising empirical evidence tend to be neglected, which is partly due to students’ and teachers lacking (metacognitive) knowledge: The testing effect, that is, the benefits of self-testing during studying, may be well-reviewed in the psychological literature (Rohrer & Pashler, 2010; Schwieren, Barenberg, & Dutke, 2017), nevertheless students refrain from acknowledging it since their subjective impression of knowing is higher when they simply read over a text again (Karpicke, Butler, & Roediger, 2009; Roediger, Finn, & Weinstein, 2012). The second most recommended technique by Dunlosky et al. (2013) is distributed practice as contrasted with crammed learning (see also Cepeda, Vul, Rohrer, Wixted, & Pashler, 2008). Just like with rereading texts, however, the often preferred method of crammed learning evokes a perceived cognitive fluency and thus an illusion of knowing and proficiency (Kornell & Bjork, 2008).
Among other factors, it might be this impression that brings students to expect – and hence draw – a linear rising trend in the diagram task of the study at hand. In other words, their own ineffective learning behavior would make them assume that there is a steady, noticeable progress even during later stages of the learning history. As an impulse for further research we recommend to closely investigate the interdependencies between learning beliefs (see e.g., the dimension of “quick learning” in Hofer & Pintrich, 1997) and learning (curve) knowledge. Most likely, there are bi-directional effects: While lacking knowledge about learning (and forgetting) principles can form deficient beliefs, the beliefs can trigger suboptimal learning behaviors which, in turn, rigidify inappropriate psychological knowledge in students.
Enhancing Learning and Forgetting Curve Knowledge: Online Trainings and Self-Awareness
Given the practical and academic relevance of the issue, different didactic approaches can be pursued to promote psychology students’ knowledge as well as their beliefs about learning and forgetting curves. Textbook examples may be enriched with practical examples, interactive online demonstrations can serve as visualizations, and quizzes can help to consolidate the acquired knowledge about learning and forgetting curves (Rohrer & Pashler, 2010; Schwieren et al., 2017).
Regarding the present diagram-based vignette technique, future work should in the first place validate the learning and forgetting curve measures by comparing them to other performance indicators (i.e., exam grades as suitable and economic criteria). If prior knowledge on learning and forgetting curves is raised, a more elaborate questionnaire or test should be applied. Drawing quality should correlate with responses on verbal and numerical items on the topic. For further development we suggest to combine web-based learning tools with “the power of feedback” (Hattie & Timperley, 2007; see also Kluger & DeNisi, 1996), especially instant, automatic feedback. As an illustrative example of a future implementation one can imagine that via mouse click students “draw” the course of a learning or forgetting progress over time in a digital coordinate system. Beforehand, they receive a brief cover story as in the vignette technique presented above. Such an online version of the task would allow the computer to calculate the quality indices we described in the method section. The fact that the measures are quite basic and easy to calculate makes this very functional. During the process of constructing the curve diagram, the student could get thought-provoking impulses from the computer. So, for instance, a pop-up feedback window might hint at the implausibility of the recent clicks, asking the student to reassess his or her creation of a positively accelerated curve. Inducing cognitive conflicts in the learner should stimulate conceptual changes, making such feedback particularly effective (Chi, 1992; Sinatra, 2005)
Also, it is important to highlight a specific advantage of the vignette technique: As Wittrock (2010) and the research tradition of Generative Learning have shown, constructing information instead of mere passive incorporation (such as reading a text, viewing a full-blown diagram) comes along with deeper, more sustainable learning. Drawing in particular has been found to have positive effects on learning outcomes (Ainsworth, Prain, & Tytler, 2011; van Meter & Garner, 2005), in addition to the generally high relevance of graphical representations in psychology (Smith, Best, Stubbs, Johnston, & Archibald, 2000; Smith, Best, Stubbs, Archibald, & Roberson-Nay, 2002). Keeping in mind the benefits of drawing and instant feedback, interactive online demonstrations as just described would not only serve the function of knowledge assessment, they could also be regarded as intervention tools. In the long run, similar forms of combined assessment and training could be developed for other relevant graph-based topics in psychology courses: curves in signal detection theory and receiver-operating characteristic curves (Green & Swets, 1966), diagrams on psychophysiological mechanisms such as the adaptive reaction to stress (Selye, 1950) or life-span developments of cognitive functions (cf. Horn & Cattell, 1967), to name a few examples. Committing oneself to the principles of evidence-based teaching (Richmond, Boysen, & Gurung, 2016), of course, one should evaluate the effectiveness of such trainings, for example, by pre- and post-tests.
Returning to the topic of epistemic beliefs and expected learning progresses in students’ pursuing their curriculum, training on learning and forgetting curves could become part of first semester welcome classes or freshmen’s counselling. Suitably, this would be taught along with instructions on distributed learning and self-testing. Accompanying diary studies or online self-reports might not only be revealing to educational psychologists, but also to the students, increasing their self-awareness. The more they are capable of tracking their own level of proficiency, the better they might set their individual high, yet realistic goals (cf. Locke & Latham, 2002), which in turn are positively related to learning motivation and study satisfaction (Hasenberg & Schmidt-Atzert, 2013). Considering that epistemic beliefs can grow and mature over time (Hofer & Pintrich, 1997; Rosman et al., 2017), the effort is likely to be worthwhile.
Footnotes
Declaration of Conflicting Interests
The author(s) declared no potential conflicts of interest with respect to the research, authorship, and/or publication of this article.
Funding
The author(s) received no financial support for the research, authorship, and/or publication of this article.