
Abstract
Teaching and theorizing in psychology has long been torn between targeting general underlying principles by observing dynamics in the individual or focusing on average behavior. As dealing with group averages is common practice in psychology, it is important for students to understand how individual learning curves relate to group average curves. In two experiments, we explore whether posing questions about the individual time course of learning can help psychology students to generate valid representations of the average time course of learning. Attempting to foster learning as a generative process, we provided students in Experiment 1 (N = 83) with vignettes asking them to draw hypothetical learning curves of individuals vs. averages over individuals (order of vignettes varied as experimental manipulation) into an empty coordinate system (time on the x-axis, performance on the y-axis; fixed start and endpoints). However, students who worked on the individual-time-course vignette first did not draw better average curves than those undertaking the reverse order of tasks. Experiment 2 (N = 36) found tentative evidence that providing students with a metaphor (falling leaves) can guide attention towards the variability of individual time courses.
The Ubiquity of Average Data in Psychology
Imagine a psychology student at the beginning of the winter term. While working on her statistic tasks her mind wanders off, she looks up from her textbook, out of the window and watches the leaves falling from a tree outside. Applying her newly acquired knowledge of statistics, she might wonder whether there is a way to describe the course the leaves take from the twig to the ground in a scientifically systematic manner. While a physicist might consider the interplay of gravity and turbulence to formulate a law capturing the dynamics of leaves falling from trees, the psychologist might be tempted to turn the average calculation into a straightforward, but wrong description of a law: that the downward movement of a typical leaf is not floating to and fro but like a stone dropping in slow motion (cf. Lindenberger & von Oertzen, 2006).
Psychologists frequently deal with quantitative data on behavior and the subjective experience of individuals. In many cases data averaged across individuals and/or episodes misrepresent important characteristics that are present in the data on the level of the individual or item (e.g., Gallistel, Balsam, & Fairhurst, 2004; Haider & Frensch, 2002; for early discussions of the issue see Estes, 1956; Lewin, 1930). Observation in teaching led Abelson (1995) to the conclusion that psychology students (and in many cases also researchers) seem to adopt the widespread practice of testing theoretical hypotheses by using means per groups very readily. Translating theoretical hypotheses into a statistical test of means per condition may follow a routine rather than a reflected-upon research practice (see also Gigerenzer, 1991, 1998). In fact, in some cases a frequency-based approach (Abelson, 1995) or an analysis of individual performance changes (Singer & Willett, 2003) would be more suitable.
Graphs as Illustrative Tools in Science and Teaching
Graphs such as sketches of Freud’s model of the mind or Lewin’s topology of intrapersonal dynamics have gained the status of iconic milestones in the history of psychology (Wieser & Slunecko, 2013). Presumably, today graphs play an even stronger role in science. For instance, Brewer (2012) pointed out that scientists nowadays rarely observe their object of interest directly. Instead they check graphs displaying data, often together with quantitative predictions of theories. Unlike tables, graphical displays of quantitative data or mathematical predictions allow relatively easy comprehension of relations of quantities or patterns because our visual perceptual system is specialized in processing spatial relationships such as the relative height of two columns in a bar chart (e.g., Peebles, 2008). Graphs are also increasingly relevant in communicating scientific endeavor among researchers. Smith and colleagues (Smith, Best, Stubbs, Johnston, & Archibald, 2000; Smith, Best, Stubbs, Archibald, & Roberson-Nay, 2002) compared scientific journals across disciplines and observed that the percentage amount of graphical data displays in publications was higher for psychology than for the less graph-loaded social sciences and arts, though lower than for the highly graph-loaded natural sciences. Thus, learning with and about data graphs also affects psychology students (Selden, 2014).
The Learning Curve: Concepts and Misconceptions
Learning- and forgetting curves are prominent examples of graphs that students are faced with in introductory psychology courses (cf. Griggs, Bujak-Johnson, & Proctor, 2004; Simon, 1990; Teigen, 2002). In a coordinate system, the learning curve displays the amount of practice on the x-axis and the performance (e.g., correctly recalled items in a memory test or time spent per mental arithmetic problem) as the criterion on the y-axis. The underlying question of interest concerns the quantitative relationship between practice and performance and which inferences can be made from the shape of the learning curve.
From cigar rolling to mental arithmetic—in the past a large number of practice phenomena have been modelled referring to the notion of the power law of practice (e.g., Crossman, 1959). As the power function was found to describe many different skill acquisition data sets very well, its role changed from description to prescription: it was regarded as a benchmark phenomenon that any theory of skill acquisition needed to account for (e.g., Logan, 1988). The corresponding learning curves were thus either fit by power functions (in equispaced coordinate systems) or by straight lines in diagrams on logarithmic paper (Crossmann, 1959).
Notably, this endeavor had mostly used an average-first approach. Similarly to the introductory example on falling leaves, researchers first averaged across participants and episodes to only then test which mathematical functions would best fit the data. The average-first approach was taken in order to (a) first cancel out noise and—in former generations—to (b) comply with the limited power or scarcity of microcomputers (cf. Heathcote, Brown, & Mewhort, 2000, for a discussion). Yet, as Lewin (1930) or Estes (1956) pointed out early on, averaging first proved to be misleading researchers in the long run. While average practice data are best described by the power function, data of the individual participants are not. If performance improvements are based on abrupt qualitative changes, for example, on a new solution strategy, step functions provide a better fit (e.g., Gallistel et al., 2004; Gaschler, Marewski, & Frensch, 2015; for an example on animal learning in student textbooks: Haider & Frensch, 2002). In any other case a negatively accelerated exponential function best describes the time course in the individual (Heathcote et al., 2000; see, e.g., Gaschler, Progscha, Smallbone, Ram, & Bilalic, 2014, for formulas, graphs and descriptions of the power practice function and the negative exponential practice function). Thus, with the time course on the level of the individual in mind, the power law turned out to be an averaging artifact with respect to some prior findings in learning and memory research (Myung, Kim, & Pitt, 2000).
Teaching Learning Curves: A Self-Generative Approach
In the present paper, we aim to take first steps towards an active method for teaching learning curves in psychology, an approach which could also lay the ground for interactive internet-based graph-drawing tools with instant qualitative feedback to the student (cf. LoSchiavo, 2016; Mills, 2002). We assume that the full potential of graphs might be missed in teaching when we just present them to students. Presenting students with a graph might lead them to overly rely on specific aspects of the graph provided (e.g., the specific starting level and the specific curvature) instead of the more abstract principles that are relevant (e.g., continuous vs. discontinuous changes with performance, acceleration or deceleration). Similar to items in a multiple-choice test that necessarily feed recognition memory (cf. Dutke & Barenberg, 2015), providing a full-blown graph might give away more information than would be good to engage a student in constructive processing (but see Little, Ligon Bjork, Bjork, & Angello, 2012). Our approach thus relates to generative learning (e.g., Wittrock, 2010). Using a vignette technique and an empty coordinate system, we first simply asked students to draw what they believe a plausible learning curve might look like. Doing so can activate prior knowledge and everyday experience such as remembering a level of stagnation during one’s personal learning history. Following the theory of generative learning, this will lead to new knowledge being incorporated into already existing mental structures making it more robust and easily retrievable.
Furthermore, generative learning in combination with drawing has some specific benefits on learning outcomes beyond being simply motivating and activating (Ainsworth, Prain, & Tytler, 2011). Among others, Schwamborn, Mayer, Thillmann, Leopold, and Leutner (2010) experimentally showed that school students who translated textual information into drawings scored higher in subsequent knowledge tests than control students from a reading-only-condition. Theoretical foundation for this effect was first provided by Meter (2001) and van Meter and Garner (2005; see also Leutner & Schmeck, 2014) in their Generative Theory of Drawing Construction. The authors outlined an iterative mechanism to explain how learner-generated drawing (translating verbal information into a sketch or graph) leads to enhanced cognitive models. While the starting point may be an incomplete representation of the structure of a blossom plant for example, the act of drawing will confront the learner with potential information gaps, such as not knowing the number of petals or the location of stamens. In order to fill the gap, he or she should actively search for new knowledge or try to retrieve relevant information acquired in another context. Hence connections between already existing and new knowledge will be strengthened, forming a coherent overall representation with both verbal–symbolic and visual elements (Paivio, 1986).
Second, the integrated model of text and picture comprehension by Schnotz and colleagues (e.g., Schnotz & Bannert, 2003), can explain why—beyond the idea of mere dual coding—some drawings are more beneficial than others. The model assumes that learners derive abstract semantic features from a visual presentation (bottom-up process) as well as superimposing expected abstract features on a given visualization (top-down). Both processes operate on higher- and lower levels of cognition and are highly intertwined. The better the visible surface structure of a picture or diagram matches the deep structure (i.e., the meaning or semantic), the more easily a learner can form a mental model. In contrast, a task-inappropriate surface structure which obscures the meaning of a diagram can impair model formation (Schnotz & Baadte, 2015). Surface structures may either trigger helpful schemata, which focus the attention on relevant aspects, or they may activate peripheral, often misleading information. With respect to our study it is important to note that: (a) the high impact of the meaning or deep structure in graphics comprehension once again suggests that active, generative learning plays a major role; (b) graphics comprehension can or even should be supported by textual information (see also Zhao, Schnotz, Wagner, & Gaschler, 2014); and (c) the positive effects of drawing are not confined to pictures or sketches but also apply to graphs or diagrams (Ainsworth et al., 2011).
Hypothesis and General Methodological Outline
We assumed that the positive effects of the self-generative approach would be particularly distinctive when the above-mentioned drawing task focuses on the individual learning processes which underlie the aggregated learning curves found in textbooks. According to our hypothesis, thinking about an individual learning curve prior to considering the average curve would go together with more precise mental models of learning curves than considering an average curve right from the start. Therefore, in this study we explored whether drawing a hypothetical learning curve of an individual as a first task (individual-time-course task) would help psychology students to draw a more plausible learning curve averaged over a hundred individuals as a second task (average-of-hundred task). We employed quantitative analyses from skill acquisition research to quantify the characteristics of the drawings provided by students in the two experimental groups. More specifically, the student-drawn curves were fitted by three types of functions as a comparison standard: the two decelerating continuous practice functions; power function and negative exponential function (see Figure 1(a)); and the step function (see Figure 1(b)).
The power and the negative exponential function as examples of continuous practice functions which are characterized by large gains early in practice and small gains late in practice (Panel A) and the step function as an example of a discontinuous practice function (Panel B).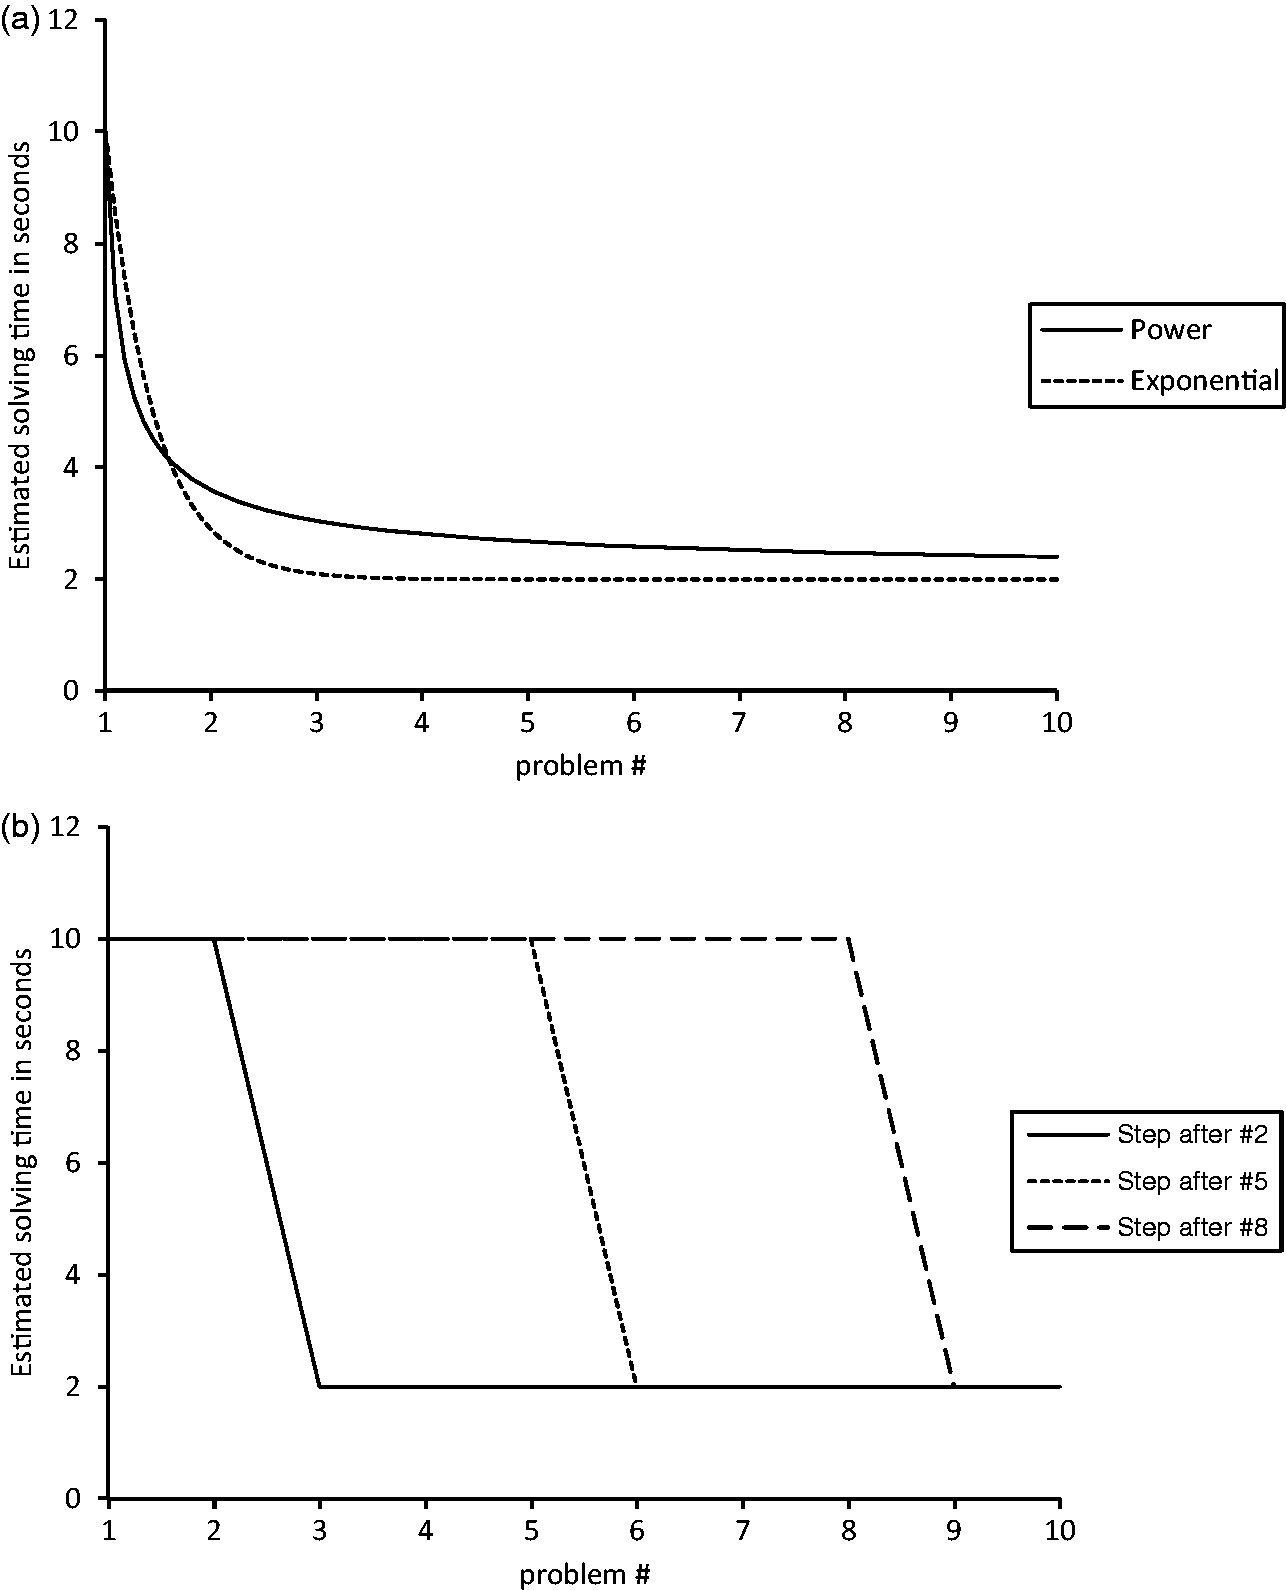
Given that average learning follows the power function as demonstrated repeatedly, the power function seems to be an adequate standard of comparison for the student-drawn average learning curves. However, as the task of our participants was to draw one plausible curve representing the average of 100 children, statistical averaging artifacts (which favor the power function) do not necessarily play a role. Given the debate on the power vs. the negative exponential function in skill acquisition (see above), the negative exponential function should be taken into account as a plausible alternative as well. Last, we used the step function as a (negative) standard to assess the quality of the learning curves drawn in the average-of-hundred task. This non-linear function is not a plausible candidate for average learning data, while it can capture individual time courses well (cf. Gaschler et al., 2015). We included the latter function for two reasons: first, given the flexibility of nonlinear functions to fit data, it is important to include a candidate that is theoretically implausible (to show that it is not the case that any nonlinear function provides a good fit, cf. Roberts & Pashler, 2000); and second, this enabled exploring whether an automated online teaching system could select appropriate feedback based on curve fitting.
Experiment 1
Method
Participants
Eighty-three undergraduates (16 male) enrolled in the B.Sc. Psychology course at the FernUniversität in Hagen participated in this study. Their age varied from 20 to 61 years (mean (M) = 31.17, standard deviation (SD) = 9.48). Three participants did not complete the full procedure, leaving us with 42 students in the individual-time-course-first condition and 38 participants in the average-of-hundred-first condition.
Materials and procedure
Students were recruited at seminars in Berlin and Hagen in summer term 2015. They participated voluntarily for course credit. The focus of the seminars was to repeat and discuss work in cognitive psychology and cognitive neuroscience on learning and motivation. Learning- and forgetting curves were not discussed until after data collection. Students were instructed that they could take part in a paper and pencil study aiming to provide a basis for improved teaching methods. It was stressed that such a study could only be undertaken with psychology students so that their participation was especially valuable (compared to other studies run with psychology students for convenience rather than for special interest in this population). They were informed that their results would be analyzed anonymously and that they could abandon the 15-minute data collection at any time they wished. While instant individual feedback was not possible with this type of study, it was made clear that participation would provide a self-test of one’s knowledge about forgetting- and learning curves.
Vignettes
Data collection included a first phase of practice with the vignette technique: Participants were asked to imagine that the task was to learn a hundred pairs of vocabulary. They were (in counterbalanced order) to draw: (a) a potential learning curve; (b) a potential forgetting curve; and (c) a curve that would describe how effort in vocabulary learning would have to change over days of practice if the goal was to obtain a linear increase in number of vocabulary pairs retained. Each of these three drawing tasks was accompanied by a detailed description and an empty coordinate system.
Afterwards, the vignettes of the average-of-hundred task and the individual-time-course task were presented in counterbalanced order (random assignment within course). Students received all tasks in a booklet. Booklets were prepared such that the order of tasks could not be seen when handing them out. A learning curve vignette consisted of a short text on a learning scenario such as this: “Imagine one primary school child is working on a sequence of arithmetic problems corresponding to the scheme a + b – b = ? [e.g., 7 + 2 – 2 = ?]. The child takes 10 seconds for the first problem, two seconds for the last […] Please draw what the time course could potentially look like.” Arithmetic problems of this form have been used by Siegler and Stern (1998) and allow for a strategy change (i.e., a qualitative change in how a task is performed, which can be accompanied by abrupt changes in performance, cf. Gaschler et al., 2015).
A coordinate system was presented below the text, displaying time point (first to 10th arithmetic problem) on the x-axis and solving time in seconds per arithmetic problem (0 to 12 seconds) on the y-axis (see Figure 2). The participant had to mark the fixed starting point of 10 seconds at t1 and the fixed endpoint of two seconds at t10. The course of the line between these points had to be drawn freely according to the subject’s personal assumptions. There were no hints given as to whether the curve should be smooth or jagged, linear or curved, positively or negatively accelerated. The answers of this free report technique were later transferred into quantitative measures by gaging which y-axis value corresponded to each learning unit on the x-axis. An illustration together with the wording of the vignettes (Blech & Gaschler, 2017) is provided online in the Open Science Framework.
Example of an empty coordinate system presented for drawing.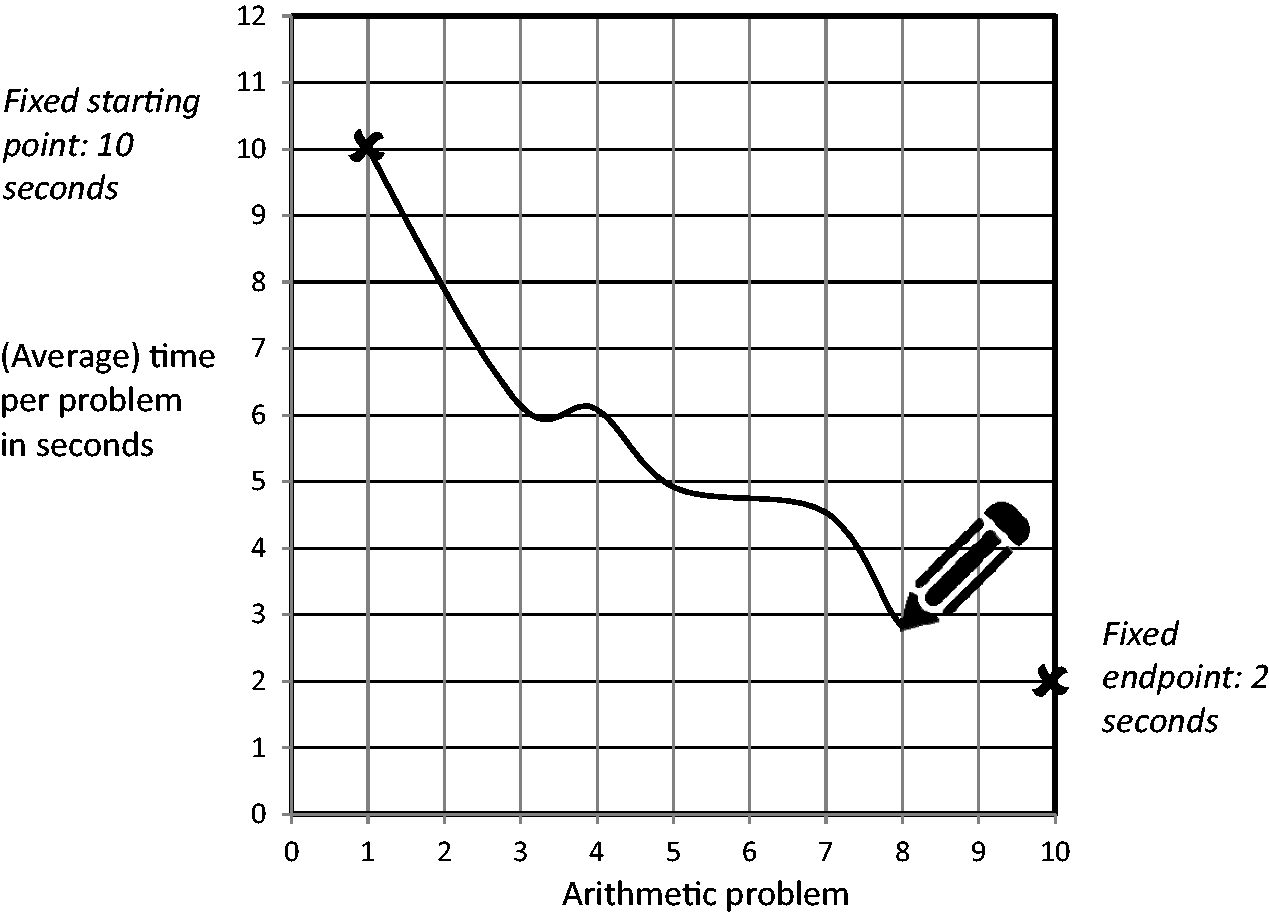
The example just described the individual-time-course task. In its counterpart, the average-of-hundred task, psychology students were asked to envision one hundred primary school children working on an otherwise identical vignette and draw the average curve. Words marking whether the task was about one individual child or about the average of a hundred primary school children were printed in bold to make sure that participants caught this difference between the vignettes.
Additional measures
The closing questionnaire, presented after the vignette tasks, assessed sociodemographic items (age, gender) as well as prior knowledge about learning curves. Participants were asked if they had seen the depiction of a learning curve before, for example, in the study material provided within the recent course they were recruited at. Finally, we assessed (based on a scheme provided by Handerer, 2012) general convictions concerning the methodological perspective psychology should adopt (i.e., focusing on a quantitative vs. qualitative perspective). Items started with “in my opinion research in learning psychology should be…” and “in my opinion application of learning psychology should be…”. They were rated on seven-point-Likert scales from 1 (nomothetic) to 7 (idiographic), 1 (quantitative) to 7 (qualitative), and 1 (elementary) to 7 (holistic). Terms such as nomothetic vs. idiographic were each briefly outlined in two sentences. The rationale was to explore whether students favoring a qualitative approach in psychology would differ in performance on the drawing task from those favoring a quantitative approach.
Results
The paper and pencil data were entered into a spreadsheet rounding the level of the drawn data points to the acuity of half units of the y-axis. Figure 3 shows the responses of a subsample of twelve participants. Curves showing continuous performance gains were present both in the average-of-hundred task and the individual-time-course task. Figure 3 suggests that abrupt changes of performance were rarely drawn, but even occurred in the average-of-hundred task where they should seem highly unlikely.
Drawings of a subsample of 12 participants of Experiment 1 in the average-of-hundred task and the individual-time-course task.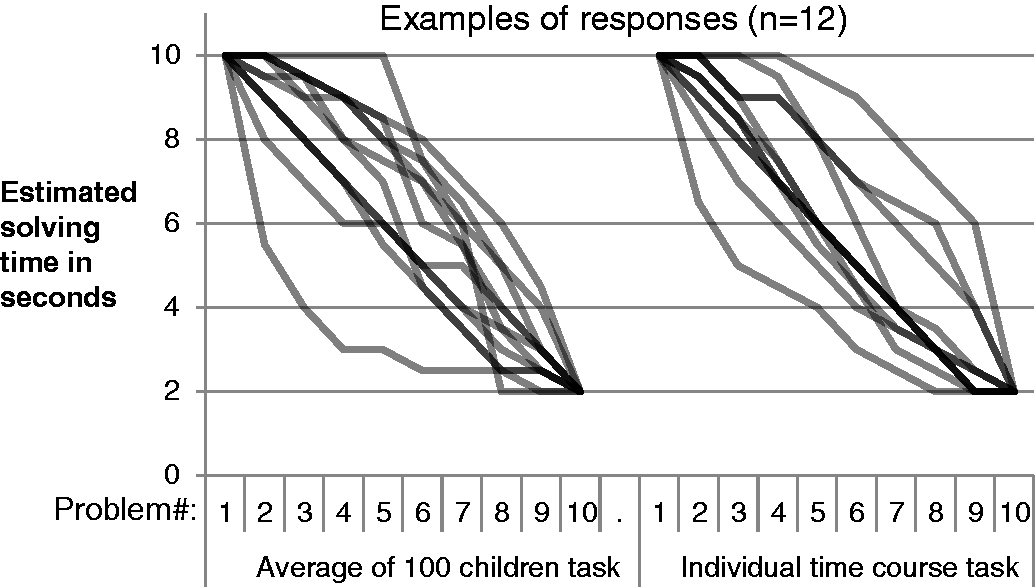
Fitting procedure
Curve fitting was done to calculate the degree of accordance between student-drawn curves and the three comparison functions. While the rationale for this procedure has been outlined above, this section documents the implementation. As the participants were constrained in the instructions that solving time would have to be 10 seconds at Time 1 and 2 seconds at Time 10, we used these parameters to reduce the number of free parameters of the power function and the exponential function to just one. In the power function [Solving time = A + B * time point- C ], we thus fixed the asymptote ([A] = 2 s) and the difference between asymptote and initial performance ([B] = 8 s), leaving curvature [C] as the only free parameter. The same was done for the negative exponential function [Solving time = A + B*e- C *time point] representing the second plausible candidate of a smooth nonlinear practice function.
A step function consists of a high level, a low level and a point in practice at which the level is changed. The best fitting step function was determined by considering each time point as the potential point of change between the two levels and then determining which time point led to the least squared differences summed up over the entire time course (cf. Gaschler et al., 2015, or Rickard, 2004 for this procedure on skill acquisition data). As instructions required participants to end the curve at a level of two seconds, the step function effectively had two free parameters, the starting level and the change point. While a drawing had (per instruction) to start at the level of 10 seconds, the curve could hover at a medium level (e.g., remain at around eight seconds until t6) before ending (as instructed) at a level of two seconds. Therefore, the starting level was a free parameter. Once the best fitting step function was determined, R2 was calculated for this function.
Hypothesis testing
In order to test whether working on the individual-time-course task first would indeed improve the quality of the curve drawn in the average-of-hundred task, we compared the power function fit of students who did (Mean R2 = 0.72) vs. did not (Mean R2 = 0.70) solve the individual-time-course task beforehand and found no difference, t (78) = 0.66, p = 0.51 (Figure 4). When the negative exponential function was used as an adequate smooth nonlinear standard of a learning curve we did not observe a difference either (Mean R2 = 0.91 in the individual-time-course first condition vs. R2 = 0.88 in the average-of-hundred first condition, t (78) = 1.50, p = 0.138). While the experimental manipulation had no effect, it was evident that the negative exponential function provided a better fit than the power function, t (79) = 30.45, p < 0.001, yielding a higher R2 for all but one participant.
Average R2 values indicating the fit of the step function vs. the power and the negative exponential function in the average-of-hundred task and the individual-time-course task in Experiment 1.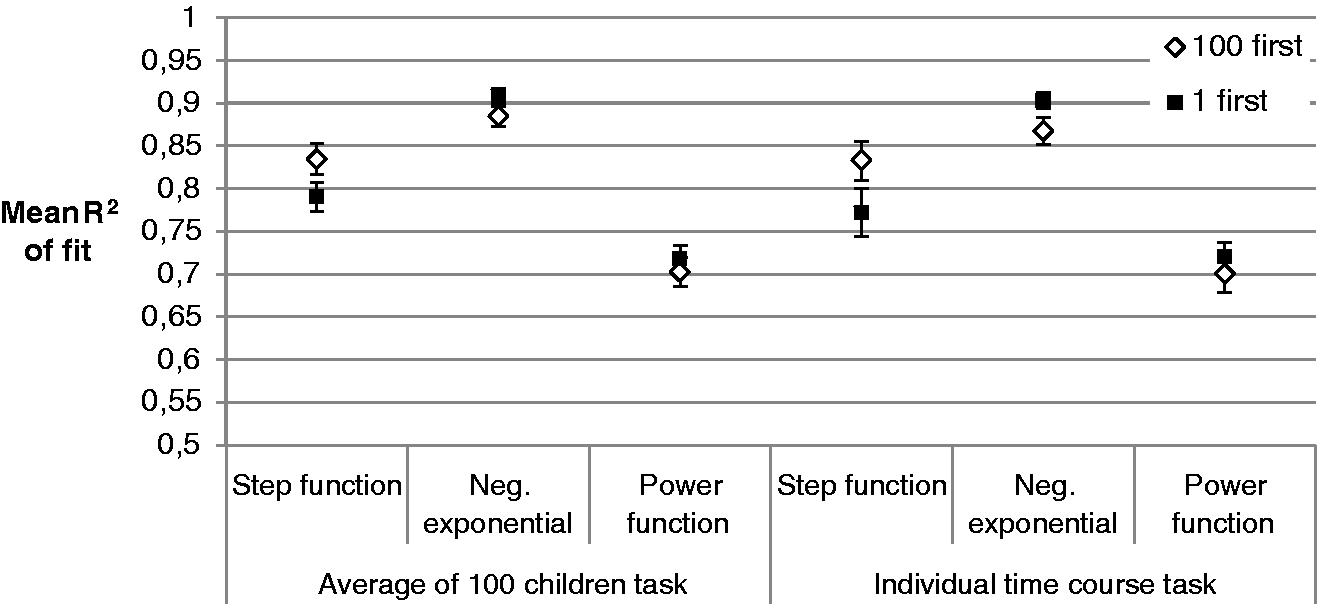
Follow-up analyses
Given that the individual-time-course task lacked a substantial transfer effect on the average-of-hundred task, it was crucial (as a manipulation check) to evaluate whether this task was successful at all in making participants activate or construct knowledge about how individual time courses should look like. We expected that students might spontaneously generate individual time courses that represent abrupt changes in performance. Thus, the step function should adequately capture some of the drawings. For only 23.8% of the participants solving the individual-time-course task first and for 36.8% of the participants solving it second, the step function provided a better fit to the drawing in the individual-time-course task than the negative exponential function, Chi2(1) = 1.614, p = 0.204.
Interestingly, performing the individual-time-course task first seemed to be effective in reducing the number of (inadequate) drawings in the average-of-hundred task. For 34.2% of the participants working on the average-of-hundred task first, the step function erroneously provided a better fit than the negative exponential function as compared to only 14.3% for participants who had before worked on the individual-time-course task, Chi2(1) = 4.373, p = 0.037. Though in line with our hypothesis, this finding should be interpreted with caution since the average fit of the step function was not better in the individual-time-course task (Mean R2 = 0.80) than in the average-of-hundred task (Mean R2 = 0.81; t (79) = 0.58, p = 0.565). As step functions are normatively wrong in the average-of-hundred task and are plausible in the individual-time-course task, this should have been represented in the average fit of the step function as well.
Curves in study material had drawn little attention
Results of the post-experimental questions suggested that students had granted little attention to learning and forgetting curves so far. When asked whether they had seen a forgetting curve in the written course material, 51% confirmed. Given that a graphical variant of the Ebbinghaus forgetting curve was indeed included in the script that each student had been sent home as a book (approximately three months prior to the seminar), this rate seems low. Furthermore, 43% (falsely) reported that they had seen a learning curve in the course script. Personal convictions about the extent to which psychology should focus on a quantitative vs. qualitative perspective were not systematically related to performance in the drawing task, either.
Discussion
In Experiment 1 we found that psychology students’ representations of group average learning curves are well captured by continuous non-linear practice functions. In particular, the negative exponential revealed a better fit than the power function. Having to consider a hypothetical time course of an individual as prior task did not robustly improve the quality of the average learning curve representations.
We had assumed that drawings generated in the individual-time-course task might serve as a reference frame in the average-of-hundred task. Drawing an individual time course might help to represent the constraints that are relevant for an average time course. If, for instance, a student drew a discontinuous time course in the individual-time-course task, she/he might reason that abrupt changes would level out across individuals. Therefore, they should not occur in the average-of-hundred task. However, discontinuous time courses were not highly prevalent in the individual-time-course task. Differences between the drawings in the two tasks were subtle, at best. We thus reasoned that it might be necessary to guide students’ attention towards: (a) the fluctuations and abrupt changes to be expected in individual time courses; and (b) the smoothing of such dynamics in case of a group average. In line with the idea of generative learning (see above) we aimed for a cognitive aid which was neither too directive nor merely implicit. In general, analogies or metaphoric descriptions are often well suited for this purpose since they stimulate learners to transfer knowledge from a well-known source domain to a less known target domain (Jaeger, Taylor, & Wiley, 2016). In the drawing task, active construction of a mental representation is involved. Given the visual nature of the learning curve task, a visual metaphor should be easily mapped. The falling leaves metaphor (see introduction) adapted from Lindenberger and von Oertzen (2006) was chosen because it alludes to an observation students should be highly familiar with.
Experiment 2
In Experiment 2 we explored whether providing students with the falling leaves metaphor would help them to differentiate between the individual-time-course task and the average-of-hundred task. We assumed that on the one hand the metaphor would lead to more variable time courses, that is, more abrupt changes attributed to the dynamics in the individual, while on the other hand it should smooth the time course attributed to a group average. The experiment therefore tested whether the metaphor would: (a) make the drawings in the individual-time-course task less similar to a continuous practice function; and (b) increase the fit of a continuous practice function to the drawings in the average-of-hundred task. Based on the results of Experiment 1, we chose the negative exponential function as the standard continuous practice function.
Method
Participants
Thirty-six different B.Sc. Psychology undergraduates (eight male) participated in this study. Their age varied from 19 to 62 years (M = 32.53, SD = 10.88). The testing was performed in a course on science studies which was not focused on learning curves.
Materials and procedure
Half of the participants were randomly assigned a sheet introducing the falling leaves metaphor. The metaphor text was approximately 300 words long, captioned “Individual and Mean Value,” and contained the information sketched in the beginning of this paper. The complete wording, originally in German, together with an English translation can be accessed online via a project entry (Blech & Gaschler, 2017) in the Open Science Framework. All participants were given the individual-time-course task and the average-of-hundred task (in random order).
Results
Students’ drawings (Figure 5) suggested that introducing the metaphor had a positive effect on the quality of the drawings. For the average-of-hundred task, step functions seemed absent in the metaphor group while some control participants not receiving the metaphor text indeed assumed that the average performance of hundred children would drastically improve at one certain point in practice. In the individual-time-course task, the text on falling leaves might have induced more trend reversals and reduced the number of drawings that showed a continuous change in performance.
Drawings of the participants of Experiment 2 in the average-of-hundred task (Panel A) and the individual-time-course task (Panel B).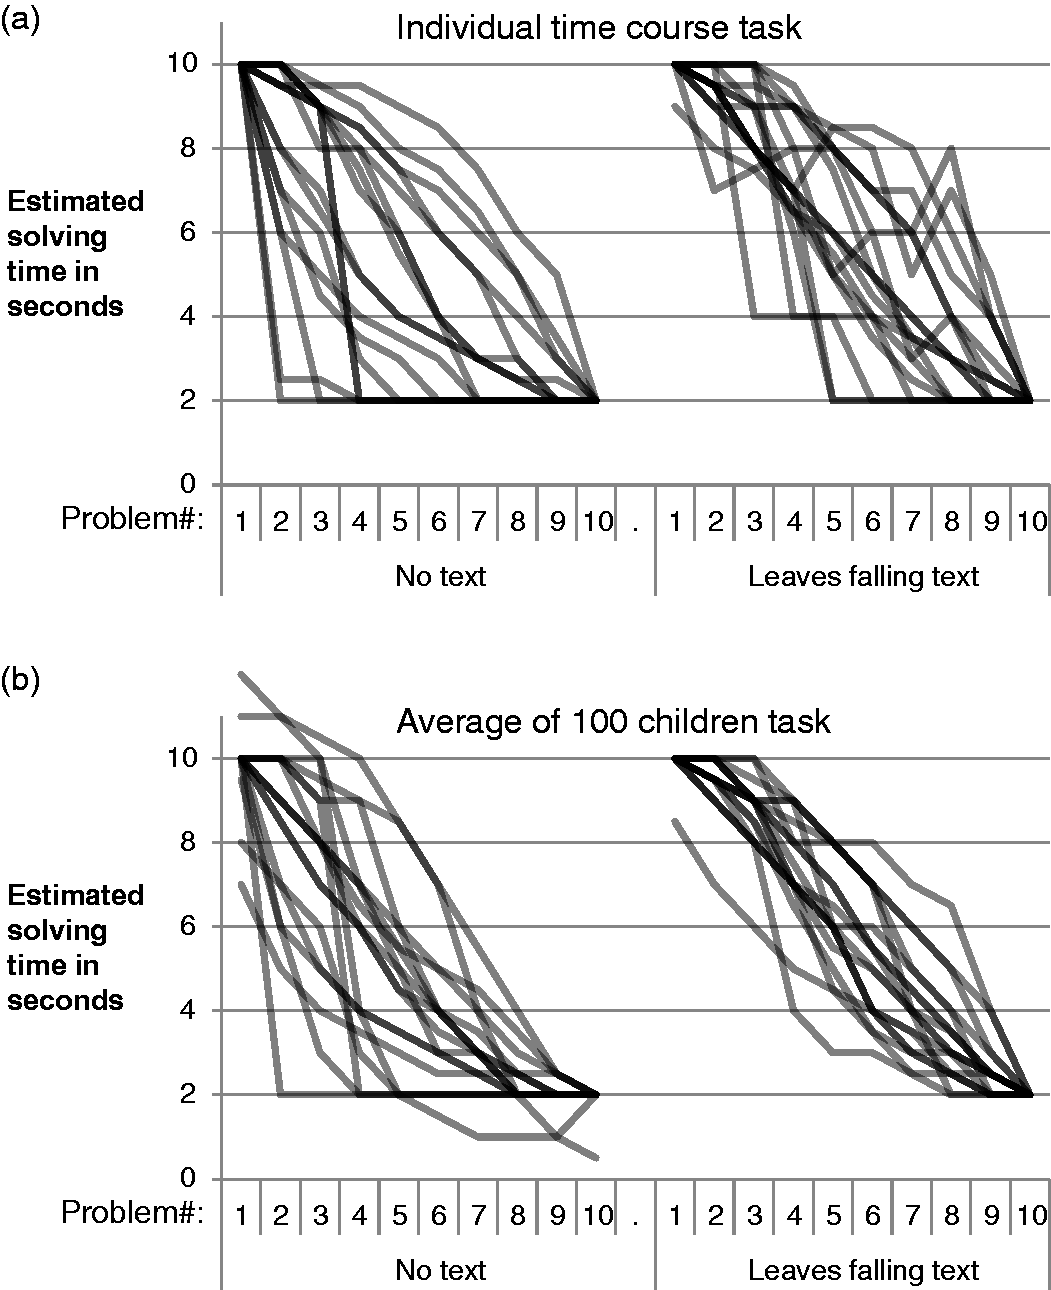
In line with the above description, curve fitting corroborated that the metaphor made the drawings in the individual-time-course task more discontinuous. The group receiving the text on the falling leaves produced drawings that were less similar to a negative exponential function (Mean R2 = 0.86) than the group receiving no such text (Mean R2 = 0.92), t (34) = 2.061, p = 0.047. Regarding the drawings in the average-of-hundred task, the fit with the continuous practice function was high in both groups (Mean R2 = 0.93, vs. R2 = 0.90, without vs. with text on the metaphor) and did not differ systematically, t (34) = 1.247, p = 0.221. In a follow-up, we explored whether we could identify students who erroneously drew a step function in the average-of-hundred task. The distribution of the R2 values for the step function suggested that in the control group without metaphor, some students indeed drew a step function (Figure 6).
Individual fit values per participant of the drawings in the average-of-hundred task in Experiment 2. The x-axis represents the order of participants sorted by fit value.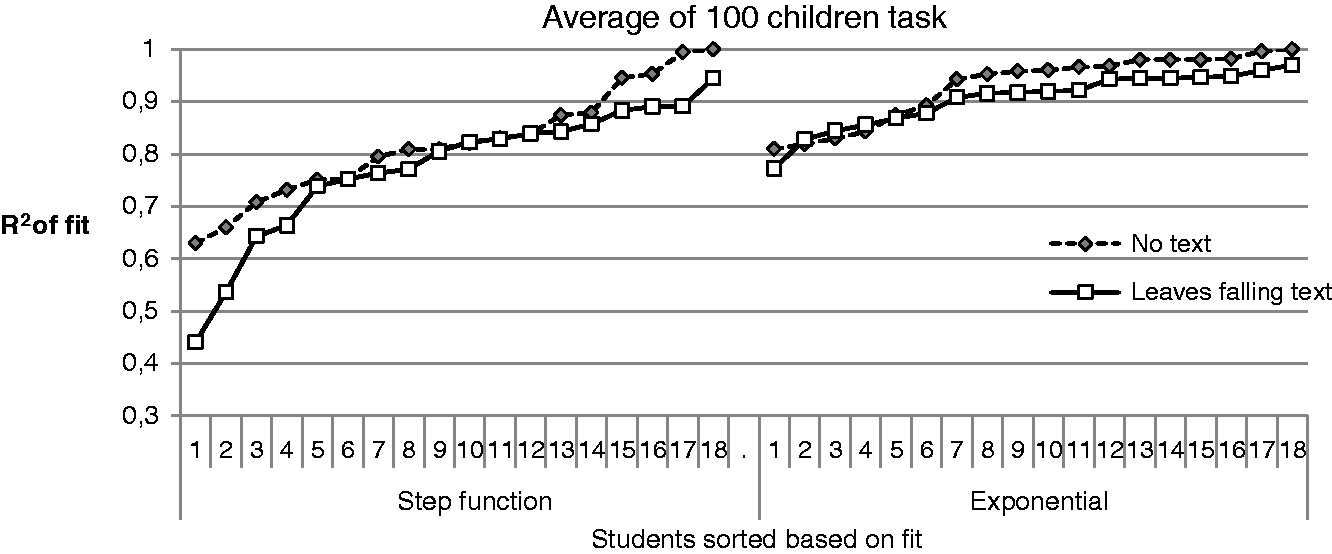
Discussion
Experiment 2 provided tentative evidence that a visual metaphor can help students to draw plausible learning curves. After reading the falling leaves metaphor, students were more likely to draw discontinuous learning curves as examples of an individual time course. The metaphor might not only increase access to a probable individual time course, but also avoid implausible variants of group average time courses.
General Discussion
Given that group average curves are often employed in research and in text books, psychology students need to understand how dynamics in the individual and characteristics of the group average are related to one another. The present study had a particular focus on the difference between individual learning courses over time, which involve strategy changes and abrupt improvements in performance, as contrasted to the steady, continuous improvements shown in average learning curves (cf. Gallistel et al., 2004; Gaschler, et al., 2015; Haider & Frensch, 2002). In Experiment 1 we tested whether asking students to draw a plausible learning curve for an individual would help them to activate or construct adequate knowledge about group average learning curves. Neither did we observe such transfer nor was there a marked difference between learning curves meant to represent individual vs. average time course. Thus, there was no basis for transfer. Likely, students did not realize that individual time courses can be discontinuous. Consequently, in Experiment 2 we explored whether a visual metaphor (falling leaves) could help to highlight the discontinuity in individual time courses and by this improve the student-drawn learning curves. Given this additional cognitive aid, indeed discontinuities were now more pronounced where they should appear (i.e., when drawing a time course for an individual) and less frequent where they should not appear (i.e., when drawing an average time course). Thus, future research should further investigate how a metaphor and combined drawing task can help to convey adequate concepts about individual vs. average time courses to psychology students.
Potentially, in Experiment 1 some students mistook the instruction of drawing an individual learning course to mean a prototypical individual had to be depicted. Doing so, they might have assumed a smooth curve to be more representative than a jagged curve with steep declines (cf. Tversky & Kahneman, 1974). Alternatively, the difference between the average-of-hundred and the individual-time-course first vignette might not have been salient enough. Concerning both possible misunderstandings the falling leaves metaphor in Experiment 2 might have provided a concrete, corrective hint. In the following, we will discuss: (a) the importance of (improved) follow-up student instruction on individual learning curves; and (b) ways to enhance knowledge about learning curves by computer-based tools. Finally, we close with a note on the practical relevance of learning curve knowledge and a brief summary.
Overcoming the Pitfall of Wrong Inferences from Average Data
Comparing step function fit to the fit of the negative exponential function showed that psychology students favored learning curves with continuous rather than abrupt changes in performance. This occurred for learning curves representing a group average, but (erroneously) also for learning curves on the level of the individual. Insight problems are part of introductory psychology courses. Yet, while work on insight (e.g., Haider & Rose, 2007) and skill acquisition (e.g., Haider & Frensch, 2002) has documented that qualitative changes in how a task is processed are often paralleled by abrupt changes in performance, this relation does not seem to be self-evident to the students. The ubiquitous practice of averaging data in research and teaching may be one factor that makes undergraduate students in psychology prone to such incomplete mental models. There is need to acquaint students with the fact that learning curves do not have to be as smooth as the average examples in textbooks, but may imply lags, sudden onsets, and phases of stagnation instead (cf. Gallistel et al., 2014). Just as the metaphor technique in Experiment 2 made participants aware of individual differences in general, an instruction could provide more specific examples of single learning processes with late onsets, lags etc., employing, for instance, case-studies in the context of problem-based learning (Papageorgiou, McCrorie, Georgiades, & Perdikogianni, 2015). In line with psychology’s self-perception as the science of individual behavior and experience it would be advisable to integrate the classical position by Lewin (1930) more prominently into the curriculum of introductory psychology: to focus on laws or mechanisms that explain the dynamics in the individual rather than aggregated dynamics.
Using Online-Tools and Automated Feedback to Support Knowledge Acquisition for Learning Curves
Making students draw an individual learning process alone was not sufficient. To improve students’ thinking about time courses the vignette technique and the drawing task might turn out to be more effective when qualitative feedback is linked to the drawing task such as in an interactive online teaching system. Evidence-based teaching aims at intertwining basic research and didactics more closely so that teaching can make use of current research findings and research can be guided by practical demands (Hargreaves, 1996; Richmond, Boysen, & Gurung, 2016). Problem-based learning, learning from self-generated, yet guided drawing, eventually based on an assessment of pre-existing mental models, learning through testing, and instant feedback are probably the most promising evidence-based research approaches applicable to the issue.
The core elements of problem-based learning techniques are descriptions of concrete, often individual demand situations or dilemmas (Papageorgiou et al., 2015; Wiggins, Chiriac, Abbad, Pauli, & Worrell, 2015), which could be developed from situationally enriched learning curve vignettes with the option to be studied either by learners on their own or in groups. While in the present study the text passages were short, future studies could evaluate and check different textual formats against each other. As emphasized in the introduction, the integrated model of text and picture comprehension states that it is crucial for the text to activate relevant cognitive schemata matching the deep structure of the diagram (Schnotz & Baadte, 2015). Since the results at hand only revealed first trends concerning the effectiveness of the individual-first approach, figuring out specific processes of cognitive mapping is still an open issue. According to Zhao et al. (2014) the visual learning format by itself is hardly sufficient for the initial construction of a mental model, although visualizations such as pictures in instructional texts can help to supplement and enrich existing mental models. Visualizations “cf. van Meter, 2001; van Meter & Garner, 2005” and constructive, generative learning (e.g., Little et al., 2012; Wittrock, 2010) might not suffice to promote differentiated mental models in students. As van Meter and Garner (2005) and Schwamborn et al. (2010) revealed, drawing as a learning aid was more helpful when the task was enriched by concrete instructions (e.g., by guiding attention to relevant aspects, as contrasted with drawing alone). Conveying strategies of how to interpret graphs and how to combine graphical and textual information will remain a challenge not only in school education (McElvany et al., 2012; for diagram literacy see, e.g., Reuter, Schnotz, & Rasch, 2015), but also for the teaching of psychology.
Possibly the students’ knowledge about learning curves might be assessed beforehand to assign each learner to the most suitable treatment among different tutorial conditions. Jaeger et al. (2016) pointed out that in the context of learning from analogies students with low abilities particularly benefitted from guided learning, whereas students with higher abilities did not improve; rather they became distracted by the seemingly irrelevant extra information of an analogy. Learning support methods should hence take into account already existing mental models and learners’ cognitive abilities. The higher the ability, the more self-employed model formation can take place, once again recurring to the approach of generative learning (Wittrock, 2010).
In the current study, students drew into an empty coordinate system. The task can be regarded as a variant of multiple-choice testing (Dutke & Barenberg, 2015) and might be used for learning through testing (Rohrer & Pashler, 2010) interventions. In addition, future studies might test the role of feedback. Goal setting theory (Locke & Latham, 2002) emphasizes that feedback is vital to keep learners informed about their progress, to correct false answers or assumptions, and thus to maintain a sufficient level of motivation (see also Hattie & Timperley, 2007; Kulik & Kulik, 1988). In an online version of the vignette approach, automatic verbal feedback would be easy to implement, either summative as a final feedback or formative by questioning implausible curve shapes during the very moment of drawing (cf. Nakata, 2015). From a practical point of view, web simulations in education (see Mills, 2002, for examples in teaching statistics) have turned out to be both economic and generally well understood by students. While online courses (Stiegler-Balfour, 2015) and learning questionnaires (e.g., Bebermeier, Nussbeck, & Ontrup, 2015) are already common in statistic and psychology teaching, future applications of a learning curve tool might involve mobile apps (Diliberto-Macaluso & Hughes, 2016), student response systems in the classroom (Watling, Clarke, & Rowell, 2014), or collaborative online-tasks, for example, on tablets (Spitzer & Ebner, 2015). An interactive collaborative app could visualize how the single, possibly jagged curves drawn or sampled by different people blend together in a smooth averaged learning curve.
Why and How to Improve Students’ Knowledge About (Individual) Learning Curves
Learning curves are an academic matter and an integral part of introductory courses in psychology. Yet from an everyday point of view students’ misconceptions about learning curves can have negative practical implications as well: they can undermine goal-based motivation (cf. Carver & Scheier, 1998). For instance, if a learner expects linear improvement, frustration can result from the observation that absolute gains per study time decrease from session to session. Also, a student with the nonlinear continuous average learning curve in mind (strong improvements early on, smaller improvements later in practice) might infer from stagnating performance early in practice that little has to be expected from putting further effort in her/his study activity.
Our suggestions for future perspectives on students’ knowledge about learning curves are twofold: first, we strongly recommend further studies to investigate the interplay between the internal construction of mental models and external aids. The current learning curve task should be extended so that students get instantaneous feedback and more specific guidelines when thinking and hence drawing their diagrams of performance over time; and second, the development of practical learning tools should be on the agenda. Interactive online computer simulations with automated feedback seem to be a particularly promising approach. However, “learning through testing” (Rohrer & Pashler, 2010) is not only a useful strategy for teaching students in psychology, but also for researchers aiming to plan new learning materials. As Mills (2002) highlights, a solid and thorough empirical foundation for web-based tools is mandatory. This is not to say that watching leaves fall cannot sometimes be elucidating as well.
Footnotes
Acknowledgements
The authors thank the participating students. Special thanks are addressed to Claudia Krause and Christina Weckwerth for their careful assistance in entering and preparing the collected data. Alison Benbow we thank for proofreading and stylistic guidance. Furthermore, the authors would like to thank the editor and the two anonymous reviewers for their constructive comments.
Declaration of Conflicting Interests
The author(s) declared no potential conflicts of interest with respect to the research, authorship, and/or publication of this article.
Funding
The author(s) disclosed receipt of the following financial support for the research, authorship, and/or publication of this article: This work was supported by FernUniversität in Hagen and Research Cluster Image Knowledge Gestaltung at Humboldt-Universität, Berlin, Germany (EXC1027/1).