
Abstract
Several liner-type treatments (three different rectangular grooves covered by three different low porosity wire-mesh screens) on the trailing edge of a flat plate have been investigated in the anechoic wind-tunnel of Université de Sherbrooke. Far-field acoustic directivity measurements have been achieved at Reynolds numbers based on the plate length from
Keywords
Introduction
Airfoil trailing-edge noise or self-noise is a problem involved in many engineering applications such as wind turbines, cooling systems and drones. The sound is generated by the scattering of turbulent boundary-layer disturbances at the trailing edge and such a phenomenon could yield tonal or broadband noise signature depending on the operating conditions such as Reynolds number and angle of attack. This noise mechanism has been widely investigated because of the wide usage of the aforementioned devices in our everyday life. Regulation to limit noise pollution encourages companies and scientists to look for effective noise reduction methods. Several solutions for the trailing-edge noise attenuation (serrations,1,2 various surface treatments, 3 porous media 4 ) have been proposed.
For instance, serrations inspired by the structure of the Owls wing were theoretically investigated by Howe 5 and the proposed model showed a potential significant trailing-edge noise reduction. Numerous experimental,1,2,6 analytical7,8 and numerical 9 studies have been conducted over the years, yielding new shapes with some significant noise reduction mostly at high frequencies. Even true shape optimization of such passive devices on an industrial airfoil have been recently achieved. 10
As an alternative to serrations, porous treatments on the trailing edge have been drawing a lot of attention for the past decade. Such a treatment based on foam-like, open-cells materials and applied to airfoils was investigated by Geyer and Sarradj.11,12 The higher noise attenuation by the materials with high air flow resistivity was demonstrated. Hot-wire measurements also showed the decrease of lift with the decrease of air flow resistivity and the increase of the porous extent. Moreover, some porous materials were found to even increase noise compared with the reference configuration. That effect was attributed to the surface roughness, porosity and possible vibrations of the trailing edge. The importance of the open cell metal foam permeability on the noise reduction was investigated from both acoustical and aerodynamic points of view by Rubio Carpio et al. 13 The most permeable treatments introduced in the last 20% of the airfoil chord showed up to 10 dB noise attenuation compared with the reference solid configuration at Strouhal numbers based on the chord and the free-stream velocity below 16. At high frequencies the porous treatments increase the trailing-edge noise due to the roughness effect. The reduction of the acoustic impedance jump by the cross-flow through the permeable treatments was also demonstrated along with its effect on the broadband noise attenuation. This conclusion is in line with the previous study of Herr et al. 14 where the blocking of one of the porous treatment side lead to elimination of the noise reduction effect. Rubio Carpio et al. 13 also reported an increase of the velocity deficit and surface drag for the four metallic foam porous treatments. However, the detailed explanation of the noise reduction mechanism by the porous materials was not provided, because of the difficulty of instrumentation of the porous section without changes of the material characteristics and flow in the pores. The numerical replication of the experimental study of Rubio Carpio et al. 13 was performed with the lattice-Boltzmann method by Teruna et al. 15 They confirmed the noise reduction up to 9 dB compared with the solid configuration at low frequencies. They also found the distribution of the noise sources along the porous area, which meant acoustic scattering at multiple locations. The surface pressure fluctuations were also reported not to be significantly affected by the porous medium. However, the porous medium was modelled as a homogenous porous section taking into account the material porosity with Darcy’s law due to the computational cost, and the internal topology of the porous treatment was not considered. Showkat Ali et al. 4 presented an investigation for the simplified configuration of a flat plate with the blunt trailing-edge metallic-foam treatments to avoid complex physics of the flow as in the present experiment. The acoustic and aerodynamic measurements evidenced the reduction of flow acceleration over the trailing edge, split-up of the large coherent structures in the wake as well as fading of the vortex shedding. Note that all the above examples involve non-locally reacting surface treatments.
Perforated trailing edges were also studied as one of the porous treatments types by Rubio Carpio et al. 16 The trailing-edge appendices were 3 D-printed with straight cylindrical channels connecting the two sides of the NACA-0018 airfoil. Several distances between channels were tested to control the permeability of the treatment. The abatement of the broadband noise was observed and compared with the metallic foams treatment. Rubio Carpio et al. 16 then concluded that, to achieve similar attenuation level, the permeability of the perforated trailing edge should be at least three times higher than that of the foam-type treatment. Therefore, they assumed that the inner structure of the porous treatments influences the noise reduction besides the permeability.
Overall, all the studies about trailing-edge porous treatments have been carried out for different geometries with various percentages of the treated area and diverse instrumentation. Subsequently, there are still some doubts about the optimal length of the treated area to provide the most effective noise reduction with a minimal influence on the loading and the actual mechanisms behind the noise reduction achieved by the porous treatments. Another obstacle is the manufacturing of the porous materials and the geometrical repeatability of the tested samples. For better understanding of the noise attenuation mechanisms, the resistivity and permeability of the materials need to be fully controlled for instance. Moreover, despite the promising results of the noise attenuation by some of the above porous materials, remaining disadvantages like loading losses, the complexity of the implementation and production of the treatments motivate further research on different new solutions.
Another passive treatment for noise mitigation widely employed for aircraft engine nacelles are acoustic liners. It has been applied for slat noise reduction.17–19 In the experimental work of Smith et al. 18 the honeycomb liners were mounted on the both slat cove and main wing leading edge. The noise attenuation up to 2.5 dB was demonstrated. A significant drop of performance was however reported as well. Smith et al. attributed it mostly to the manufacturing problems rather than to the difficulty with applying the liners. Following work published by Casalino et al. 19 was aimed at optimizing the single slotted flap and a maximum noise reduction of 6.4 dB was achieved. It was shown that the liners were effective up to frequency about 1 kHz. However, to the authors’ knowledge the number of studies on airfoil noise reduction by acoustic liners is still limited.
Recently, an industrial Controlled-Diffusion (CD) airfoil, which has been used for compressor and turbofan applications, aerospace and automotive ventilation systems, was investigated for Reynolds numbers from
However, the detailed investigation of the influence of the geometrical parameters such as depth of cavities and porosity of the screen could not be achieved because of the small scale of the airfoil trailing edge. Therefore, it was decided to study the aforementioned geometrical parameters on the simplified case of a flat plate at a bigger scale. This configuration also removes the additional effect of the mean adverse pressure gradient on the noise generation and mitigation.
The outline of the article is as follows. Firstly, the experimental setup including the mock-ups and measurement systems is described. Secondly, the acoustic results for the reference configuration are presented and the noise sources on the flat plate are identified. Thirdly, an influence of the cavity depth on the far-field noise signature is presented, which constitutes one of the contributions of the present work. An analysis of the effect of different wire-meshes then follows. Finally, the conclusion summarizes the findings on the influence of the geometrical parameters of the liner-type treatments on the trailing-edge noise generation.
Experimental setup
The acoustic measurements have been performed for a flat plate with liner-type trailing-edge treatments in the open-jet anechoic wind tunnel of the Université de Sherbrooke. The flow velocities in this facility range from 5 m/s to 40 m/s in a nozzle section of 30 cm height and 50 cm width. The exit flow is uniform with a low residual turbulence intensity below 0.4%.
21
The flow velocity is controlled by two radial fans, and the temperature of the flow is maintained at
Flat plate mock-ups
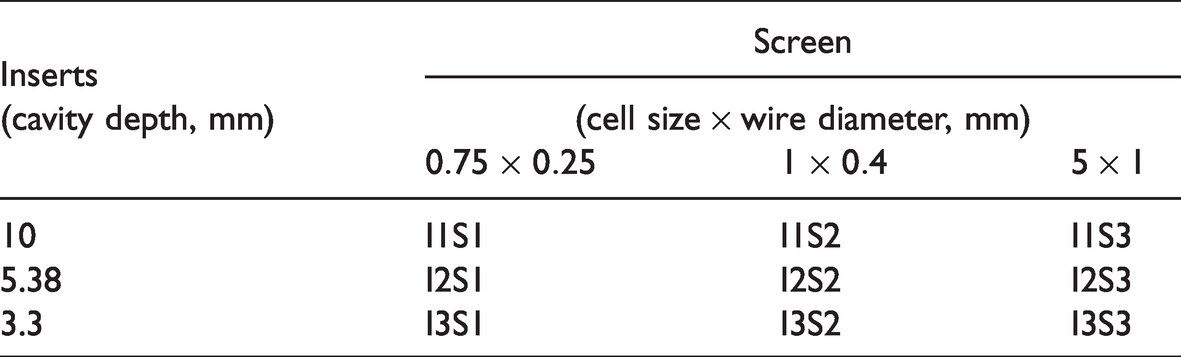
A sketch of the flat plate mock-up is shown in Figure 1. The flat plate has a 71 cm width, a 73.8 cm length and a thickness e of 2.96 cm. It is mounted at the exit of the nozzle so that the interior wall of the nozzle coincides with the surface of the flat plate. The gap at the junction is covered by a thin aluminum tape to minimize the disturbances of the boundary layer and to make the transition as smooth as possible. The last 20 cm of the trailing edge of the plate are replaceable inserts with several liner-type treatments. Each insert consists of 10 rows of cavities and ends with a square trailing edge. Three inserts with a cavity width (L) of 10 mm and depth (D) of 10 mm (I1), 5.38 mm (I2) and 3.3 mm (I3) are used. Only the shallower cavity was used before on the CD airfoil. Cavities can be covered by some wire-mesh screen, which is fixed on top of the insert by a metallic frame and some screws. Based on the CD airfoil experience,
20
three screens with different porosity but low specific airflow resistance or resistivity (
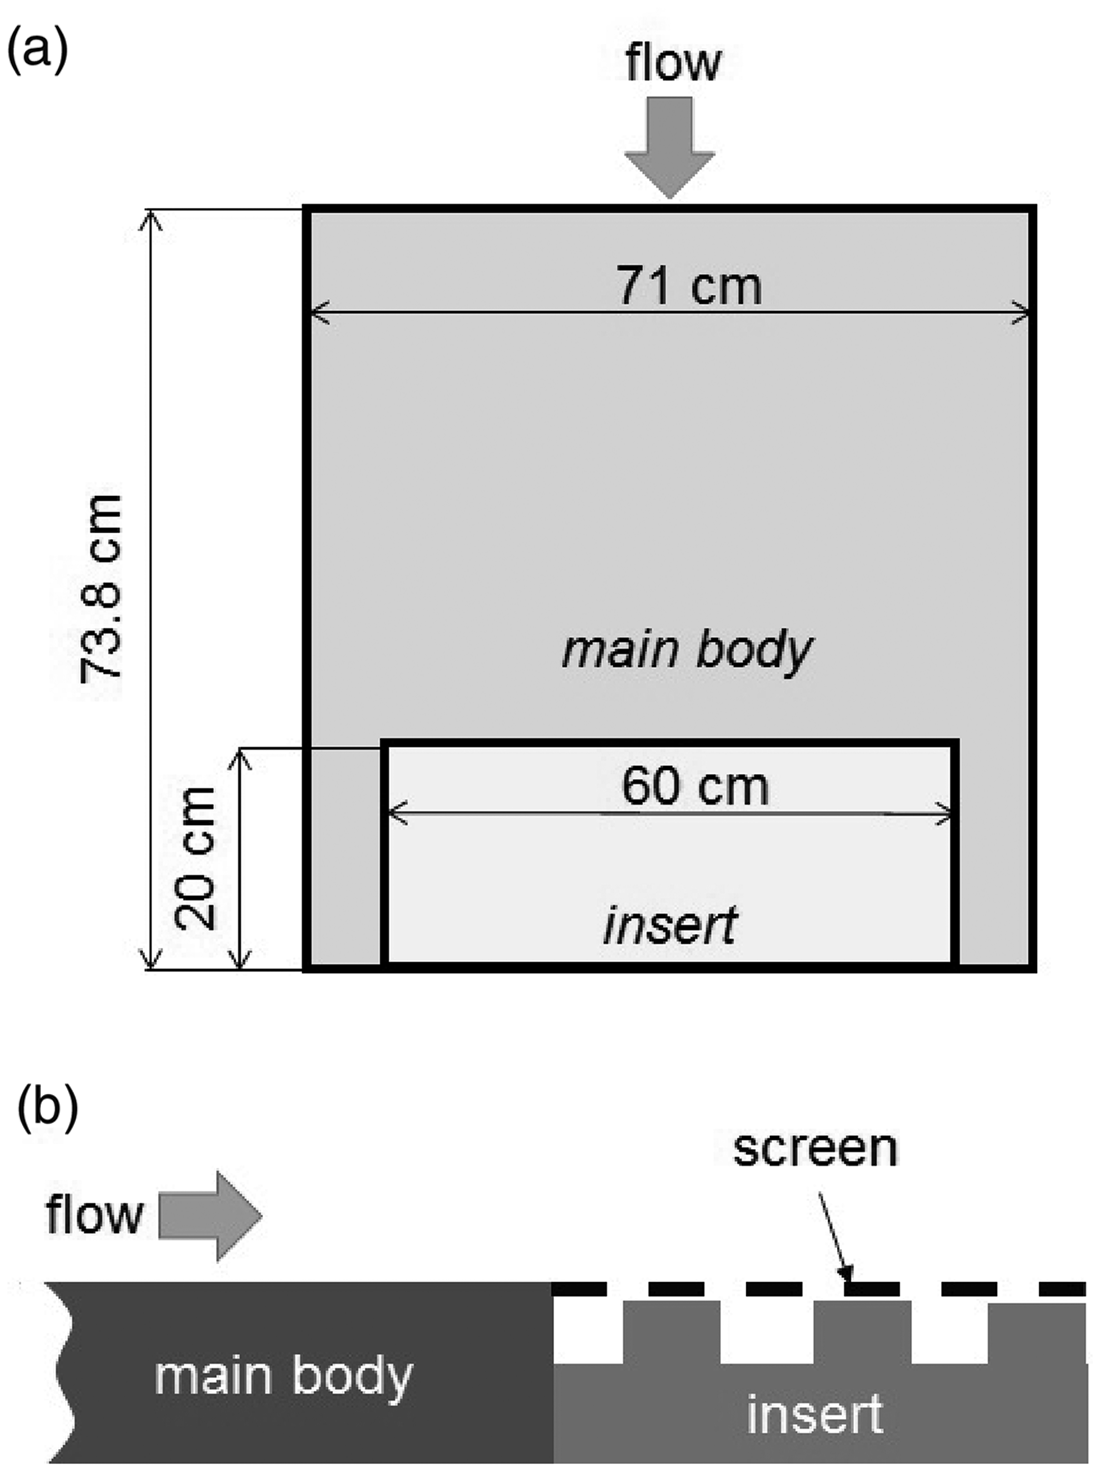
Sketch of the flat-plate mock-up.(a) top view; (b) side view.
Liner-type treatment configurations.
Acoustic measurements
The directivity measurements have been carried out by an arc instrumented by 12 PCB 378B02 piezotronics 1/2″ microphones that are located at the distance of 1 m from the trailing edge of the flat plate (see Figure 2). The center of the arc coincides with the trailing edge at the half-width of the plate. The microphones are distributed from
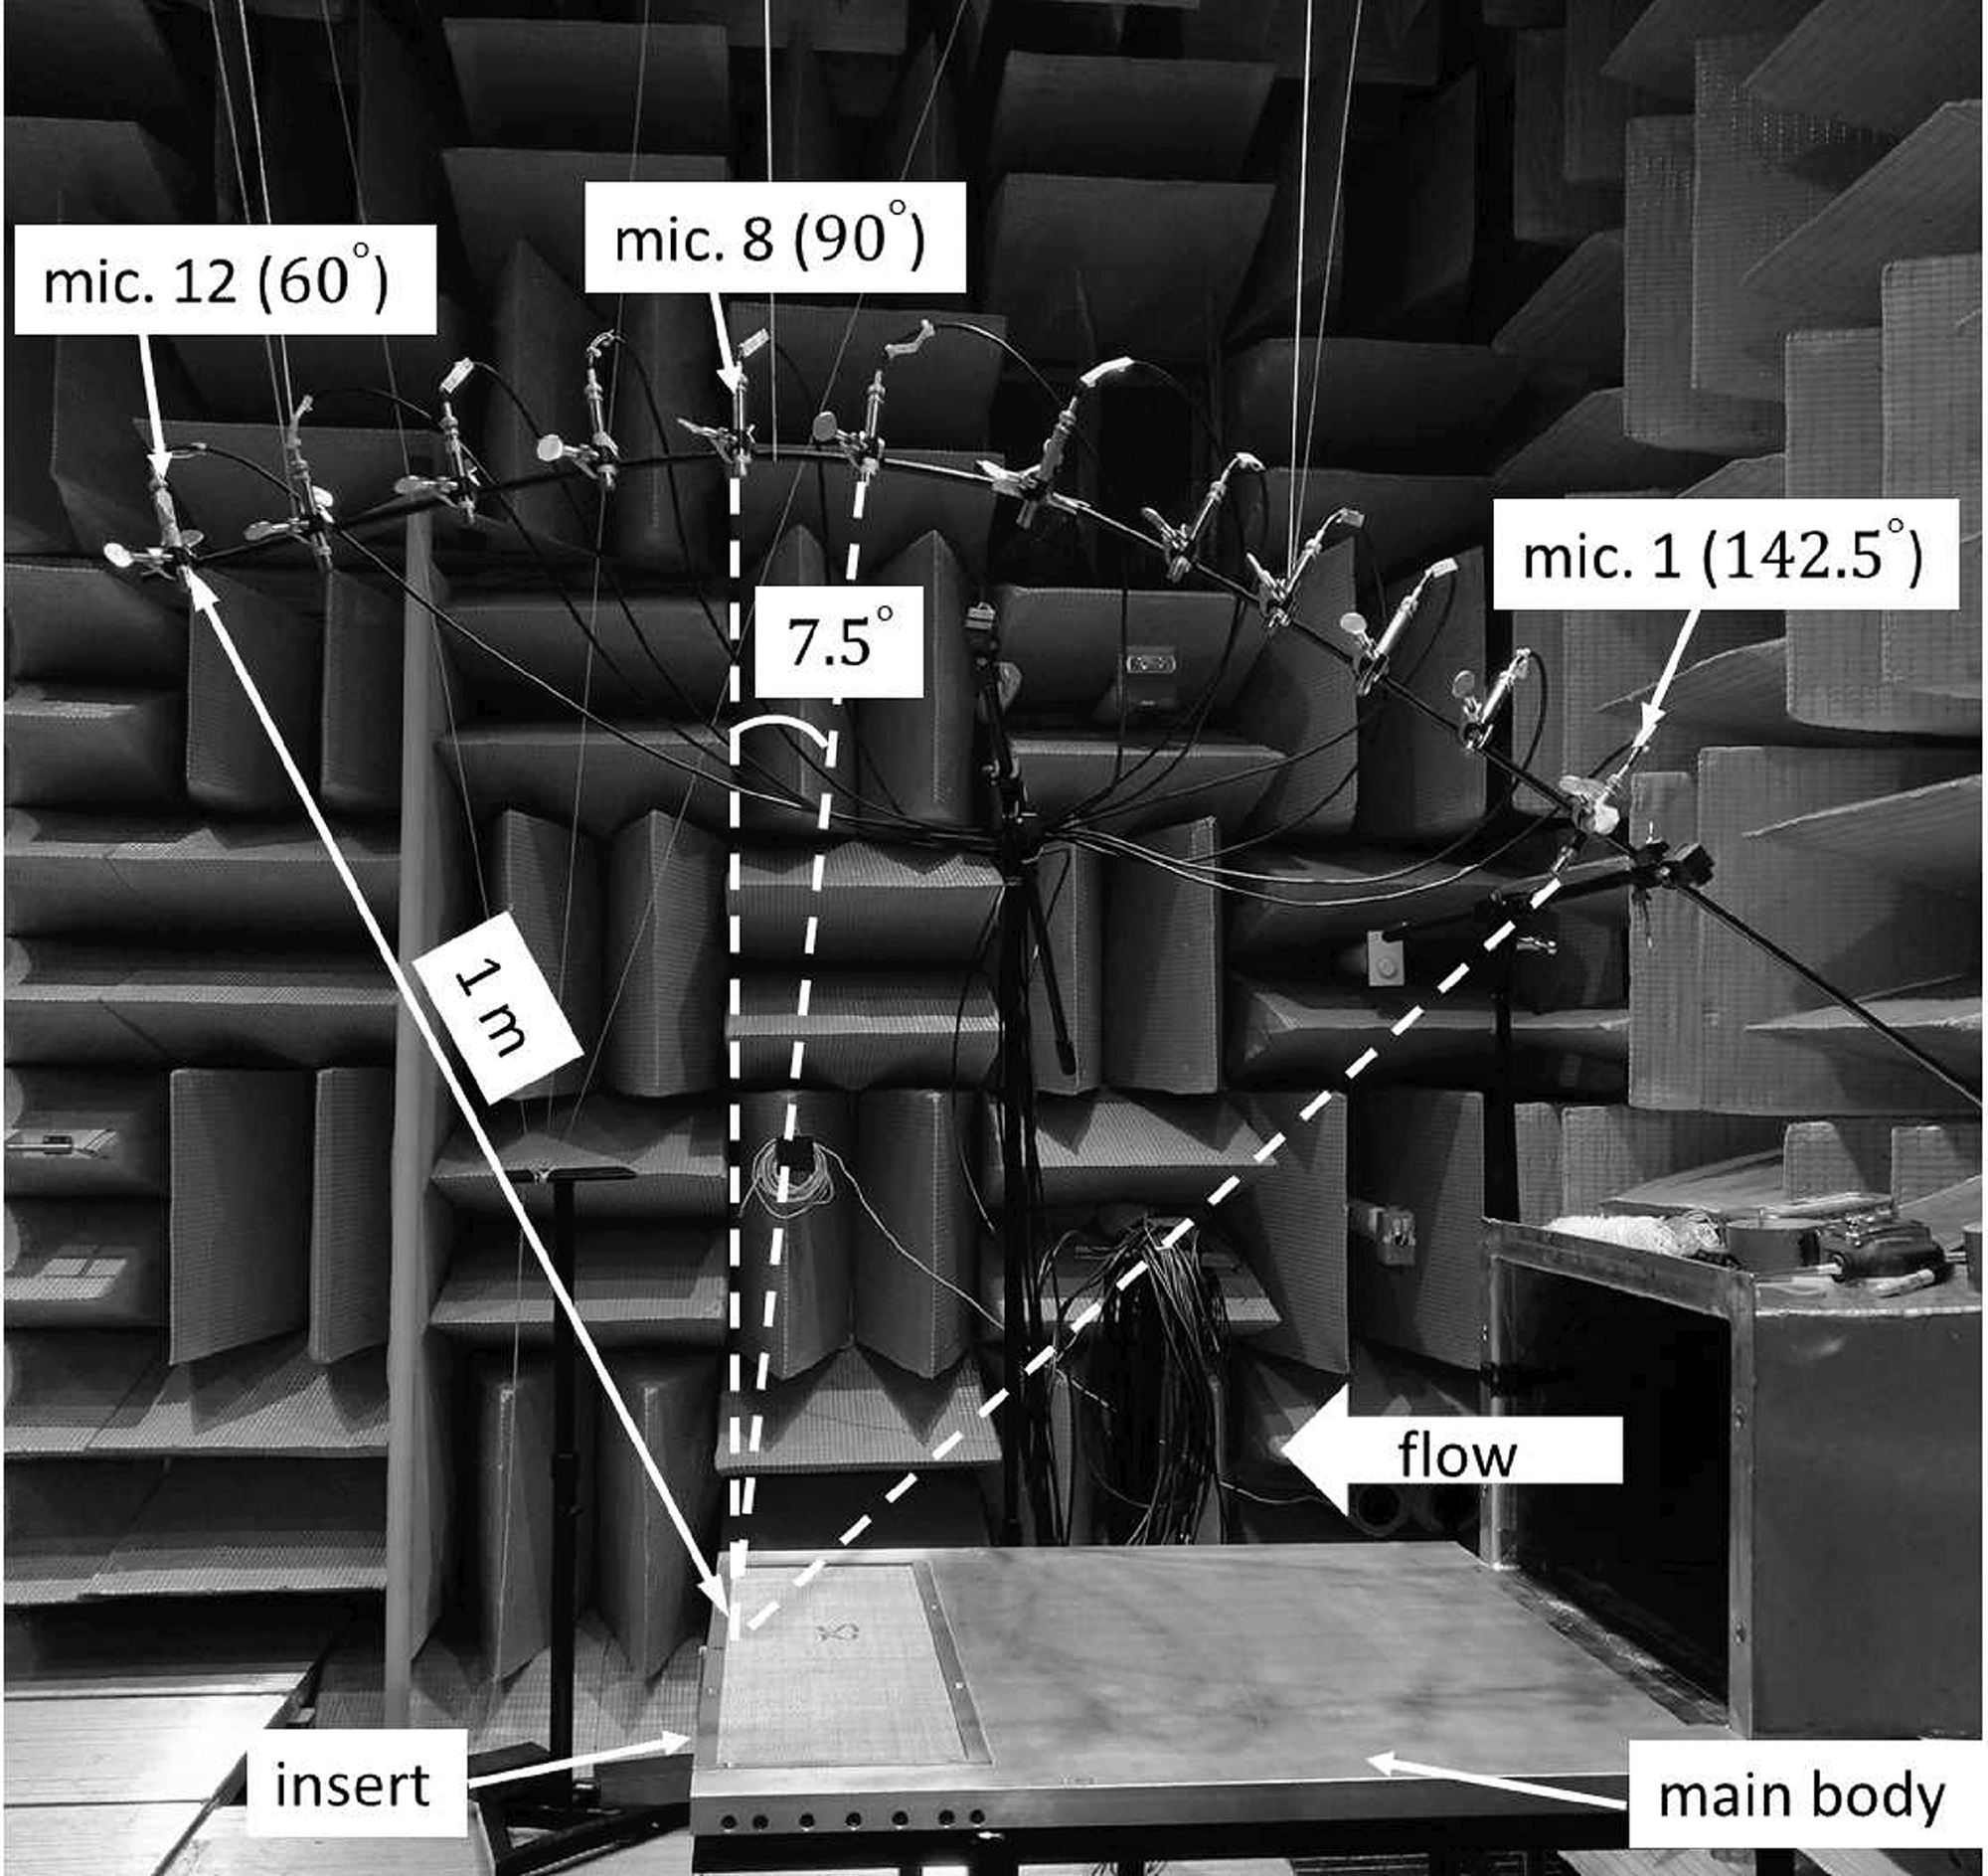
Scheme of the experimental setup for directivity measurements.
Aerodynamic measurements
In parallel to the above acoustic measurements, several flow investigations have been performed. Flow measurements have been achieved either by hot-wire anemometry (HWA) or by planar (2D-2C) Particle Image Velocimetry (PIV) to yield additional information about the flow upstream or above the plate treatment. The details of the HWA and the PIV setups are given by Yakhina et al. 23
First, a flow visualisation with a mixture of talc powder and isopropyl alcohol has been conducted to verify the two dimensional nature of the flow as shown in Figure 3. All the streamlines remain parallel and the flow is aligned with the incoming direction perpendicular to the plate trailing edge. Therefore, focusing the microphones in the mid-span plane of the plate is justified.
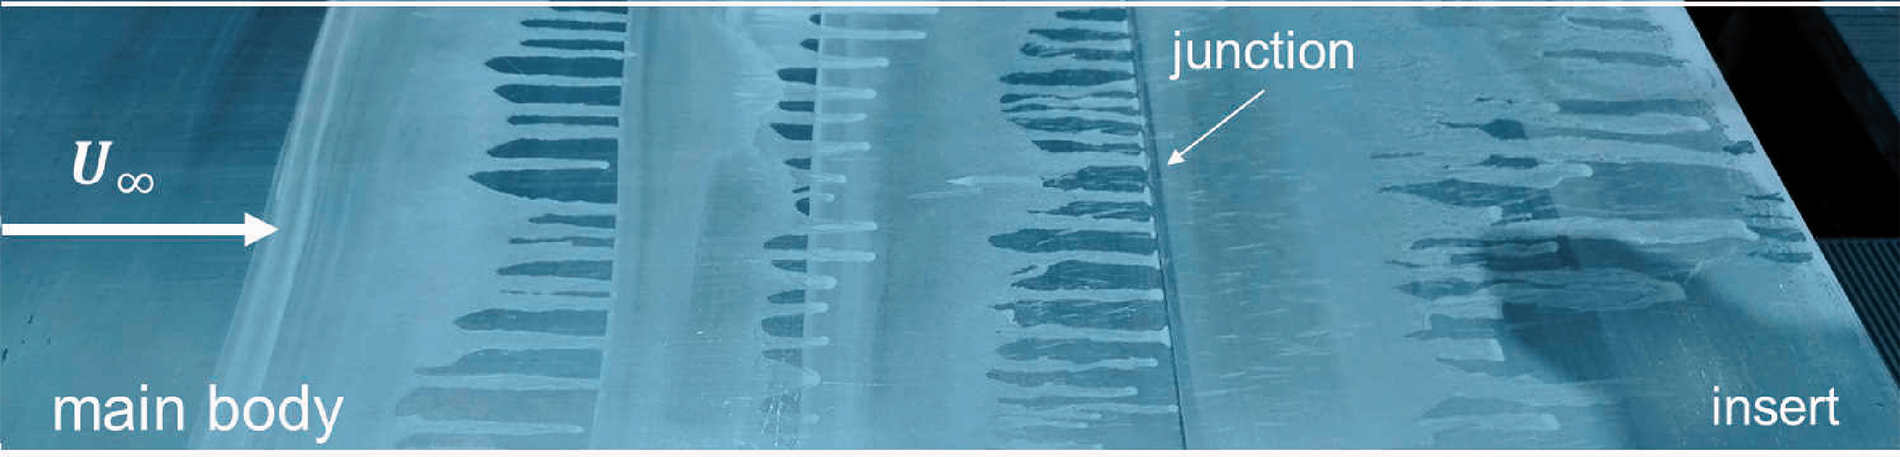
Flow visualization with talc-alcohol mixture for the reference configuration at 20 m/s.
Figure 4 shows the mean velocity profiles U and root-mean-square (rms) of the axial velocity fluctuations urms at the distance of 1 cm upstream from the junction for the lowest tested Reynolds number. The mean U profiles measured by HWA and by PIV are compared with the theoretical profiles for laminar and turbulent boundary layers.
24
Both measured U profiles are close to each other and their shape is similar to the profile of the turbulent boundary layer obtained by
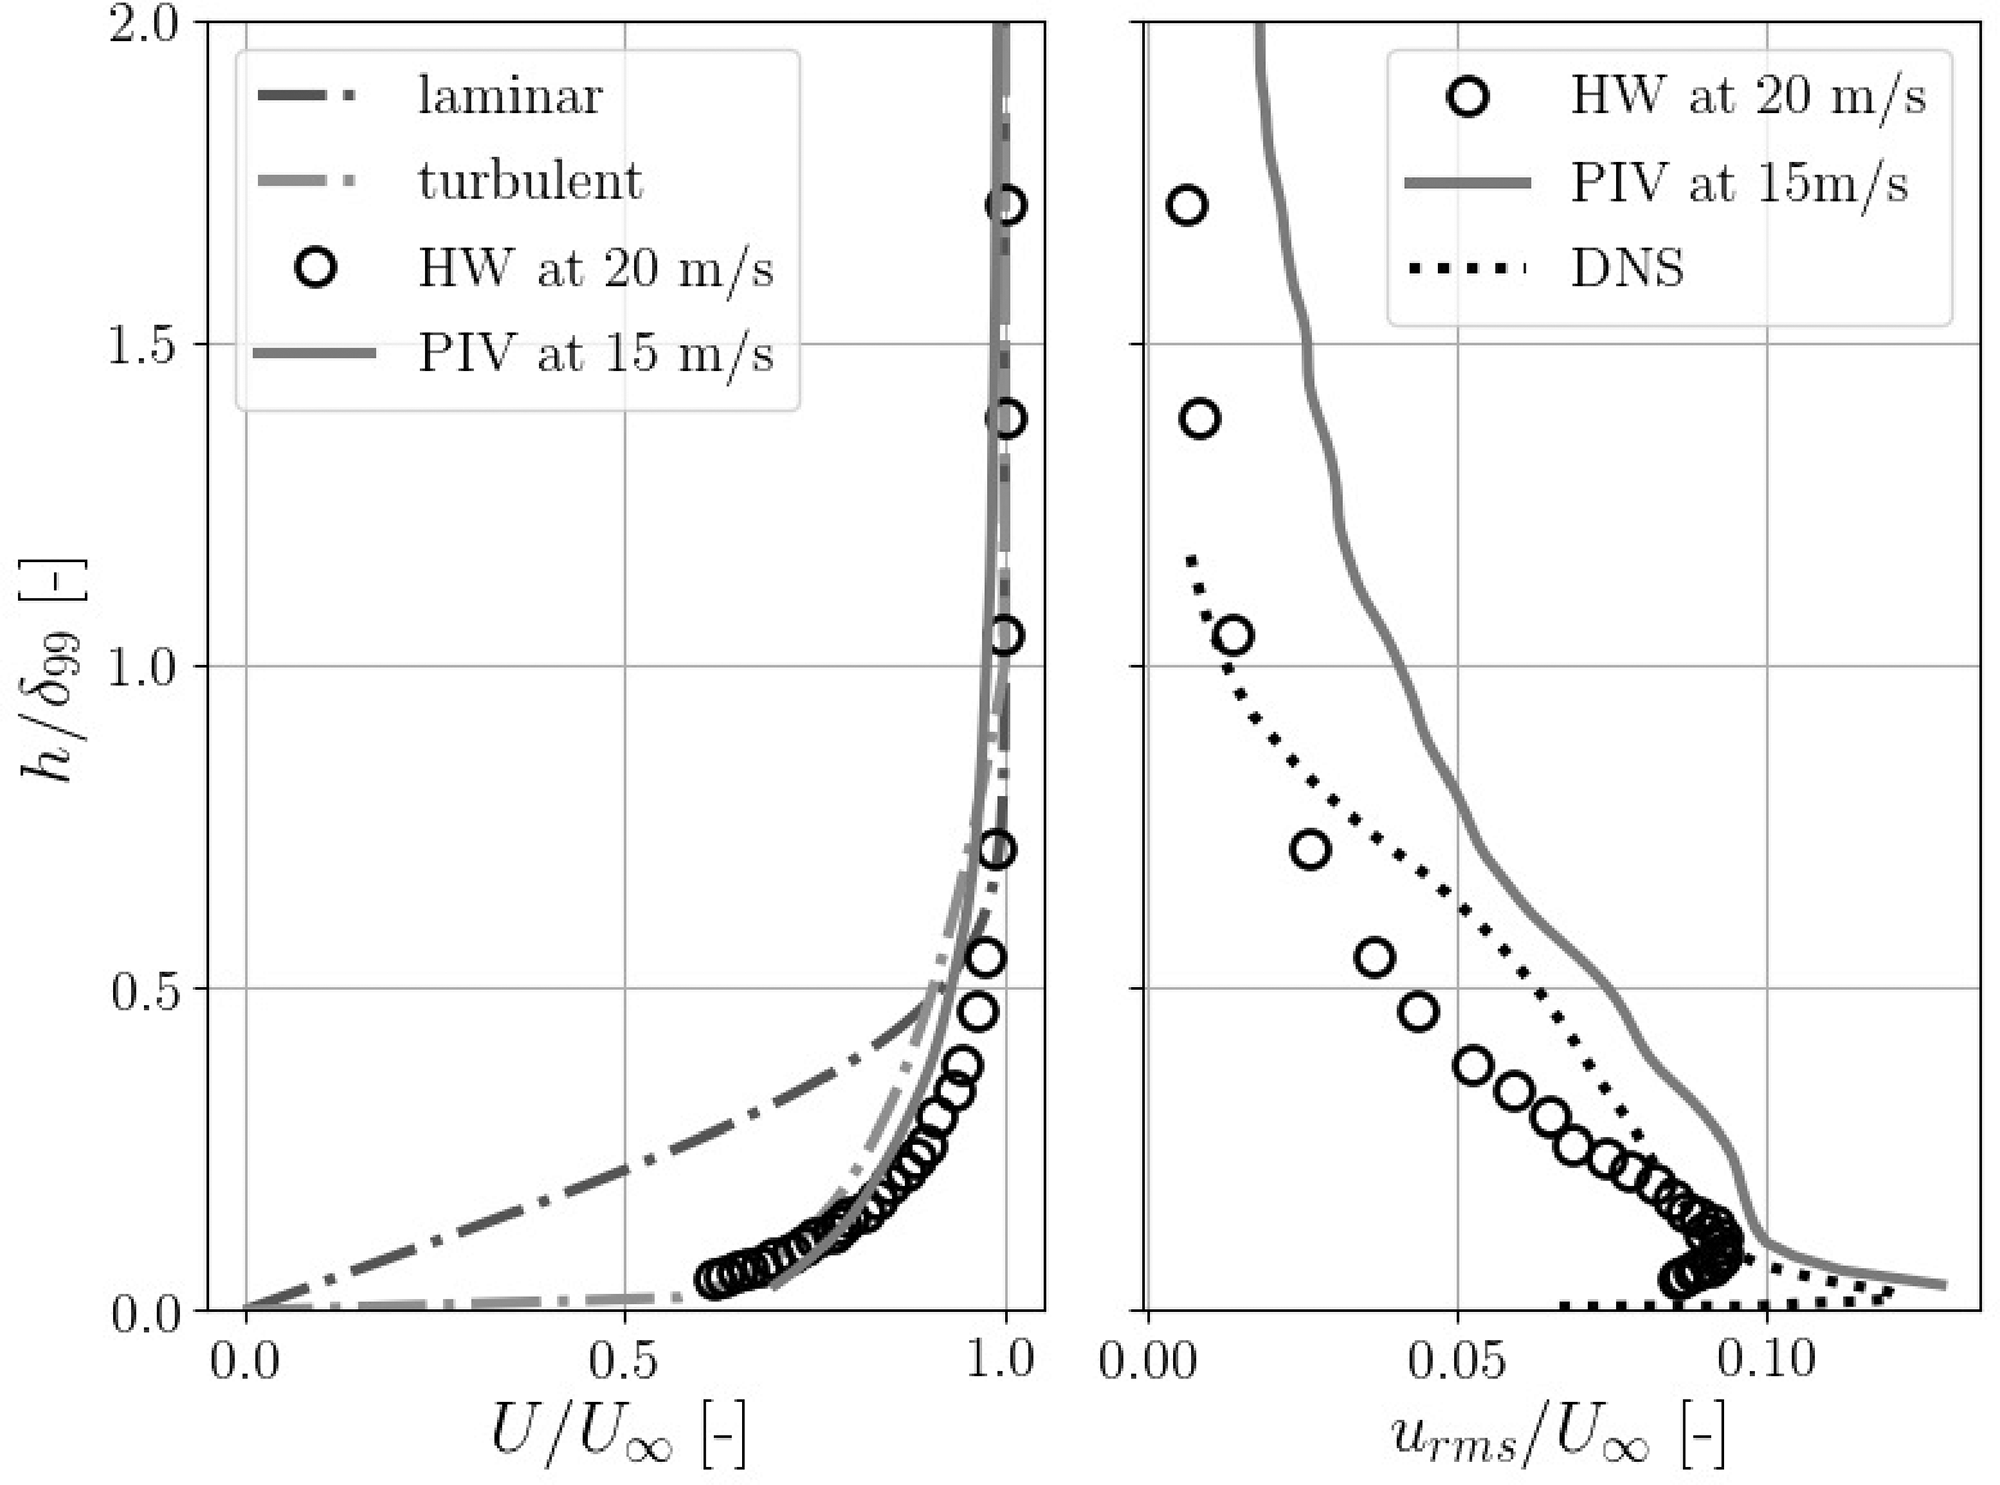
U and urms for the reference plate: laminar - Blasius profile; 24 turbulent – 1/7th law; 24 HWA - results of hot-wire anemometry at 20 m/s; PIV - results of PIV at 15 m/s; DNS - Direct Numerical Simulation of Spalart 25 at a distance of 1 cm upstream of the junction between the main body and the insert in the mid-span.
Finally, some measurements have been achieved above and near the trailing edge of the plate. The contours of mean axial velocity (U), root-mean-square axial velocity (urms) and root-mean-square wall-normal velocity (vrms) obtained by planar PIV measurements are shown in Figure 5. The recirculating zone after the blunt trailing edge is clearly observed, with some significant fluctuations near the edge, suggesting an unsteady breathing bubble.
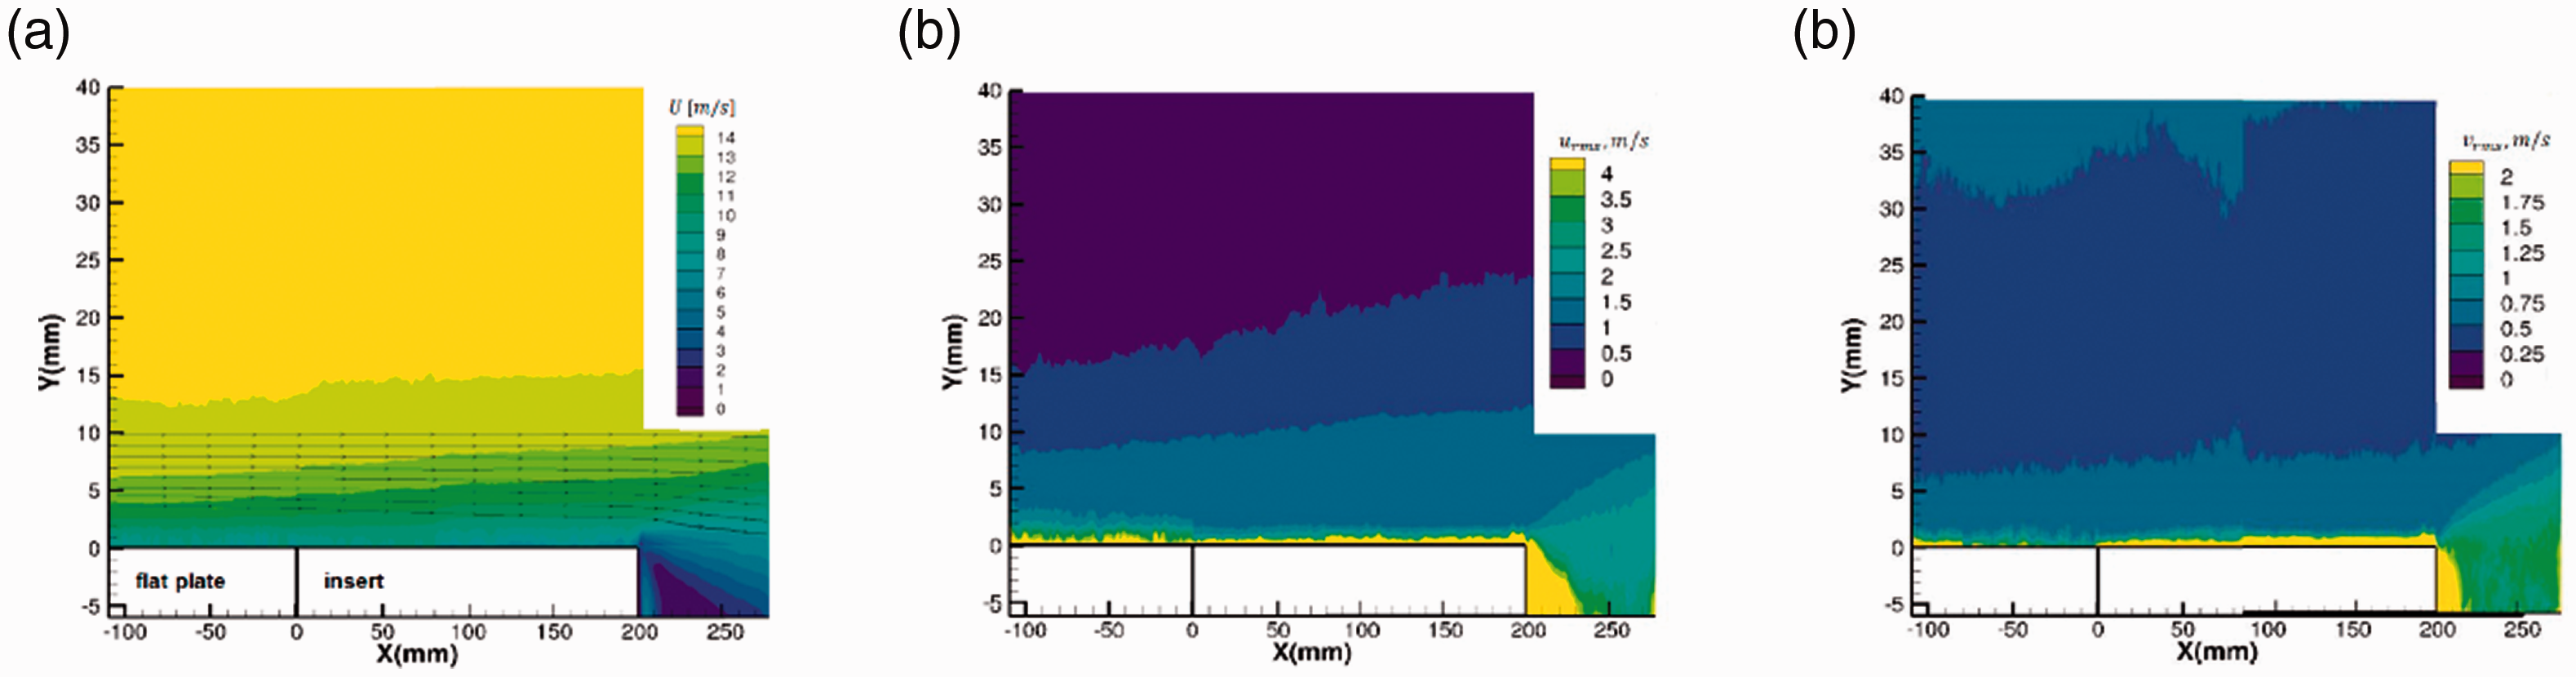
PIV results for the reference flat plate at 15 m/s. (a) Mean axial velocity (U), root-mean-square axial velocity (urms) and root-mean-square wall-normal velocity (vrms) contours.
Acoustic results
In the following sections the acoustic results for the reference case, configurations with inserts only and with combination of inserts and screens are presented and analyzed. All spectra are presented for the microphone 8 which is perpendicular and above the trailing edge of the plate. The frequency resolution of the spectrum is 2 Hz.
Test–retest reliability has been achieved by comparing sets of experiments where the flat plate has been dismantled from the wind tunnel (exp.3) and also between different days within the same set of experiments (exp.1 and exp.2), in order to provide some further uncertainty quantification on the presented measurements. Figure 6 presents the comparison between the two sets of experiments carried out with a delay of a few months. Good overall repeatability of the acoustic measurements for all configurations is found between day-to-day experiments and different sets of experiments. In general the SPL of the first experiment (exp.1) at frequencies below 300 Hz is slightly lower for all configurations and speeds (about 1 dB). It is most likely caused by the flow velocity uncertainty. For the reference configuration (Figure 6(a)), exp.3 at 15 m/s reaches the background noise of the anechoic wind tunnel at about −20 dB.20,21 The limited sensitivity of the microphone used in exp.1 and 2. explains the plateau observed at -10 dB. Moreover, even in exp.3 at 15 m/s, several tones can be observed at frequencies beyond 1 kHz which are caused by the electromagnetic contamination of the setup. Therefore, no further data are given below −10 dB. The largest variations in the measurements (about 2 dB) have been obtained for the deepest cavities (Figure 6(b) and (c)) almost at all frequencies. Noticeably, when the cavities are covered by screens at frequencies beyond 2 kHz some discrepancy in the peaks between experiments are observed. This could most likely be traced to the positioning and fixation of the screens on the mock-up. Therefore, an overall maximum uncertainty of 2 dB can be attributed to the present experimental set-up.
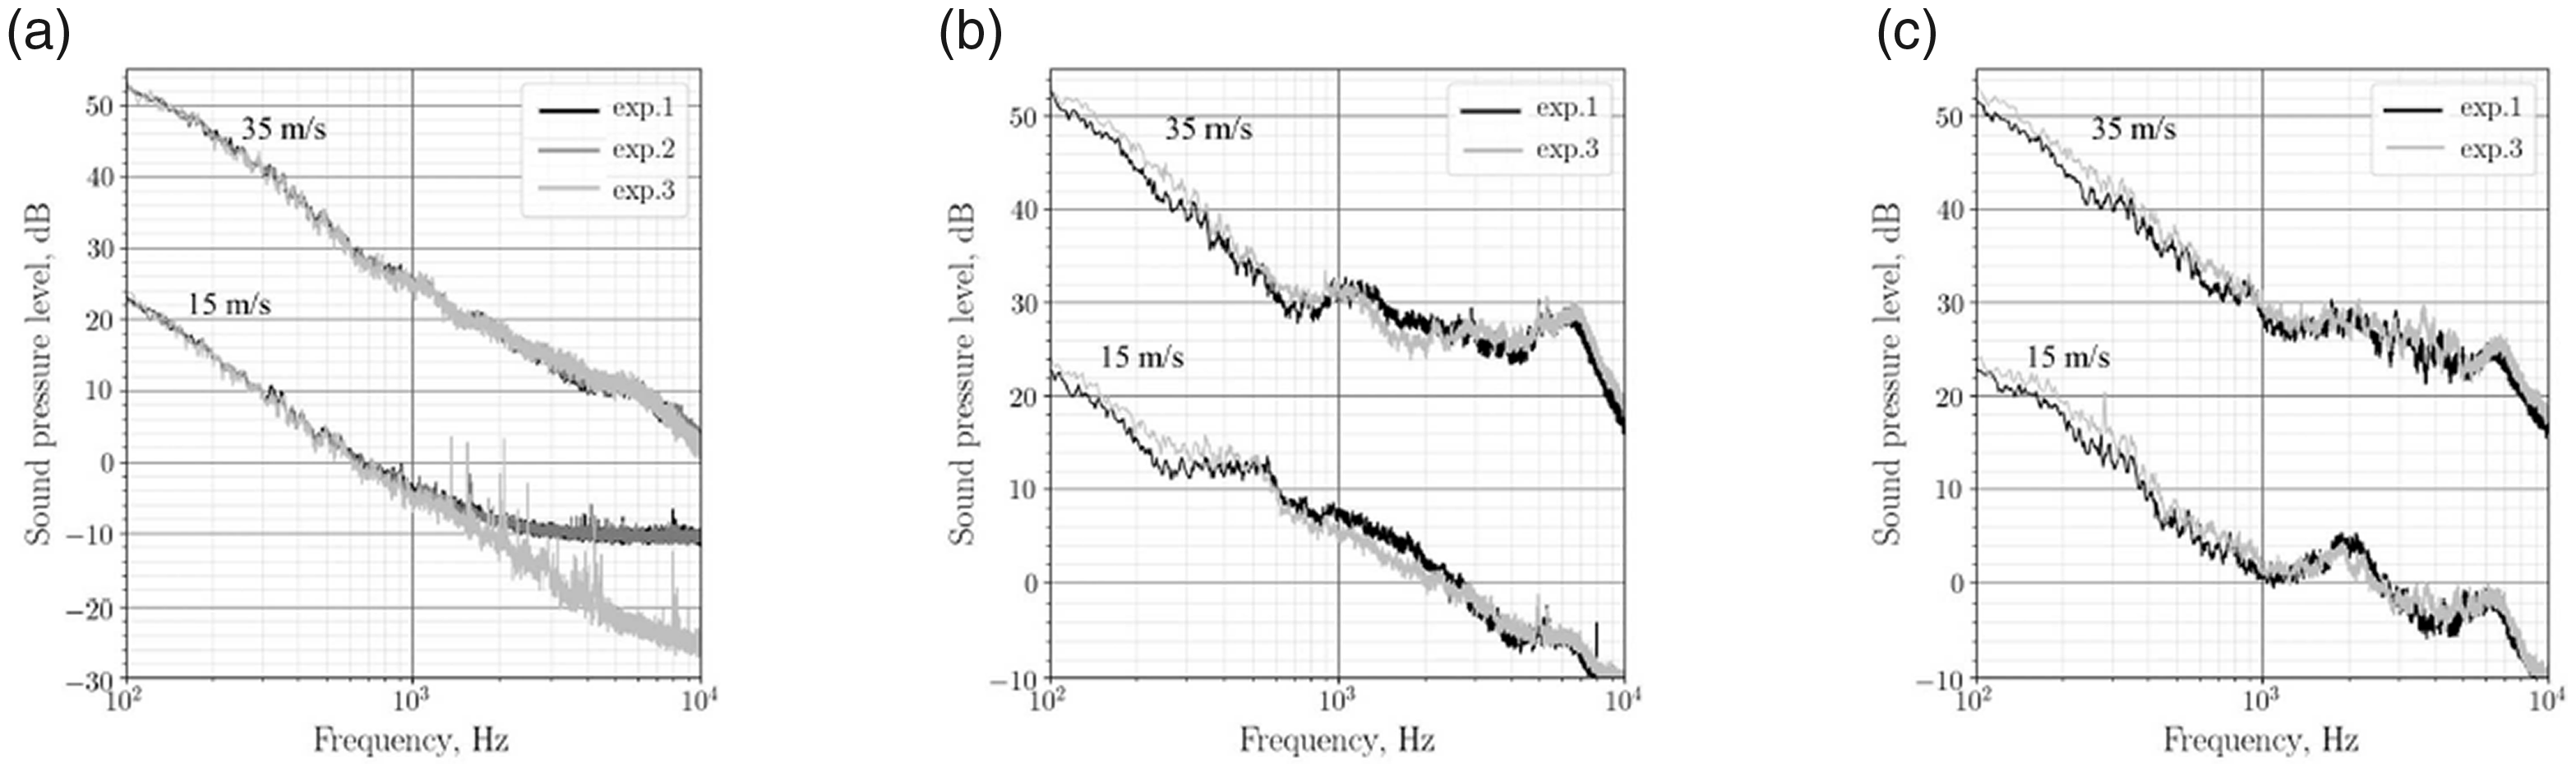
Sound pressure level for two experimental campaigns for the reference configuration (a), configuration with insert 1 (b) and configuration with insert 1 and screen 1 (c) at 15 m/s and 35 m/s. exp.1 and exp. 2 – measurements with a delay of a few days (same experimental setup), 23 exp.3 – measurements where the flat plate has been dismantled from the wind tunnel. 27
Reference configuration
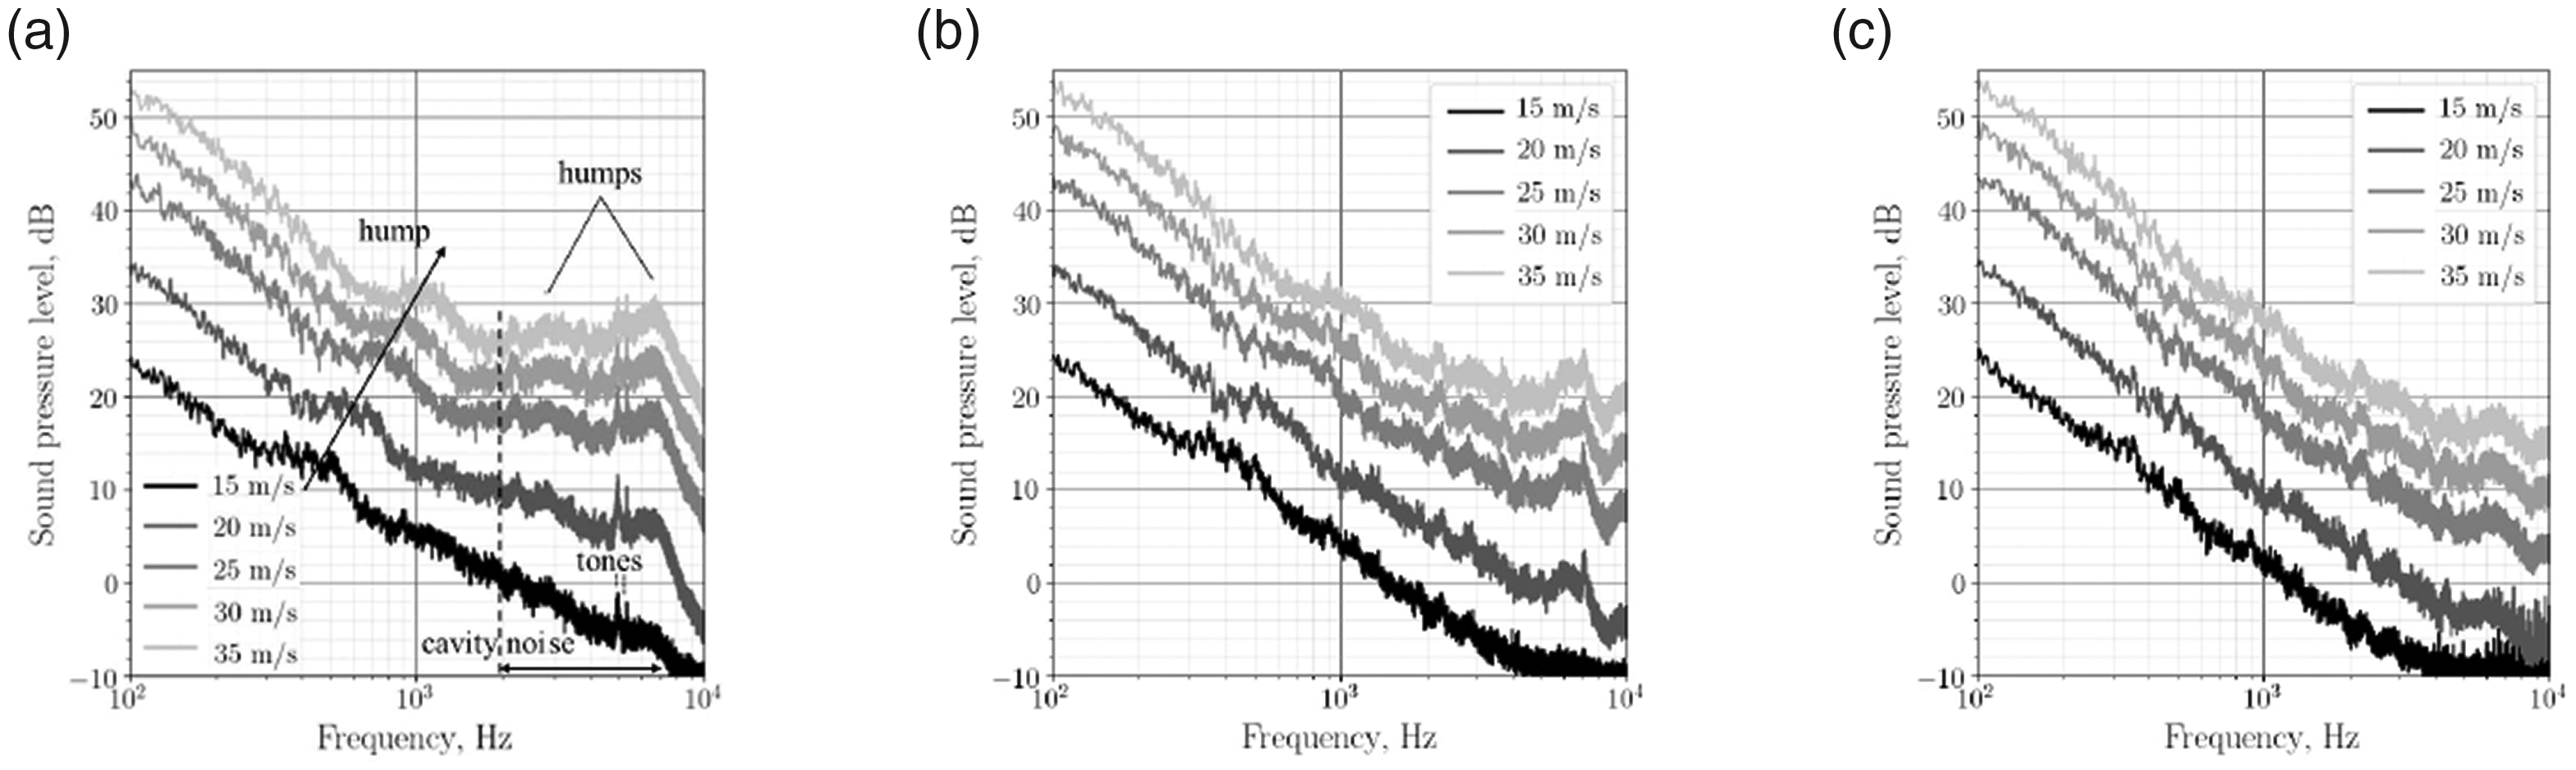
The sound pressure levels at
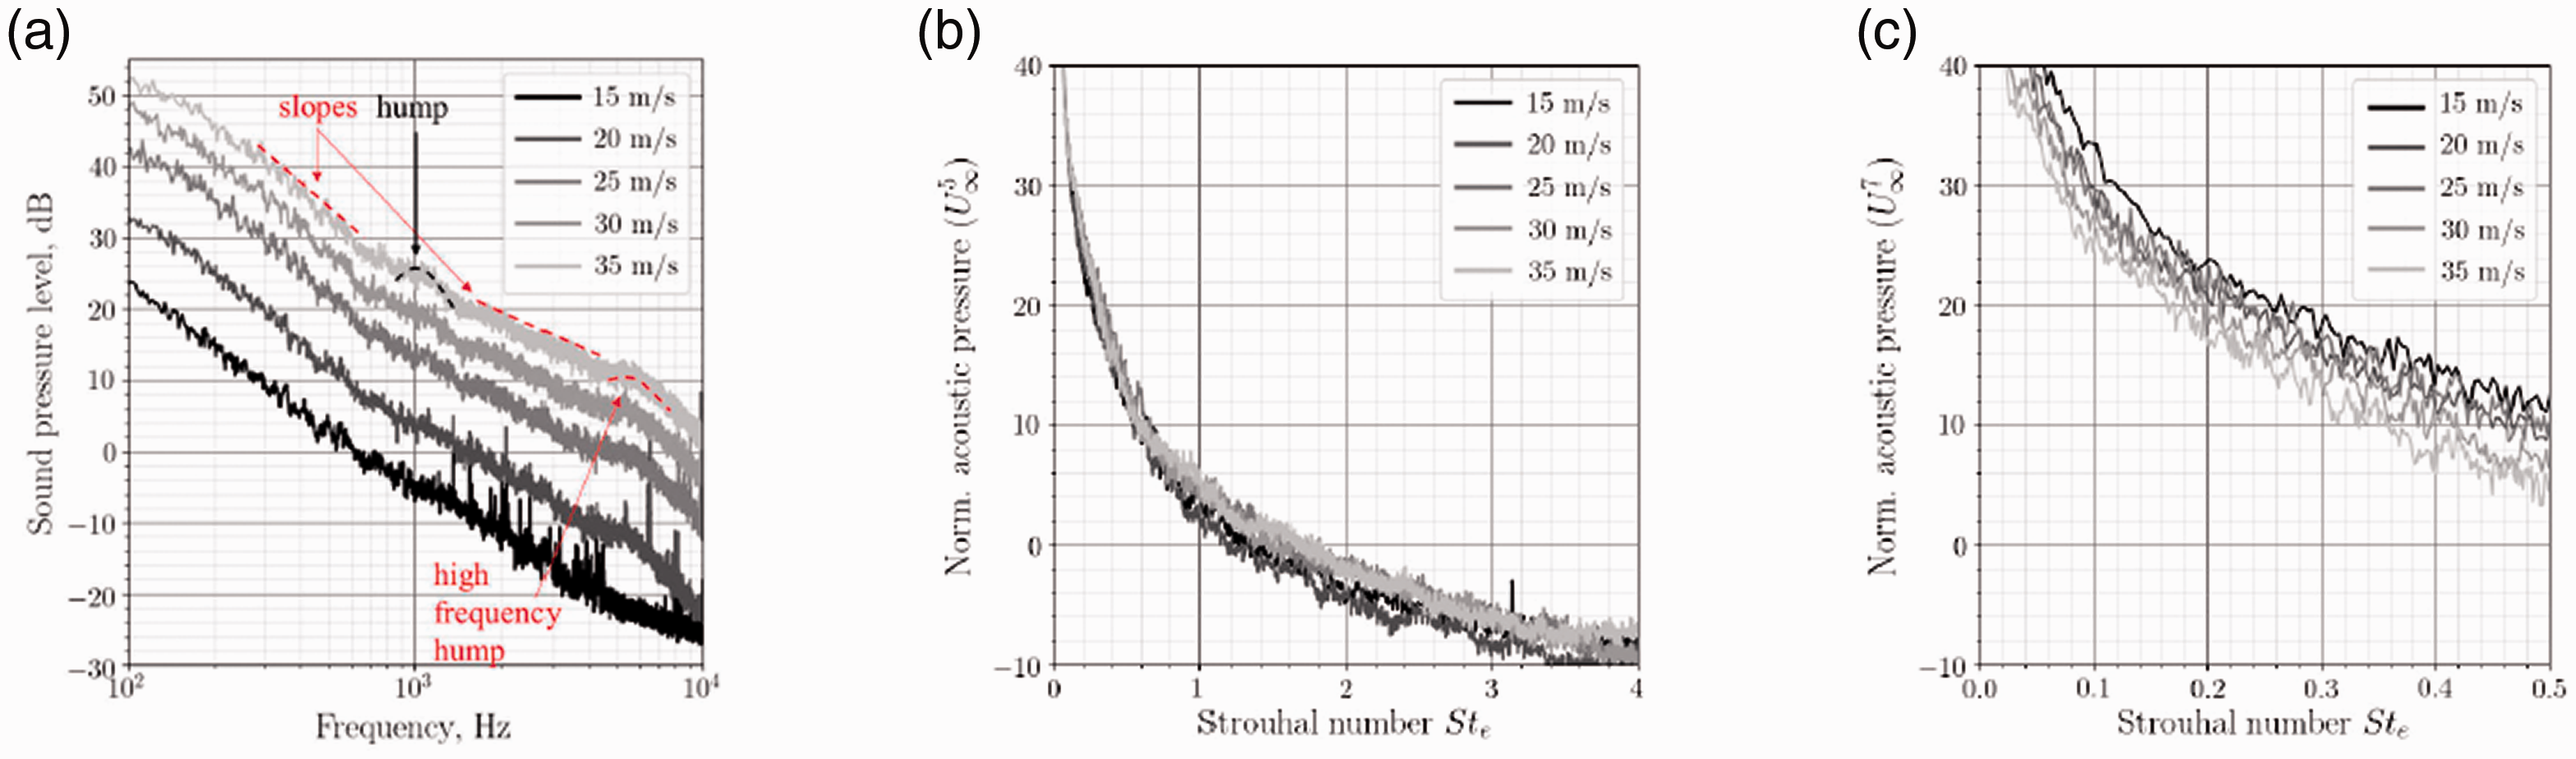
(a) Sound pressure level for the reference configuration at various flow velocities; (b) sound pressure level normalised by U5 and scaled with Strouhal number; (c) sound pressure level normalised by U7.
Configurations with inserts only
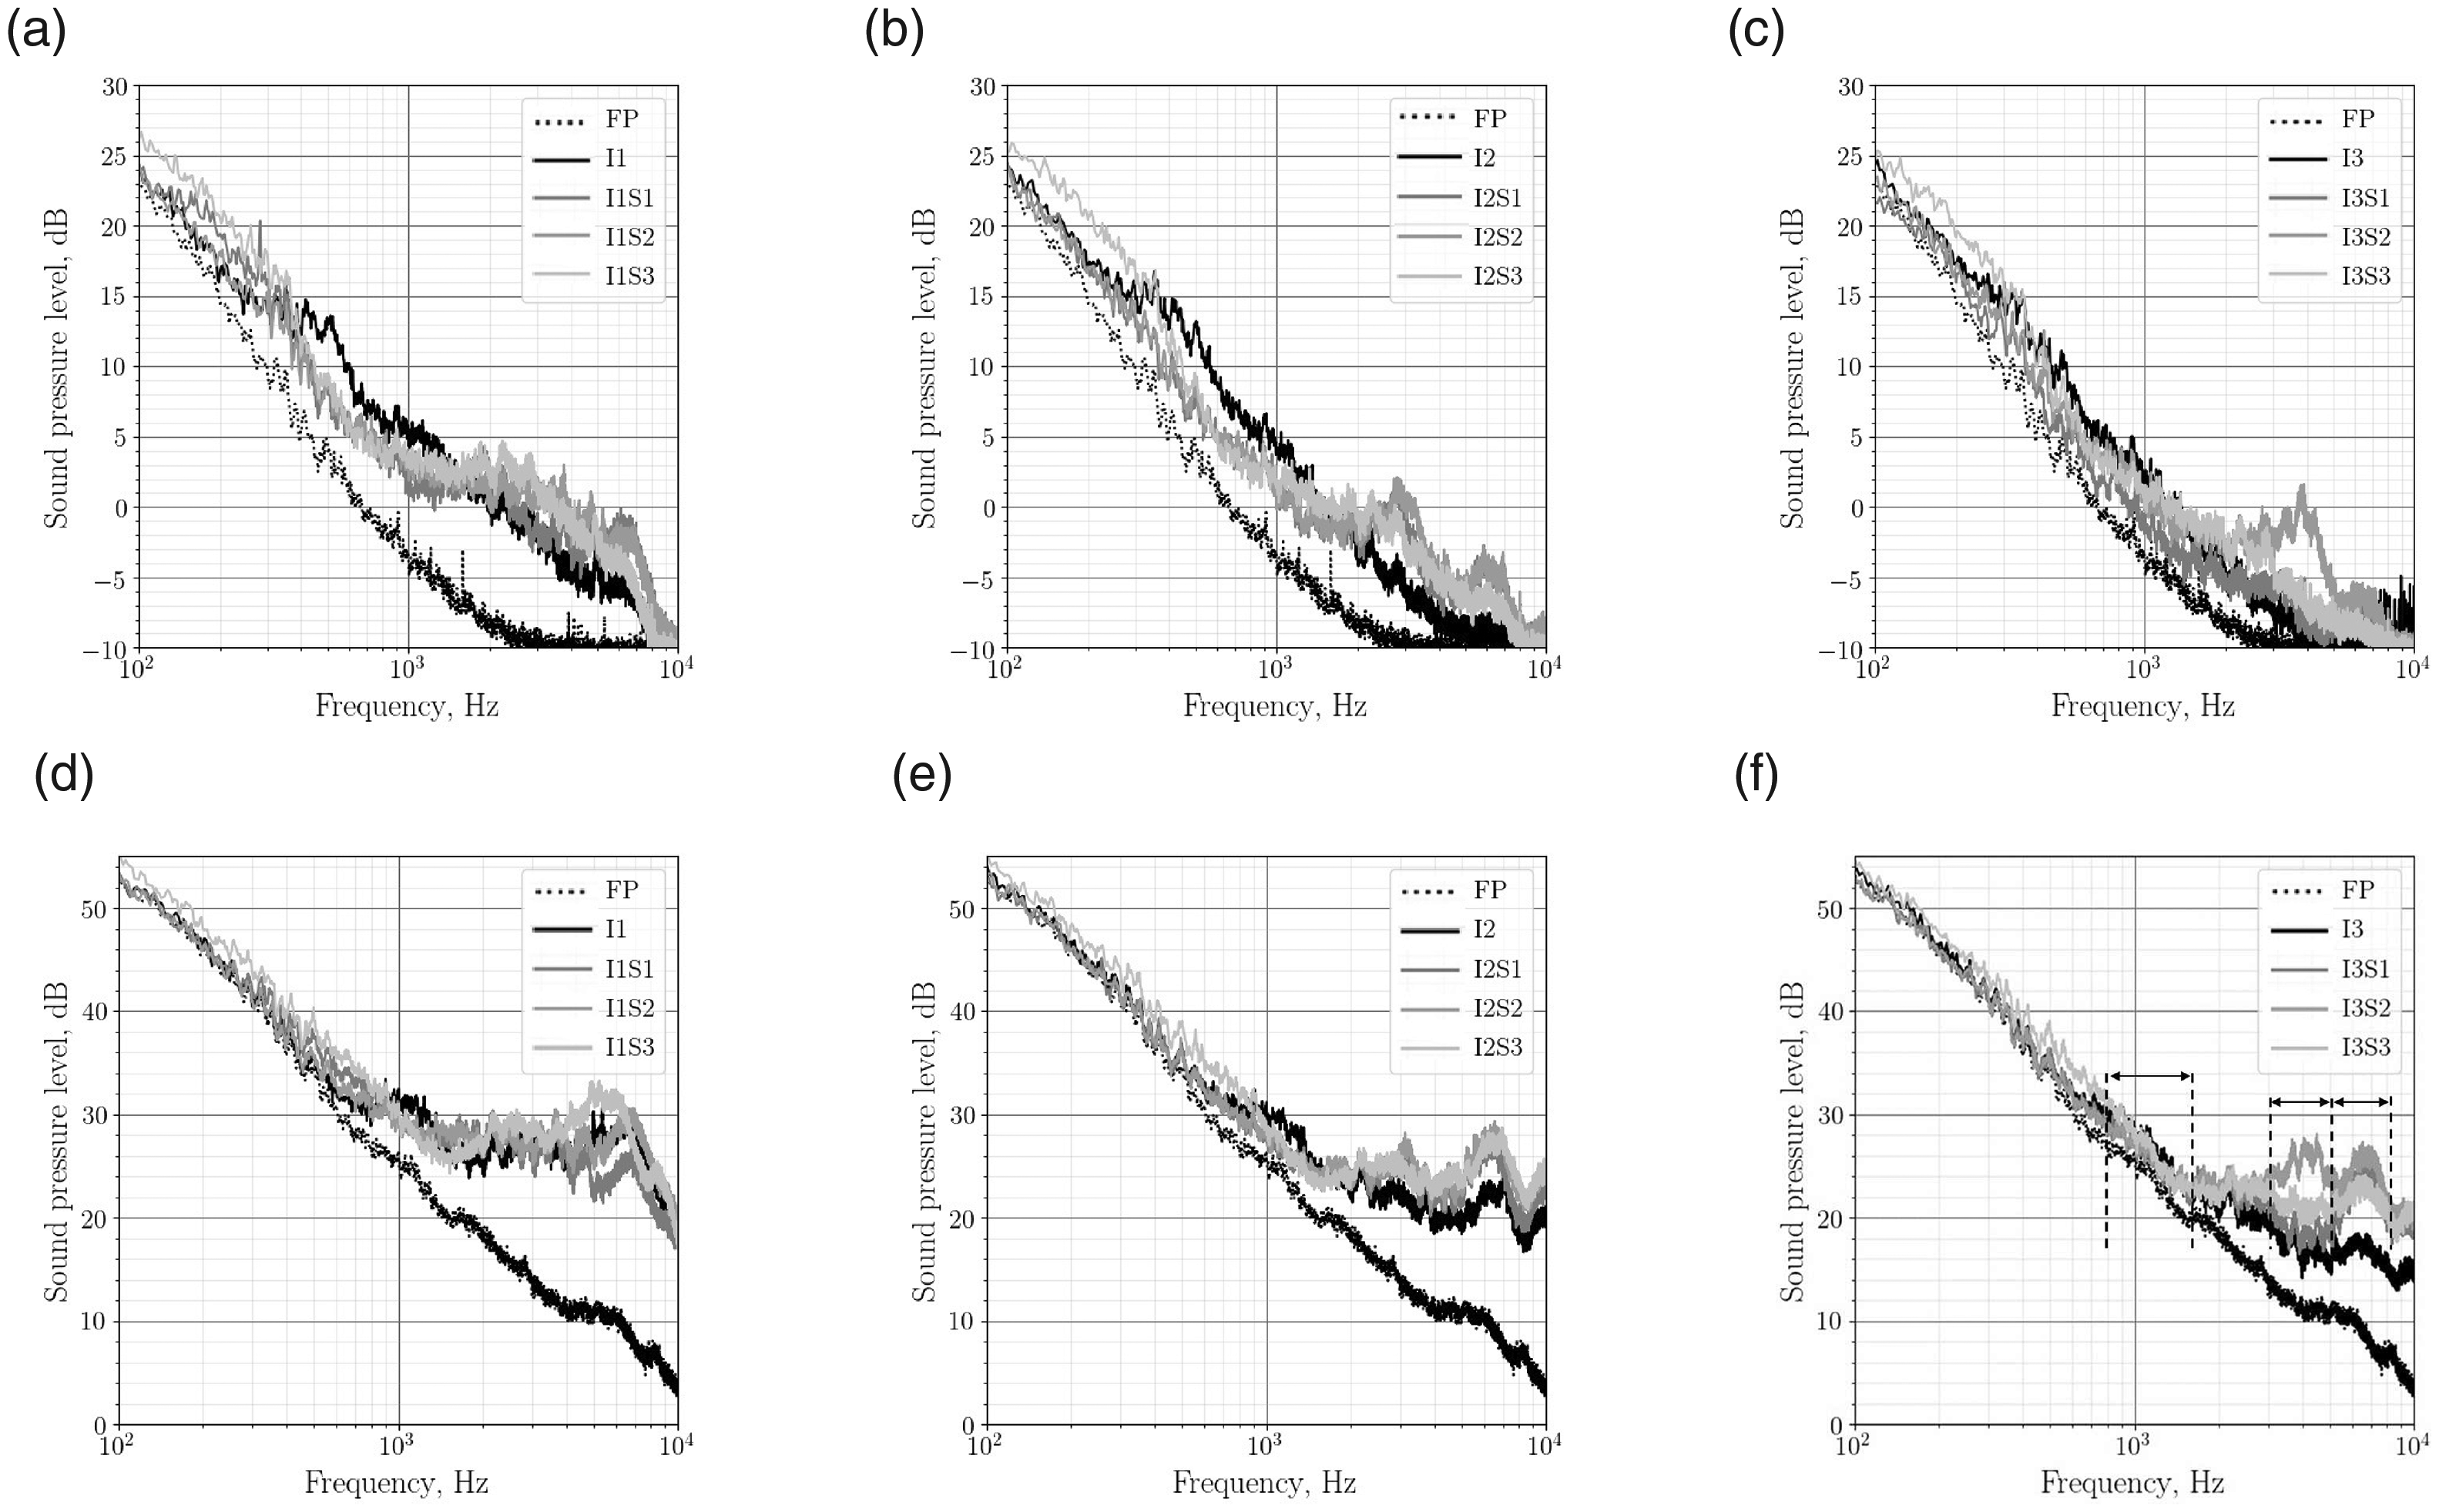
Figure 8 shows the sound pressure level for different tested inserts. In Figure 8(a) the configuration with insert 1 shows a hump that starts at 300 Hz for 15 m/s and shifts toward higher frequencies around 1 kHz with the increase of the flow velocities. This hump was hardly observed for the reference configuration and can be attributed to the flow recirculation behind the blunt trailing edge. At frequencies beyond 2 kHz, the spectra for all flow velocities have very similar shapes and have no shift with the increase of velocity. Such features as two humps centered at 3 kHz and 6.5 kHz and the peaks around 5 kHz are also distinguished. This area corresponds to the second noise source generated by the cavities. The cavity noise increases more drastically at high flow velocities and has comparable noise level with the hump generated by the trailing edge. Figure 8(b) and (c) shows that the spectra for the shallower inserts have similar behavior but with less pronounced features (humps and tones). Nevertheless, a clear tone around 7000 Hz can still be seen for insert 2. For insert 3 all the features have almost vanished in the broadband spectra. There is a possible coupling between the two noise sources so that the cavity depth affects the first hump as it is more defined for the configuration with deeper cavities. The similar effect was observed by Moreau et al.29–31 for the katana blade between the cavity noise induced by the blood grooves (or Shinogi-ji) and the vortex shedding induced by the blunt side of the single-sided sword. The comparison between the reference configuration and configurations with inserts at 15 m/s and 35 m/s is presented in Figure 9. The reference configuration has the lowest SPL and, as expected, the shallowest insert 3 is closest to the reference case. In the frequency range from 1 kHz up to 8 kHz the shapes of the spectra for all three inserts at 35 m/s have the peaks and humps (the three regions highlighted by arrows) almost at the same frequencies. Note that the levels of the second and third humps clearly increase with the cavity depth. Even though this is less pronounced on the first hump, the constant increase of its levels with cavity depth stresses again the coupling between the trailing-edge scattering and the cavity noise. At the lowest speed (15 m/s), all humps have almost disappeared, suggesting as in Howe’s cavity model that the monopole contribution of the cavities has almost vanished (see Figures 3 and 4 in Howe 32 )
Sound pressure level for the configuration with insert 1, d = 10 mm (a), insert 2, d = 5.38 mm (b) and insert 3, d = 3.3 mm (c) at various flow velocities.
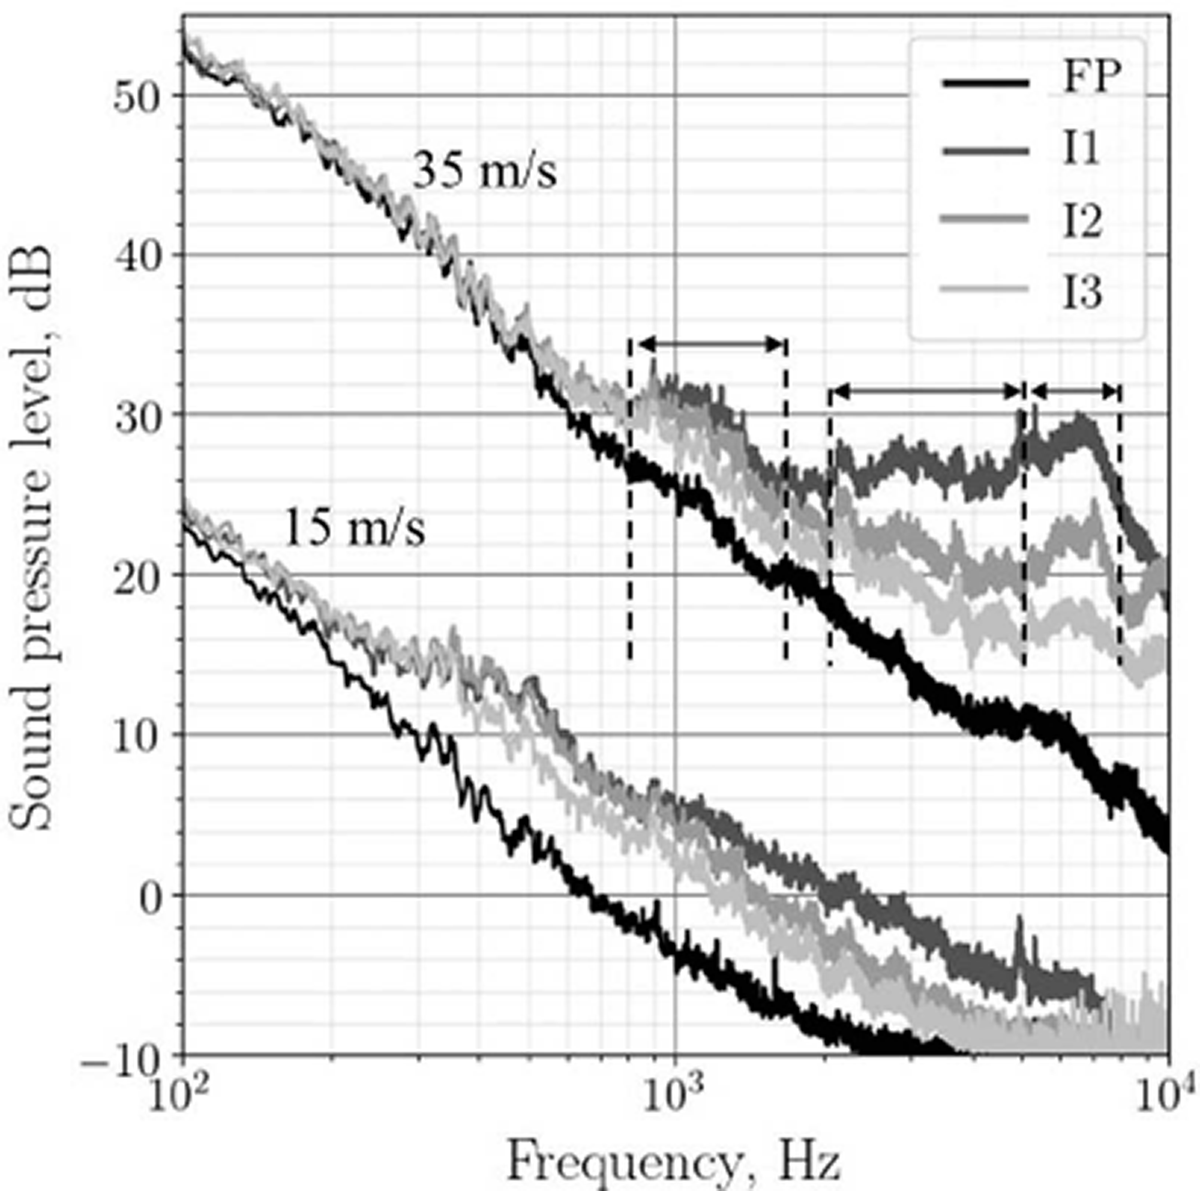
Comparison of sound pressure levels generated by inserts with the reference flat plate at 15 m/s and 35 m/s. FP – reference flat plate; I1 – insert 1; I2 – insert 2; I3 – insert 3. The frequency ranges presented as directivity in Figure 11 maps are highlighted by dashed lines and arrows.
Different scaling methods are tested in an attempt to identify the noise sources in the presence of inserts. As an example, the insert with the deepest cavities is chosen due to the most defined evidence of different noise mechanisms. The scaling of the normalized acoustic pressure by
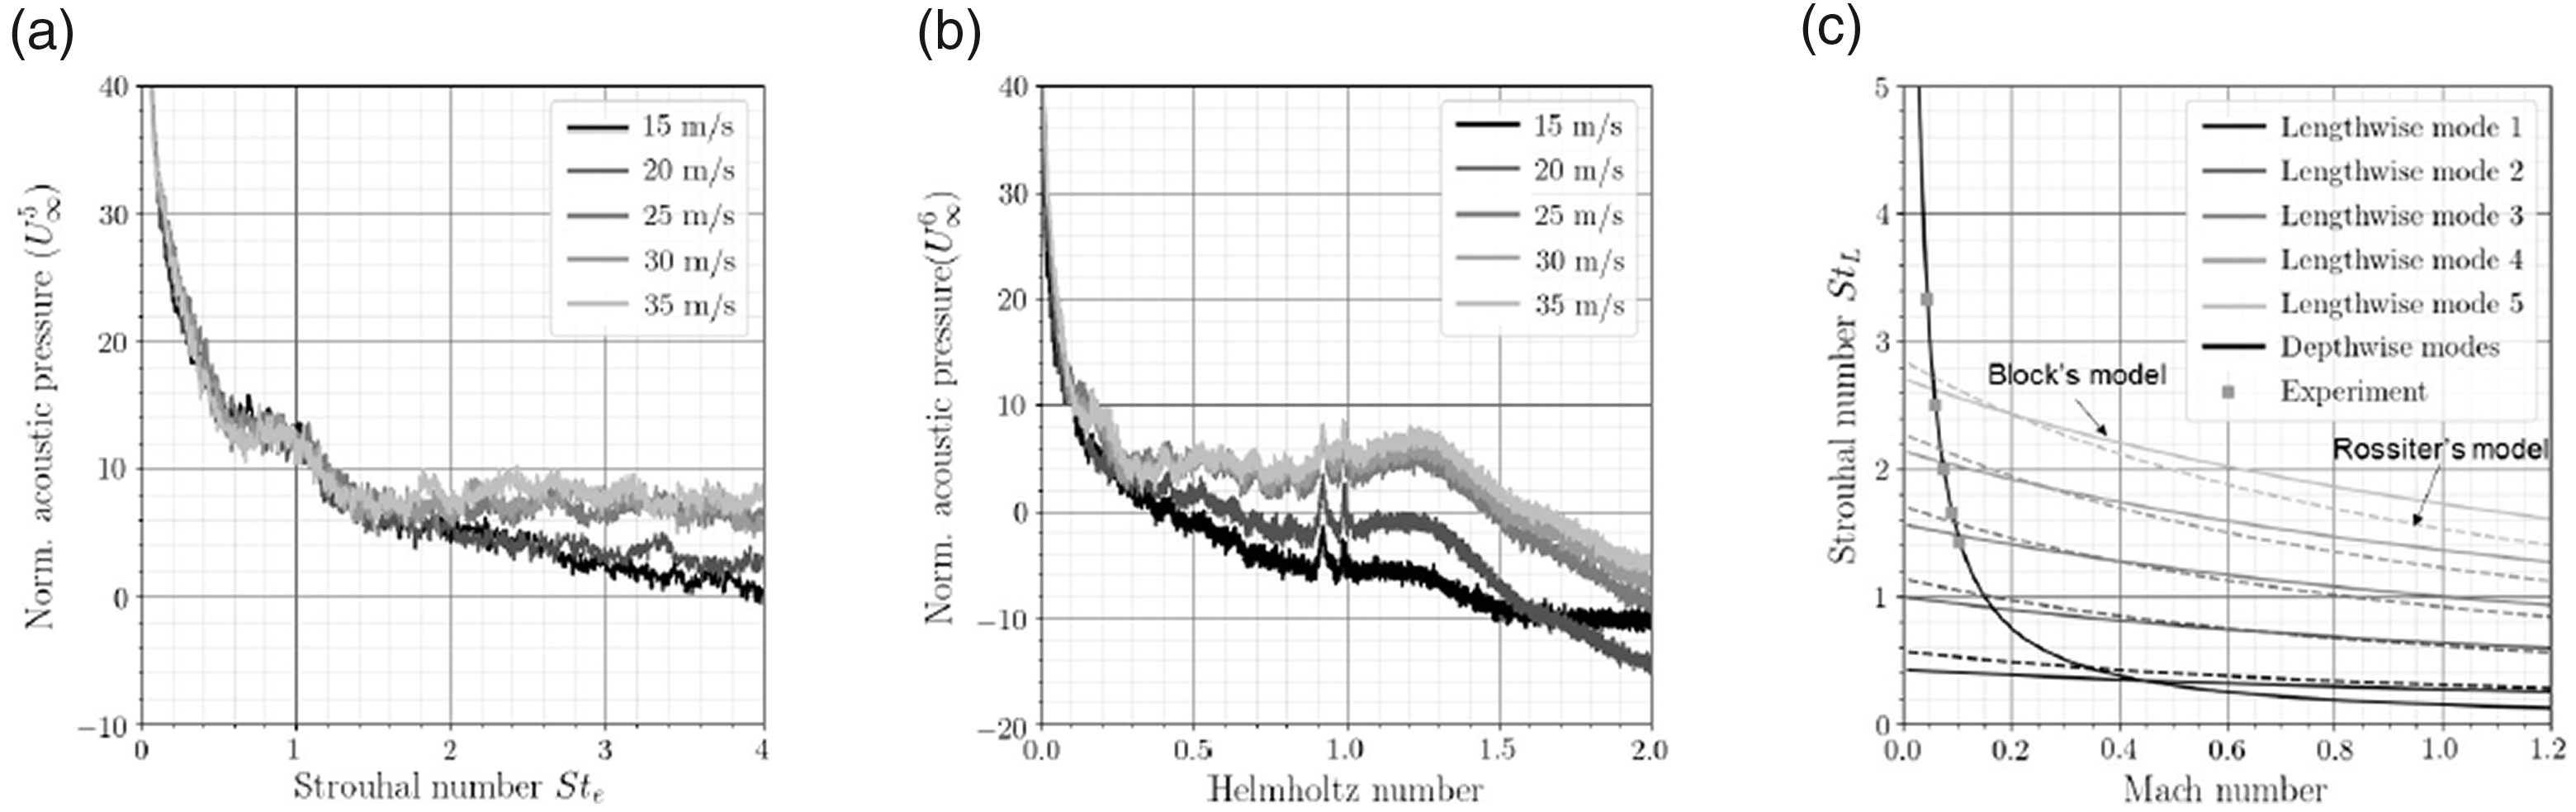
Scaling of sound pressure level with Strouhal number (a) and Helmholtz number (b). (c) Rossiter modes and depthwise modes. The configuration with insert 1.
Figure 10(b) shows the scaling of the normalized acoustic pressure by 
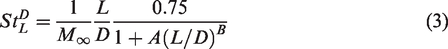
Finally, the angle-frequency directivity plots with different inserts are presented in Figure 11 at 35 m/s for several frequency ranges corresponding to the regions identified in Figure 9. In all frequency ranges, insert 3 generates less noise compared to deeper inserts. The first range from 800 Hz to 1.5 kHz corresponds to the hump generated by the recirculating area after the blunt trailing edge. The mean SPLs for insert 1 and insert 2 coincide behind the trailing edge (from
The angle – frequency directivity plots for all inserts at 35 m/s. (a) 800 Hz–1.5 kHz. (b) 2 kHz–5 kHz. (c) 5 kHz–8 kHz.
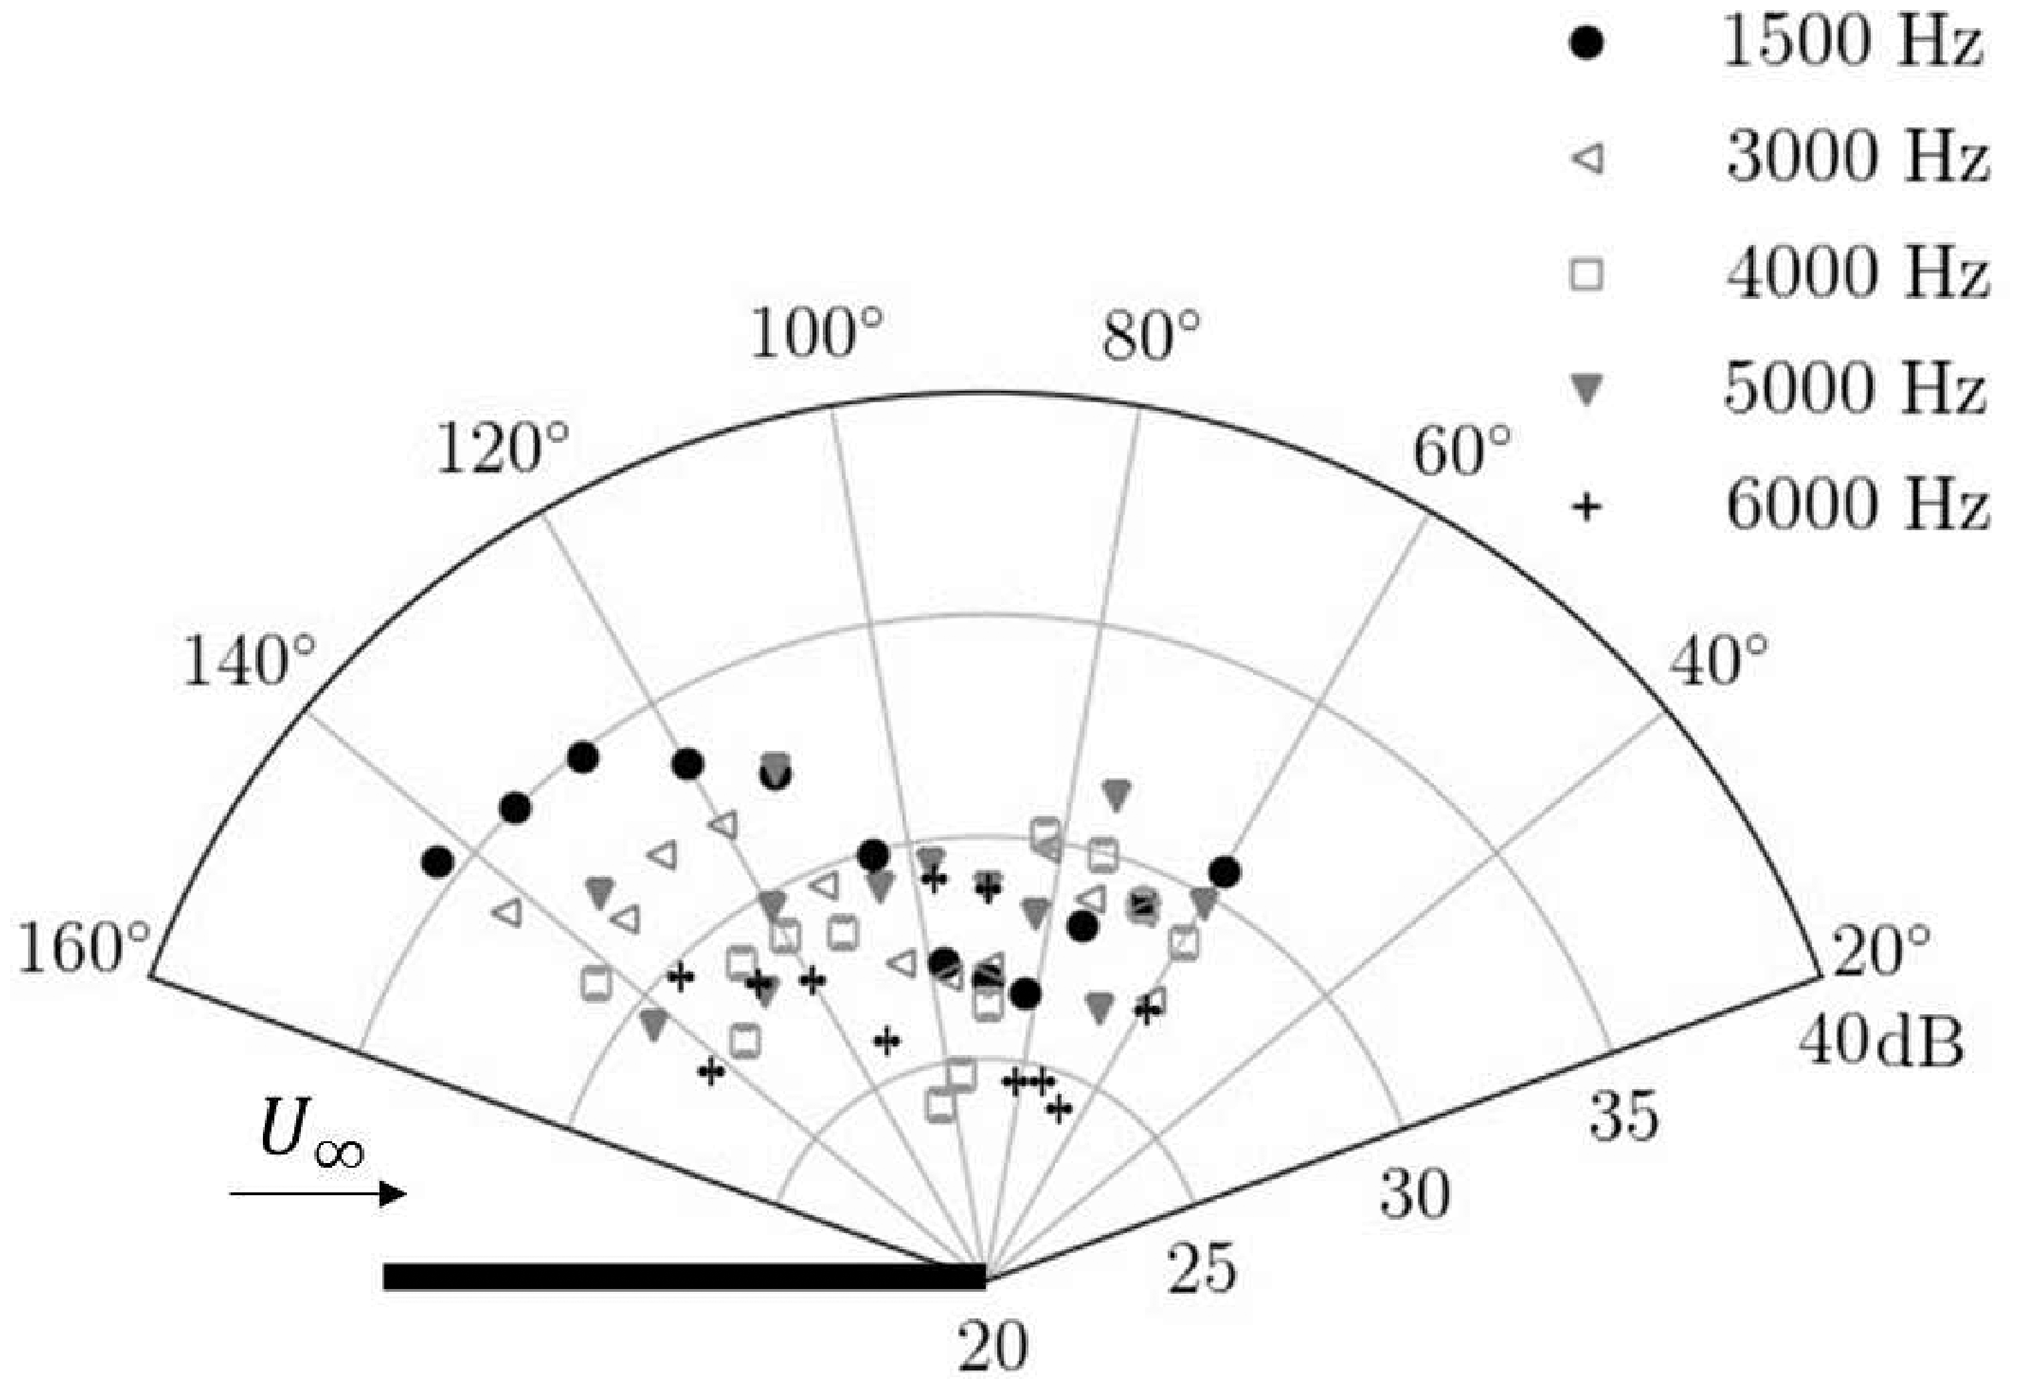
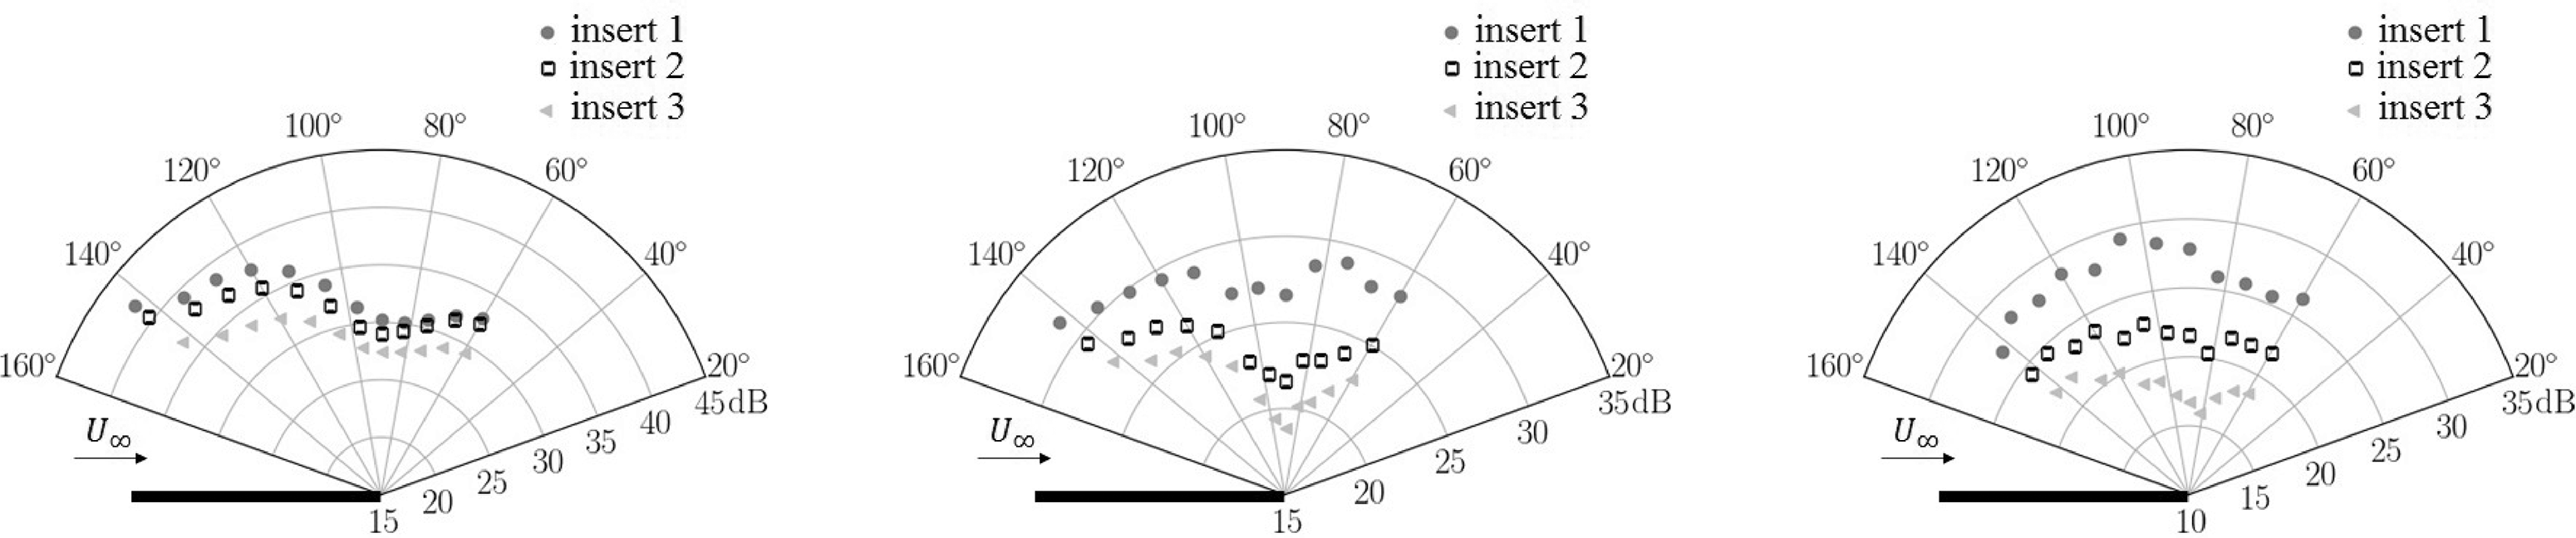
The angle-frequency directivity plot at discrete frequencies for insert 1 at 35 m/s. (a) Insert 1 at 15 m/s. (b) Insert 2 at 15 m/s. (c) Insert 3 at 15 m/s. (d) Insert 1 at 35 m/s. (e) Insert 2 at 35 m/s. (f) Insert 3 at 35 m/s.
Influence of the screen
As a next step, three different wire-mesh screens have been added on top of each insert. These configurations have been compared with the reference flat plate and the configurations with the three inserts described above. The SPL spectra at 15 m/s and 35 m/s are presented in Figure 13. At low frequencies (below 300–400 Hz) all configurations make similar noise. At 15 m/s, the configuration with insert 1 and screen 3 has 2 dB higher SPL at frequencies up to 300 Hz, which is most likely caused by the aforementioned uncertainty in the flow velocity for this case. Note that screen 3 induces a roughness on the plate that increases the excitation of the jet even more. Between 400 Hz and 1.5 kHz, all screens at both velocities reduce the hump associated with the recirculating area as can be clearly seen for the insert 1 with deepest cavities in Figure 13(a). Yet, up to 1 kHz the levels of most configurations with screens remain close to the reference one without treatments, especially with increasing velocity. At higher frequencies, beyond 2 kHz where the cavity noise is mostly generated, the effect of the screen is less clear and may only reduce this noise source in some frequency range. For instance, in the case of insert 1, screen 1 generates less noise at frequencies from 2 kHz to 6 kHz whereas screen 3 is the noisiest one for the same frequency range. The combination of the shallowest cavities of insert 3 and screen 1 with the finest mesh produces less noise at the aforementioned frequency range compared with the other two screens. Actually, the combination of insert 3 with screen 1 (the exact same features as in the CD airfoil) at 15 m/s is the only configuration in the whole test matrix that shows a consistent overall noise reduction compared to the configuration with insert in all directions at all frequencies, with maximum gains up to 10 dB. Moreover, the screens may also amplify the noise level. For instance, screen 2 with a middle-range cell size generates an additional hump from 2.5 kHz to 5 kHz at both speeds. At 35 m/s, it also amplifies the hump around 6.5 kHz associated with cavity noise by several decibels. As pointed out by Soderman, 37 the screened cavities may yield additional resonance caused by vortex shedding at the cell orifices. In general, the configurations with screens at 15 m/s have similar SPL and spectra shape depending on the insert. At 35 m/s the influence of the screen leads to more significant discrepancies at high frequencies. With increasing speed or Reynolds numbers the patterns in the radiations maps do not change but the noise gains are reduced and the noise generation are increased. This observed noise amplification by the screens with increasing Reynolds number can be caused by the surface roughness of the treatments as was already mentioned for instance by Geyer & Sarradj11,12 or Rubio Carpio et al. 13 for various foam-type porous trailing edges.
Sound pressure level for the reference configuration and the configurations with inserts and screens at 15 m/s and 35 m/s.
As the configuration of the shallowest insert 3 combined with different screens generates less noise compared to other inserts it was chosen to illustrate the angle-frequency directivity plot shown in Figure 14. In the first frequency range from 800 Hz to 1.5 kHz where the hump caused by the trailing-edge recirculating area was identified, screens 1 and 2 have very similar SPL while screen 3 produces SPL 2 dB higher. The overall levels of the first two screens are then slightly lower than for the insert alone (Figure 11(a)) consistently with the spectra in Figure 13. The overall shape of the directivity pattern is also close to the one which was observed previously for the configuration with insert only, corresponding to the drag dipole. In the second frequency range (2–5 kHz), several noticeable changes compared to the case without screen can be identified. Downstream, screen 2 has almost identical levels (same monopole contribution). Screen 3, however, exhibits a much larger upstream lobe compared to the case without screen (almost similar to the deepest cavity of insert 1), stressing a larger monopole contribution (Figure 11(b)). Only screen 1 yields some noticeable noise reduction of the monopole contribution. Upstream, screens 2 and 3 significantly amplify the cavity noise radiation and yield similar levels. Screen 2 still generates the highest SPL almost for all microphones except at
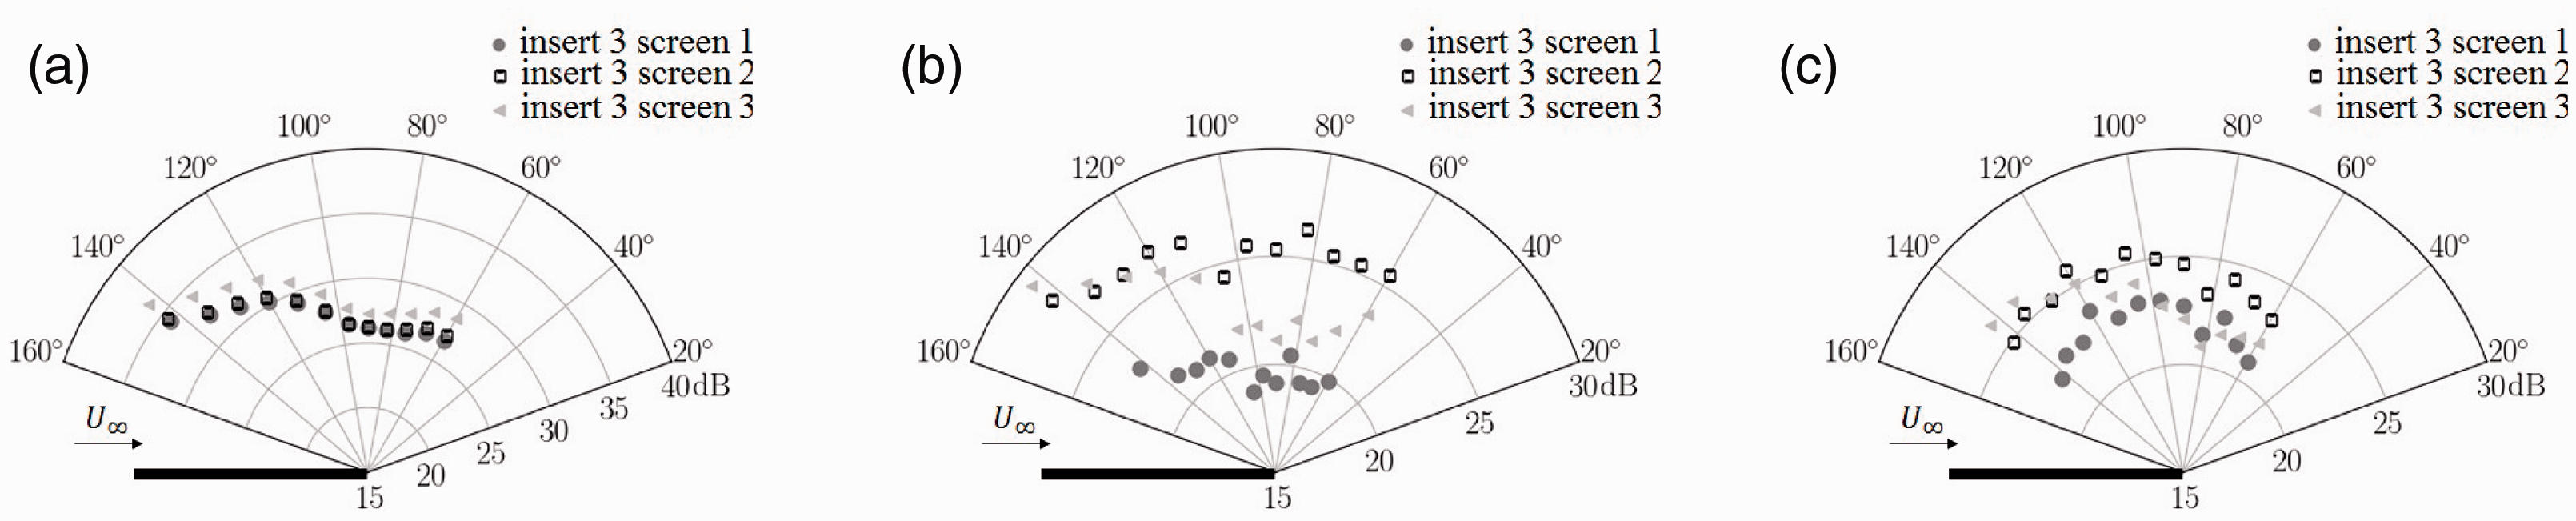
The angle – frequency directivity plots for insert 3 and all screens at 35 m/s. (a) 800 Hz–1.5 kHz. (b) 2 kHz–5 kHz. (c) 5 kHz–8 kHz.
In summary, on the one hand, screen 2 almost always amplifies the cavity noise, both monopolar and dipolar contributions. On the other hand, screen 1 has the overall lowest levels for all frequencies at almost all observation angles (within the measurement uncertainty), which is also consistent with the observation on the overall radiation map and the spectra. Yet, the noise reductions are smaller than at the lower speed, and are no longer always significant compared to the insert without screen. This best configuration I3S1 shares the same features as the CD airfoil: same cavity aspect ratio and same screen, which suggests a further detailed investigation is needed to decipher its noise reduction mechanism. Note also, that the second best configuration I3S3 is the closest combination that actually mimics the scaled trailing-edge treatment of the CD airfoil (number of cells per cavity length). This may actually suggest that the configuration tested on the CD airfoil could be still further improved. Yet, the fact that the intermediate screen S2 strongly changes the levels and the directivity of the radiated noise also means that this optimum cannot be inferred by a simple linear interpolation of the wire-mesh cell size. The acoustic properties of these liner-type porous treatments with low-resistivity wire-mesh indeed strongly depend on the flow within it, flow penetration which was actually experimentally evidenced for the first time by Yakhina et al.. 38 This was also a conclusion drawn by Teruna et al. 15 when they simulated the flow within the metallic foam. Finally, at all speeds, the reference configuration also remains the quietest compared to the treated case, which is however a marked difference with the CD airfoil case. This may imply that either the different trailing-edge configuration (different Kutta condition or pressure release) or the strong adverse pressure gradient observed on the CD airfoil or both effects also contribute to flow within the liner-type porous treatment and consequently to the trailing-edge noise reduction.
Conclusions
The present study shows an experimental investigation of the liner-type porous treatments on the trailing edge of a flat plate in the anechoic wind-tunnel of Université de Sherbrooke (UdeS). This class of passive treatments combines rectangular grooves perpendicular to the flow and wire-meshes, and constitutes simplified liners that can be easily implemented on industrial airfoils. The control strategies are threefold: the groove depth is varied (variable groove aspect ratio) and various woven wire-mesh screens with different low porosities and resistivities are placed on top of the grooves. These screens have been selected based on previous tests on a CD airfoil. For the present study, the combinations of three inserts with different cavity depths and three screens with various porosities have been tested. Acoustic far-field and directivity measurements have been carried out at several flow velocities from 15 m/s to 35 m/s for all these configurations. The comparison with the reference flat plate and the flat plate with inserts only is provided as well. For the whole velocity range, measurements have been achieved down to -20 dB, the lowest noise levels that can be reliably in the UdeS open-jet wind tunnel. At low frequencies (below 300 Hz), jet noise was however observed to dominate for all configurations.
The noise from the reference flat plate exhibits the expected trailing-edge noise signature. Moreover, a slight hump observed at high speeds for a Strouhal number based on the plate thickness around 1 suggests an additional edge scattering mechanism caused by the unsteady recirculating area behind the trailing edge. When the cavities are introduced on the trailing edge of the flat plate, an additional noise mechanism occurs at high frequencies characterized by broadband humps and tones: the cavity noise. The SPL at these frequencies rises with the increase of the cavity depth. A coupling between noise generated by the recirculating area after the blunt trailing edge and this cavity noise is also evidenced as previously found on a Katana blade.29–31 The former phenomenon is all the higher as the cavity noise increases with the cavity depth. The noise generated by the trailing-edge scattering is shown to follow a dipolar radiation. Yet, two different high-frequency behaviors are found depending on the Reynolds number and the state of the shear layer. Tones are shown to be resonant at the intersection of high order modified Rossiter modes and the cavity depthwise modes as previously evidenced by Block. 33 As found previously by Howe 32 for a single rectangular cavity, two different contributions in the cavity noise generated by the transverse groove row can be found, a drag dipole yielding a main upstream directivity lobe and a monopole one that can significantly contribute to a downstream directivity lobe.
When the screens are introduced the noise levels in the mid-frequency range are reduced, and the hump of the recirculating area is damped. The effect of the screens on the cavity noise is much more complex, and may or may not reduce the SPL compared to the plate with inserts alone. On the one hand, screen 1 yields the lowest levels when combined with the shallower insert 3 (actual configuration of the CD airfoil), with levels that are almost systematically below the case with insert alone. On the contrary, screen 2 almost always amplifies the noise generated by the inserts alone, at least in some directions for all flow conditions. Screen 3 shows an intermediate behavior between the other two screens. For all screens, noise is regenerated in the high-frequency range, all the more as velocity (or equivalently the Reynolds number) is increased. This could be traced to the previously observed roughness noise.4,12,13 Cavity noise may not be obliterated by the screens and even amplified in some frequency range. A more complex sound directivity is found beyond 5 kHz, with multiple lobes (sign of the plate non-compactness), the amplitude of which strongly depends on the groove depth and type of wire-mesh. Finally, overall the clean flat plate remains the most silent configuration for all tested Reynolds numbers, which is a noticeable difference with the previous CD airfoil experiment.
Footnotes
Acknowledgements
This work has been supported by the Chair of Aeroacoustics at Université de Sherbrooke.
Declaration of conflicting interests
The author(s) declared no potential conflicts of interest with respect to the research, authorship, and/or publication of this article.
Funding
The author(s) disclosed receipt of the following financial support for the research, authorship, and/or publication of this article: This work has been supported by a Mitacs Accelerate grant IT06453 in collaboration with Mecanum Inc.