
Abstract
We examine the widely accepted view that very low waist–hip ratios and low body mass indices (BMIs) in women in well-nourished populations are judged attractive by men because these features reliably indicate superior fertility. In both subsistence and well-nourished populations, relevant studies of fertility do not support this view. Rather studies indicate lower fertility in women with anthropometric values associated with high attractiveness. Moreover, low maternal BMI predisposes to conditions that compromise infant survival. Consistent with these findings from the literature, new data from a large U.S. sample of women past reproductive age show that women with lower BMIs in the late teens had fewer live births, controlling for education, marital history, and race. They also had later menarche and earlier menopause compared with women with higher youth BMIs. In addition, data from the 2013 U.S. natality database show that mothers with lower prepregnancy BMIs have an increased risk of producing both low-birth-weight and preterm infants controlling for other relevant variables—conditions that would have adversely affected fitness over almost all of human evolution. Thus, a review of the relevant literature and three new tests fail to support the view that highly attractive women are more fertile.
Introduction
Compared to the other great apes, male reproductive rate is slowed in humans due to paternal care; thus, men are expected to (Clutton-Brock & Vincent, 1991) and do (e.g., Geary, Vigil, & Byrd-Craven, 2004) exhibit more mate choice than male chimpanzees, gorillas, or orangutans. Most students of sexual selection in humans assume that preferred traits reliably indicate reproductive advantages to be gained by selecting mates exhibiting those traits (e.g., Buss, 1988; Symons, 1979), though this assumption has been challenged (e.g., Prum, 2017). Two decades of research have highlighted low waist–hip ratios (WHRs), small waist sizes, and low body mass indices (BMIs) as important determinants for women’s bodily attractiveness, at least in well-nourished populations (see Lassek & Gaulin, 2016, for review and new data). We do not question the existence of these preferences but want to draw attention to their alleged evolutionary basis.
Since Singh’s (1993a, 1993b) first studies of female attractiveness, most researchers in the field have accepted and built on his argument that women with low WHRs have higher fertility and better health (Grammer, Fink, Moller, & Thornhill, 2003; Marlowe, Apicella, & Reed, 2005; Pawlowski & Dunbar, 2005; Singh, 1993a, 1993b, 2002, 2006; Singh & Singh, 2011; Sugiyama, 2005; Weeden & Sabini, 2005). This claim has also been extended to low BMIs independent of WHR, for example, “the optimal BMI for health and fertility is struck at around a value of 18–19” (Tovée, Maisey, Emery, & Cornelissen, 1999). However, it should be noted that Singh and Young (1995) acknowledged that women with low BMIs and low WHRs are less fecund than heavier women with low WHRs, in contrast to their higher ratings for attractiveness.
Studies in well-nourished populations show that low WHRs are attractive only when BMIs are low. When the effects of BMI, WHR, and waist size (waist/height) are compared, waist size is the strongest predictor of attractiveness and largely mediates the relationship of both BMI and WHR to attractiveness (Brooks, Shelly, Jordan, & Dixson, 2015; Lassek & Gaulin, 2016; Rilling, Kaufman, Smith, Worthman, & Patel, 2008). Because waist/height is highly correlated with BMI (r = .94) in young women (Flegal et al., 2009), studies of the effects of low BMIs, WHRs, and waist sizes are all relevant to any claimed relationship of attractiveness to fitness (via health or fertility).
In this article, we examine the “fertility hypothesis,” the idea that certain body shapes are attractive because they reliably predict higher fertility. (Elsewhere [Lassek & Gaulin, 2018] we have tested—and rejected—the idea that attractive body shapes signal better health.) Here, we evaluate the widespread claim that the low WHRs and BMIs characteristic of attractive women in well-nourished populations reliably predict higher fertility.
Before considering the specific evidence cited in support of the fertility hypothesis, there are several overriding reasons why this hypothesis is unlikely to be correct.
To begin with, the low WHRs and BMIs preferred in well-nourished populations are much smaller than mean or modal values in young women. Compared with a mean WHR of .74 for typical university undergraduates, the mean of the most attractive quartile (.72) was 1 standard deviation (SD) lower, the mean WHR of an average Playboy Playmate (.68) was 2 SD lower, and the most attractive imaginary female (.39) had a WHR 5 SDs lower than the mean of college women (Lassek & Gaulin, 2016). A BMI of 17, preferred in several studies (Fan, Liu, & Dai, 2004; Grillot, Simmons, Lukaszewski, & Roney, 2014; Lassek & Gaulin, 2016; Stephen & Perera, 2014), is 3 SDs below the college women’s mean of 22. If such values reflect optimal fertility, one would expect that they would be near the center of the WHR and BMI distribution rather than in the extreme negative tail.
Women with the lower BMIs considered attractive have reduced amounts of body fat, which is very strongly related to BMI (r = .96; Bigaard, 2004) and is a source of nutritional resources critical for survival and reproduction (Caro & Sellen, 1990; Norgan, 1997) including essential fatty acids needed for brain development (Lassek & Gaulin, 2006, 2008). The percentage of body fat in human females is much higher than in other mammals and primates (Pond, 1998) and much higher in females than males (Deurenberg, Yap, & Van Staveren, 1998). Low levels of the fat cell hormone leptin are associated with amenorrhea and infertility (Christo et al., 2008; Kopp et al., 1997; Laughlin & Yen, 1997; Miller et al., 1998; Welt et al., 2004), and women with low BMIs are at risk of hypothalamic amenorrhea (Christo et al., 2008; Frisch, Wyshak, & Vincent, 1980; Laughlin & Yen, 1997; Stokic, Srdic, & Barak, 2005). In subsistence populations with seasonal changes in female nutrition and body fat, women are much less likely to conceive when body fat levels decrease (Bailey et al., 1992; Leslie & Fry, 1989; Panter-Brick, Lotstein, & Ellison, 1993).
This may help to explain why higher female BMIs are preferred in several subsistence and forager groups: Shiwiar (Sugiyama, 2005), Hadza (Wetsman & Marlowe, 1999), Tsimane (Sorokowski, Koscinski, Sorokowska, & Huanca, 2014), Matsigenka (Yu & Shepard, 1998), Zulu (Tovée, Swami, Furnham, & Mangalparsad, 2006), and in the Gambia (Siervo, Grey, Nyan, & Prentice, 2006). In a survey of 58 cultures from the Standard Cross-Cultural Sample (P. J. Brown & Konner, 1987), men in 81% preferred women who were “plump or fat,” consistent with an earlier survey (Ford & Beach, 1951). Similarly, a review of 144 studies found that higher BMIs were judged positively in developing societies (Sobal & Stunkard, 1989). In a separate study of 54 cultures, the preference for plumper women was significantly stronger in those that experience higher levels of nutritional stress (Anderson, Crawford, Nadeau, & Lindberg, 1992).
Women in such forager and subsistence populations tend to have low BMIs in the range of 17–20 and low levels of body fat (Bribiescas, 2001; Howell, 2000, 2010; K. L. Kramer & Greaves, 2010; Leonard, 2008; Norgan, 1994; Nyak, 2014; Remis & Jost Robinson, 2014; Sharrock et al., 2008; Sherry & Marlowe, 2007; Sugiyama, 2005; Wheatley et al., 2014). In contrast with the pattern in well-nourished women (see below), women’s BMIs tend to remain low and often fall with age and parity (Garner, Smith, Beae, Lai, & Heywood, 1994; Jellife & Maddocks, 1964; H. G. Norgan, Ferro-Luzzi, & Durkin, 1974; Tracer, 1991; Ventkachatalam, 1962; Wheatley et al., 2014), suggesting that reproductively relevant fat resources are depleted by reproduction (see Lassek & Gaulin, 2006).
This may help to explain why a positive linear relationship between BMI and total fertility has been found in all of those subsistence populations where it has been studied, including Hadza, Ache, and Agta hunter-gatherers (Hill & Hurtado, 1996; Marlowe, 2004a; Page et al., 2016), and horticulturalists in Papua New Guinea (Brush, Boyce, & Harrison, 1983), the Columbian Andes (Mueller, 1979), and rural Gambia (Courtiol et al., 2013; Sear, Mace, & McGregor, 2003). A study of 22 subsistence societies found that average adult body weight was strongly correlated with reproductive fitness (Hochberg, Gawlik, & Walker, 2011). Thus, women with higher BMIs than are typical in their populations tend to have more children.
In well-nourished populations, the low BMIs and WHRs considered attractive are most likely to occur in women younger than age 20 (Al-Sendi, Shetty, & Musaiger, 2003; Bacopoulou, Efthymiou, Landis, Rentoumis, & Chrousos, 2015; Casey et al., 1994; Fredriks, Buuren, Fekkes, Verloove Vanhorick, & Wit, 2005; Gillum, 1999; Haas, Liepold, & Schwandt, 2011; Kahn & Cheng, 2008; Kelishadi et al., 2007; Kimm et al., 2005; Martinez, Devesa, Bacallao, & Amador, 1994; Moreno et al., 2007; Taylor et al., 2010; Westrate, Deurenberg, & Tintern, 1989), and this is an age-group which has long been known to have decreased likelihood of conceiving (fecundability; Ashley-Montagu, 1939). The frequency of anovulatory cycles is 80–90% in the year after menarche (Loucks, 2006), 70% at 5 years after menarche, and 40% in women aged 20–24 (Apter, 1980; Ellison, Lager, & Calfee, 1987; Loucks, 2006; Metcalf & Mackenzie, 1980). Anovulatory cycles reach a minimum frequency (10–20%) only in the age range of 25–29, when the ovaries fully mature (Doring, 1969; Ellison et al., 1987; Loucks, 2006). As a result, fecundability increases from .20 per menstrual cycle at age 15 to .36 at age 20 and peaks at .40 at age 25 (Weinstein, Wood, Soto, & Greenfield, 1990). Consistent with these findings, age-specific fertility rates in three hunter-gatherer groups were lowest in the teens and highest in women in their late 20s and early 30s (Pennington, 2001). Men seeking mates with maximum fecundity should prefer women in their late 20s who are likely to have higher BMIs than those in their teens.
The limited evidence which has previously been offered to support the fertility hypothesis, drawn exclusively from well-nourished populations, emphasizes the decreased fecundability of women with high WHRs or BMIs, but such evidence cannot be used to support the claim that the very low BMIs and WHRs associated with attractiveness in such populations indicate higher fertility. To explain such preferences, it would be necessary to show that the unusually low values judged to be highly attractive predict higher fertility than do mean or modal values of BMI and/or WHR. As discussed below, we have been unable to find any studies that support such a claim.
WHR and Fertility
The studies cited in support of the idea that low WHRs indicate better fertility (Table 1) have focused on fecundability, which depends of ovulation. In ovulatory cycles, follicle-stimulating hormone stimulates the development of ovarian follicles and the secretion of increasing amounts of estradiol by ovarian theca cells. When estradiol reaches its peak, there is a surge of luteinizing hormone (LH) from the pituitary; and the follicle releases its egg. LH then stimulates the secretion of progesterone from the releasing follicle (corpus luteum), which prepares the endometrium for implantation of a fertilized egg. Thus, cycles in which conception occurs are associated with higher estradiol and progesterone levels (Lipson & Ellison, 1996; Li et al., 2001; Lu, Bentley, Gann, Hodges, & Chatterton, 1999; Venners et al., 2006). None of the studies cited to support the fertility hypothesis show that the very low WHRs found most attractive have higher fecundability than mean or modal values.
Studies of WHR (or Waist Size) and Putative Correlates of Fertility.

Note. WHR = waist–hip ratio.
In vitro fertilization studies which have been cited (of questionable ecological validity) all use very high cut points, dividing women into high- and low-WHR groups at either .80 or .85 (Van Noord-Zaadstra, Seidell, Vrieswijk, & Noord, 1991; Wass, Waldenstrom, Rossner, & Hellberg, 1997; Zaadstra et al., 1993). Likewise, a claim that low WHRs are associated with more ovulatory cycles is based on a WHR cut point of .85 (Moran et al., 1999). These cut points are much higher than mean WHRs in young women (0.74–75).
Thus, the supposedly “low-WHR” categories in these studies included the mean and mode, as well as many values above these midpoints. Any falloff in fertility in women with very high WHRs may make such comparisons statistically significant but does not demonstrate high fertility at very low WHRs. Such analysis cannot reveal the fertility of women at the extreme low end of the WHR distribution—the data that are relevant to understanding why such women are judged as most attractive. Only studies using smaller bin sizes could do that.
Because ovulatory cycles are have higher estradiol and progesterone levels, levels of these hormones (measured at various times during the menstrual cycle) are often used as proxies for fecundability. Although progesterone levels are a better indicator of ovulation, the studies cited have used estrogen, and none of these studies show enhanced fecundability in women with low WHRs.
One such study frequently cited to show that low WHRs indicate enhanced fertility (Jasienska, Ziomkiewicz, Ellison, Lipson, & Thune, 2004) compared salivary estradiol levels in the quartile having the lowest WHR (mean = .669) with the highest WHR quartile (mean = .795) in a Polish sample and found that the quartile with the lowest WHRs had significantly higher estradiol than did the highest quartile. However, a difference between high and low quartiles does not show that the most attractive WHRs are associated with higher estradiol (and presumed fertility) than mean or modal values.
Fortunately, in another study of Polish women (Ziomkiewicz, Ellison, Lipson, Thune, & Jasienska, 2008), more complete data were available. A similar group of young women were divided into four quartiles based on body fat, which in other studies is very strongly correlated with BMI (r = .94; Bigaard et al., 2004) and waist size (r = .84; Flegal et al., 2009). Mean WHR increased monotonically across the quartiles of body fat, from .70 in the lowest quartile to .75 in the highest. And while women in this lowest quartile had higher mid-cycle estradiol than those in the highest quartile (as in Jasienska et al., 2004), they had significantly lower estradiol than women in the two middle quartiles (with mean WHRs of .71 and .72). Thus, the quartile of women with the lowest WHRs and body fat levels had hormonal indicators of lower fertility than half of the women in the sample. For all women with less than 30.8% body fat—representing 75% of the sample—estradiol showed a positive linear relation to body fat. Thus, in all but the heaviest quartile, lower WHR and lower percentage body fat were associated with lower estradiol and—by the standard assumption used to claim high fertility for women with low WHRs (Lipson & Ellison, 1996; Li et al., 2012; Lu et al., 1999; Venners et al., 2006)—with likely lower fertility.
Several other studies in premenopausal women have found higher estradiol levels in women with higher WHRs or waist circumferences (Astrup et al., 1992; Emaus et al., 2008; Finstad et al., 2009; Kirchengast, 1993), or no relationship between estradiol levels and body shape (Grillot et al., 2014; Lamon-Fava et al., 2005; Verkasalo, Thomas, Appleby, Davey, & Key, 2001).
Studies of time-to-pregnancy may be better indicators of the effects of WHR on fecundability. In two studies, there was no significant difference in time-to-pregnancy even for WHRs over .85 and .88 (McKinnon et al., 2016; Sundaram, Mumford, & Buck, 2017). In one other study (Wise, Palmer, & Rosenberg, 2013), there was a significant increase in time-to-pregnancy only for WHRs > .85, again a cut point that fails to adequately test the fertility hypothesis.
Despite the negative evidence considered above, perhaps WHR could track variation in fecundability in adolescent women as reflected in the menstrual cycle. Fortunately, this possibility has been tested in four studies of adolescents. Three of these studies, with a total N of 3,107 females aged 15–18, focused on symptoms linked to reduced fecundability, such as oligomenorrhea or irregular menstrual cycles. Such symptoms are common in women who fail to ovulate, as may occur in polycystic ovary syndrome (Fessler, Natterson-Horowitz, & Azziz, 2016; Singh, 1993a, 1993b). These studies found no WHR difference in those with regular cycles compared with those with oligomenorrhea or irregular menses (van Hooff, Voorhorst, Kaptein, & Hirasing, 1999; van Hooff et al., 2000a, 2000b). Similarly, in a sample of 299 Canadian adolescents, there was no relationship between WHR and hormonal evidence of ovulation (Bond, Vella, Kiparissis, & Wynne-Edwards, 2006). These studies indicate that men cannot use a low WHR to select a young woman with higher potential fertility.
Do Low BMIs Signal High Fertility?
The claim that low BMIs of 17–19 are attractive because they signal higher fertility is even more problematic than the parallel claim for WHR because there is consistent data for subsistence populations showing decreased fertility at lower BMIs, as noted above, while studies in well-nourished populations generally show an inverted U-shaped relationship between BMI and fertility, with maximal fertility at BMIs in the range of 21–25, and decreased fertility in women with both lower and higher BMIs, suggesting stabilizing selection on women’s BMI. (Importantly, the higher BMIs associated with decreased fertility in well-nourished populations are rare in subsistence populations.)
In women trying to conceive, those with BMIs < 20 have an increased risk of infertility (Grodstein, Goldman, & Kramer, 1994; Rich-Edwards, Goldman, Willet, Hunter, & Stampfer, 1994). In a case–control study of ovulatory infertility in a sample of more than 100,000 American women who were trying to conceive, rates of infertility were already significantly elevated at a BMI of 20 and at a BMI of 17.5 were twice as high as in women with modal BMIs (Rich-Edwards et al., 2002) as shown in Figure 1.

Relationship between body mass index and ovulatory infertility, from Rich-Edwards et al. (2002) Copyright 2002 by Wolters Kluwer.
Women with low BMIs also tend to have increased time-to-pregnancy and decreased fecundability ratios (Bolumar, Olsen, Rebagliato, Saez-Lioret, & Bisanti, 2000; Jensen, Scheike, Keiding, Schaumburg, & Grandjean, 1999; Kaplan, Hooper, Stieglitz, & Gurven, 2015; Lake, Power, & Cole, 1997; Wise et al., 2010), although the lower values for low BMIs were not significant in some studies (Koivunen et al., 2008; McKinnon et al., 2016; Polotsky et al., 2010; Wise et al., 2013), probably because of the small number of women in the low-BMI group.
As was true for lower WHRs, the average estradiol levels of women with low BMIs tend to be lower than those of women with higher BMIs (Emaus et al., 2008; Ivandic, Prpic-Krizzevac, Mulcic, & Juric, 1998; Yeung et al., 2013; Ziomkiewicz et al., 2008). In addition, in a study of the menstrual patterns of 2,243 adolescent women, irregular cycles were associated with lower BMIs (van Hooff et al., 1998).
Especially relevant to issues of mate choice are studies that explore the relationship between adolescent BMI and subsequent fertility, although use of contraception in modern populations may obscure the effects of interest. Most studies show that young women with BMIs < 20 subsequently have fewer children (Dawson, Dhurandhar, Vazquez, Peng, & Allison, 2013; Jacobsen, Knutsen, Oda, & Fraser, 2013; Jokela et al., 2007 , 2008). In one study based on recalled weight at 18 (Pawlowski, Boothroyd, Perrett, & Kluska, 2008), there was no correlation between parity and youth BMI.
Women with lower BMIs may also have a shorter reproductive span between menarche and menopause. Young women with lower BMIs are more likely to have later menarche (Ayatollahi, Dowlatabadi, & Ayatollahi, 2002; Cagas & Riley, 1970; Kaplowitz, Slora, Wasserman, Pedlow, & Herman-Giddens, 2001; Mandel, Zimlichman, Mimouni, Grotto, & Kreiss, 2004; Matkovic et al., 1997; Morabia & Costanza, 1998; Mul et al., 2001; Oettle & Higginson, 1961; Zacharias & Wurtman, 1969), whereas those with higher leptin levels (reflecting more body fat) have earlier menarche (Matkovic et al., 1997). At the other end of the reproductive span, menopause tends to occur later in women with higher BMIs (Parazzini & PMIS Group, 2007).
The duration of postpartum and lactational amenorrhea is also shorter in women with higher BMIs or more body fat (Fink et al., 1992; Heinig, Nommsen-Rivers, Peerson, & Dewey, 1994; Tennekoon, Wasalathanthri, Jeevathayaparan, & Karunanayake, 2005), allowing shorter interbirth intervals. Thus, in all cases, low BMIs are associated with poorer fertility,
Lower Maternal WHRs and BMIs Predict Poorer Infant Survival
Reproductive success depends not only on fecundability and successful parturition but also on survival of offspring to reproductive age. In subsistence populations, infant survival appears to be a much more important factor in female reproductive success than fecundability (K. L. Kramer, 2008; Pennington, 1992). A survey of 19 hunter-gather groups found that 44% of infants born alive died within the first 15 years of life (Marlowe, 2005).
In the subsistence populations that have been studied, women with higher BMIs have more surviving offspring than those with lower BMIs, including samples in Nepal (Panter-Brick et al., 1993), Papua New Guinea (Brush et al., 1983), the Columbian Andes (Paul, Mueller & Whitehead, 1979), Hadza hunter-gatherers (Hiernaux & Hartono, 1980; Marlowe, 2004a), Turkana pastoralists (Pike, 2000), and !Kung (Pennington, 1992; Reid & Vugt, 1987; Wilmsen, 1978). In a sample of mothers in Bangladesh, the risk of a child dying was inversely related to the mother’s height and weight (Baqui, Arifeen, Amin, & Black, 1994).
In apparent recognition of this relationship, young women in subsistence groups may be allowed extra food and/or reduced workload to maximize the amount of body fat before marriage (P. J. Brown & Konner, 1987; K. L. Kramer, Greaves, & Ellison, 2009). These reproductive advantages for higher BMIs may also help to explain why men in several subsistence populations prefer women with higher BMIs (Siervo et al., 2006; Sorokowski et al., 2014; Sugiyama, 2005; Tovée et al., 2006; Wetsman & Marlowe, 1999; Yu & Shepard, 1998).
In well-nourished populations, the same patterns hold: Low BMIs and smaller waist sizes in women who do conceive are strongly correlated with poorer outcomes for their infants. Infant birth weight has a strong positive linear relationship with prepregnancy BMI (Abrams & Laros, 1986; Allen, Lungaho, Harrison, Neuman, & Kirksey, 1994; Ay et al., 2009; Neggers & Goldenberg, 2003; Neggers, Goldenberg, Cliver, Hoffman, & Cutter, 1995), and with its correlates, WHR and waist size (D. E. Brown, Koenig, Demorales, McGuire, & Mersai, 1996; Li et al., 2012; McCarthy, Strauss, Walker, & Permezel, 2004; Salem, Adler, Lee, & Smith, 2012; Wendland, Duncan, Mengue, Nucci, & Schmidt, 2007a).
Mothers with lower prepregnancy BMIs and smaller waists have an increased risk of having smaller, lower weight babies (Abrams & Newman, 1991; Bhattacharya, Campbell, Liston, & Bhattacharya, 2007; Cogswell & Yip, 1995; Edwards, Alton, Barrada, & Hakanson, 1979; Kalk et al., 2009; Leung et al., 2008; Murakami et al., 2005; Nandi & Nelson, 1992; Neggers et al., 1995) and an increased risk of having premature infants (Edwards et al., 1979; M. S. Kramer et al., 1995; Leung et al., 2008; Murakami et al., 2005; Wen, Goldenberg, Cutter, Hoffman, & Cliver, 1990).
A meta-analysis found that, for mothers with a prepregnancy BMI < 20 (i.e., in the most attractive range), the risk of producing a low-birth-weight infant was 1.7 times greater than for those with a BMI of 20–24 (Han, Mulla, Beyene, Liao, & McDonald, 2011). The consequences are substantial because 15–20% of mothers with BMI < 20 have low-birth-weight infants (Ehrenberg, Dierker, Milluzzi, & Mercer, 2003; Ogunyemi, Hullet, Leeper, & Risk, 1998). In young women with BMIs less than 18.5, which would include half of Playboy Playmates (Lassek & Gaulin, 2016), low-birth-weight rates can exceed 50% (Rao et al., 2001).
Another study investigated the relationship between fetal growth and prepregnancy weight, which is highly correlated (r = .94) with prepregnancy BMI. The risk of retarded fetal growth and prematurity was 3 times higher in mothers weighing less than 50 kg compared with those weighing 73 kg or more (Wen et al., 1990). Children of mothers with lower prepregnancy weights are also smaller and lighter at 7 years of age (Garn & Keating, 1980).
There may also be intergenerational effects: Women who weighed less at birth have more difficulty conceiving (Wildenschild et al., 2015) and are more likely to have poorer pregnancy outcomes when they have children (Hackman, Emanuel, van Belle, & Daling, 1983), as well as shorter life spans (Baker, Olsen, & Sorensen, 2008).
The lower birth weights and increased prematurity associated with lower maternal BMIs result in higher infant death rates, even with modern pediatric care (Baqui et al., 1994; Cogswell & Yip, 1995; Tennant, Rankin, & Bell, 2011). For example, a 2001 study in England found that the mothers with the lowest infant mortality had a prepregnancy BMI of 23, whereas mothers with prepregnancy BMIs < 18.5 had infant mortality rates more than twice as high (Tennant et al., 2011). Low-birth-weight infants are much more likely to die during childhood than normal-weight infants (McCormick, 1985), especially in poorly nourished populations (Puffer & Serano, 1973).
In summary, the available evidence does not support the idea that low WHRs and BMIs predict higher fertility or positive reproductive outcomes. On the contrary, these studies (including some of those often cited as evidence in favor of the health-and-fertility hypothesis) support the view that BMI and WHR are subject to stabilizing selection in well-nourished populations: Mean or modal values are associated with maximal fertility. In less well-nourished subsistence populations, fertility and child survival outcomes may well generate positive directional selection across the entire range of actual BMI and waist size. Under either of these circumstances, it is difficult to explain a strong male preference for low female BMIs and WHRs based on observed patterns of fertility.
New Tests of BMI and Fertility
To supplement the substantial published evidence against the fertility hypothesis, we offer three new tests in large samples of American women: the relationship between youth BMI with subsequent parity and the age of menarche and menopause in a sample of women with limited access to oral contraceptives and the relationship between prepregnancy BMI and pregnancy outcomes for 3.1 million births. We make the following predictions:
Method
Relationship of Minimum BMI After Age 18 to Achieved Fertility (Prediction 1)
From the first National Health and Nutrition Examination Survey conducted in 1971–1975 (NHANES I), we selected the 3,164 American women over age 44 who had reported their total number of live births and all relevant predictors (below). Their youth BMI was calculated from their self-reported lowest weight after age 18 and their current stature. For most women, the lowest weight occurred between ages 18 and 22.
To explore whether BMI early in the reproductive career might be a unique predictor of eventual fertility, we used multiple regression with total live births as the dependent variable and youth BMI, current age, ever-married status, years of education, family income, use of oral contraceptives, race (White, Black, and Other treated as three dummy variables), and age at minimum BMI as potential predictors.
In addition, regression was used to calculate the number of residual live births after controlling for the significant covariates from the previous regression. We then explored whether women who had BMIs in the attractive range (<20) had more residual live births than women with higher BMIs, as might be expected if young women in this range would eventually achieve higher fertility.
Some women past reproductive age who have been married and have no children may have experienced difficulty conceiving, and this outcome could also be related to youth BMI. Among 2,910 ever-married women over age 44 in the NHANES I, 396 had no live births. The youth BMI for this zero-parity group was compared with the youth BMI for women with one or more live births and the relationship to youth BMI was determined by logistic regression, controlling for the original set of covariates.
Relationship of Minimum BMI After Age 18 With Age at Menarche and Menopause (Prediction 2)
The NHANES I sample (1971–1975) was also used to estimate the relationship of youth BMI to the age at menarche in 7,757 postmenarcheal women, to age at menopause in 2,965 postmenopausal women, and to their difference (reproductive span) in 2,926 postmenopausal women. In separate regressions—one for each of the three life history variables—we controlled for current age, age at minimum weight, race, family income, years of education (except in the age-at-menarche regression), and parity.
Risk of Pregnancy Complications in Relation to Prepregnancy BMI (Prediction 3)
Natality data from U.S. birth certificates for 3,122,133 singleton births in 2013 were used to determine the relationship of prepregnancy BMI to the occurrence of low birth weight and preterm delivery (<37 weeks gestation). In this data set, control variables included maternal age, race (White, Black, Native American, and Asian), and Hispanic ethnicity treated as a categorical variables, weight gain (kg) per month of gestation, cigarette smoking, and years of education. Prepregnancy BMI was calculated from maternal stature and self-reported prepregnancy weight as recorded on the birth certificate. Logistic regression was used for analysis with age groups and BMI treated as categorical variables with BMI groups of <20, 20–24, 25–29, and with 30+ used as the reference level.
Results
Prediction 1: In a large sample of American women past reproductive age, those who had higher BMIs as young women will have more children than those who had lower BMIs as young women, controlling for other relevant variables.
Higher youth BMIs predicted higher rather than lower fertility in a sample of 3,164 American women over 44 years of age in the NHANES I. Women’s lowest BMI after age 18 was positively correlated with their total number of live births (r = +.078, p < .001). This effect could be spurious, due to other correlated variables. However, as shown in Table 2, in regression with current age, race, years of education, ever-married status, age at lowest weight after age 18, oral contraceptive use, and family income, youth BMI was still a significant positive predictor (β = +.057, p = .001) of numbers of live births. Of these 3,164 women, who were over 44 years of age when sampled in 1971–1975, only 3.5% had ever used oral contraceptives, and oral contraceptive use was not a significant predictor of parity when added to the regression. For 7,212 women aged 14–49, current BMI was also positively related to the number of live births (β = +.097, p < .001), with the same control variables.
Significant Predictors of Numbers of Live Births in 3,164 American Women > 44 Years (National Health and Nutrition Examination Survey I, 1971−1975) Based on Linear Regression.

Note. Three additional variables—age at minimum weight, family income, and use of oral contraceptives—were not significant predictors. BMI = body mass index.
Table 3 shows the number of residual live births, grouped by youth BMI, after adjustment for age, education, marital status, and race. Residual live births were highest in those with youth BMIs of 25–29, and women with youth BMIs less than 20 had significantly fewer residual live births than women with higher BMIs. The number of residual live births adjusted for age, education, marital status, and race was −0.160 ± 2.28 for youth BMIs < 20 versus 0.089 ± 2.67 for youth BMIs of 20 or more (t = 2.83, p = .005).
Residual Live Births in Relation to Youth BMI Groups, Adjusted for Current Age, Years of Education, Ever-Married Status, and Race in 3,164 American Women > 44 Years, National Health and Nutrition Examination Survey I, 1971–1975.

Note. BMI = body mass index.
Finally, youth BMI failed to predict which women over 44 would be childless in the NHANES I sample. The youth BMI of the 396 women with no children (21.02 ± 3.89) was not significantly different from the youth BMI of the 2,514 women with children (20.84 ± 3.27, p = .329). Moreover, in a logistic regression with age, education, family income, marital status, and race as covariates, youth BMI was not a significant predictor of having any children (p = .867).
Prediction 2: In a large sample of American women, youth BMI will be negatively related to the age at menarche and positively related to the age at menopause and reproductive span.
Youth BMI was negatively related to the age of menarche (r = −.095) and positively related to the age of menopause (r = .104) and to their difference (r = .129, all p < .001). The mean age of menarche in women with a youth BMI less than 20 was 13.10 ± 1.59 versus 12.84 ± 1.67 in those with 20+ (F = 2.52, p < .001), while the mean age of menopause was 44.34 ± 7.93 versus 45.74 ± 7.35 (F = 16.7, p < .001). Reproductive span was 30.84 ± 7.86 versus 32.56 ± 7.39 years (F = 9.22, p < .001).
Table 4 shows significant multiple regression results controlling for current age, age at minimum weight, family income, education, race, and parity (for menopause and reproductive span). Women with higher youth BMIs had significantly earlier menarche, later menopause, and a longer reproductive span.
Significant Predictors of Age at Menarche, Age at Menopause, and Reproductive Span in Females in National Health and Nutrition Examination Survey I Sample, 1971–1974, Controlling for Current Age, Age at Minimum Weight, Race, Family Income, Years of Education, and Parity.
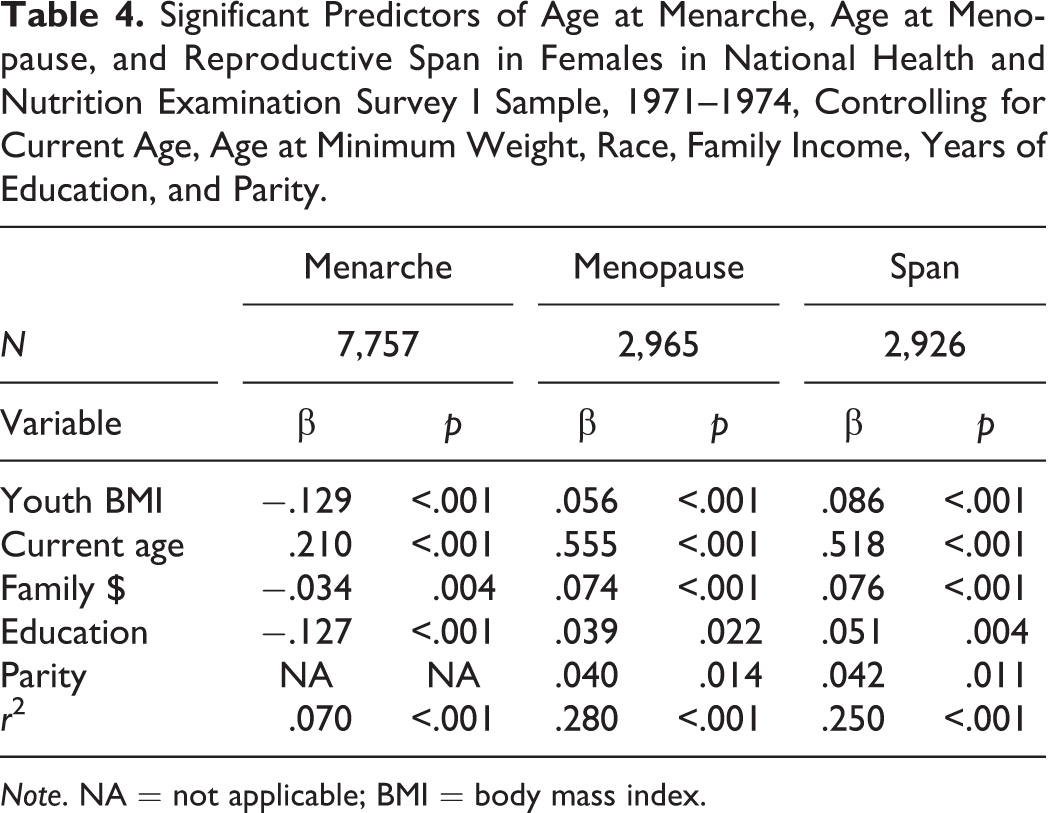
Note. NA = not applicable; BMI = body mass index.
As found in other studies (see above), higher current BMIs predicted older age and higher parity. In 6,926 women aged 15–49 from the NHANES I sample, current BMI was positively correlated with both age (r = .226) and parity (r = .255, p < .001). The mean BMI for those 15–19 was 22.11 ± 4.57 versus 24.51 ± 5.65 for those aged 20–49 (F = 48.59, p < .001). When regressed together, both age (β = .125) and parity (β = .188) predicted BMI (r
2 = .076).
Prediction 3: American women giving birth to their first child who have prepregnancy BMIs < 20 will have a greater risk of giving birth to preterm and low-birth-weight infants.
To avoid confounds associated with multiple births, the 2013 U.S. Natality data set was restricted to the 3,122,133 women with singleton births. In this group, mother’s prepregnancy BMI was positively related to infant birth weight (r = .089, p < .001), and women with lower BMIs were at increased risk of producing low-birth-weight infants and of preterm delivery. The percentage of low-birth-weight deliveries for mothers with BMIs < 20 was 9.2% versus 5.8% for BMIs of 20+, while the risk of preterm neonates was 10.7% versus 9.3%, respectively (z = 69.5 and 24.3, both ps < .001).
Table 5 shows the results of two multiple logistic regressions predicting low birth weight or preterm delivery—with maternal age-groups, race categories, Hispanic ethnicity, years of education, weight gain per week of gestation, and cigarette smoking used as predictors along with prepregnancy BMI. Women with BMI < 20 were at much greater risk of producing a low-birth-weight infant and at increased risk of preterm delivery compared to those with BMIs of 20 or more. Using the same covariates with linear regression, BMI was positively related to birth weight (β = .134, p < .001); heavier mothers had heavier newborns.
Odds Ratios (From Multiple Logistic Regression) for Low Birth Weight and Preterm Delivery in Relation to a Prepregnancy BMI, Maternal Age, Race/Ethnicity, Weight Gain (kg) per Week of Gestation, Cigarette Smoking, and Years of Education, With 95% Confidence Intervals (CIs), in Mothers With Singleton Newborns in the United States, 2013.
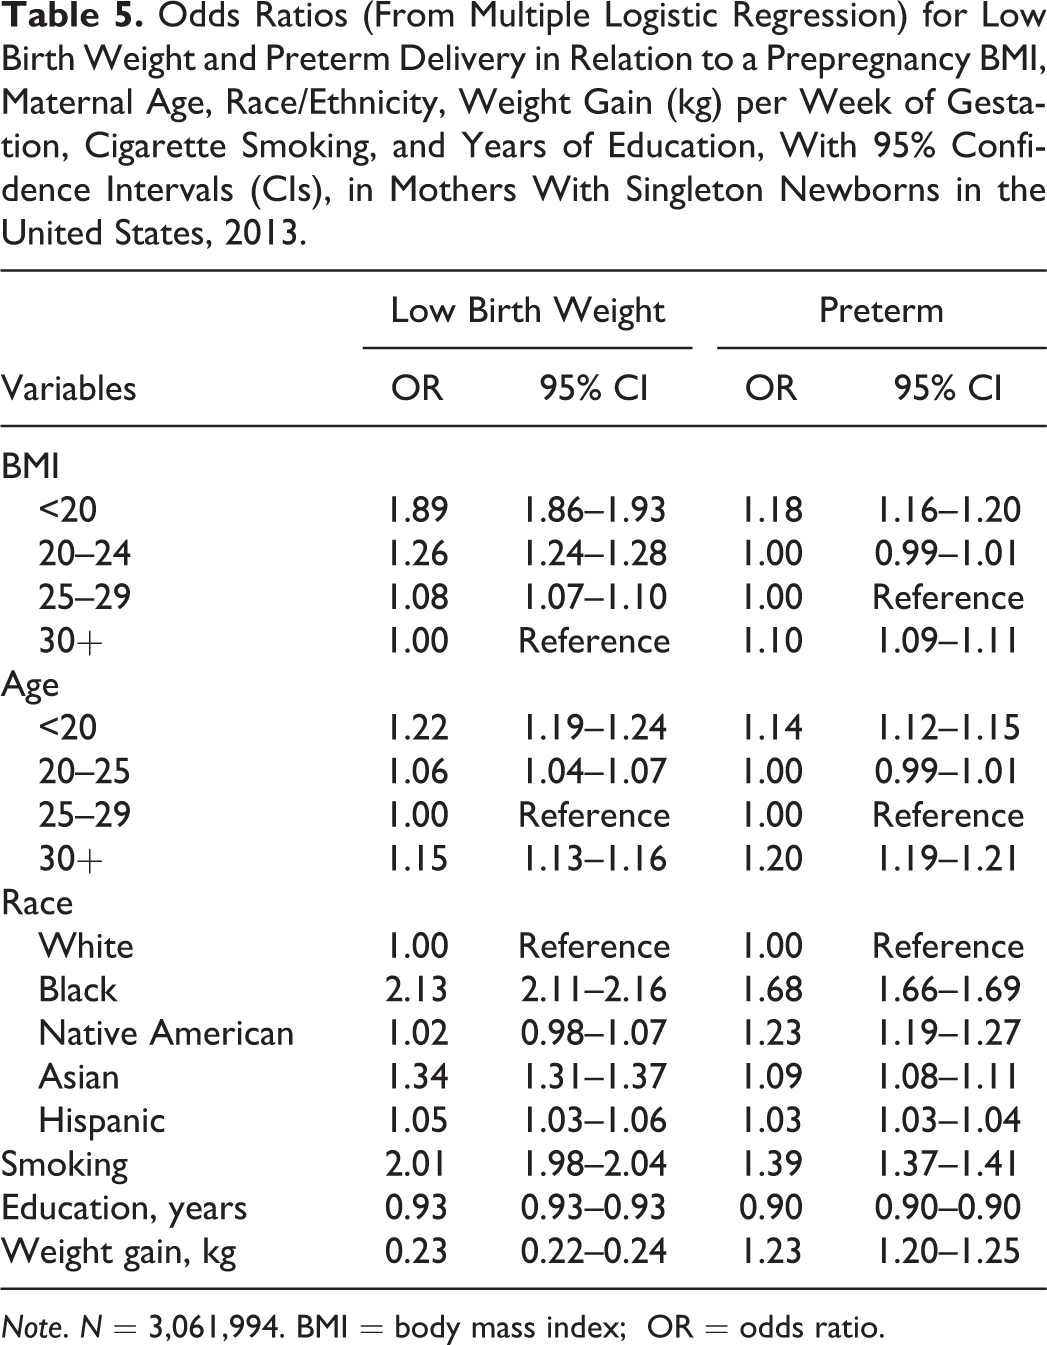
Note. N = 3,061,994. BMI = body mass index; OR = odds ratio.
Since younger mothers had a greater risk of producing a low-birth-weight infant, lower BMIs in younger women and higher BMIs in older women (who are less likely to have low-birth-weight infants) could account for much of the overall relationship between BMI and low-birth-weight outcomes. However, as illustrated in Figure 2, women with BMIs < 20 are substantially more likely to produce a low-birth-weight infant in every age-group.

Relationship of mean low-birth-weight % to body mass index (BMI) and maternal age in singleton births, United States, 2013. On the BMI axis, the data points are located at the midpoint of the grid lines. On the age axis, the data points are located on the grid lines (i.e., values for age <20 lie along the back wall of the graph).
Discussion
A detailed review of relevant studies found none supporting the view that the low WHRs and BMIs men find most attractive in well-nourished populations indicate better fertility. Instead, in all studies showing a statistically significant effect, these attractive body shapes are associated with low fertility. This applies to all of the key elements of female reproductive success: reproductive span, fecundability, live births, and infant survival. These findings are consistent with studies in subsistence populations which consistently show that fertility and the number of offspring surviving childhood increase linearly with increasing BMI.
New data presented here show that, contrary to the prevailing “fertility hypothesis”—but consistent with other studies (Dawson et al., 2013; Jacobsen et al., 2013; Jokela et al., 2007, 2008)—low BMIs in young American women predicted lower rather than higher lifetime fertility: As predicted, women with low BMIs in early adulthood had fewer subsequent live births than those with higher youth BMIs. This was true regardless of whether live births were adjusted for age, education, family income, marital status, oral contraceptive use, and race, for age alone, or unadjusted. Low BMI early in the reproductive period—when mateships tend to be formed—was a significant negative, not positive, predictor of eventual reproductive success. There was no relationship between youth BMI and nulliparity.
It might be argued that low BMIs are preferred not because they predict higher future fertility but because they reflect higher achieved fertility. However, in well-nourished populations, BMI increases with parity (as found in the NHANES I sample). Thus, lower current BMIs reflect lower achieved fertility. In other words, this version of the fertility hypothesis also fails to fit the data.
The positive relationship of youth BMI to parity may be related to the earlier age at menarche and later age at menopause in women with higher youth BMIs in our sample, as also found in other studies (Ayatollahi et al., 2002; Cagas & Riley, 1970; Kaplowitz et al., 2001; Mandel et al., 2004; Morabia & Costanza, 1998; Mul et al., 2001; Oettle & Higginson, 1961; Parazzini & PMIS Group, 2007; Zacharias & Wurtman, 1969).
Not only do young women with higher BMIs go on to have more children, their children have attributes that make them more likely to survive. The risk of having a low-birth-weight or preterm infant (who are at higher risk of infant mortality) was substantially elevated in mothers with prepregnancy BMI < 20.
Even with modern neonatal intensive care, low-birth-weight and preterm infants are less likely to survive infancy. In the 2013 birth cohort, low-birth-weight infants were 31 times more likely to die in their first year than normal-weight infants, and preterm infants were 18 times more likely to die than full-term infants. The death rate would be much higher were modern, specialized care not available (i.e., during much of human evolution), and any tendency to produce infants with shorter gestations and/or low birth weights presumably would have had a serious impact on women’s reproductive success in the past, as suggested by the positive relationship between BMI and reproductive success in subsistence populations.
The optimal maternal age range for birth weights above 2,500 g was 25–29, the same as the age range for peak fecundability (see Introduction). If men had evolved to prefer women with high fertility, they should prefer women with BMIs between 20 and 29 who are between 25 and 29 years old.
In a companion paper (Lassek & Gaulin, 2018), we have shown that the other half of the health-and-fertility hypothesis—that women with smaller waists and lower BMIs have better health—is also likely to be incorrect. However, better health was predicted by younger age.
But if the most attractive women do not have better health and fertility, why should selection have programmed men to find them attractive? One possibility arises from the observation that women’s BMI and WHR are reliable predictors of age. In well-nourished populations, WHR and BMI are lowest in adolescents and then increase monotonically. In subsistence populations in which men prefer higher than average BMIs, higher values also indicate a younger age, since BMI tends to decrease with age. Thus, well-nourished women with the small waists and low BMIs that men find most attractive are likely to be young but postpubertal and therefore to have high reproductive value (sensu; Fisher, 1930). Even though these younger women have reduced current fecundability and a decreased likelihood of infant survival, they have maximal long-term reproductive potential (Andrews, Lukazweski, Simmons, & Bleske-Recheck, 2017; Symons, 1979).
Limitations
Despite our use of appropriate search terms that yielded many studies relevant to the relationship between female anthropometric measures and fertility, there may be others that were missed. However, our methods should have discovered studies in a manner that was unbiased with respect to whether they supported or undermined the fertility hypothesis. With respect to most combinations of our dependent and independent measures, there are multiple studies that agree in contradicting the fertility hypothesis.
Our new analyses of the effects of waist size, WHR, and BMI on fertility, based on recent representative samples of American women, may not reflect conditions in the environment of evolutionary adaptiveness. However, (1) our new analyses do derive from the kind of Westernized population that has provided most of the evidence that allegedly supports the fertility hypothesis, (2) due to the availability of food and medical care, these populations should suffer fewer costs associated with low levels of female body fat, which should make it more difficult to reject the fertility hypothesis. It should also be noted that there is a general concordance between the results in these samples and data from subsistence populations.
The availability of modern contraception obviously has a profound impact on family size and the number of live births, but the population chosen for analysis (in Prediction 1) had very low access to and usage of oral contraception during their fertile years. Different rates of use of other methods of contraception should make it more difficult to discern the effects of youth BMI on fertility, so that effects detected here, controlling for a number of other variables related to fertility, may merit some consideration.
The analysis of youth BMI and age at menopause could be influenced by women whose menopause was due to surgery, since women with hysterectomies were not identified in the NHANES I database. However, there does not appear to be any known relationship between youth BMI and the likelihood of a hysterectomy.
The lowest weights after age 18 and prepregnancy weights were self-reported and also subject to the vagaries of recall; and although recalled weights correlate strongly with actual weights, they are subject to biases (Lassek & Gaulin, 2018; Must et al., 2002). The lowest weights after 18 also occurred at different ages, although most were within 5 years of age 18; to deal with this issue, the age of minimal weight was used as a covariate in the analyses. Also, youth BMIs were computed using current heights. However, there does not seem to be any reason why such factors should systematically skew the analysis of current health or the number of live births in ways that would systematically disadvantage the fertility hypothesis.
The 2013 U.S. natality data used to test Prediction 3 come from a population with high rates of overweight and obesity, and this could possibly influence the validity of the results. However, there is no apparent reason why overweight or obese mothers should have better outcomes in this population than in others, and the relationship found between BMI and low-birth-weight and prematurity is consistent with other studies in different samples. Mothers also tend to be older in recent samples than in the past, but this was addressed by controlling for age.
Conclusion
A detailed review and three new tests of the relationship of women’s WHRs and BMIs with elements of reproductive success failed to uncover any evidence that the anthropometric values that men find most attractive in well-nourished populations indicate enhanced fertility; instead, they show diminished fertility. These findings are congruent with studies in subsistence populations which show decreased reproductive success in women with lower BMIs. It may be time to consider other possible reasons for male preferences.
Footnotes
Declaration of Conflicting Interests
The author(s) declared no potential conflicts of interest with respect to the research, authorship, and/or publication of this article.
Funding
The author(s) disclosed receipt of the following financial support for the research, authorship, and/or publication of this article: The publication fee was paid by Todd Shackelford journal editor.