
Abstract
While waist/hip ratio (WHR) and body mass index (BMI) have been the most studied putative determinants of female bodily attractiveness, BMI is not directly observable, and few studies have considered the independent roles of waist and hip size. The range of attractiveness in many studies is also quite limited, with none of the stimuli rated as highly attractive. To explore the relationships of these anthropometric parameters with attractiveness across a much broader spectrum of attractiveness, we employ three quite different samples: a large sample of college women, a larger sample of Playboy Playmates of the Month than that has been previously examined, and a large pool of imaginary women (e.g., cartoon, video game, graphic novel characters) chosen as the “most attractive” by university students. Within-sample and between-sample comparisons agree in indicating that waist size is the key determinant of female bodily attractiveness and accounts for the relationship of both BMI and WHR with attractiveness, with between-sample effect sizes of 2.4–3.2. In contrast, hip size is much more similar across attractiveness groups and is unrelated to attractiveness when BMI or waist size is controlled.
Introduction
Over the past two decades, more than 150 studies have explored the correlates of female bodily attractiveness with waist/hip ratio (WHR) and body mass index (BMI) frequently claimed to be important determinants. There are, however, three limitations of these studies, which is useful to address: (1) BMI is not directly observable; its relationship to attractiveness must be mediated by particular visual cues. (2) While the relation of WHR to attractiveness has been extensively studied, few studies have investigated the individual contributions of its two components, waist and hip size, both of which are strongly correlated with BMI. (3) Most female stimuli rated for attractiveness have been drawn from normative samples representing a limited range of attractiveness and do not include images of highly attractive women. This study is intended to address these shortcomings by comparing three samples representing a wide range of attractiveness—college women, Playboy playmates, and imaginary women—and testing the relative importance of waist and hip size in addition to BMI and other anthropometric variables in judgments of female attractiveness.
WHR, BMI, and Attractiveness
Although there is variability in the features that individual men consider attractive, women with WHRs of .60 to .70 are more consistently rated as highly attractive by men, and women with WHRs higher than .85 are less consistently rated as attractive (e.g., Bleske-Rechek, Kolb, Steffes-Stern, Quigley, & Nelson, 2014; Dixson, Dixson, et al., 2010; Dixson, Dixson, Li, & Anderson, 2007; Furnham, Tan, & McManus, 1997; Henss, 1995, 2000; Singh, 1993a, 1993b, 1994; Singh & Luis, 1995; Sugiyama, 2005; Thornhill & Grammer, 1999). However, very few studies have considered the independent contributions of waist and hip size to these attractiveness judgments.
Men in well-nourished populations also show a strong preference for low BMIs of 15–20, and because women with low WHRs but higher BMIs tend to be judged as less attractive (Singh, 1993a, 1993b), BMI has been found to be the stronger predictor when the two are considered together (e.g., Bateson, Tovee, George, Gouws, & Cornelissen, 2014; Crossley, Cornelissen, & Tovee, 2012; Fan, Dai, Qian, Chau, & Liu, 2007; Pokrywka, Cabric, & Krakowiak, 2006; Richmond, Austin, Walls, & Subramanian, 2012; Stephen & Perera, 2014; Tovee & Corneilissen, 1999, 2001). However, since BMI cannot be directly observed and thus cannot itself be the basis for perceived attractiveness, some visible correlates of BMI other than WHR must account for BMI’s apparently stronger relationship with attractiveness.
In women with comparable BMIs, smaller WHRs are preferred, as is shown most directly by studies rating the same women before and after the surgery to transfer fat from the waist to the buttocks; the lower, postoperative WHRs are judged more attractive (Singh & Randall, 2007), and this result seems to be cross-culturally valid (Dixson, Sagata, Linklater, & Dixson, 2010; Singh, Dixson, Jessop, Morgan, & Dixson, 2010).
In subsistence populations, somewhat higher WHRs may be preferred, which may relate to a shift in the optimal balance between estrogens and androgens in women (Cashdan, 2008). However, even in these contexts, men prefer low WHRs that approach (Sugiyama, 2004, 2005) or are below the locally observed minimum WHR (Dixson, Sagata, et al., 2010; Marlowe, Apicella, & Reed, 2005; Singh et al., 2010; Sorokowski, Koscinski, Sorokowska, & Huanca, 2014; Sorokowski & Sorokowska, 2012).
In contrast, men in subsistence groups generally prefer higher female BMIs. In such populations, typical BMIs are low and fertility increases directly with BMI (Brush, Boyce, & Harrison, 1983; Marlowe, 2004; Mueller & Whitehead, 1979); thus, in these populations, a male preference for correlates of higher female BMIs is likely to be adaptive.
Waist Size and Attractiveness
Because BMI cannot be directly observed, any preference for lower BMIs must depend on visual cues that reliably correlate with BMI. While BMI’s correlation with WHR is fairly high (r = .62; Cornelissen, Tovee, & Bateson, 2009), BMI is much more strongly correlated with waist circumference (r = .93), waist/stature ratio (r = .94), and hip circumference (r = .92; Flegal et al., 2009; Freedman et al., 2012) than it is with WHR. This raises the question of whether waist size and hip size considered separately from WHR may explain some of the relationship of BMI with attractiveness.
In the relatively few studies that have considered the possible independent role of waist size, it has been a strong predictor of attractiveness (Brody & Weiss, 2013; Brooks, Shelly, Fan, Zhai, & Chau, 2010; Brooks, Shelly, Jordan, & Dixson, 2015; Crossley et al., 2012; Forestell, Humphrey, & Stewart, 2004; Gründl, Eisenmann-Klein, & Prantl, 2009; Horvath, 1979; Pokrykwa, Cabric, & Krakowiak, 2006; Prantl & Grundl, 2011; Rilling, Kaufman, Smith, Worthman, & Patel, 2008; Rozmus-Wrzesinska & Pawlowski, 2005). In the single prior study that directly compared BMI and waist size as predictors of attractiveness, waist size was the stronger factor (Rilling et al., 2008).
Of particular relevance is an innovative recent study that used evolving female avatars to mimic evolution driven by mating preferences (Brooks et al., 2015). In each of eight “generations,” human participants rated a pool of 120 avatars for attractiveness and the 60 in the more attractive half “bred” two daughters each, slightly mutated along 24 bodily dimensions, as input for the next generation of selection. An analysis of changes in the avatar lineages (many of which went extinct) across the generations showed that the dimension subject to the strongest selection for attractiveness was waist circumference.
Although possible links between WHR and health are frequently cited in attractiveness research, a number of studies have found that the waist/stature ratio is a better predictor of health than other anthropometric measures (reviewed in Ashwell, Gunn, & Gibson, 2012), with a lower waist/stature associated with better health outcomes.
Hip Size and Attractiveness
While hip circumference is also a major component of WHR, its specific relationship with attractiveness has been the subject of only a small number of studies. Because it is highly correlated (.92) with BMI in women (Freedman et al., 2012), it might be expected that larger hip sizes would be deemed less attractive. Supporting this, a negative relationship of hip size with attractiveness has been found in three studies (Rilling et al., 2008; Singh & Young, 1995; Tassinary & Hansen, 1998). However, other studies have found no relationship (Grundl, Eisenmann-Klein, & Prantl, 2009; Pokrykwa et al., 2006) or a preference for medium-sized hips (Forestell et al., 2004; Krantz, Ballard, & Scher, 1997; Prantl & Grundl, 2011).
These inconsistencies may relate to conflicting selective pressures. Although its strong positive relationship with BMI is likely to make larger hip sizes less attractive in Westernized populations, three potential fitness benefits might be expected to make a relatively larger hip size more attractive: (1) Gluteal fat is a resource for pregnancy and lactation which is depleted by successive pregnancies even in well-nourished women (Lassek & Gaulin, 2006); (2) a wider pelvis reduces the risk of obstructed labor, which is particularly high for first pregnancies (Abitbol, 1996; Gallup & Frederick, 2010); and (3) in sharp contrast with waist size, both hip size and gluteal fat have a strong positive relationship with health measures (Heitmann, Frederiksen, & Lissner, 2004; Lissner, Björkelund, Heitmann, Seidell, & Bengtsson, 2001; Manolopoulos, Karpe, & Frayn, 2010). Because of these potential advantages, it seems likely that hip size would not be negatively related to attractiveness if BMI were controlled.
The Limited Range of Attractiveness Under Study
In addition to neglecting the possible separate roles of waist and hip size, most prior studies have failed to include very attractive women as stimuli. Despite being instructed to use the full rating range, raters consistently score the typical stimuli in the bottom 2/3 of the rating scale (e.g., Bleske-Rechek et al., 2014; Fan et al., 2007; Tovee & Corneilissen, 1999, 2001).
To address this limitation, some studies have investigated the characteristics of women generally considered highly attractive to men, such as beauty pageant contestants (Hong, Park, Lee, & Suh, 2009; Pokrywka et al., 2006; Singh, 1993a), Playboy Playmates (Katzmarzyk & Davis, 2001; Singh, 1993a; Tovee, Mason, Emery, Mccluskey, & Cohen-Tovee, 1997; Voracek & Fisher, 2002, 2006), and adult film actresses (Voracek & Fisher, 2006). Since men must often pay to view images of these women, profit motives incentivize their selection for high attractiveness. Although drawn from different pools of presumably highly attractive women, the samples in these studies have a virtually identical mean BMI (18.5), WHR (0.68), and stature (169 cm), despite some values being self-reported and others (in beauty contestants) measured. Although these studies help to rectify the paucity of highly attractive women in samples of images drawn from or based on the general population, only one study has directly compared such women (beauty contestants) with more typical young women (Pokrywka et al., 2006).
Even fewer studies have considered the characteristics of imaginary women. Almost all studies of female attractiveness have relied on stimulus images based on drawings or photographs of real women and thus are constrained by the range of anatomical variation that characterizes natural populations of human females. But there is another potential source of stimuli depicting highly attractive women that is not so constrained: images created by artists seeking to represent the apotheosis of female beauty in paintings, sculptures, drawings, graphic novels, computer games, or animated films.
Singh (2006) measured the WHRs of 286 ancient sculptures from India, Egypt, Africa, and Greece, though which of these were based on real women and which were imaginary are unknown. In the Greek and Egyptian samples, the modal female WHR was 0.7, but in the Indian and African samples, it was 0.5 and 0.6, respectively. In all cases, half or more of the WHRs were below 0.7. Konecni and Cline (2001) analyzed the WHR in a random sample of fourteen 20th-century paintings of women and found a range of 0.59–0.86, with a mean of 0.69.
Two studies by Viren Swami and coauthors investigated WHR in paintings and sculptures. One was limited to the WHRs of the full-figured women depicted in the paintings of Peter Paul Rubens (Swami, Gray, & Furnham, 2006), while in the second, participants rated the attractiveness of images (rather than women) in five paintings and five sculptures with digitally modified WHRs (Swami, Grant, Furnham, & McManus, 2007).
To assemble a contemporary data set of imaginary women, we asked participants to provide an image of the “most attractive imaginary woman” they could think of. There is no reason to expect that every (painted, drawn, etc.) imaginary woman will fall outside the range of variation seen in actual women. Instead, each artist will pursue his or her vision—involving some unknown mix of creativity, preferences, profit motivation, and the like—and the collective result will be a large and diverse pool of images. Thus, in our study, artists play a role analogous to mutation’s role in evolution, providing grist for selection’s mill. Like selection, our participants cull this pool when they choose their most attractive. One can then ask in what ways this selected subset of imaginary women is more or less typical of actual women.
Using imaginary women to help extend the range of attractiveness, we compare this sample with young female college undergraduates (hereafter college women) and Playboy Playmates of the Month (hereafter Playmates). These three samples arguably constitute a spectrum of attractiveness that can be used to clarify which anthropometric traits differ most with attractiveness. The college women are assumed to represent the group with the lowest mean bodily attractiveness (and our data support this assumption). Playmates are presumed to represent the most attractive actually occurring female bodies, and our analyses (below) support this assumption. If imaginary women differ from Playmates, the former may be assumed to be even more attractive, because participants could have selected as most attractive those imaginary women who most closely resembled Playmates.
In addition to these between-group differences in attractiveness, we have within-group measures of relative attractiveness for more than 100 individuals in the college women sample (based on ratings) and for all of the images in the imaginary women sample (based on the number of students choosing each particular imaginary woman). Thus, within- and between-sample comparisons provide two independent ways of testing the influence of BMI, WHR, waist size, and hip size on attractiveness. On a more exploratory basis, additional body measurements in the college women sample also allow us to identify other anthropometric measures that may be related to attractiveness.
Hypotheses and Predictions
The relatively few studies on waist size treated separately suggest that a small waist may be the key determinant of female attractiveness. Thus,
Because of the conflicting selection pressures discussed above, the relationship of hip size to attractiveness is likely to be more complex. While its relationship with BMI should make larger hip sizes less attractive, this should be counterbalanced by the potential reproductive advantages of a larger pelvis and increased gluteofemoral fat. Thus,
Material and Method
We compare anthropometric measures in three populations who are likely to differ in mean attractiveness: a sample of 173 typical (unscreened) University of California Santa Barbara (UCSB) undergraduate women (106 of whom were subsequently rated for attractiveness); a sample of 673 Playboy Playmates of the Month from 1953 through 2013; and a sample of 490 images of imaginary women chosen as the most attractive by UCSB undergraduates.
College Women Sample
To capture the range of variation in female body shape in young nulliparous women, stature, weight, minimum waist circumference, maximal bust and hip circumferences, and underbust, mid-arm, and mid-thigh circumferences were measured in a standardized way (see National Center for Health Statistics, 1988) in 173 volunteers (mean age = 19.5 ± 1.4) who wore tight-fitting athletic clothing to the session. Ratios of circumferences to stature were calculated to facilitate comparisons since these more accurately reflect anthropometric differences than simple circumferences (Ho, Lam, & Janus, 2003).
Each subject was also digitally photographed from the front in a standing position (roughly the same posture as the imaginary women, see below). Photographic conditions were standardized (fixed angle, distance, camera, and lens), and photographs were taken at the same session and in the same clothing as the anthropometric measures. All anthropometric data collection was carried out in a private area by trained female research assistants, and all phases of the research were approved by the UCSB Human Subjects Review Board.
Each of the 173 photographic images was printed on 8.5 × 11′′ paper. From these photos, digital calipers were used to measure stature, minimal waist width, and maximal hip width. For each image, each variable was measured on two separate occasions, logged on separate data sheets, and subsequently entered into a single spreadsheet. At that time, any discrepancy greater than 1 mm triggered a third measurement. On that basis, the most discrepant measurement was deleted. That review process left two valid measures for each variable for each image, and these two were averaged to obtain the values used in the subsequent analysis. Figure 1 shows a typical image (modified to preserve privacy) and the two-dimensional measurements made.

Typical stimulus item used for attractiveness rating of the college women sample: (a) shows the pose, clothing, and facial masking as presented but is intentionally blurred for publication to prevent recognition; inset (b) shows the level of detail in the actual stimuli used for rating. Red lines show two-dimensional measurements: S = stature, W = waist, H = hip.
A subsample—106 of the 173 photographed women—gave additional consent for their photographs to be shown to raters on the conditions that their faces were hidden by an opaque oval and that the ratings were not collected on their home campus. These 106 face-obscured photographs were rated for bodily attractiveness by 31 raters (18 males) between the ages of 20 and 69 (mean = 27.3). These 31 raters were opportunistically recruited by undergraduate research assistants when they were away from campus during school holidays. Photos were arranged in a pseudorandom order for each rater by randomly cutting the pack of photos to determine the starting point.
For calibration and framing, each rater was first asked to name a well-known woman whom he or she considered to be a “10” on a 1–10 scale of bodily attractiveness and then what attractiveness rating he or she would give to a “typical Playboy Playmate.” This methodology was intended both to anchor and to frame subsequent ratings as suggested by other studies (e.g., Kenrick & Guiterres, 1980). Each of the 106 college women’s photos was then rated on that same 1–10 scale.
We calculated the correlation between the 106 attractiveness scores given by each individual rater and the mean 106 attractiveness scores given by all other raters. Using that method, the scores of two raters (a 51-year-old female and a 63-year-old male) were not positively and significantly correlated with those of the remaining raters, suggesting these two raters were using unusual criteria. Hence, those two raters’ data were removed, and mean attractiveness scores for each of the 106 college women were computed based on the remaining 29 raters (though conclusions about the determinants of attractiveness are not significantly different if the two outlier raters are included in computing each college woman’s mean attractiveness). Based on these 29 raters, Cronbach’s α was .99, indicating that these raters, male and female, strongly agreed on the relative attractiveness of the various college women, allowing us to use those ratings as a yardstick to explore what anthropometric variables were most strongly correlated with attractiveness. A high degree of consistency among raters on bodily attractiveness judgments is typical and obviates the need for large numbers of raters to establish attractiveness rankings (e.g., Bleske-Rechek et al., 2014).
Based on attractiveness scores, the four quartiles of attractiveness were identified; in some analyses, the top attractiveness quartile is contrasted with the three lower quartiles of the same sample.
Playboy Playmate Sample
Reported stature and weight as well as bust, waist, and hip circumferences were tabulated for 665 Playboy Playmates of the Month from 1953 to 2013 using data posted on the Playboy website (www.playboy.com), and BMI and ratios to stature were calculated. This is a larger sample of these women than that has been previously evaluated in scientific studies of attractiveness.
Unfortunately, Playmates are consistently photographed in poses that do not allow reliable two-dimensional measurements of waist and hip widths and in poses and clothing which do not lend themselves to direct comparison with college women. In lieu of rating such a photograph of a Playmate, raters were asked to give a rating for a typical Playboy Playmate, as detailed above. One male and one female rater declined to do so. Thus, (only) in comparing the attractiveness of college women and Playmates, the data were limited to the 16 male and 11 female raters who rated a typical Playmate as well as the full college women sample.
Imaginary Women
Students in an introductory anthropology course at UCSB were offered extra credit on a take-home examination for providing a frontal image of “the most attractive imaginary woman (a character from a cartoon, comic strip, animated movie, video game, graphic novel, or anime) you can think of”; 490 students (195 males) provided such an image with most submitted images being of female characters in animated films, video games, or comics. Prior to data collection, the course had no content that would have biased the participants’ choices.
As for the college women, the relevant variables for the images of imaginary women were stature, minimum waist width, and maximum hip width; we used the same repeated measures technique we had applied to the college women’s photos (see above) to extract this information from the imaginary women’s images. Hip and waist widths were assessable from all 490 images. Stature could be obtained from the 342 of these images that were full-height (top of head to feet), limiting the calculation of the hip/stature and waist/stature ratios (and hence further analysis) to this subsample.
Different images of the same imaginary character (submitted by different participants) often yielded different ratios. Each submitted image was thus treated as a separate observation for statistical analysis. This had the advantage of giving more weight to the images of the more popular characters. However, the larger n and greater variance of the multiple images decreased effect sizes compared with the alternative of computing means for each imaginary woman by averaging the measures from all her photos and using these means as the cases. Thus, the approach used was conservative, in that it makes it more difficult to demonstrate significant group differences.
The 342 full-height images of imaginary women depicted 72 different women because many imaginary women were chosen by multiple participants. The number of students choosing each imaginary woman—her “popularity”—was used as an indicator of her relative attractiveness. Sixteen different imaginary women were each chosen by six or more students and comprised 79% of all full-height images chosen (266 of 342); this more popular group was compared with the less popular group and also used to represent imaginary women in comparisons with college women and Playmates.
Because there were both two-dimensional (2D) and three-dimensional (3D) measures for all 173 college women, regression could be used to develop equations for predicting 3D WHR, 3D waist/stature, and 3D hip/stature from their 2D components. These equations could then be used to estimate 3D measures for the imaginary women and thus allow comparisons with the Playmates, for whom only 3D measures are available. The predictive equations for 3D values with 95% confidence levels for coefficients and intercepts are:


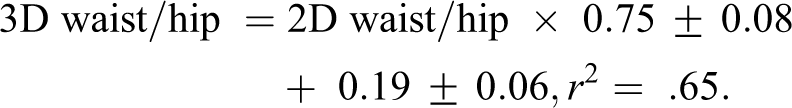
Table 1 shows the available measures for each of the three samples, including the regression-predicted variables.
Available Anthropometric Measures for the Three Samples.

Note. x = available data. WHR = waist/hip ratio; BMI = body mass index.
Results
Ordering of Samples by Attractiveness
Evidence suggests the appropriate attractiveness ranking for the three samples is, from lowest to highest, college women, Playmates, and imaginary women. Although the more attractive college women could have been given similar ratings to Playmates, the mean attractiveness rating given to a typical Playmate was 8.72 ± 1.03 (SD) by male raters and 7.73 ± 1.56 by female raters, compared with ratings of 6.96 ± 1.07 and 6.59 ± 1.37 (by male and female raters, respectively), for the top attractiveness quartile of college women. The effect size for the difference in ratings was 1.60 for males and 0.78 for females. A typical Playmate was also rated substantially higher than the single most attractive college woman, who was rated 7.65 ± 1.46 by males (d = 0.86) and 7.17 ± 1.11 by females (d = 0.42). None of the sex differences in ratings were significant. Since imaginary women were chosen for maximum attractiveness, if they differ substantially from Playmates in body measurements (see Prediction 1.3 below) that supports the idea that they are more attractive than Playmates.
Confirmed: In college women, several key variables were both highly correlated with each other (Table 2) and strongly related to attractiveness (Table 3). Simple bivariate regression (Table 4, Models 1–4) confirmed that waist/stature, BMI, WHR, and hip/stature were all strong negative predictors of attractiveness. However, when multiple regression was used to test variables simultaneously to assess their relative impact, waist/stature was the only significant predictor of attractiveness (Table 4, all remaining models).
Correlation Matrix for Key Variables in College Women.

Note. All p < .001. BMI = body mass index; WHR = waist/hip ratio.
Mean Values of Attractiveness Ratings (Scale of 1–10), Body (three dimension), and Image (two dimension). Measurements for the Full Sample of Attractiveness-Rated College Women and Separately by Quartiles of Attractiveness of That Sample.
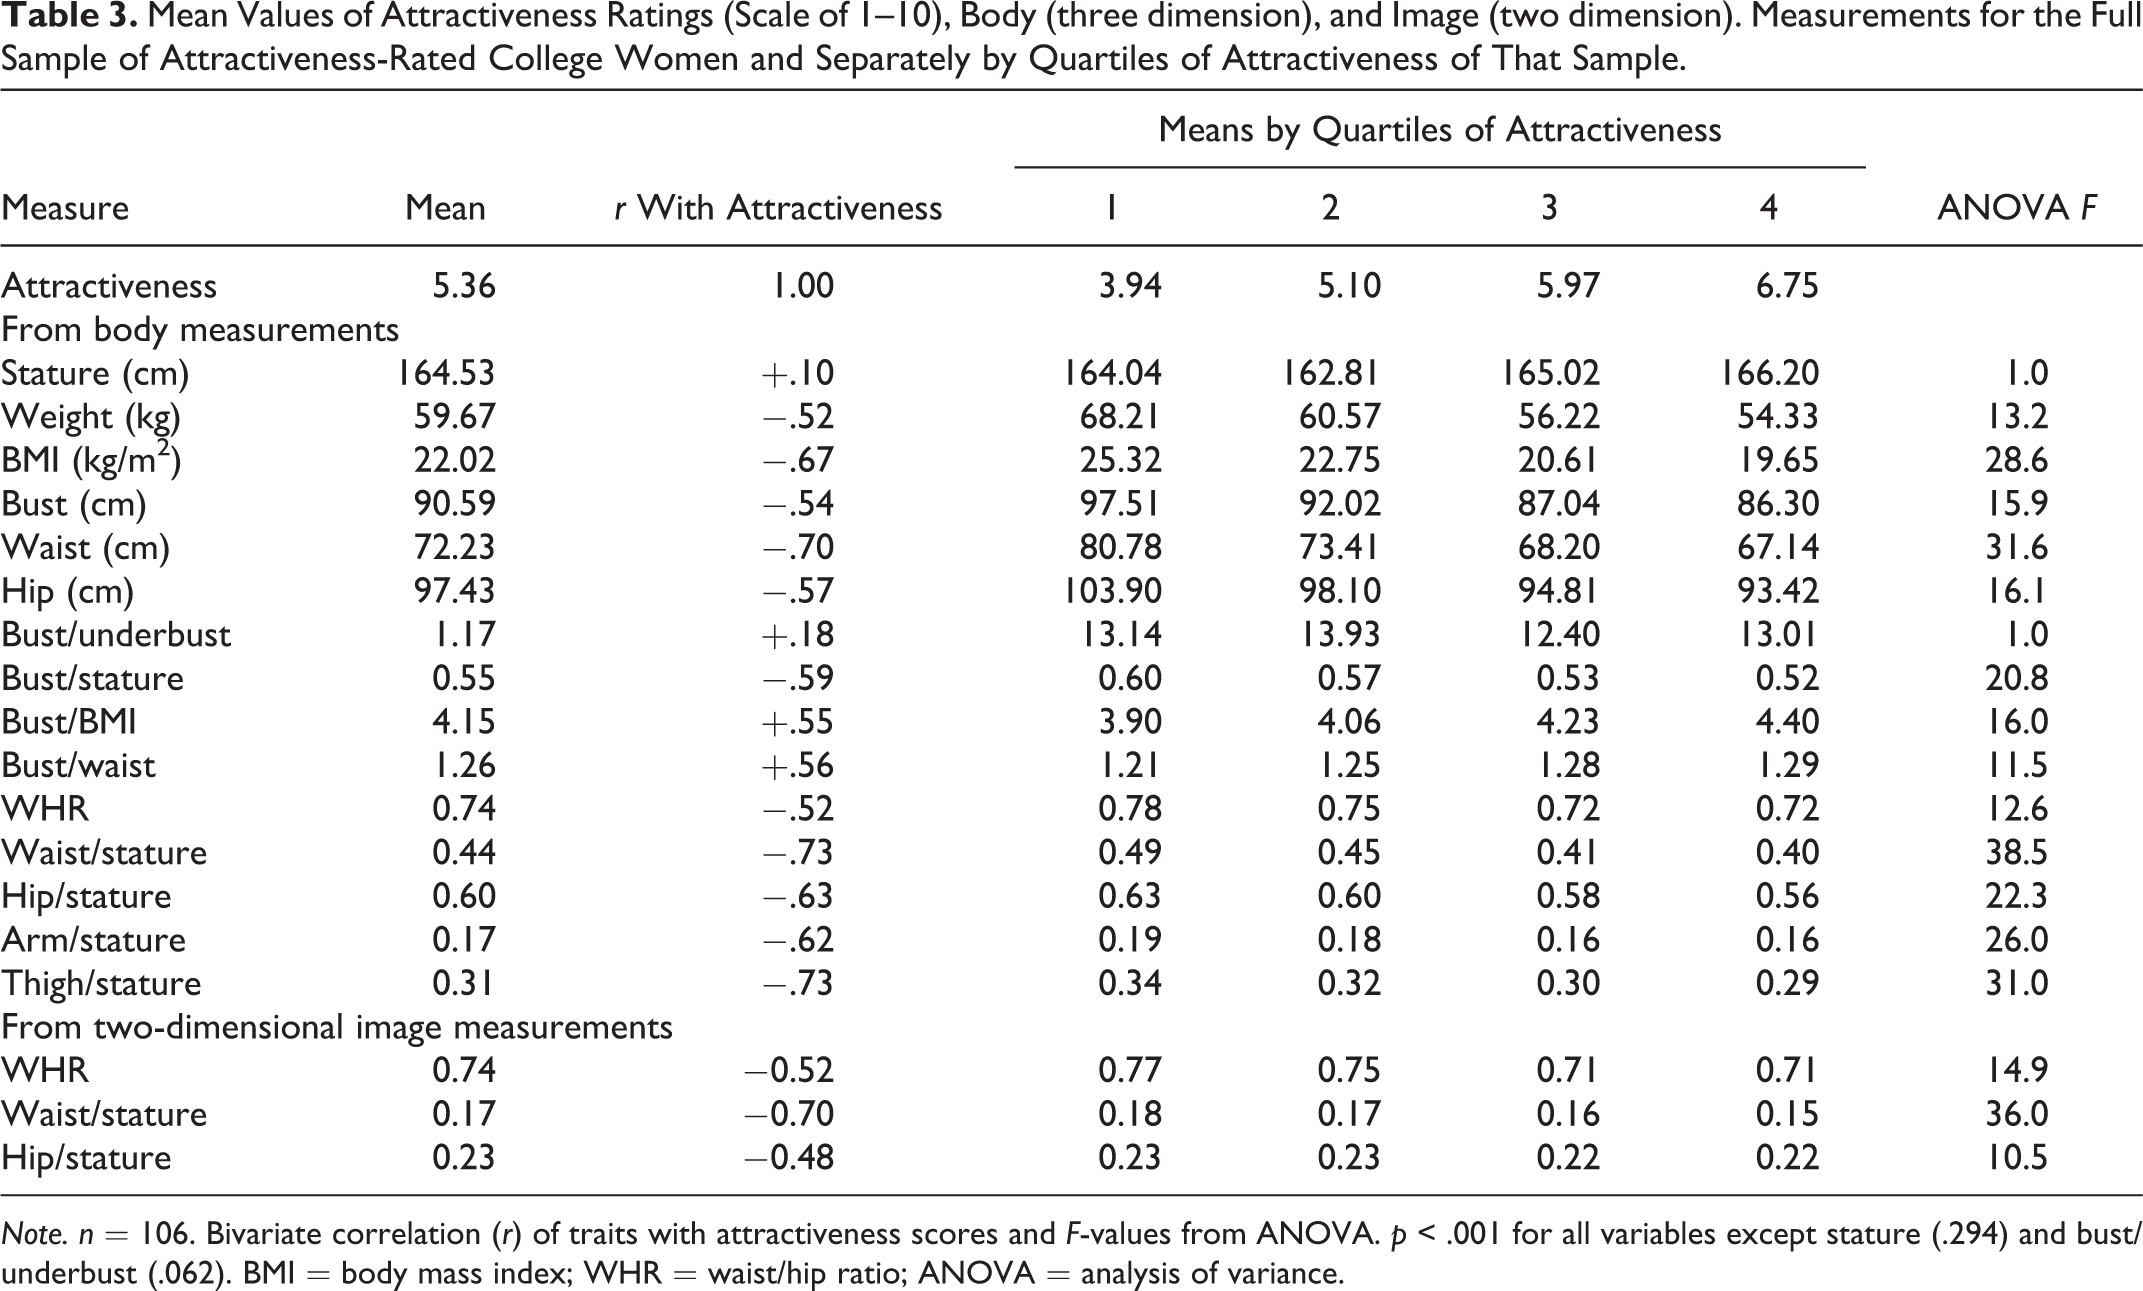
Note. n = 106. Bivariate correlation (r) of traits with attractiveness scores and F-values from ANOVA. p < .001 for all variables except stature (.294) and bust/underbust (.062). BMI = body mass index; WHR = waist/hip ratio; ANOVA = analysis of variance.
Regression Models Predicting Attractiveness From Three-Dimensional Body Measures of College Women, With β Coefficients and Amount of Variance Explained.

Note. n = 106. (In a model with all four variables, none are significant.). For all models, p < .001. WHR = waist/hip ratio; WSR = waist/stature ratio; HSR = hip/stature ratio.
Thus, although BMI was a stronger predictor of attractiveness than WHR (Table 4, Model 1 vs. 2), as suggested by much previous research, BMI was not a significant predictor when paired with waist/stature (Table 4, Model 6); adding BMI did not increase the amount of variance explained (Δr 2 = −.003; p = .646).
Similarly, although hip/stature was also strongly related to attractiveness (Tables 3 and 4), when paired with waist/stature, hip/stature was not a significant predictor (Table 4, Model 10) and did not improve the variance explained (Δr 2 = −.001; p = .422).
Waist/stature was also a much stronger predictor of attractiveness than was WHR (βs, −.79 vs. .08; p < .001), and the latter was not significant (Table 4, Model 8). Similarly, when waist/stature and WHR were tested together with BMI, only waist/stature was a significant predictor of attractiveness (Table 4, Model 11).
In all two-predictor models that included waist/stature (Table 4, Models 6, 8, and 10), it was the only significant predictor, and the slopes of the two predictors were significantly different (p < .001). Likewise, in all three-predictor models (Table 4, Models 11–13), only waist/stature was significant. When both BMI and hip/stature were added to a regression predicting attractiveness from waist/stature (Table 4, Model 12), only waist/stature was significant and there was no improvement in the amount of variance explained (Δr 2 = −.006; p = .515). A model with all four predictors produced no significant results presumably because of strong multicollinearity of the predictors (Table 2).
Figure 2a–d visualizes these various multivariate predictors of attractiveness for the college women sample of 106. The slope of waist/stature on attractiveness is much steeper than the slope of any paired predictor (Figure 2, Panels a, c, d). Panels a and b compare the predictive power of BMI versus waist/stature and BMI versus hip/stature. In Panel a, attractiveness changes much more steeply with waist/stature than with BMI, whereas in Panel b attractiveness changes more steeply with BMI than with hip/stature.

Three-dimensional plots showing the relationship of various predictors to attractiveness for the attractiveness-rated college women sample (n = 106). The x-axis is waist/stature except in Panel b.
As can be seen in the frequency distributions in Figure 3a, the waist/statures of the top attractiveness quartile of the college women sample all fall below the median of the remaining three quartiles of this same sample.

Frequency distribution of three-dimensional measurements in four groups: imaginary women (n = 266), playmates (n = 665), the top attractiveness quartile of college women (Q4; n = 26), and the remaining three attractiveness quartiles of college women (Q1–Q3; n = 80) for (a) waist/stature ratio and (b) hip/stature ratio. In imaginary women, the measurements are predicted from regression equations (see Material and Method section).
An alternative test of Prediction 1.1 is to use waist circumference rather than waist/stature to predict attractiveness. Using multiple regression (multiple r
2 = .49), waist circumference was a significant attractiveness predictor (β = −.46; p = .003), but BMI was not (β = −.27; p = .090), and its addition to the equation did not significantly increase the proportion of explained variance (Δr
2 = .02; p = .086). In addition, if BMI is split into height and weight, height is positively related to attractiveness (β = .21; p = .030), weight is highly insignificant (β = .07; p = .73), and waist circumference is by far the strongest factor (β = −.79; p < .001; r
2 = .52). Similarly when waist and hip circumferences were tested together, waist circumference was strongly predictive of attractiveness (β = −.68; p < .001), but hip circumference was not (β = −.01; Δr
2 = −.01; p = .914).
Confirmed: The mean waist circumference of Playmates was 7.4 cm (3 in.) smaller than the mean of the top attractiveness quartile of college women (p < .001), and mean waist/stature was 13% smaller in the Playmates than in the college women (p < .001, Table 5). The effect sizes (Cohen’s d) for the difference in waist size between these two groups are 2.16 for waist circumference and 2.45 for waist/stature (Table 5, Column 6), and both are significantly greater (p < .001) than the parallel effect sizes for BMI and WHR (1.03 and 1.10, respectively), supporting the view that waist size is the more important factor separating these groups. Waist circumferences and waist/stature ratios were significantly smaller in Playmates versus attractive college women for all BMIs in common (p < .001).
Group Sizes and Means for the College Women (Q4 = Top Attractiveness Quartile, Q1–Q3 = Lower Three Attractiveness Quartiles), Playmates (PP), and Imaginary Women (IW, based on top 16 from Table 6), and Effect Sizes (Cohen’s d) for Differences.
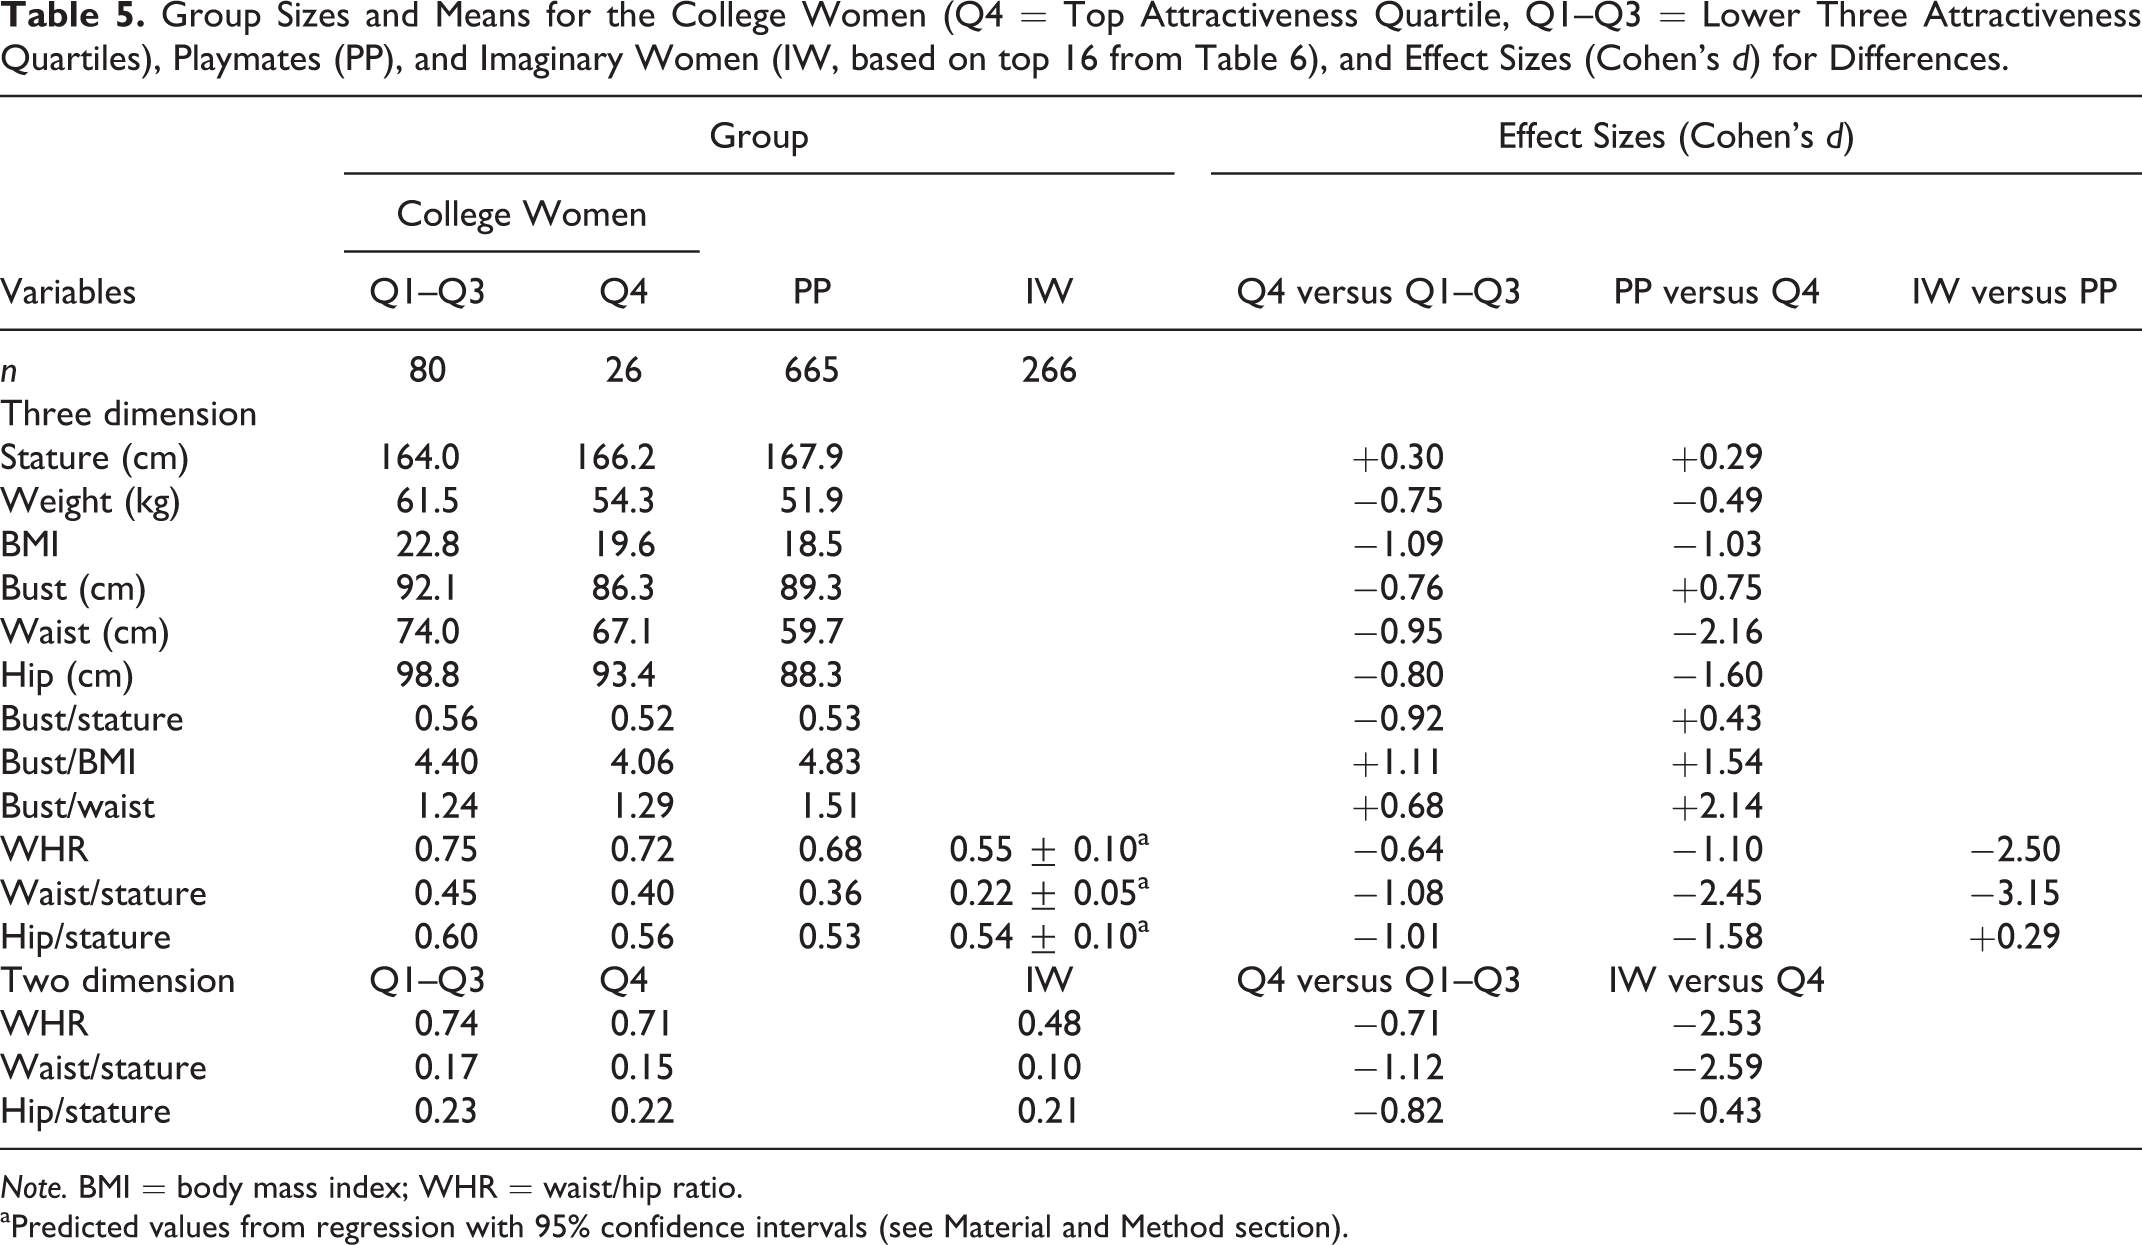
Note. BMI = body mass index; WHR = waist/hip ratio.
aPredicted values from regression with 95% confidence intervals (see Material and Method section).
As shown in Figure 3a, there is only a small amount of overlap in the frequency distributions of waist/stature between Playmates and the top attractiveness quartile of college women. None of the 106 college women rated for attractiveness had a waist/stature ratio as small as the mean value for Playmates.
Confirmed: The 16 more popular imaginary women had smaller waist measures than the 56 less popular (see Material and Method section), with a significantly lower waist/stature (d = 0.62; t-test p < .001; Table 6). In contrast, hip/stature was significantly larger in the more popular group (d = 0.35; t-test p = .004; Table 6). Treating popularity as a continuous rather than a grouping variable, both waist/stature (r = −.26) and WHR (r = −.34) were negatively related to popularity (both p < .001), while hip/stature was positively related (r = .18; p = .001). Thus, the most popular imaginary women had both smaller waists and larger hips in relation to their stature, resulting in substantially lower WHRs (Cohen’s d = 0.82; t-test p < .001). The imaginary women sample in Table 5 is represented by the top 16 (chosen by 78.7% of participants) as shown in Table 6.
Mean Anthropometric Ratios for 16 Individual Imaginary Women Chosen as Most Attractive by More Than Five Participants, With Aggregate Means for Those 16 (266 Images) and for the 56 Less Popular Imaginary Women (76 Images).

Note. For t-test between top 16 versus others.
*p = .004. **p < .001.
Confirmed: 2D measurements of both groups’ images (lower rows of Table 5) show that imaginary women had much smaller waist/stature ratios and WHRs than attractive college women with very large effect sizes of −2.53 and −2.59, respectively, despite the higher variance resulting from the use of all 266 images (see Material and Method section); there is virtually no overlap between the distributions, as can be seen for the 3D waist/stature ratios in Figure 3a.
Confirmed: Imaginary women had a much smaller predicted waist/stature than Playmates, .22 ± .05 versus .36 ± .00 (95% confidence interval of the estimate for imaginary women and of the mean for Playmates) with a very large effect size of −3.15 (Table 5). As shown in Figure 3a, there was again very little overlap in their waist/stature distributions. Assuming a stature comparable to Playmates—whose mean waist circumference is 59.7 cm (23.5 in.)—the average imaginary women would have a waist circumference of 37 cm (15 in.), and the most popular imaginary woman, Jessica Rabbit, would have a waist circumference of 26 cm (10 in.). The predicted WHR of imaginary women (.55) was also much lower than that of Playmates (.68; d = −2.50), but it should be noted that the confidence interval for this estimate is about twice as large as for waist/stature (±.10 vs. ±.05).
Confirmed: Attractiveness was negatively related (p < .001) to both hip circumference (r = −.56) and hip/stature (r = −.62) in college women, and analysis of variance (ANOVA) showed significant differences in both measures by attractiveness quartile (Table 3) and for the top quartile versus the remaining three (d = −0.79 and −0.10, for hip circumference and hip/stature, respectively; Table 5).
Confirmed: BMI was strongly correlated with both hip circumference (r = .87) and hip/stature (r = .91; p < .001 for both), and in separate bivariate regressions, both BMI and hip/stature were strong negative predictors of attractiveness (Table 4, Models 1 and 4). But, when BMI was used to predict attractiveness, adding hip/stature as a second predictor did not significantly increase the variance explained (Table 4, Model 7; Δr 2 = .01; p = .279). These results suggest that the relationship of BMI with hip size accounts for the negative relationship between hip size and attractiveness.
Hip/stature was also not a significant predictor of attractiveness in multiple regression with waist/stature (Table 4, Models 10 and 12). Finally, the impact of waist and hip sizes was examined using circumferences rather than ratios. In that context, waist circumference was strongly predictive of attractiveness (β = −.68; p < .001), but hip circumference was not, and its addition did not improve the model fit (β = −.013; Δr
2 = −.005; p = .914). Thus, hip size was not a significant predictor of attractiveness when either BMI or waist size was controlled.
Confirmed: Differences in hip/stature between the four attractiveness groups were uniformly smaller than differences in waist/stature. A comparison of Figure 3a and b shows that there is a continuous decline in waist/stature as attractiveness increases, but substantial overlap in the distributions of hip/stature in the four attractiveness groups and no consistent directional trend. When all four attractiveness groups are analyzed together using predicted values for imaginary women, ANOVA shows significant differences across groups for both waist/stature and hip/stature (p < .001), but the F-value for waist/stature is 10 times larger than for hip/stature (897 vs. 81).
For Playmates versus the top attractiveness quartile of college women, there was a 7% difference in hip/stature (d = −1.56) compared with a 13% difference in waist/stature (d = −2.45), and there was no significant difference in hip circumference for BMIs of 17–18 (p > .33), a range which includes 62% of Playmates.
For imaginary women versus the top attractiveness quartile of college women, there was only a 5% difference in 2D hip/stature (d = −0.43; p = .03) compared with a 48% difference in 2D waist/stature (d = −2.59; p < .001 for the difference in d). The predicted 3D hip/stature for imaginary females was .54 ± .07 (SD) versus .53 ± .02 in Playmates, with imaginary women having a significantly larger (predicted) hip/stature ratios than Playmates (p < .001). Consistent with that pattern, more popular imaginary women had significantly larger hip/stature than those less popular (.21 vs. .19; p = .004; Table 6), and hip/stature was positively related to popularity in imaginary women (r = .18; p = .001).
Other Significant Results
Other significant findings were not predicted a priori but are nevertheless worth noting as possible targets of future research. In the college women sample, the thigh/stature ratio was a strong negative predictor of attractiveness and was also highly correlated with BMI (r = .84). In multiple regression (r 2 = .45), thigh/stature (β = −.50; p < .001) was a much stronger predictor of attractiveness than was BMI (β = −.26; p = .010; p < .001 for the difference in slopes).
These data offer some insight into possible visual cues to BMI. When combined in a regression to predict BMI, waist/stature (β = .65) and thigh/stature (β = .34) were both significant predictors (both p < .001; r 2 = .88, though the former was stronger (p < .001 for difference in slopes). Thus, both measures are visible indicators which may help to explain the relation of attractiveness to BMI.
Also in the college women sample, the bust/stature ratio was negatively related to attractiveness (r = −.57) and was highly correlated with BMI (r = .89; p < .001 for both). However, like hip size, bust/stature was not a significant predictor of attractiveness when added to a regression with BMI (βs −.70 vs. .03; Δr 2 = .00; p = .85), suggesting that BMI may mediate the negative association between bust size and attractiveness.
In contrast, bust/stature was a significant positive predictor of attractiveness (β = .363; p = .018) in a multiple regression with waist/stature (β = −1.06; p < .001; multiple r 2 = .55). Bust/BMI and bust/waist ratios were both positively related to attractiveness (r = .55 and .56; p < .001) and were higher in the top attractiveness quartile of college women than in the three remaining quartiles (d = +1.11 and +0.68, for bust/BMI and bust/waist, respectively; Table 5).
While Playmates had only a slightly larger bust/stature than the top attractiveness quartile of college women (d = +.43; p = .030; Table 5), the bust/BMI and bust/waist ratios were much larger in Playmates than in the top attractiveness quartile of college women (d = +1.54 and +2.14, respectively). The bust/underbust ratio was only marginally correlated with attractiveness (r = .182; p = .062) in the college women sample, but in multiple regression with BMI, it was significantly related (β = .21; p = .005 vs. −.74; p < .001 for bust/underbust and BMI, respectively, multiple r 2 = .48).
Discussion
Three quite dissimilar data sets support the hypothesis that waist size is the major determinant of female bodily attractiveness and suggest that waist sizes much smaller than those anatomically possible (Figure 3a) may constitute a supernormal stimulus. As attractiveness increases—both within and between our samples—waist size as measured by the waist/stature ratio decreased dramatically. By contrast, as hypothesized, hip size in relation to stature was more similar across attractiveness groups (Figure 3b).
Waist Size Explains the Relationship of WHR, BMI, and Hip Size With Attractiveness
Waist/stature was the most important determinant of attractiveness in college-age women and, based on multiple regression analysis, fully explained the relationship of BMI, WHR, and hip size with attractiveness in this group. While, as in other studies, BMI was a more significant predictor of attractiveness than WHR, waist/stature was more significant than either and was the only significant factor in multivariate models (Table 4). Since BMI cannot be directly assessed and is highly correlated with waist/stature (r = .91), our findings suggest that waist/stature (and perhaps thigh/stature) may be a specific visual cue that explains the apparent link between BMI and attractiveness. The same patterns also suggest that BMI may be a stronger predictor of attractiveness than WHR because of BMI’s higher correlation with waist size (Table 2).
Waist/stature’s dominant influence on attractiveness can also explain the well-established link between WHR and attractiveness. When BMI and WHR are included in multiple regression, WHR explains 3.5% more of the attractiveness variance than BMI alone (Table 4, Model 1 vs. 5); but when waist/stature and WHR are regressed together, waist/stature accounts for all of the explained attractiveness variance (Table 4, Model 3 vs. 8). Similarly, when waist and hip circumferences are considered together, waist size again accounts for all of the effect. Thus, the preference for a low WHR seems solely due to a preference for a smaller waist size. Because waist size increases with BMI, low WHR in women with higher BMIs is deemed less attractive (Singh, 1993a, 1993b).
Playmates were rated as significantly more attractive than the top attractiveness quartile of college women, and waist size was the measure with the greatest difference between these two groups (Table 5; Figure 3), with a very large effect size of −2.45. Moreover, the estimated 3D waist/stature of imaginary women was much smaller than the mean value for Playmates with an effect size of −3.15 (Table 5, Figure 3a). More popular imaginary women also had significant smaller waist/stature than the less popular members of that sample (Table 6).
Thus, when limitations imposed by biology are removed, preferred waist sizes become impossibly small. As noted, Jessica Rabbit, the most attractive imaginary woman and independently chosen as the sexiest cartoon character in an online contest (The Telegraph, 2009), has an estimated waist size of just 26 cm (10 in.). Measurements of a large sample of ancient statues also show that many WHRs fall into the same very low range as contemporary imaginary women (Singh, 2006).
The preeminent role of waist size in female attractiveness is consistent with findings from the relatively few studies that have considered it as a separate variable (Brody, 2004; Brody & Weiss, 2013; Brooks et al., 2010, 2015; Crossley et al., 2012; Forestell et al., 2004; Grundl et al., 2009; Horvath, 1981; Pokrywka et al., 2006; Prantl & Grundl, 2011; Rilling et al., 2008; Rozmus-Wrzesinska & Pawlowski, 2005). In particular, it is congruent with the findings of Brooks, Shelly, Jordan, and Dixson (2015) who found that waist size was the parameter that changed the most as participants in a selection experiment “evolved” figures with increasing attractiveness.
Thus, waist size and its associated ratios decline monotonically and dramatically with increasing attractiveness across three groups that presumably differ in attractiveness. The validity of this conclusion is reinforced by both of the available within-group comparisons: In both the college and imaginary women samples, waist size and its ratios with stature were the strongest predictors of attractiveness.
Because of the ubiquity of images of imaginary women in Western society, their extremely small waist sizes may exacerbate body image dissatisfaction in women (e.g., Frederick, Peplau, & Lever, 2006).
Hip Size and Attractiveness
Results supported the prediction that attractive women would have moderate hip sizes. While we observed steady decreases in waist size across the attractiveness groups, hip size did not shrink in parallel. Hip/stature differed less with increasing attractiveness—as assessed both within and between groups—than did waist stature (Figure 3). For BMIs of 17–18, there was no difference in hip circumference between Playmates and attractive college women, and the predicted hip/stature for imaginary women was actually higher than for Playmates (Figure 3b). Hip size was also significantly larger for more popular imaginary women than for those less popular.
Although the hip/stature ratio was negatively related to attractiveness in college women, this was fully accounted for by its strong correlations with waist size (r = .85) and BMI (r = .91). Because hip size was unrelated to attractiveness when BMI or waist size was controlled (Table 4, Models 7, 10, and 12), the apparent negative effect of hip size on attractiveness was mediated primarily by adiposity. Women considered less attractive because of large waist sizes or high BMIs are very likely to have larger hip sizes as well, as fat is added to both depots. Thus, it seems that for attractiveness to reach a maximum, waist sizes must shrink, but hip size must not shrink in parallel. This pattern leads to very low WHRs in imaginary women and suggests that that commonly expressed claims of .7 being the optimal WHR for attractiveness may need to be reconsidered. While most studies of WHR and attractiveness have not offered choices less than .7, some studies have found a preference for lower values (Dixson et al, 2007; Dixson, Sagata, et al., 2010; Singh, 1994).
Other Findings
The thigh/stature ratio was also a strong predictor of attractiveness in college women. Although it was strongly correlated with BMI (.84) and was a stronger univariate predictor of attractiveness than BMI itself, BMI still significantly predicted attractiveness in a multiple regression with thigh/stature. The strong effect of thigh/stature is consistent with a study comparing beauty contestants with typical young women in Poland, where the ratio of thigh girth to height was a stronger negative predictor of attractiveness than BMI (Pokrykwa et al., 2006).
Although the bust/stature ratio was negatively related to attractiveness in college women (r = −.57), bust/BMI (r = +.55) and bust/waist ratios (r = +.56) were both positively correlated with attractiveness and were significantly higher in more versus less attractive college women (d = 1.11 and .68; Table 5) and also much larger in Playmates (d = 1.54 and 2.14; Table 5). This is consistent with other studies which have found the bust/waist (or waist/bust) ratio is strongly related to attractiveness (Crossley et al., 2012; Grundl et al., 2009). Because of the high correlation of bust/stature with BMI (.89), heavier women tend to have a larger bust size. However, more attractive women tend to have larger busts in relation to their smaller BMI and waist size. The ratio of bust to underbust, used in some studies, was a weaker predictor of attractiveness than the ratio of bust to either BMI or waist size.
Limitations
Recruitment of the college women sample from UCSB—a university known for its “beach culture”—might not have yielded a fully representative sample if UCSB women have more attractive bodies than the population average for young women. However, any such bias would have worked against the assumption that our college women sample represents a less attractive group than the Playmates and imaginary women and thus would have made it more difficult to uncover anthropometric differences among the three groups.
The reported measurements of Playmates on the Playboy website are apparently provided by the Playmates and so could be exaggerated. However, the measurements of beauty contestants, which are verified, are remarkably similar to those of Playmates (Hong et al., 2009; Pokrywka et al., 2006; Singh, 1993a).
More generally, one might ask whether the three studied populations are ordered correctly on bodily attractiveness: Are Playmates more attractive than college women and imaginary women more attractive than Playmates? Although Playmates have been used previously as examples of highly attractive women, their relative attractiveness has not been measured. When raters in this study evaluated the attractiveness of 106 college women and a typical Playboy Playmate, the mean rating for Playmates was higher than any one of the college women. It should be noted that participants did not rate a comparable photograph of a Playmate (which is unavailable) or explicitly rate them in relation to college women. However, the rating of the typical Playmate was intended to provide a frame for subsequent ratings (see Kendrick & Gutiérrez, 1980).
With respect to the imaginary women, the justification is a logical one: If Playmates represent the most attractive female body shape, then artists would draw imaginary females with similar measurements, and our participants, when asked to choose the most attractive imaginary women, should have chosen those who most closely resemble Playmates. But they did not; instead, they typically select women with waists much smaller than Playmates’ waists. And in each case, when more attractive are compared with less attractive women—within both the college and imaginary women samples, for Playmates versus the most attractive quartile of college women sample, and for imaginary females versus Playmates, waist size is the measure that most distinguishes more and less attractive women (Table 5, Figures 2 and 3).
Comparisons between Playmates and imaginary women in this study depended on predicting 3D from 2D measurements. Although the r 2 for waist/stature in the predictive model was high, the validity of these models needs to be tested with larger samples.
The elimination of two outlier raters from the study could be considered a potential source of bias, but analysis using the full set of raters gives quite similar results, with differences between the most attractive quartile of the student sample and Playmates slightly increased rather than reduced.
As noted in the Material and Method section, a choice was made to treat each image selected by the participants as a separate case in the analysis (because each participant provided an image for measurement) rather than using mean values for the 16 most popular characters. This was thought appropriate because it weights each imaginary female by her popularity. However, it also produces smaller effect sizes because of the greater variance in individual image measurements and the much larger number of cases and so reduces effect size differences between imaginary women and the other two groups—another conservative decision that cuts against hypothesized group differences.
All aspects of this study involved American samples, and it is a reasonable question whether the same results would be obtained everywhere, for example, where the food supply is less secure.
Very few studies have separately explored the attractiveness effects of waist and hip size versus those of WHR and BMI. Going forward, it would be desirable for other studies to assess the relative roles of waist and hip separately, as well as the influence of thigh/stature and measures of relative bust size such as bust/BMI.
Implications for Evolutionary Psychology
The key assumption driving interest in the relationship of anthropometric measures to attractiveness is that features perceived as more attractive indicate evolutionary fitness. Thus, it is widely argued that males prefer smaller WHRs and BMIs in young women because these are signs of higher fertility and better health (Sugiyama, 2005), although this view has been questioned (Lassek & Gaulin, 2008).
However, this study suggests that the strongest factor in judgments of female body attractiveness is neither BMI nor WHR, but rather a small waist size and that this fully accounts for the relationship of both BMI and WHR with attractiveness. BMI is an inherently problematic measure because it cannot be directly perceived. To the extent that BMI is relevant to attractiveness judgments, its assessment depends on other variables, some of which (such as the waist/stature and thigh/stature ratios) have been identified in this study.
Although BMI is a stronger predictor of attractiveness than WHR, waist size explains the relationship of both BMI and WHR with attractiveness and is the key factor in distinguishing more attractive from less attractive women across the very wide spectrum of attractiveness surveyed in this study. Thus, BMI and WHR predict attractiveness ratings because they are strong correlates of waist size, with waist size the apparent actual determinant, as first suggested by Rilling, Kaufman, Smith, Worthman, and Patel (2008). If BMI is related to attractiveness by its relationship with other variables, this mitigates the apparent contradiction between an apparent strong preference for low BMIs in well-nourished groups and an apparent preference for higher BMI in subsistence populations, where BMI is positively related to reproductive success. In both groups, men prefer smaller waists (as reflected in WHR; see references above).
The most preferred waist sizes in this study are at or below the minima observed in actual young women (Figure 3a). The average waist/stature for Playmates is at the first percentile for college women, and the average 2D waist/stature for imaginary women is 2.2 SD below the minimum in a sample of 106 college woman and 4.3 SD below the mode of that sample. Because of the high correlations of waist/stature with WHR and BMI, the most attractive values of WHR and BMI are also much smaller than modal values. In the college women sample, the woman with the highest mean attractiveness score had a BMI of 17.
In other animal populations, and for many human characteristics, mean or modal values (in the center of the distribution) usually reflect a phenotypic optimum established by stabilizing selection. Thus, characteristics that are judged attractive could reflect a background of stabilizing selection, as seems to be the case for facial features, where average values are generally preferred (Alley & Cunningham, 1991; Jones & Hill, 1993; Rhodes, 2006).
Consistent with this, the relatively invariant hip sizes of attractive women suggest that stabilizing selection may be operating on this female trait. Obstetrical constraints relating to the risk of cephalopelvic disproportion (Abitbol, 1996) and the need for substantial amounts of gluteofemoral fat to support infant brain development (Lassek & Gaulin, 2006, 2008) exert upward pressure on the bony and adipose components of hip size, respectively, whereas the need for efficient locomotion probably exerts a counterbalancing downward pressure (James, 1973; Oyster & Wooten, 1971; Sills, 1960). When BMI is controlled, hip circumference decreases with increasing parity even in well-nourished populations (Lassek & Gaulin, 2006), so a preference for relatively large hips may also steer mate search toward nulliparous women.
Determining fitness advantages for extremely small waist sizes is more problematic. The exceedingly small waist sizes of imaginary women fall well outside the range of normal variation and are much smaller than anatomically possible. This suggests that a small female waist is a supernormal stimulus which in turn implies that (as a consequence of some mix of sexual and natural selection) there is an asymmetric fitness distribution across the range of normal waist sizes (Staddon, 1975).
The strong preference for small waists implies one of two possibilities. One is that very small waists are optimal for women, conferring direct fitness benefits that yield advantages for men mating with women displaying this trait. Alternatively, small waists may signal an attribute that is not directly fitness-enhancing for women but confers some reproductive advantage for their mates. For example, the fact that a small waist size makes a current pregnancy unlikely (Gallup & Frederick, 2010; Singh, 1993a, 1993b) makes a male preference for small waists adaptive.
The substantial differences in waist measurements between samples of normative women and those judged to be highly attractive may call into question the contention that the body measurements of attractive women indicate higher fertility and better health than those of less attractive women (see also Koscinski, 2013). It seems unlikely that natural selection driven by reproductive success would result in modal young women deviating so substantially from the preferred values that are alleged to promote higher fertility and health.
As noted, medical studies show that waist/stature has a negative relationship with measures of health, but the cutoff value for increased risk is .5 (Ashwell et al., 2012) which is above the mean (.493) for the least attractive quartile (Q1) of college women sample. Also, the health problems associated with high waist/stature (or WHR) are chronic diseases that usually occur in older women and are rare in subsistence populations. (There are similar problems with the health argument for both BMI and WHR.)
In contrast to hip size, to date, there have been few suggestions about the adaptive value of a small waist, other than indicating that a woman is not currently pregnant. Any case where preferences lie at or beyond the extremes of the population distribution should draw our attention (Staddon, 1975). Going forward, it will be important to more fully explicate the selection pressures that have driven evolutionary changes in female body shape and male preferences for it and to more fully explore the extent to which such preferences are universal or vary with features of the local ecology.
Footnotes
Acknowledgments
We gratefully acknowledge the important contributions of Aimee Andrews and Liana Hone who measured and photographed all the UCSB women; Atina Manvellian for measurements of photos of imaginary women; Veronica Jacobs-Edmondson, and Ava Morton for collecting attractiveness ratings and additional measurements; and Judith Geiger for creating ![]() . Tran Dinh and Liana Hone constructively criticized earlier drafts of the manuscript.
. Tran Dinh and Liana Hone constructively criticized earlier drafts of the manuscript.
Declaration of Conflicting Interests
The author(s) declared no potential conflicts of interest with respect to the research, authorship, and/or publication of this article.
Funding
The author(s) received no financial support for the research, authorship, and/or publication of this article.