
Abstract
Self-administered web surveys provide respondents only limited opportunities for feedback. Therefore, many web surveys include so-called “final comment questions” (FCQs) that allow respondents to elaborate on the survey in general and the survey questions in particular. Typing in open answers in text boxes is burdensome – especially via smartphones with virtual on-screen keypads – so that respondents frequently provide short or no answers at all. In this study, we make use of new technological advancements in web survey methodology and investigate FCQs with requests for written and oral answers. For this purpose, we conducted an experiment in a smartphone survey (N = 1,001) in a German online panel. The results reveal that FCQs with a request for written and oral answers do not differ with respect to item-nonresponse. However, oral answers are substantially longer than written answers pointing to more in-depth information. The oral answer condition also results in more positive comments than the written answer condition. This study is a methodological showcase for innovative web survey design that contributes to the improvement of data quality.
Keywords
Introduction and background
Self-administered web surveys are a prevailing data collection method in behavioral and social science research. Typically, such web surveys include questions with closed answer formats that restrict respondents’ answers to a pre-defined list of options (e.g., running from “agree strongly” to “disagree strongly”). Despite the prevalence of closed answer formats researchers increasingly employ questions with open answer formats (e.g., text fields for typing in answers) because they facilitate the collection of in-depth and unfiltered information (Revilla & Ochoa, 2016; Smyth et al., 2009). However, respondents may find it difficult to articulate themselves in writing and to type in answers; especially through virtual on-screen keypads of smartphones that shrink the viewing space (Höhne et al., 2020). Thus, open questions frequently result in very short or no answers at all indicating that respondents may not reveal all their thoughts because of the answer provision process (Revilla & Ochoa, 2016).
Another methodological shortcoming of self-administered web surveys is the absence of interviewers limiting respondents’ chance to provide feedback on the web survey in general and its questions in particular. Thus, researchers frequently implement so-called “final comment questions” (FCQs), as a special type of open questions, at the end of the web survey. One example of a FCQ is the following question: “Do you have any further comments on the survey or its questions?”. FCQs usually include an open answer format in the form of one or multiple text boxes requesting respondents to type in answers in their own words (Decorte et al., 2019; McLauchlan & Schonlau, 2016; O’Cathain & Thomas, 2004; Schonlau, 2015). They can shed light on general reactions (e.g., respondents’ feelings and thoughts), topic coverage (e.g., identifying missing aspects that were not included in the survey), potential critique (e.g., irritating or overly sensitive questions), methodological problems (e.g., missing answer options or question redundancy), and technological issues (e.g., dysfunctional survey operation or navigation issues). Thus, they contribute to the improvement of web survey design and help to evaluate the quality of respondents’ answers.
New technological developments, coupled with a continuous increase in web surveys completed via smartphones (Gummer et al., 2023), extend the methodological toolkit for collecting respondents’ answers to open questions in general and FCQs in particular. Specifically, the built-in microphones of smartphones facilitate the administration of open questions with requests for oral instead of written answers (Gavras et al., 2022; Gavras & Höhne, 2022; Revilla & Couper, 2021; Revilla et al., 2020). The use of oral input, compared to written input, has the great potential to ease the answer provision process, as in the former case, respondents only need to press a recording button and record their answers (Gavras & Höhne, 2022). Gavras et al. (2022) argue that requests for written answers are more likely to trigger a memory-based processing (Tourangeau et al., 2000; Zaller & Feldman, 1992) and may thus be more intentional and conscious, whereas oral answers are more likely to trigger an on-line processing (Lodge et al., 1989; McGraw et al., 2003) and may thus be more intuitive and spontaneous. The presumably less burdensome answer delivery associated with oral answers, coupled with an on-line processing, potentially results in longer answers. In line with this reasoning, research has shown that oral answers are longer and consist of more topics than their written counterparts (Gavras et al., 2022). Topics also vary between both answer conditions. Oral answers also perform better than written ones when it comes to validity (Gavras & Höhne, 2022). However, item-nonresponse appears to be higher in oral than written answers (Revilla & Couper, 2021; Revilla et al., 2020). This indicates that a substantial minority of respondents is not willing and/or able to provide oral answers.
To our best of knowledge, no previous studies have compared respondents’ answers to FCQs using requests for written and oral answers. In order to fill this research gap, we conducted an experiment in a smartphone survey and randomly assigned respondents to different answer request conditions. Some respondents were asked to provide written answers and some others were asked to provide oral answers. In line with the existing research on written and oral answers in smartphone surveys, we address the following three research questions (RQs):
Do FCQs with requests for written and oral answers differ in terms of
… item-nonresponse? (RQ1)
… answer length? (RQ2)
… content of comments? (RQ3)
Method
Data collection
Data were collected in the Forsa Omninet Panel (omninet.forsa.de) in Germany in November 2021. Forsa drew a cross-quota sample from their online panel based on age (young, middle, and old) and gender (female and male). In addition, they drew quotas on education (low, medium, and high). The quotas were calculated based on the German Microcensus, which served as a population benchmark. Data and analysis code for replication purposes are available through Harvard Dataverse (see https://doi.org/10.7910/DVN/J8K7VW).
The email invitation included information on the device to be used for survey participation (smartphone) and a link that re-directed respondents to the web survey. The first web survey page introduced the topic and outlined the overall procedure. In addition, it included a statement of confidentiality assuring that the study adheres to existing data protection laws and regulations. Prior informed consent for data collection was obtained by Forsa. Respondents also received financial compensation for their participation from Forsa.
Respondents were randomly assigned to one out of two experimental groups. The first experimental group received one FCQ with a request for a written answer (written condition). The second experimental group received one identical FCQ but with a request for an oral answer (oral condition).
In order to collect oral answers, we used the open-source “SurveyVoice” (SVoice) tool programmed by Höhne et al. (2021). SVoice resembles the voice recording function of popular instant messengers, such as WhatsApp and WeChat, and works for both Android and iOS devices. It is browser-based and does not require respondents to download any software or plugins.
Sample
Forsa invited 6,745 respondents to take part in the web survey. No respondents were screened out because of full quotas or because they tried to access the web survey with another device than a smartphone. A total of 1,681 respondents started the web survey, but 680 of them broke-off before they were asked any study-relevant questions. In the written condition 159 (about 24%) respondents broke-off, whereas in the oral condition 521 (about 51%) respondents broke-off. In this study, we focus on respondents that finished the entire smartphone survey (full completes).
Sample characteristics of the written and oral conditions.
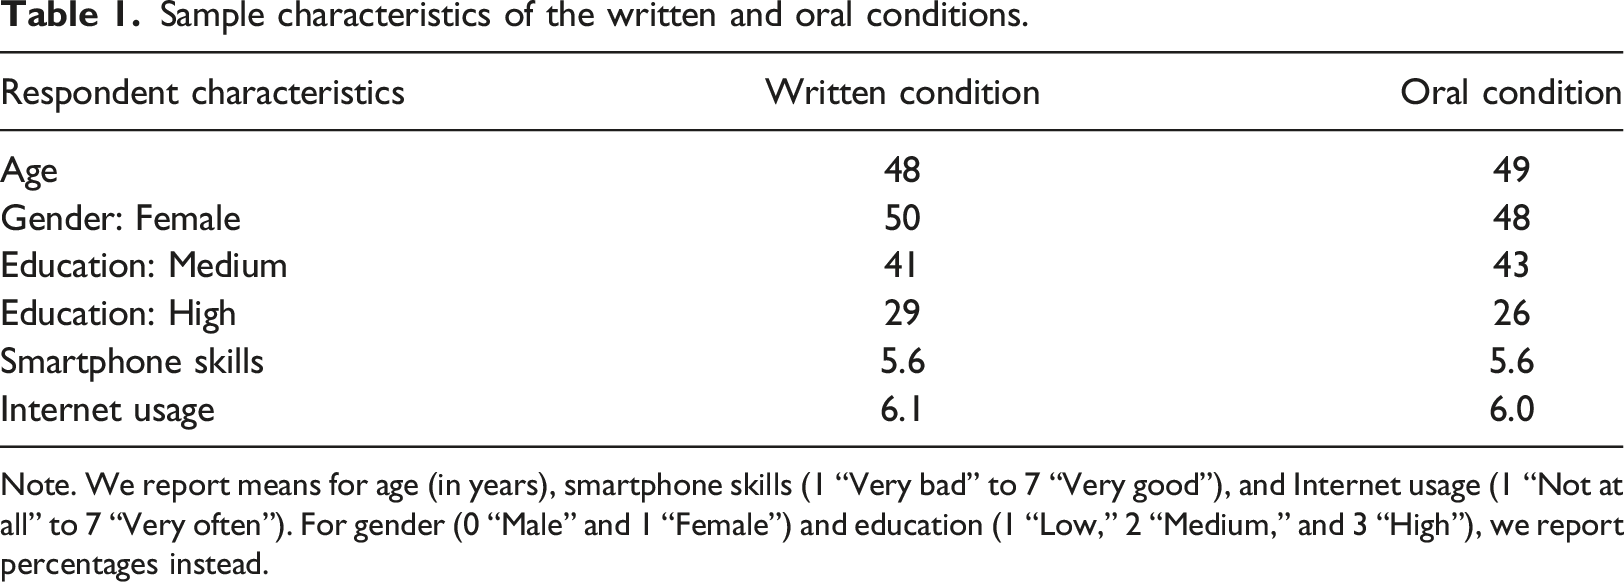
Note. We report means for age (in years), smartphone skills (1 “Very bad” to 7 “Very good”), and Internet usage (1 “Not at all” to 7 “Very often”). For gender (0 “Male” and 1 “Female”) and education (1 “Low,” 2 “Medium,” and 3 “High”), we report percentages instead.
In order to evaluate the effectiveness of random assignment, we compared the sample composition between the written and oral conditions. We found no statistically significant differences with respect to age, gender, education, smartphone skills, and Internet usage.
Final comment question
We asked respondents the following FCQ at the end of the web survey:
Finally, we would like to give you the opportunity to say something about our survey. Do you have any comments or suggestions on the survey in general or individual questions in particular?
Depending on the experimental condition, respondents were either asked to provide a written answer or to provide an oral answer. Figure 1 provides exemplary screenshots of the FCQs. Screenshots of the FCQs with requests for written and oral answers. Note. FCQ with a request for a written answer on the left and FCQ with a request for an oral answer on the right.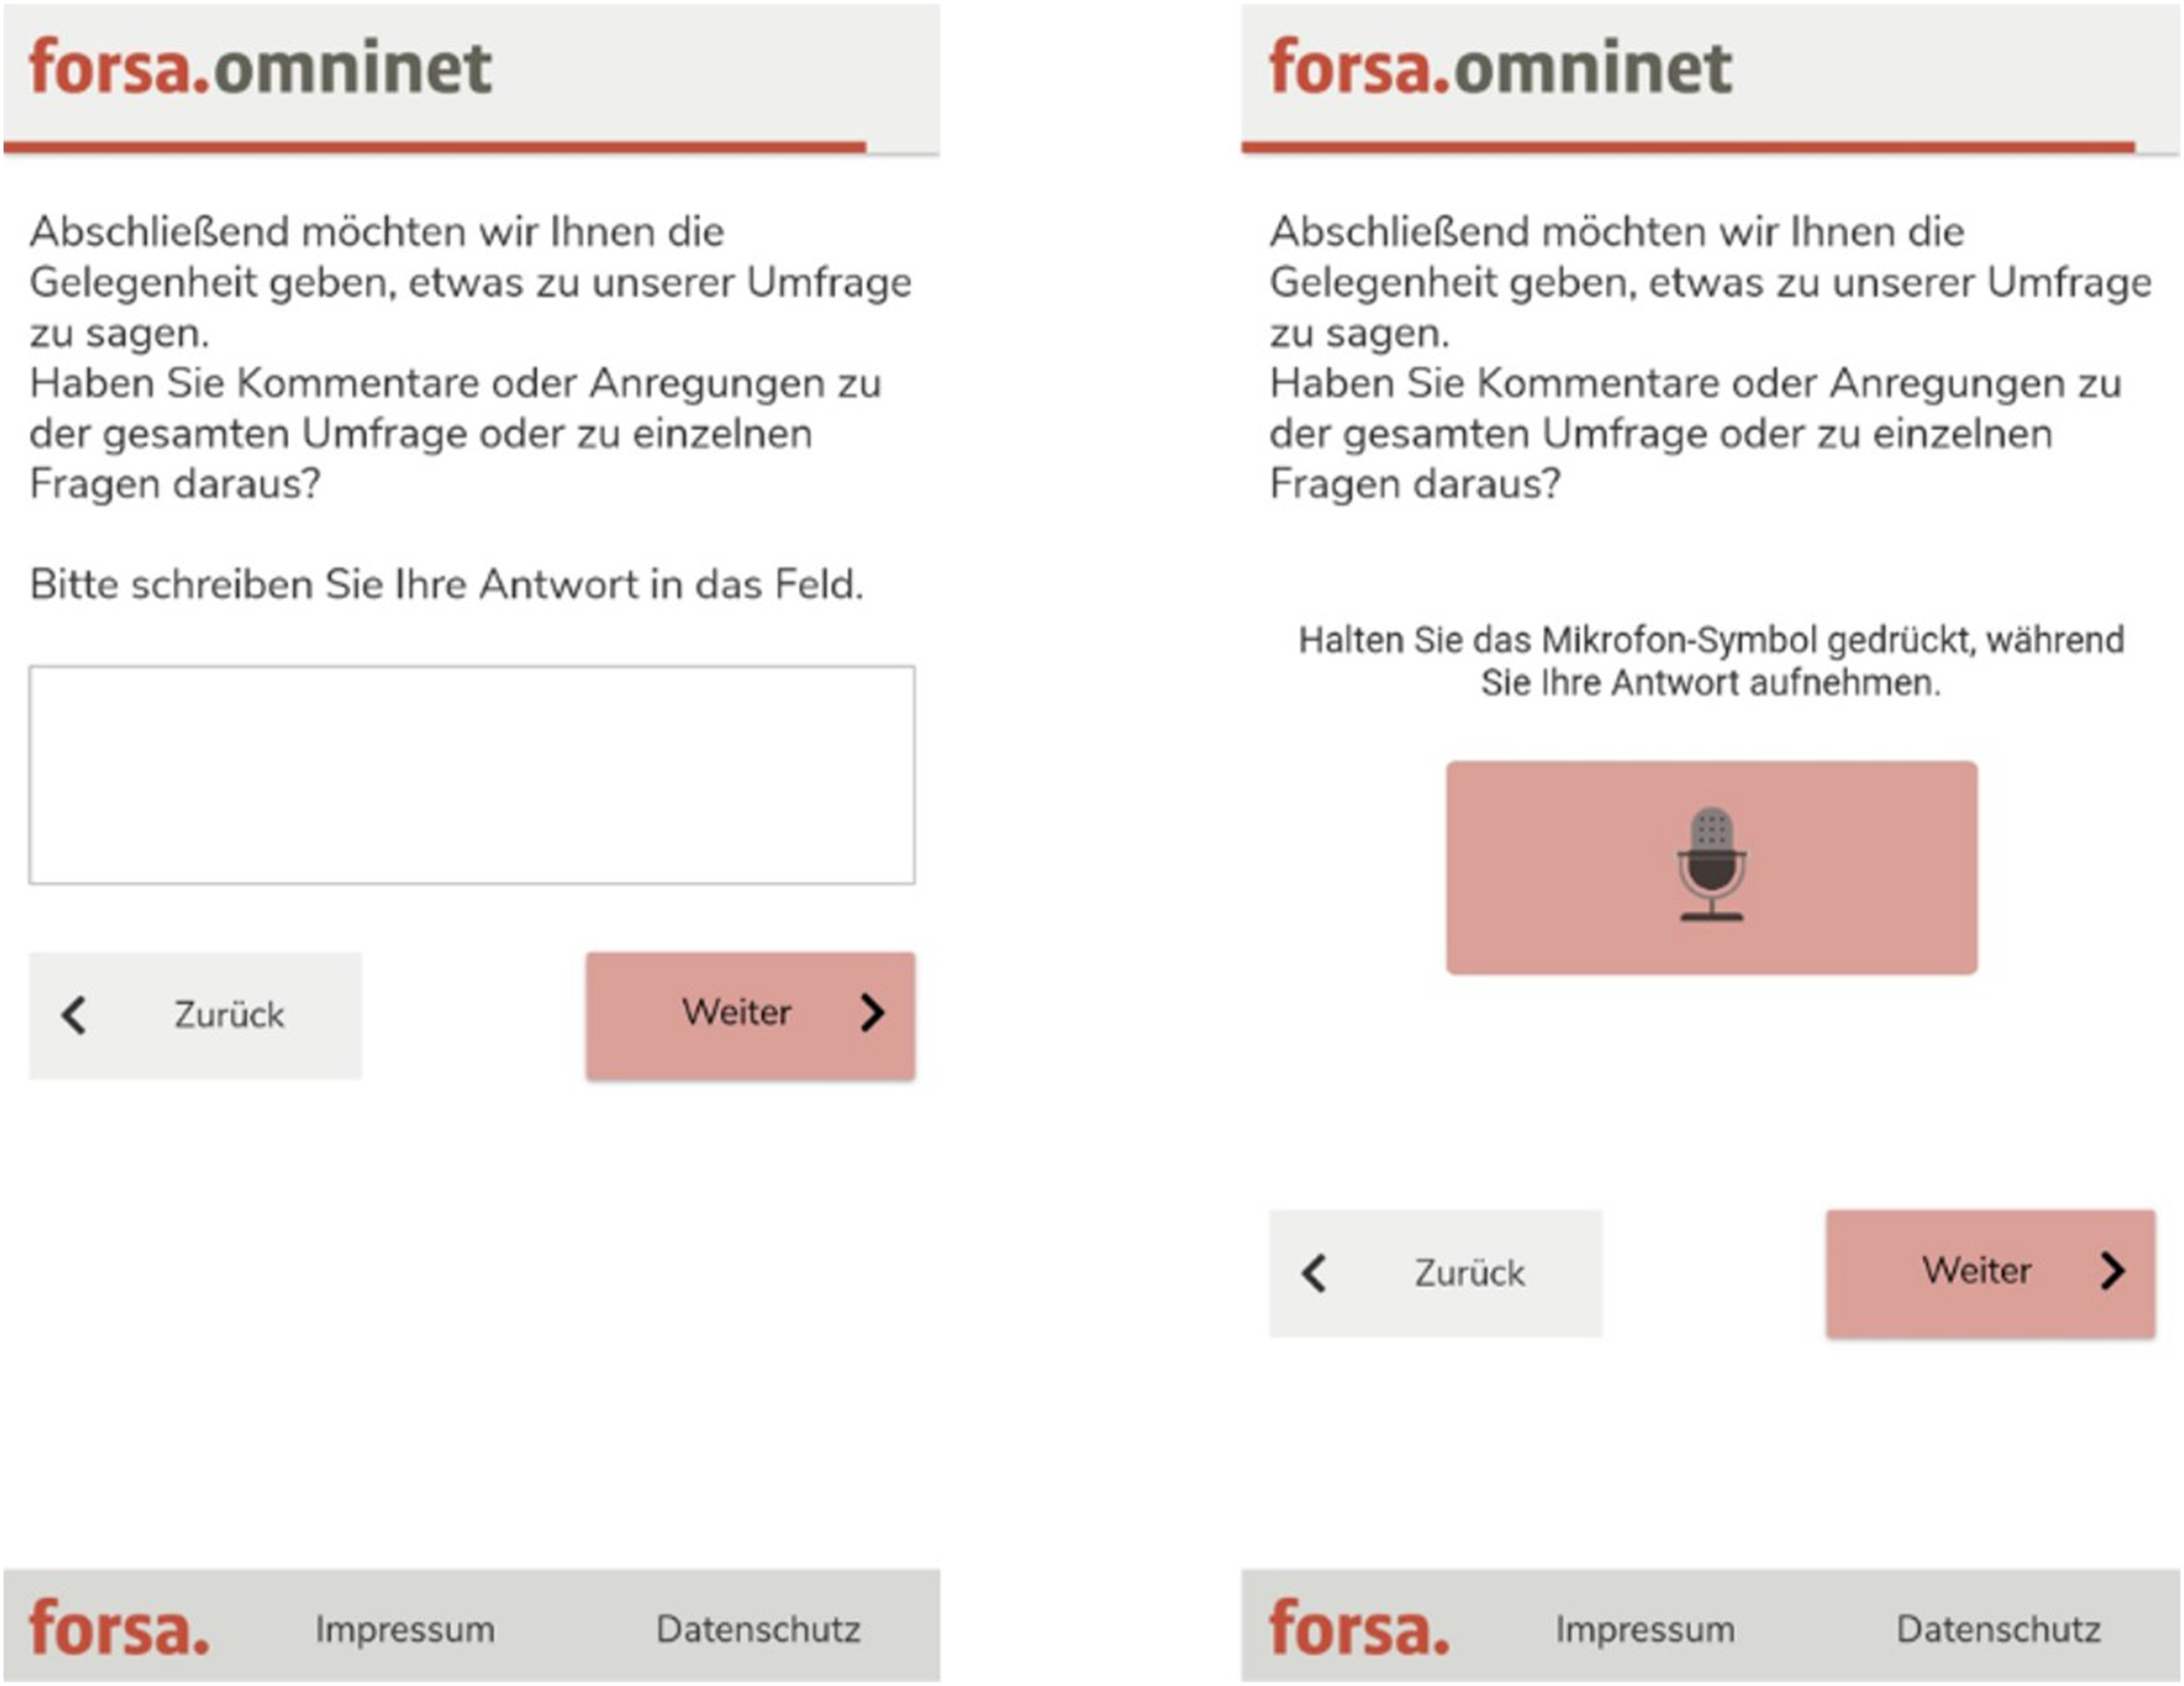
At the beginning of the web survey, respondents received a description on how to provide text or voice answers (the online Appendix provides English translations of these descriptions). In total, the survey consisted of eight open questions with requests for written or oral answers that dealt with a variety of topics, such as the German vaccination campaign and working women. These questions preceded the FCQ.
Results
In order to investigate our first research question, we compared item-nonresponse (i.e., the percentage of respondents that provided no answer to the FCQ) between the written and oral request conditions. With less than 50% of respondents providing an answer in both conditions item-nonresponse is relatively high. In the written condition the item-nonresponse rate is 55.8%, whereas in the oral condition the item-nonresponse rate is 52.3%. We conducted a Z-test for determining statistical significance using a significance level of 0.05 as threshold. The results show no statistically significant difference between the conditions with requests for written and oral answers (Z = 1.11, p = .27).
With respect to our second research question, we compared respondents’ answer length (i.e., the number of words that respondents provided). 1 For this purpose, we excluded all respondents that engaged in item-nonresponse from statistical analyses. The median answer length is 8 words in the written condition and 27 words in the oral condition. Thus, oral answers are more than three times longer than their written counterparts. The result of a non-parametric median test shows a statistically significant difference between both request conditions (χ2(1) = 62.22, p = .00).
Finally, in order to address our third research question, we investigate respondents’ answers to the FCQ with written and oral answer requests. For this purpose, we manually coded respondents’ answers with the help of a student assistant building on the coding scheme by Schonlau (2015) with 9 categories. During the coding, we partially revised and expanded the coding scheme so that it finally consisted of 13 categories (i.e., 4 positive, 4 neutral, 4 negative, and 1 nonsense). Using this final coding scheme, the second author independently coded a randomly selected subset of about 30% (n = 138) of the answers (excluding answers that were coded as nonsense). A Cohen’s kappa value of 0.84 shows a high agreement between the two coders (Landis & Koch, 1977). Importantly, comments were coded into one single category. If two categories applied to one answer, the category corresponding to the first mentioned content in the answer was selected. Answer analysis remains on a descriptive level by reporting percentages.
Categorization of respondents’ answers to the FCQ.
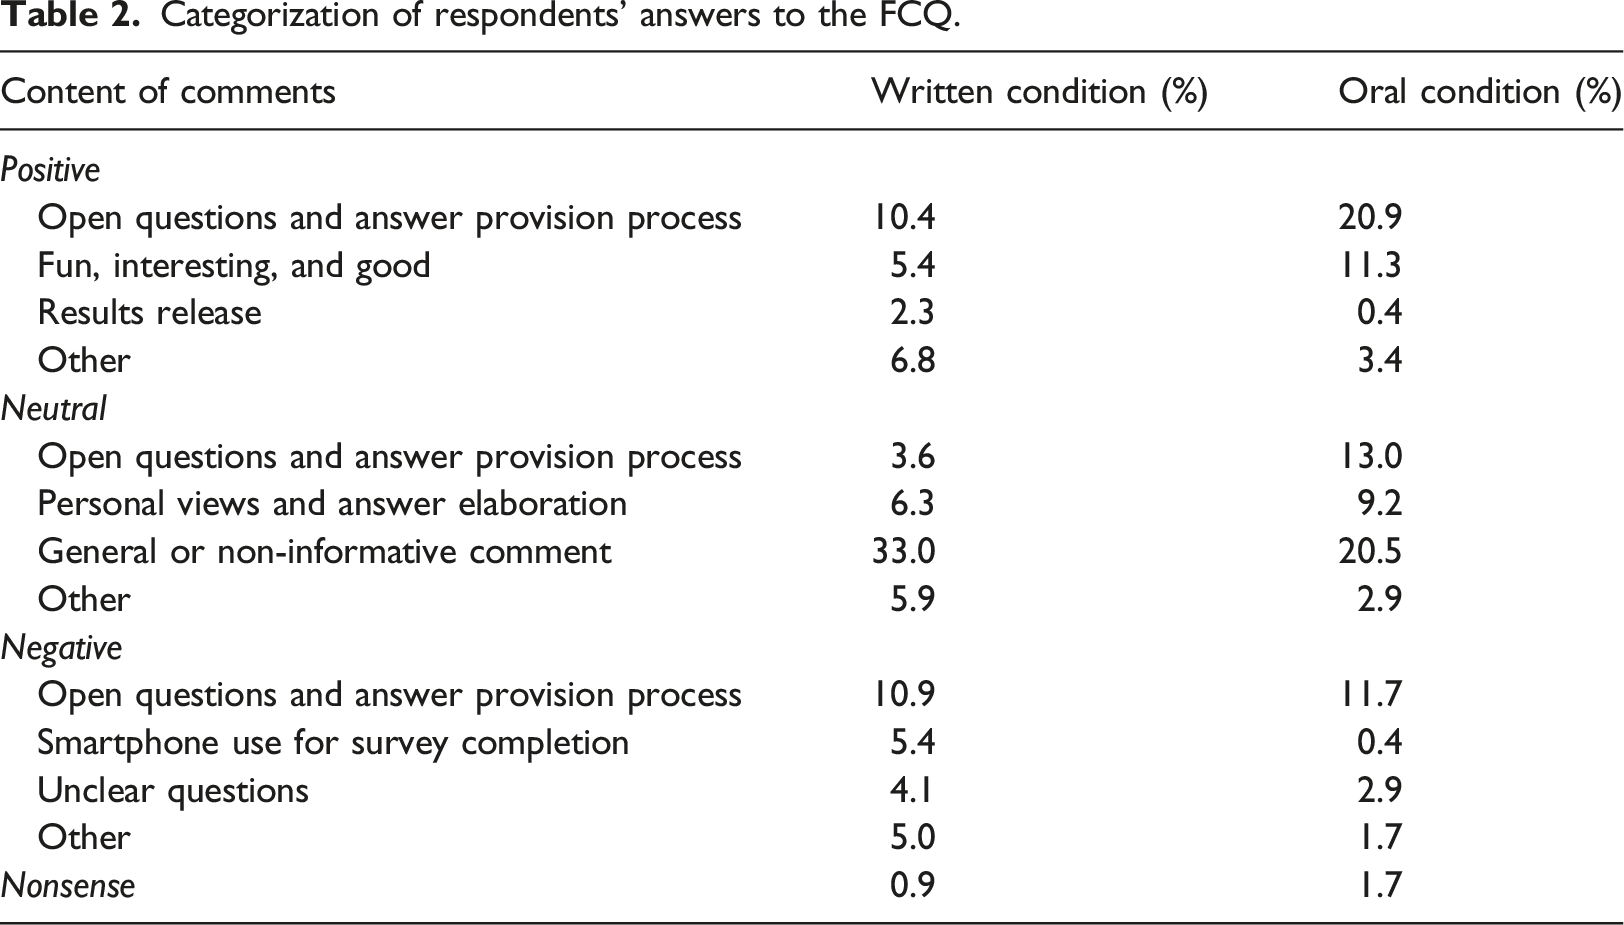
With respect to neutral comments, we found that most respondents provided a general (e.g., “Everything was all right”) or non-informative comment (e.g., “I have no comments to make”). In the written condition this is higher (33%) than in the oral condition (21%). About 4% (written condition) and 13% (oral condition) commented on open questions and the answer delivery process (e.g., “I wonder how you analyze that” and “This was a somewhat unusual survey for me with this sort of format”). Between 9% and 3% of respondents provided personal views and answer elaborations (e.g., “I think it would be very important if politicians and citizens would govern together again”) or other comments (e.g., “What was the purpose of this survey?”).
When it comes to negative comments about 11% (written condition) and 12% (oral condition) complained about open questions and the answer provision process (e.g., “It is more difficult to put something into words than to choose from given answers”). Another 5% (written condition) complained about smartphone use for survey completion (e.g., “Next time, please also include the option of using the PC or tablet”). In the oral condition, this was done by less than 1% of the respondents. Less than 5% of respondents (both written and oral conditions) complained about unclear questions (e.g., “Would have been nice if the questions were a bit more specific”). Finally, about 5% (written condition) and 2% (oral condition) of respondents provided other comments (e.g., “The topics were of little interest to me”)
Some of the respondents also gave nonsense answers (e.g., “War”). However, these answers account for less than 2% of the answers in both conditions.
Discussion and conclusion
The goal of this study was to investigate “final comment questions” (FCQs) with requests for written and oral answers. For this purpose, we conducted an experiment in a smartphone survey and randomly assigned respondents to one out of two request conditions. The overall results reveal no differences with respect to item-nonresponse, but substantial differences with respect to answer length. The content of respondents’ answers to the FCQ also differs.
Previous studies on open questions with requests for written and oral answers consistently found higher item-nonresponse for oral answers (Gavras et al., 2022; Gavras & Höhne, 2022; Revilla & Couper, 2021; Revilla et al., 2020). In this study, item-nonresponse does not differ significantly between the two request conditions. Item-nonresponse is even slightly higher in the written than in the oral condition. This finding indicates that requests for oral answers may encourage respondents to provide answers to FCQs. However, this conjecture lacks empirical evidence and thus it needs further, more refined investigation.
The length differences between written and oral answers indicate differences in response burden. Written answers appear to be more burdensome than oral answers. Most likely, the answer delivery process is responsible for the length differences. Entering written answers via a virtual on-screen keypad of smartphones is more burdensome than recording an oral answer by simply pressing a recording button (Gavras et al., 2022). In addition, this finding indicates that oral answers, compared to their written counterparts, trigger open narrations that potentially result in more nuanced and in-depth information. We see the underlying answer processes responsible for this finding. While written answers seem to initiate an intentional and conscious memory-based processing, oral answers seem to initiate an intuitive and spontaneous on-line processing. In order to go beyond answer length, it would be worthwhile to compare the number of topics between both request conditions using Structural Topic Models (STM; Roberts et al., 2014). This potentially helps to draw more refined conclusions about the informative content of written and oral answers.
The coding of respondents’ answers to the FCQs resulted in four overall categories: positive, neutral, negative, and nonsense. The oral request condition produced more positive comments than its written counterpart. Providing oral answers in a smartphone survey seems to appeal to a substantial minority of respondents.
This study has some limitations that provide perspectives for future research. First, we drew a quota sample from a nonprobability online panel. In order to draw more robust conclusions, it would be worthwhile to rerun a similar study in a probability-based panel. Relatedly, it would be worthwhile to conduct subgroup analyses that, for example, take demographic characteristics, such as age and education, into consideration. This would help to draw a full picture of the usefulness and usability of oral answers when it comes to FCQs. Second, an item-nonresponse rate of 50% is high and thus it would be worthwhile to conduct research on how to decrease item-nonresponse associated with FCQs in general. For example, future studies may investigate the impact of motivational prompts on item-nonresponse and/or more refined incentive strategies. Specifically, it might be worthwhile to incentivize respondents per (oral or written) answer that they provide instead of providing them with a fixed, overall incentive.
FCQs with requests for oral answers provide some methodological advantages in smartphone surveys. They result in a comparable item-nonresponse rate as their written counterparts. This was not observed in previous studies on general open questions. In addition, they provide longer answers pointing to open narrations that potentially lead to more information from respondents. Respondents’ comments are also more positive, which may enhance survey satisfaction. Thus, FCQs with requests for oral answers add to the methodological toolkit and warrant further research.
Supplemental Material
Supplemental Material - Examining final comment questions with requests for written and oral answers
Supplemental Material for Examining final comment questions with requests for written and oral answers by Jan Karem Höhne and Joshua Claassen in International Journal of Market Research
Footnotes
Acknowledgements
The authors are grateful to Jessica Kuhlmann (Ruhr University Bochum) for her great support during data coding.
Declaration of conflicting interests
The author(s) declared no potential conflicts of interest with respect to the research, authorship, and/or publication of this article.
Funding
The author(s) received no financial support for the research, authorship, and/or publication of this article.
Correction (February 2024):
This article has been updated with the corresponding author's affiliation and formatting correction in the Tables.
Ethical statement
Data Availability Statement
Data and analysis code for replication purposes are available through Harvard Dataverse (see https://doi.org/10.7910/DVN/J8K7VW).
Supplemental Material
Supplemental material for this article is available online.
Note
References
Supplementary Material
Please find the following supplemental material available below.
For Open Access articles published under a Creative Commons License, all supplemental material carries the same license as the article it is associated with.
For non-Open Access articles published, all supplemental material carries a non-exclusive license, and permission requests for re-use of supplemental material or any part of supplemental material shall be sent directly to the copyright owner as specified in the copyright notice associated with the article.