
Abstract
This study investigates the accuracy of a survey that combines smartphone completion, random digit dialing (RDD), and text message invitation to a web survey. A benchmarking study was conducted using 26 questionnaire items from a survey on wellbeing, health, and life in general. Additionally, methodological, technical, ethical, and cost considerations of this relatively new approach to web survey data collection were investigated, compared to previous research findings, and discussed with an aim to propose practical solutions. Ultimately, average errors in this survey were compared to average errors in three other probability samples and one nonprobability online panel sample (i.e., reference samples) using nationally representative benchmarks from high-quality government data sources. The results showed that the sample used in this study was similarly accurate to the reference samples from a different benchmarking study. Based on these findings, a very low response rate in the RDD text-to-web survey did not appear to introduce significant nonresponse bias for a majority of survey items, and all large errors can be explained. Hence, in countries where prior consent to text messages is not required, RDD text-to-web should be considered as a cost- and time-effective alternative to probability- and nonprobability-based online panel surveys, telephone, or interactive voice response surveys, and used in market, public opinion, and social research.
Keywords
Introduction
Widespread access to the internet on mobile devices and a growing market of smartphones and tablets, offer both new opportunities and challenges for survey methodology. Simultaneous with the increasing ease of access to large pools of respondents, response rates have been gradually decreasing and, in turn, market, public opinion, academic, official statistics, and social research have faced increasing costs of data collection using probability-based methodology (Couper, 2017; Stedman et al., 2019). Hence, it is increasingly important for survey research to identify new ways of collecting survey data that could offer better cost-accuracy balance.
This survey project aimed to evaluate a rather new and less explored approach to survey data collection, combining random digit dialing (RDD) of mobile numbers with short message service (SMS) invitations, including a URL link to a web questionnaire. This approach can be considered a convenient time- and cost-effective solution for web surveys. Importantly, since mobile numbers are generated randomly, it is based on probabilistic sampling principles. It can be considered one of the newest solutions to data collection using smartphones, which have become an increasingly important tool in online research (Antoun et al., 2019). The approach, also known as RDD text-to-web, has been previously described in studies conducted in Germany, South Korea, and Australia (Bucher & Sand, 2022; Hahn & Biddle, 2022; Kim & Couper, 2021; Phillips et al., 2021). The main aims of previous research were to investigate either the feasibility of the RDD text-to-web approach, associated nonresponse and socio-demographic representation, or any difference in the estimates between RDD text-to-web and an alternative survey mode. However, due to its relatively limited adoption among researchers, a comprehensive evaluation of specific details and practical considerations is required for effective implementation, followed by a holistic investigation of the accuracy of the approach being examined.
More specifically, it is not entirely clear if RDD text-to-web can be similarly accurate in measuring a range of concepts in social and market research compared to other, more rigorous and less cost- and time-effective probabilistic sampling approaches. While socio-demographic representation has been previously examined using estimates from population censuses (that can be used as so-called benchmarks), further research is needed to assess the accuracy of non-demographic items. 1 In previous research, estimates of only two non-demographic concepts from RDD text-to-web surveys, namely cigarette smoking prevalence 2 (Kim & Couper, 2021) and voting intention (Bucher & Sand, 2022), were compared to the data from representative large-scale surveys 3 on similar topics. While an additional analysis of non-demographic estimates was carried out, it is important to note that it compared the results between RDD text-to-web and an alternative survey mode (Kim & Couper, 2021) without including a range of matching items from high-quality data sources in the analysis. To investigate the issue of accuracy of non-demographic items holistically, I carried out a well-designed benchmarking study.
In this article, the term ‘benchmarking study’ is used to describe a type of study in which survey estimates are compared to those from high-quality data sources such as large-scale national government/federal surveys, censuses, or government administrative data. As such, benchmarking studies differ from those that examine the effects of survey mode on survey estimates (e.g., Kim & Couper, 2021) by not comprehensively utilizing nationally representative data as a ‘yardstick’ and by not assessing the overall accuracy of individual survey samples.
Based on this background, the aims of the study are two-fold. First, to present practical considerations of conducting a general population RDD text-to-web survey, this article discusses some key methodological, technical, ethical, and cost aspects of the investigated approach. By integrating the most relevant findings from two separate experiments on RDD text-to-web panel recruitment (Hahn & Biddle, 2022; Phillips et al., 2021), and the feasibility studies from Germany (Bucher & Sand, 2022) and South Korea (Kim & Couper, 2021), the considerations and recommendations will not be limited to the country where the study was conducted (i.e., Australia) or the survey design (i.e., cross-sectional data collection).
Second, the article presents evidence on data accuracy of the proposed approach by comparing the estimates of this survey to the nationally representative benchmarks measuring health, wellbeing and life satisfaction, technology use, personality traits, and socio-demographics. The study adds value to the existing literature on the accuracy of RDD text-to-web surveys by including non-demographic survey items in a carefully designed benchmarking study. Importantly, to determine the relative accuracy of the tested approach, my sample was compared to three probability samples and one nonprobability online panel sample from a different Australian benchmarking study. This data accuracy assessment will ultimately position RDD text-to-web on an accuracy scale in relation to less cost- and time-efficient probability surveys, as well as commercial volunteer online panels.
Background
Previous research using RDD sampling and SMS recruitment to web
To date, RDD sampling combined with SMS invitations to a web questionnaire or an online form has been tested for two main purposes: recruitment to a cross-sectional survey and recruitment to a probability-based online panel. In South Korea, Kim and Couper (2021) used the approach to collect data on smoking and health, and in Germany, Bucher and Sand (2022) conducted a survey on political attitudes and smartphone use. On the other hand, recruitment to a probability-based online panel was previously tested in Australia by Phillips et al. (2021, Life in AustraliaTM) and by Hahn and Biddle (2022, ANU/ACSPRI panel).
The main disadvantage of the RDD text-to-web approach has been a low response rate. Kim and Couper (2021) reported a response rate that was half of a response rate in their cell phone survey (which was conducted concurrently), and Bucher and Sand (2022) reported a final response rate below 1%. Similarly, the recruitment rates in RDD sampling SMS recruitment to probability-based online panels were both absolutely and relatively low compared to other recruitment methods – Phillips et al. (2021) reported an overall recruitment rate of 3.1% (i.e., less than half of the reported mail/postal recruitment rate from the concurrent recruitment effort), and Hahn and Biddle (2022) reported an overall recruitment rate of 1.2% 4 (i.e., about 10 times lower than the reported mail/postal recruitment rate from the concurrent panel recruitment effort). However, all previous research using the same methodology described a lower cost of this relatively new approach – researchers reported the RDD sampling SMS recruitment being between two (Hahn & Biddle, 2022) and five times (Kim & Couper, 2021) more cost-effective than more traditional survey recruitment modes utilized in their studies.
On the other hand, the evidence on the impact of low response and recruitment rates in RDD text-to-web studies on socio-demographic representation bias is somewhat mixed. The analyzed studies reported overrepresentation of the youngest cohorts (Bucher & Sand, 2022; Phillips et al., 2021), and underrepresentation of people 50+ years of age (Kim & Couper, 2021), the most educated (Bucher & Sand, 2022; Hahn & Biddle, 2022; Phillips et al., 2021), as well as those who supported nontraditional political parties (Bucher & Sand, 2022). However, RDD text-to-web recruitment can result in a better representation of immigrants compared to some other recruitment modes (Hahn & Biddle, 2022; Phillips et al., 2021).
Potential sources of demographic and non-demographic bias in RDD text-to-web surveys
From the Total Survey Error framework perspective (see Groves et al., 2009), there are several concurrent sources of bias that could affect the accuracy of estimates in RDD text-to-web surveys, potentially even more than in other types of probability-based web surveys. The major sources of the combined bias could be undercoverage of people without internet access (Couper, 2000) and/or undercoverage of people owning a smartphone (Wells, 2015). The other sources of bias could be nonresponse bias (also as a result of the digital divide) and sampling bias.
Generally speaking, coverage error appears to be the prevalent component of representation bias. Hsia et al. (2020) found different levels of undercoverage bias for their health-related items from their web survey (overall bias), but they could report bias within some demographics and not all of them (relative bias). Moreover, Fuchs and Busse (2009) reported considerable socio-demographic coverage bias in a smartphone survey, consistent with the findings of Antoun et al. (2019), who concluded that while smartphone surveys might represent an advanced data collection opportunity, they can suffer from more undercoverage than web surveys. Similar claims have been made for text message surveys, which suffer from selection bias and data quality (Kongsgard et al., 2014), and not every person has a cell phone or a smartphone (McGeeney & Kennedy, 2015). In RDD text-to-web surveys, one of the issues can be excluding people with cellphones that are not smartphones as the recipients of an SMS cannot access the web questionnaire (Bucher & Sand, 2022).
Web surveys are also known for lower response rates than other survey modes (Cook et al., 2000; Daikeler et al., 2020; Manfreda et al., 2008), and since nonrespondents represent a larger portion of the entire selected sample, bias could be more severe. In comparison to web surveys, nonresponse and the associated bias can be more significant in mobile web surveys (Antoun et al., 2019; Couper et al., 2017). This can also be attributed to higher breakoff rates in such types of surveys (Mavletova & Couper, 2016) or the inability of respondents to participate via a smartphone and choosing not to respond on a PC (Peterson et al., 2017).
Benchmarking as an accuracy estimation method
In survey methodology, benchmarking is a method that can be used for several purposes, including in the estimation of accuracy of different surveys, survey samples, survey modes, and post-survey adjustments. In practice, researchers carry out benchmarking to determine the quality of their surveys (e.g., Bialik, 2018), to compare surveys based on different types of sampling (e.g., Yeager et al., 2011), and to study measurement mode effects (Vannieuwenhuyze & Loosveldt, 2013). However, the latter are not called benchmarking studies per se.
The most common benchmarking analysis that has been used in the literature is the accuracy of nonprobability samples in comparison to probability samples. While the results of several benchmarking studies of that type have been published (e.g., Chang & Krosnick, 2009; Dutwin & Buskirk, 2017; Kaczmirek et al., 2019; MacInnis et al., 2018; Malhotra & Krosnick, 2007; Lavrakas et al., 2022; Yeager et al., 2011) 5 , and the basic principles of benchmarking analysis have been described and discussed, there is no commonly used methodological framework advising survey researchers how to perform benchmarking.
Generally, some principles and recommendations on how to design and carry out benchmarking have been used consistently across all studies, but there is less consistency for some other methodological aspects: • There appears to be a consensus that population benchmarks should come from high-quality external data sources, such as large-scale national government/federal surveys (e.g., Lavrakas et al., 2022; Yeager et al., 2011), censuses (Kaczmirek et al., 2019; Lavrakas et al., 2022), or government administrative data such as data on driver’s licenses (Yeager et al., 2011) or data on electoral enrollment (Lavrakas et al., 2022). • In the best-case scenario, benchmarks would be selected from the available high-quality sources with a certain level of randomness (Yeager et al., 2011). • Benchmarks from “gold standard” surveys are predominantly selected based on their availability and/or convenience, which is often a result of designing a benchmarking study after having already collected survey data; also, some studies can be replications of past benchmarking studies – in Australia, Lavrakas et al. (2022) and Kaczmirek et al. (2019) replicated a U.S.-based benchmarking study (Yeager et al., 2011) and thus selected very similar benchmarks and categories. • Items likely to be subject to measurement error, such as satisficing or social desirability, should be avoided in benchmarking studies (Dutwin & Buskirk, 2017). • There is no consensus on the survey item categories to choose for benchmarking analysis and two different approaches have been used in practice for nominal and ordinal variables with 3+ categories: (1) using all categories in the calculation of error (e.g., Chang & Krosnick, 2009), (2) using the modal category only (e.g., MacInnis et al., 2018), but both approaches are rarely used in the same study; for example, Yeager et al. (2011) applied the second approach but confirmed that the first approach would have led to the same conclusions. • The majority of benchmarking studies approached weighting in a similar manner by presenting both weighted (post-stratification/calibration) and unweighted results, while Dutwin and Buskirk (2017) also presented results with nonprobability samples after propensity scoring and matching. • A number of different benchmarking measures have been used to compare accuracy, such as average absolute error (AAE; e.g., Yeager et al., 2011), standard deviation of the AAE, maximum AAE (Dutwin & Buskirk, 2017), ranking of AAE, number of statistically significant differences from benchmarks (e.g., Lavrakas et al., 2022), and root mean squared error (RMSE) (MacInnis et al., 2018).
Following these recommendations and partially replicating the study by Lavrakas et al. (2022), I designed a benchmarking study to assess the accuracy of my RDD text-to-web approach to survey data collection, as described in Methods below.
Methods
In this section, the methodological aspects are presented, including the studied population, sampling, data collection specifics, and benchmarking principles.
Data
As this is a benchmarking study, survey sample data, reference survey sample results, and different high-quality representative sources of benchmarks are used. This means that the data are analyzed from the following:
Unit record data, the main subject of this methodological research
The RDD text-to-web survey data (2020) are the main subject of this study. The aim of this project was to assess the accuracy of this less commonly used mixture of approaches to data collection. Data were collected in November 2020 using the web survey mode. Randomly selected respondents (single frame RDD) received a text message (SMS) to their mobile devices with a URL link to a web questionnaire (text-to-web). The web Survey on Wellbeing, Health and Life in General 2020 questionnaire included a range of questions about people’s lives and covered a total of 26 secondary demographics and non-demographic variables, 6 with corresponding benchmarks from nationally representative sources presented below (see Table B1 in Appendix B). The total sample size was 632 respondents, and the final AAPOR Response Rate 2 (RR2) (The American Association for Public Opinion Research, 2016) was 1.6%. The median response time was 8 min, which is about the ideal web survey length (Revilla & Ochoa, 2017).
Reference sample estimates
RDD text-to-web sample and AOPBS samples.
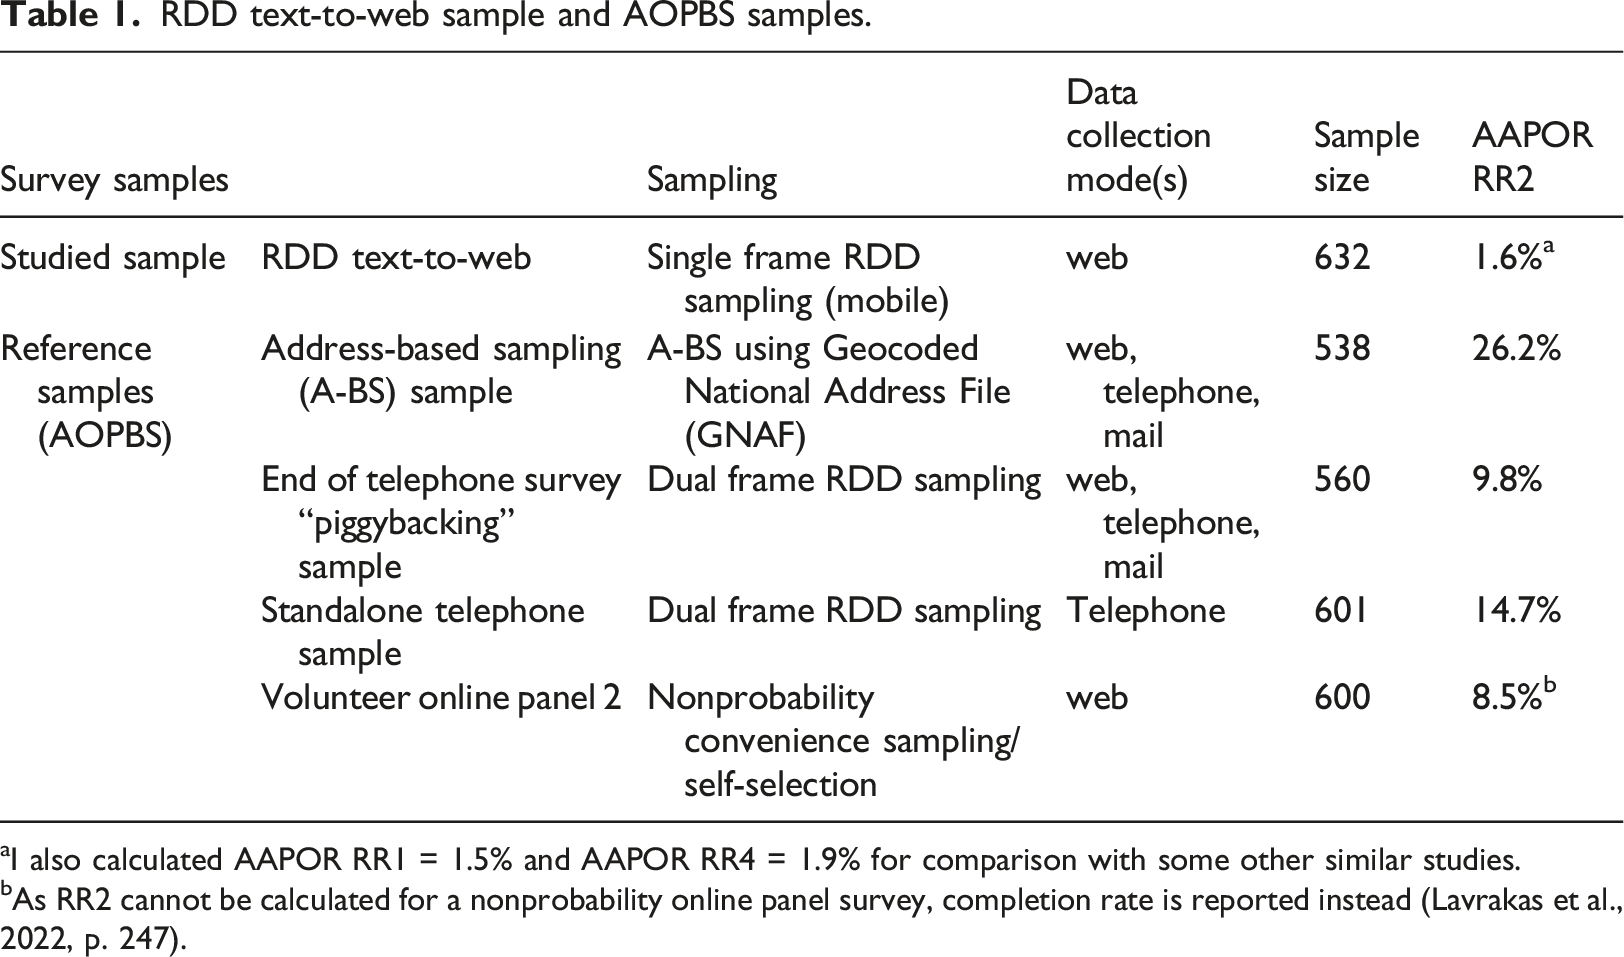
aI also calculated AAPOR RR1 = 1.5% and AAPOR RR4 = 1.9% for comparison with some other similar studies.
bAs RR2 cannot be calculated for a nonprobability online panel survey, completion rate is reported instead (Lavrakas et al., 2022, p. 247).
Nationally representative benchmarks
Benchmarks were taken from National Health Surveys 2014–2015 and 2017–2018, National Drug Strategy Household Surveys 2013; 2019, Australian Censuses 2011; 2016, General Social Survey 2014; 2019, and the Household, Income and Labour Dynamics Australia (HILDA) Release 18 data (Waves 17 and 18). 8 These are generally considered as the highest quality nationally representative surveys as sources of benchmarks (Lavrakas et al., 2022). For more information, see Table B1 in Appendix B.
Population
The population in the RDD text-to-web survey and AOPBS surveys was defined as “Australian residents aged 18 or older.” The benchmarks from high-quality surveys were also calculated for the adult population of Australia, excluding residents younger than 18 years of age for comparability purposes. In the case of the Australian Censuses, every person in Australia on Census Night was enumerated (Australian Bureau of Statistics, 2016).
Sampling
The RDD text-to-web survey sample was in principle selected using RDD of mobile numbers (i.e., single frame RDD mobile sampling, see Table 1). In Australia, 62 million mobile number combinations are allocated to Vodafone, Optus, and Telstra as the commercial mobile service providers. Taking into account that the population size was approximately 25.7 million in June 2020 (Australian Bureau of Statistics, 2016) and that some Australian residents do not own a mobile phone (Morgan, 2018), only a proportion of the mobile numbers are active/live. Therefore, it was prudent to validate all mobile numbers before sending an SMS. This service was provided by SamplePages (2021) and the total sample size of the validated mobile numbers was 34,734.
The probability-based samples from AOPBS applied address-based sampling, RDD piggybacking and standalone RDD. The volunteer online panel 2 was recruited using nonprobability methods (for more information see Table 1).
For sampling information about the government-funded nationally representative data sources of benchmarks, please see Table B1 in Appendix B.
Benchmarking analysis
To analyze the accuracy of the RDD text-to-web survey, the most commonly used principles on benchmarking analysis are followed, which were carefully planned in the questionnaire design stage of this study. As the sample required reference samples to compare its accuracy with similar sampling and data collection approaches in Australia, many of those principles closely resembled the benchmarking design in AOPBS (Lavrakas et al., 2022). First, all benchmarks were from “gold standard” data sources funded by the Australian Government. Second, benchmarks were not chosen randomly – 14 out of 26 survey items matched the AOPBS survey items, and, as previously explained, the rest were carefully chosen from the high-quality data sources to expand the range of studied dimensions of peoples’ lives (i.e., personality traits, time stress, eating habits, exercising, and caring responsibilities; for a list of all benchmarks, see Table B1 in Appendix B). The number of benchmarked items was limited to not prolong the questionnaire, which was in line with recommendations from Revilla and Ochoa (2017), to not risk an even lower response rate. The modal category for non-binary categorical variables was used to present both weighted
9
and unweighted results. Among all the benchmarking measures proposed in the literature, the AAE from Yeager et al. (2011) was used as it is arguably the most used measure in practice, and RMSE from MacInnis et al. (2018) was calculated as presented below (see Equations (1) and (2))
The errors were calculated separately for RDD text-to-web and AOPBS surveys using benchmarks for the same concepts but from different sources as there was a 5-year gap in data collection periods (e.g., AOPBS source: National Health Survey 2014–15, RDD text-to-web source: National Health Survey 2017–18). Reviewing changes in estimates from nationally representative data sources proved that this was necessary to decrease bias. For example, based on the Australian Census 2011; 2016 data, the proportion of Australian citizens increased from 83.9% to 87.1%. The errors were then combined into sample-level measures AAE and RMSE scores for the matching items.
Separately, AAE and RMSE scores were calculated for the RDD text-to-web survey for all 26 items (including 12 that were not matching the AOPBS survey items). To extend the findings, these items were subsequently classified into three groups: (1) socio-demographics (eight items), (2) attitudinal and opinion-based items (12 items), and (3) behavioral items (six items), and their accuracy was compared.
Practical considerations in surveys combining RDD sampling, SMS invitation, and web data collection
Methodological considerations
As described in the Methods section, not all mobile numbers generated with RDD are, in fact, active. In Australia, I estimated that about one-third of all possible combinations were active/live mobile numbers, even after excluding spare mobile numbers, numbers allocated to satellite phones and rail corporations. This was later confirmed by SamplePages. A similar issue with a large proportion of unassigned mobile numbers was previously reported by Bucher and Sand (2022), while Kim and Couper (2021) estimated that the proportion of invalid RDD-generated mobile numbers in South Korea was only 17%.
For texting cost implications, ideally all RDD-generated numbers should be validated with solutions such as “pinging” 10 or matching them to a database of active mobile numbers. In Australia, survey sample providers such as SamplePages can validate the generated mobile numbers using their database. It is worth noting that pinging also validates mobile numbers belonging to residents younger than 18 years, in contrast to matching. Mobile numbers from Kim and Couper’s (2021) study were screened by trained operators to remove business and nonworking numbers, while Bucher and Sand (2022) reported encountering substantial challenges when attempting to verify the status of mobile phone numbers through querying Home Location Register (HLR) database. Additionally, they faced a large proportion of undelivered SMSs. These findings suggest that mobile number validation methods vary across countries and are not all equally effective.
Moreover, in countries such as Australia, Germany and South Korea, mobile numbers do not include any geographical area information. Even in the United States, telephone number portability makes determining state of residence unreliable based on area codes (Kim & Couper, 2021). While the availability of a similar data source was not reported for Germany and South Korea (see Bucher & Sand, 2022; Kim & Couper, 2021), using a database that includes geo-demographic information (such as region, age group, and sex) enables stratified random sampling in Australia. However, databases of survey sample providers do not necessarily consist of all active mobile numbers of the studied general population; at the end of 2020, it was estimated that the SamplePages database included about 22% of all active Australian mobile numbers, or about 24% of all active mobile numbers belonging to the Australian adult population. It could be argued that the excluded adult population (76%) might be somewhat different than the included adult population (24%), and that the proposed RDD-sampling approach is fundamentally not RDD but rather simple random sampling or stratified random sampling from the SamplePages database as the sampling frame.
In this study, I also identified opportunities for end-of-survey recruitment with RDD sampling SMS invitations, either to a probability-based online panel or to follow-up surveys on the same or different topics, including those using a longitudinal format. At the end of the survey, respondents were asked if they could be recontacted in the future, and 57% were willing to be invited to participate in future survey research studies. As previously noted, RDD sampling SMS recruitment to a probability-based online panel was already tested with two different recruitment efforts in Australia after this study was conducted (i.e., ANU/ACSPRI panel, Hahn & Biddle, 2022, and Life in Australia™, Phillips et al., 2021).
Technical considerations
Besides mobile number validation, text-to-web recruitment and subsequent survey data collection normally require a text messaging service/function, a URL shortener, and an online data collection tool. If a research organization does not use a platform including all these solutions (e.g., Qualtrics with all required XM licenses), standalone functions can be used.
In addition to a standalone online data collection tool, I used an online interactive mobile messaging service Cellcast for sending SMS invitations, but there are many other messaging services to pick from. Besides standard text messaging, the Cellcast platform allowed me to: (1) identify sampled people who unsubscribed after receiving an invitation SMS, 11 (2) receive return texts, either feedback or requests for information, and (3) organize “responsive” SMS invitations, that is, sending questionnaire URL in the second SMS only if respondents agreed. Kim and Couper (2021) reported using a commercial text messaging service that offered detailed information about the delivery status of SMSs, a functionality that was not available in Cellcast. These mobile messaging solutions are important as they have both ethical and cost implications.
One other messaging function that was not tested in this study was “Custom Sender ID.” It replaces a virtual mobile number (e.g., 0440 000 001) with a sender’s name, which is displayed to recipients above the invitation SMS (e.g., ‘The Australian National University’) (Cellcast, n.d.). Using that function should build trust with respondents, which would ideally reflect in higher unit response rates and lower breakoff rates.
Moreover, a URL shortener (in my case cuttly, n.d.) was used for two purposes: (1) to shorten the questionnaire link, which allowed me to include more content within 160 characters (also reported by Bucher and Sand [2022] to lower the cost of texting), and (2) for link-click analysis, which helped track the effectiveness of SMS content and the relationship between link clicks and questionnaire completes. For example, only about 1 in 10 SMS recipients clicked on the URL in the text message.
Ethical considerations
Text messaging as an interview mode can be considered as more intrusive compared to some other contact modes, such as email, mail/postal or even telephone calls. This can partially be explained by text message surveys and text-to-web surveys being less common, which results in SMS recipients being unfamiliar with this approach to survey data collection. Sampled respondents often cannot distinguish between bulk marketing text messages and survey invitation text messages, both of which are, technically, a form of “mass messaging.” These conclusions are based on the received feedback – since respondents in the RDD text-to-web survey were able to text back and their SMSs were presented in the Cellcast platform, I was able to track their reactions. Some of them did not believe that the SMS invitation indeed came from The Australian National University, some did not believe they would receive incentives if they participated, and others were wondering how we got their mobile number, which showed a lack of familiarity with RDD. For those and other reasons, about 13% of all recipients unsubscribed after receiving an SMS invitation/reminder to the survey.
It can be argued that for the reasons listed above, prior consent to text SMS survey invitations is required in many countries. The literature suggests that this is the case in the United States (Fordyce et al., 2020) and in many European countries (Kongsgard et al., 2014), while in Germany (Bucher & Sand, 2022), South Korea (Kim & Couper, 2021) and Australia (Hahn & Biddle, 2022; Phillips et al., 2021), no prior consent was required by law. However, in Australia, survey sample providers such as SamplePages manage a “blacklist” of telephone numbers that cannot be included in research lists, and text messaging service providers like Cellcast require each SMS to include “unsubscribe” instructions/link, which can in practice have both coverage and cost implications.
Cost considerations
Despite a very low overall response rate, the survey was generally very cost-effective, which aligns with findings from previous studies (Bucher & Sand, 2022; Hahn & Biddle, 2022; Kim & Couper, 2021; Phillips et al., 2021). For about 3,000 AUD excluding personnel time (or about 2,200 USD at the time the survey was conducted), I collected data from 632 respondents, which corresponds to 4.75 AUD per completed questionnaire. By using an experimental survey design, I identified several response maximization methods and techniques (e.g., an advanced SMS), which could decrease the costs to 2.5–3.0 AUD per completed questionnaire (Kocar, 2022). Data collection expenses from my study compare favorably to the cost per completed questionnaire reported by Kim and Couper (2021) and even to some nonprobability surveys. 12 It would be worth exploring if a function such as Custom Sender ID, which increases texting cost by 30% relative to a standard SMS in Cellcast, offers better cost-benefit balance or even mitigates representation bias.
Accuracy in the RDD text-to-web survey
In this section, the results of the benchmarking analysis with the RDD text-to-web survey sample and four AOPBS samples are discussed. To compare the overall accuracy, AAE and RMSE scores (based on 14 matching items) were first calculated for all samples. The results are presented in Figure 1. For individual estimates and benchmarks, see Table C1 in Appendix C. AAE and RMSE scores for RDD text-to-web and AOPBS samples (14 items). *AAE: average absolute error; RMSE: root mean squared error; UW: unweighted; W: weighted; RDD: random digit dialing; AOPBS: Australian Online Panels Benchmarking Study; A-BS: address-based sampling.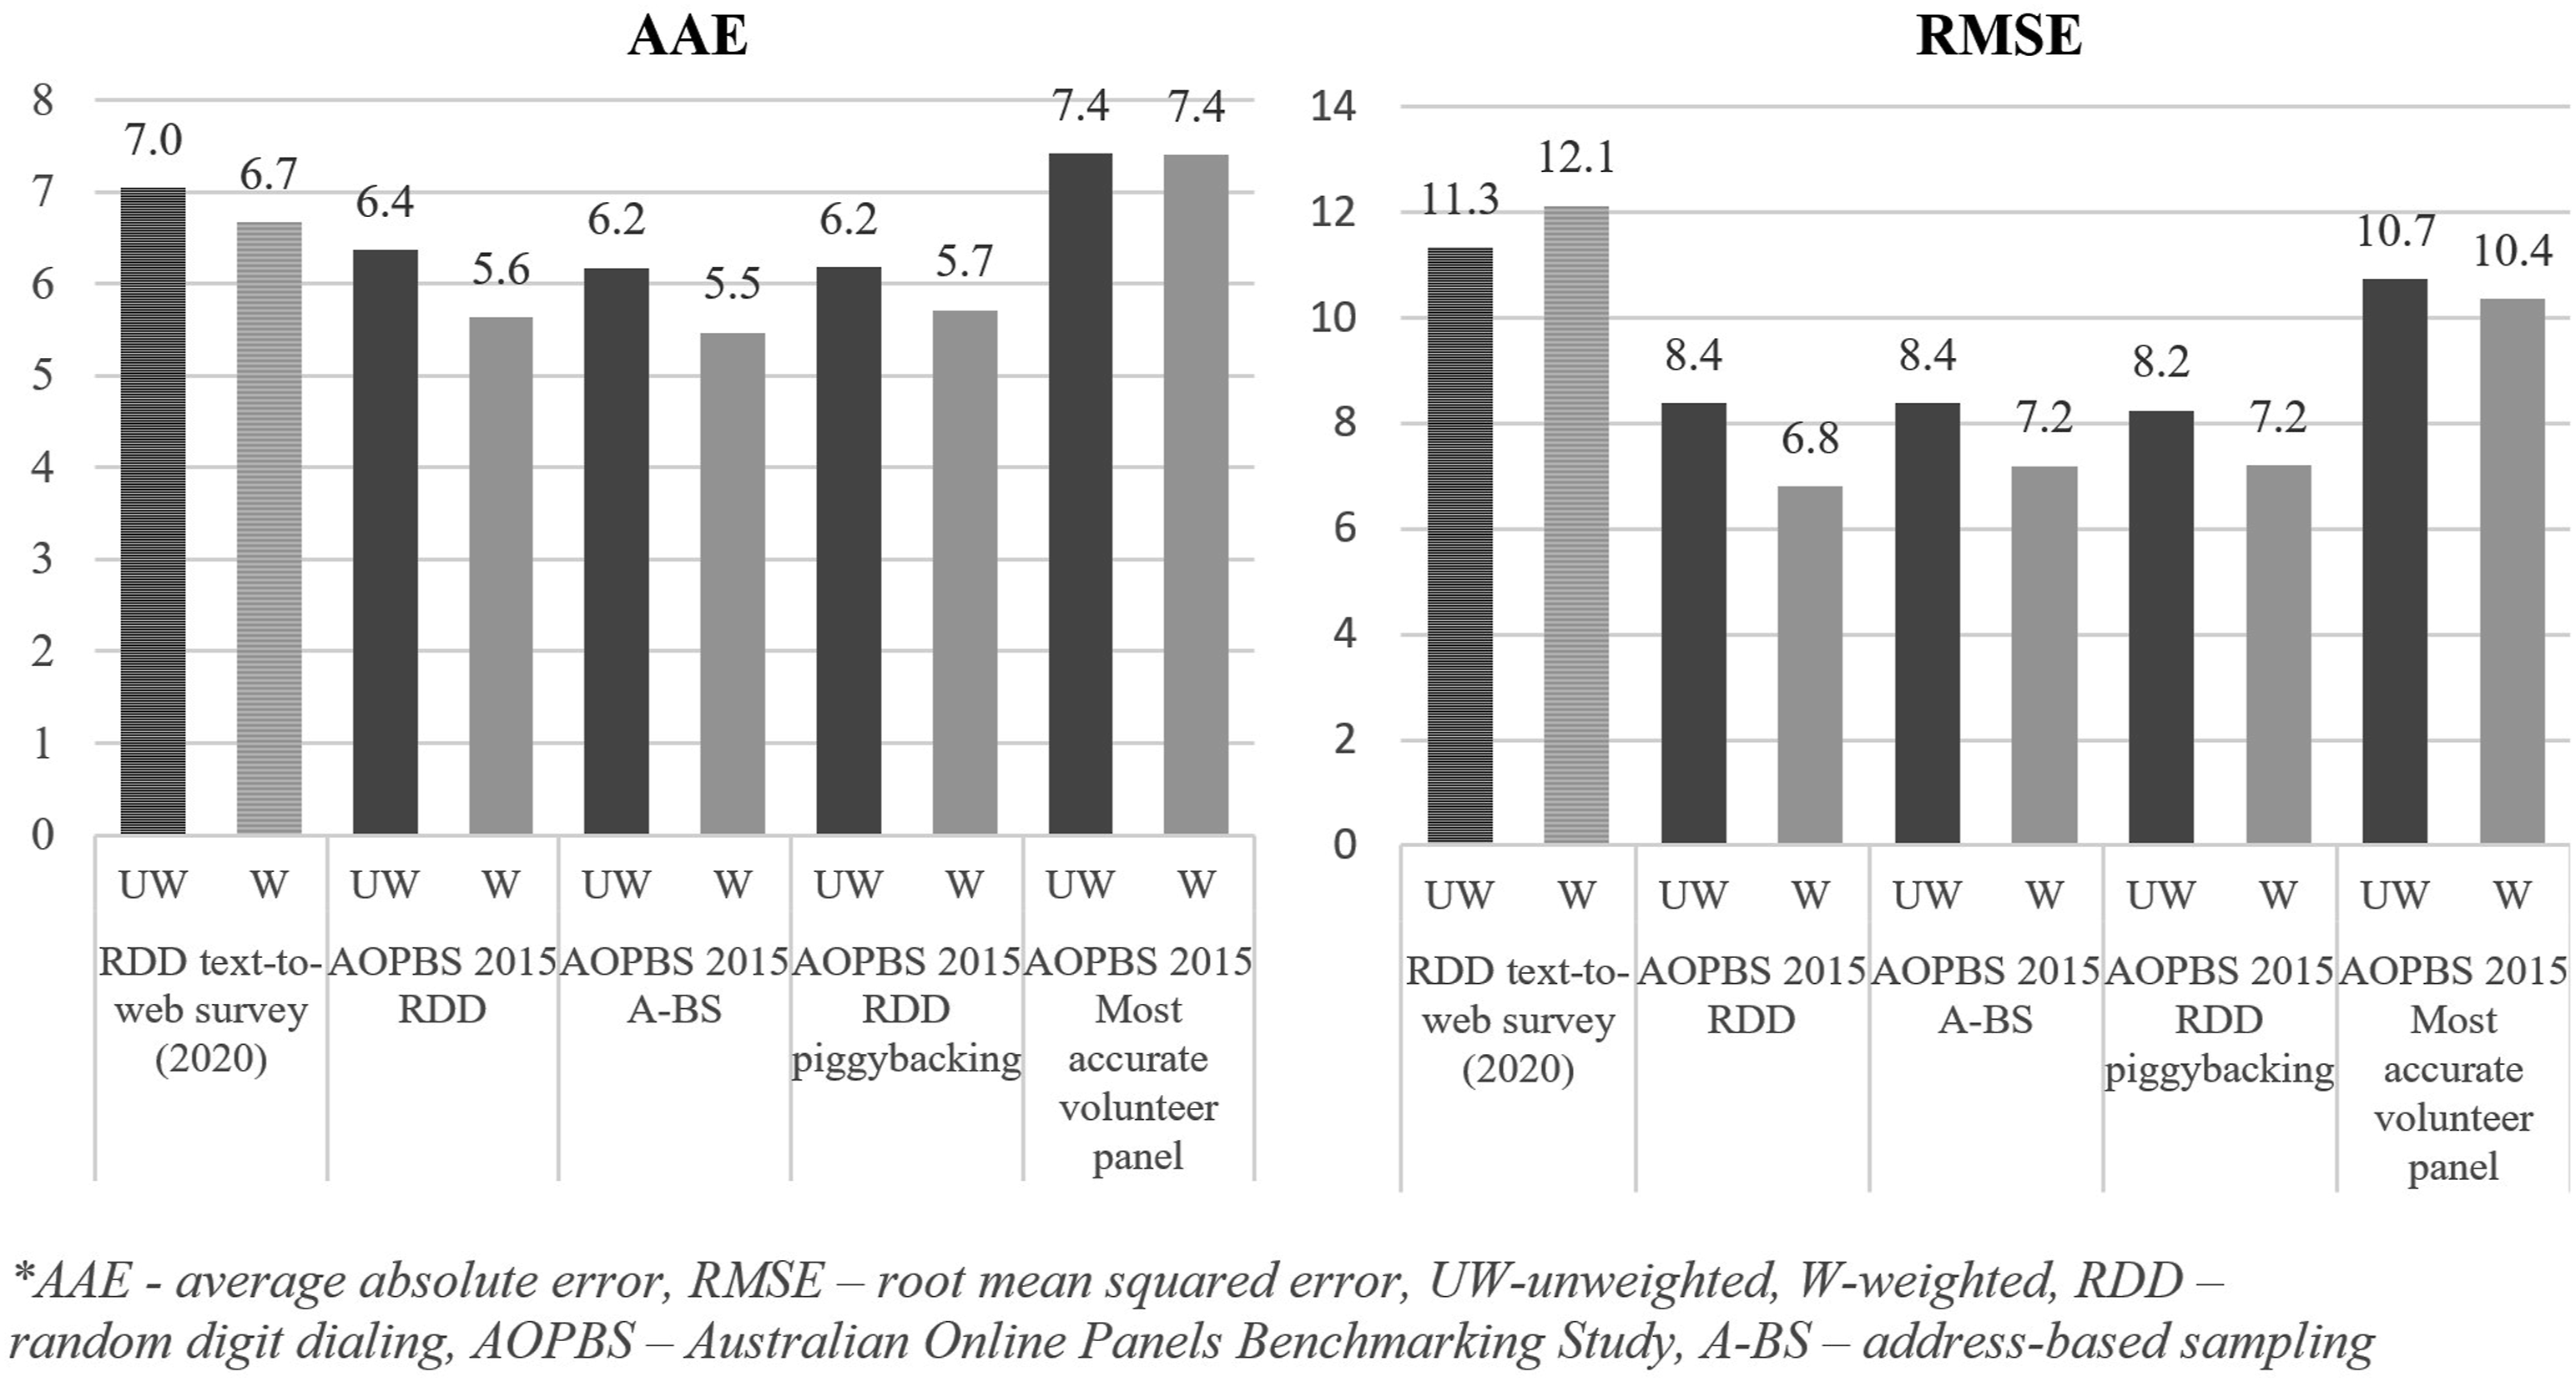
The analysis offered some interesting evidence on the accuracy of different surveys. First, RDD text-to-web appears to be a survey approach collecting data of a similar quality to other cross-sectional probability-based surveys, as well as the most accurate volunteer panel. The AAE for unweighted RDD text-to-web estimates was between .6 and .8 larger than for the probability-based AOPBS samples and .4 smaller than for the most accurate volunteer panel (however, the differences were not statistically significant). Moreover, weighting improved the overall accuracy of the AOPBS sample estimates, only slightly improved the overall accuracy of the RDD text-to-web estimates, but it did not improve the overall accuracy of the most accurate volunteer panel data. These changes increased the gap in accuracy (1) between the AOPBS probability samples and the RDD text-to-web sample (to between 1.0 and 1.2), and (2) between the RDD text-to-web sample and the nonprobability sample (to .7).
The RMSE measure for AOPBS items, both weighted and unweighted, provided additional and slightly different evidence. As the measure penalizes samples with larger single-item errors, the RDD text-to-web sample was no longer as accurate as the AOPBS probability samples; it was about as accurate as the volunteer panel sample. A detailed review of survey estimates as contributors to the total RMSE score highlighted Psychological distress – Hopeless 13 as the item significantly increasing the RMSE score for RDD text-to-web and volunteer samples (see Table C1 in Appendix C). As my sample was the most accurate of all analyzed samples for 7 out of 14 matching survey items, excluding the Kessler 6 indicator would result in the RDD text-to-web sample having the lowest average error (AAE and RMSE). There could be two explanations for the very inaccurate measurement of psychological distress with this sample: (1) the sample was, in that regard, more similar to nonprobability-based data, which generally over-estimate psychological distress in the general population (see Lavrakas et al., 2022); and (2) an effect of the COVID-19 pandemic on mental health in 2020 (see Biddle & Gray, 2021). Most probably, these two factors and the adjustment error were combined into a large individual-item error for the psychological distress item. Unfortunately, the results can only be interpreted in terms of absolute error, and one cannot disentangle the contribution of representation error (coverage and nonresponse bias), changes of population statistics over time, or even measurement error.
Moreover, the additional 12 estimates for RDD text-to-web (i.e., those not matching any AOPBS items) provided further evidence on representation bias, which is presented as AAE and RMSE scores in Figure 2. The results show that: (1) the AAE and RMSE scores for all 26 items are slightly larger than for 14 AOPBS items, (2) weighting decreased the AAE score for 26 items combined as well, but not much,
14
and (3) there were additional highly inaccurate estimates among the added 12 items, which further increased the RMSE score. AAE and RMSE scores for RDD text-to-web (14 AOPBS items and all 26 items). *UW: unweighted; W: weighted; AAE: average absolute error; RMSE: root mean squared error; AOPBS: Australian Online Panels Benchmarking Study.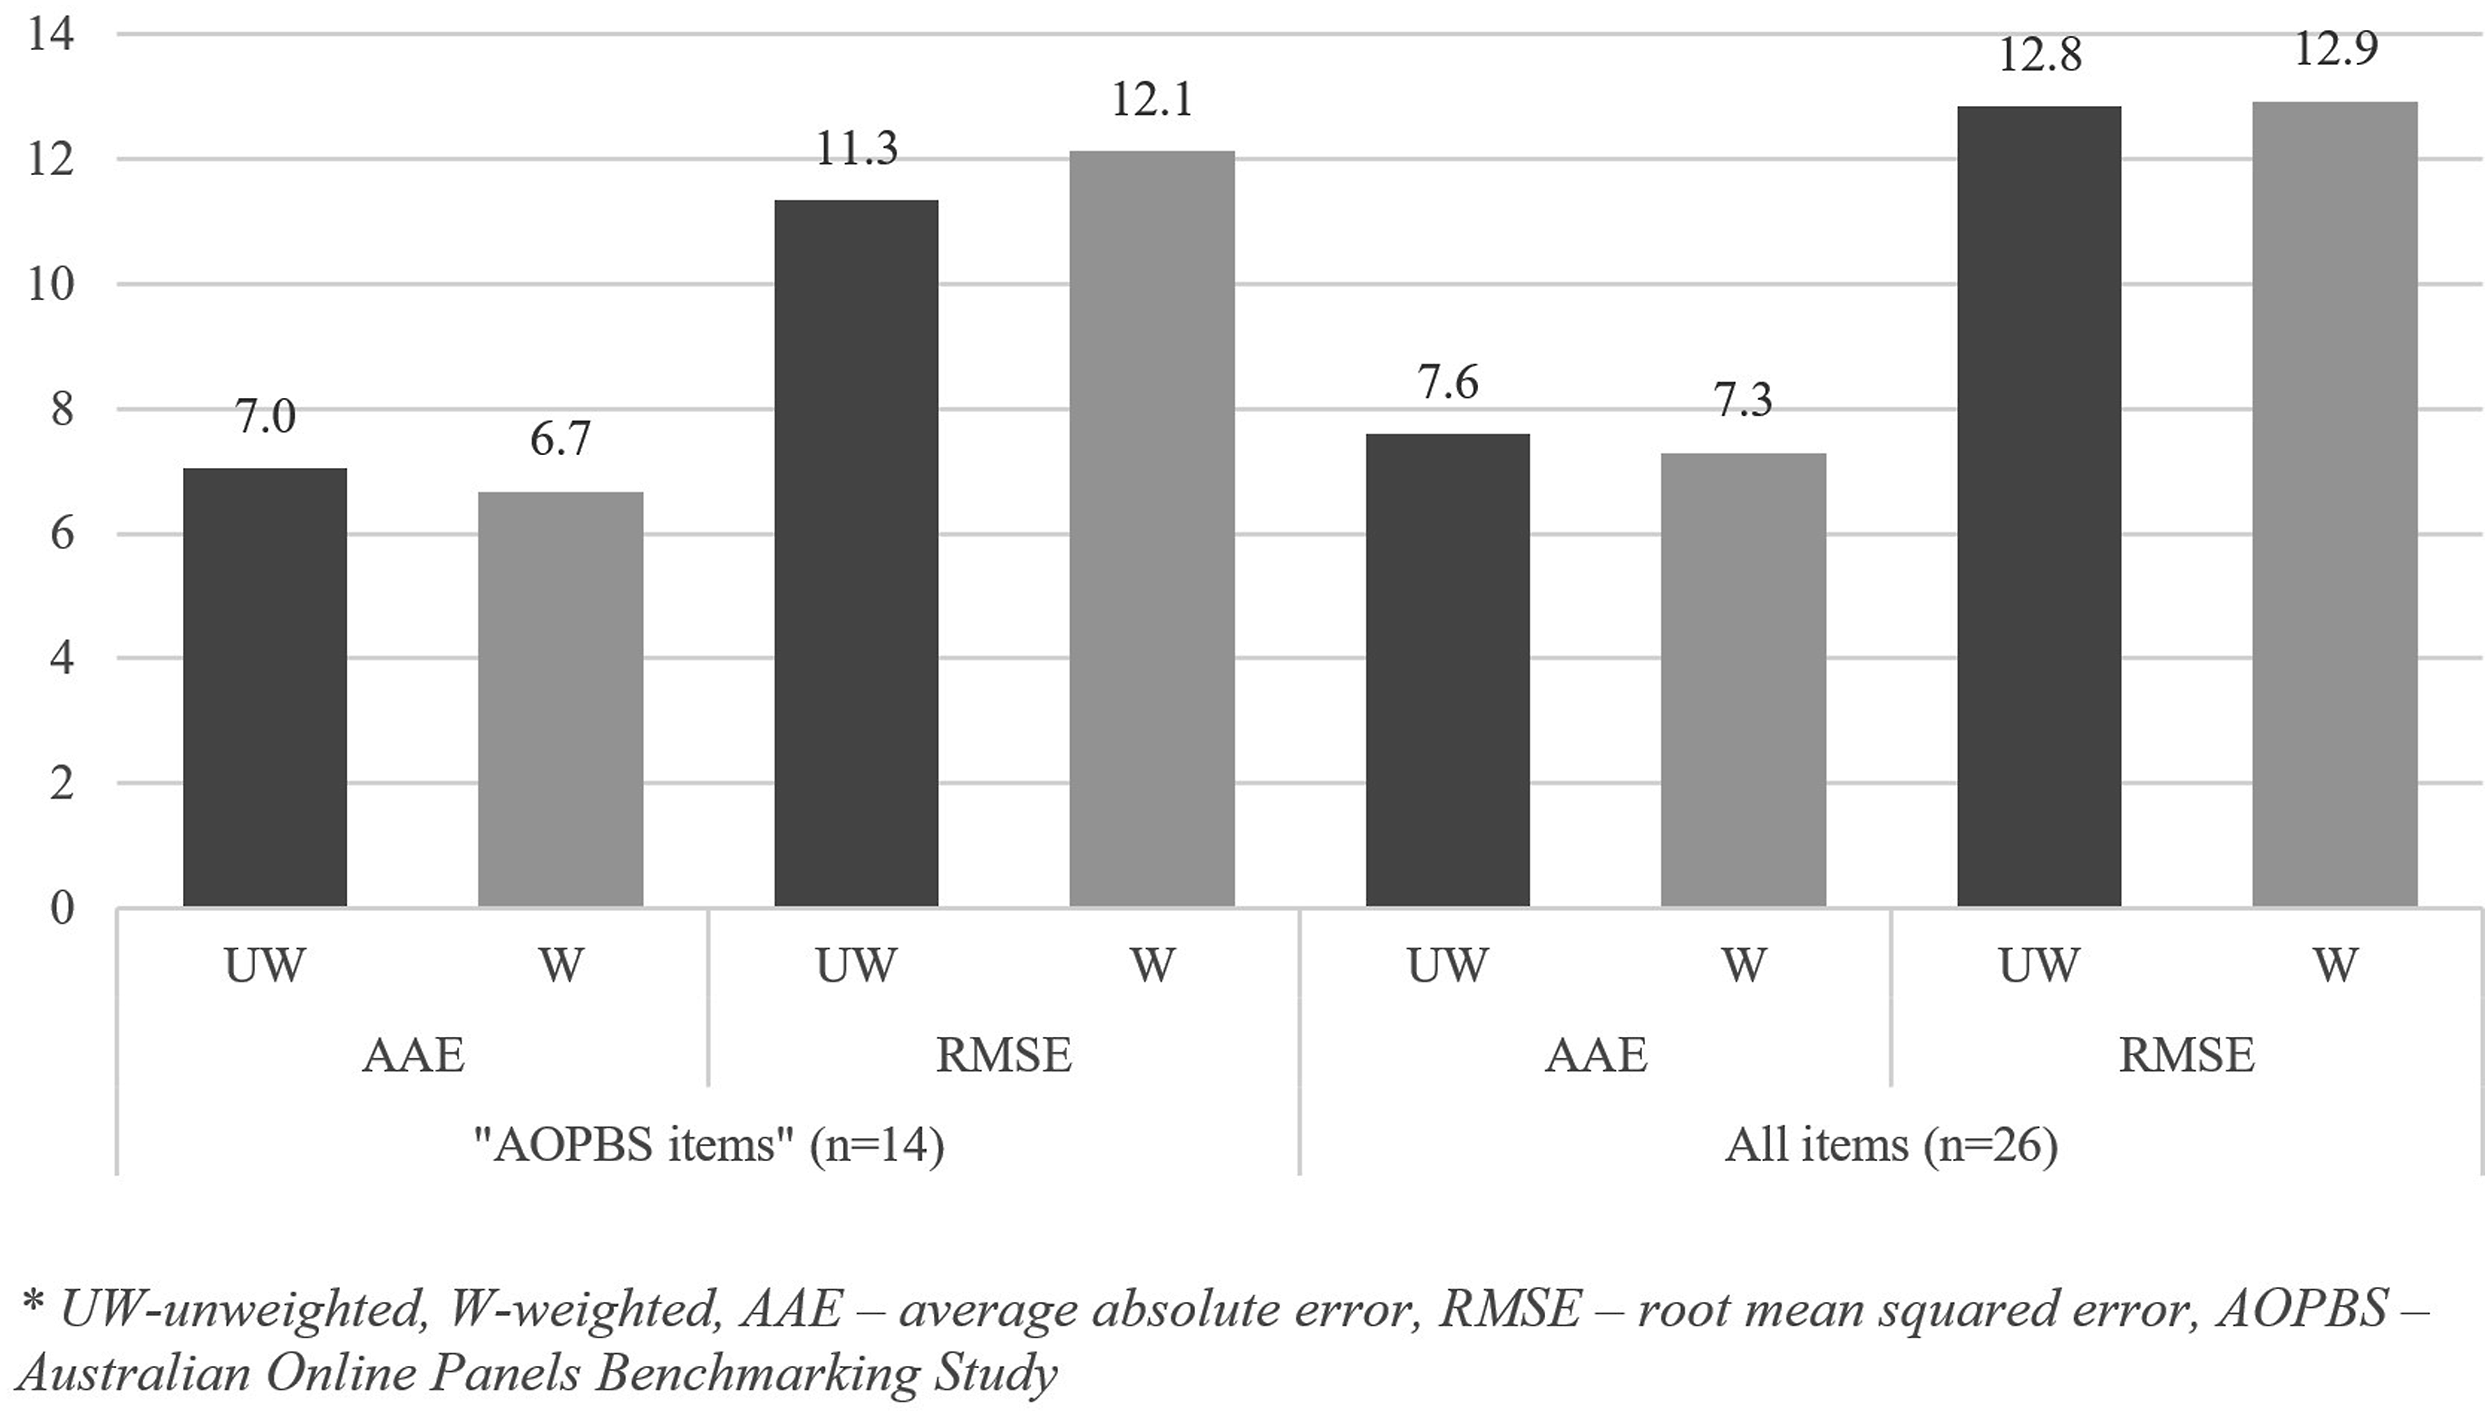
Also, as one of the main contributions of this study was to establish the accuracy of RDD text-to-web in measuring non-demographic items, all 26 survey items were classified into three categories. The evidence suggests that socio-demographics are measured with notably better accuracy than attitudes and opinions using RDD text-to-web, while the largest errors (reflected in both AAE and RMSE scores) have been found for behavioral items (see Table C1 in Appendix C). For that reason, I closely examined the individual estimates, particularly those pertaining to behaviors, and reached practical conclusions.
The additional item-level analysis identified two items with very large errors. The first one was carer status. In all AOPBS probability samples and the RDD text-to-web sample, volunteering was over-estimated by approximately 100% (relative to the Australian Census 2011; 2016 benchmarks), and in the sample used in this study, caring was over-estimated by more than 150% (after raking). What is common in those concepts is altruistic motivation, which is evident in activities helping other people. It can be argued that survey participation for no or very small financial benefit can be categorized under the umbrella of altruistic acts. Consequently, it seems that non-government probability-based surveys with low response rates generally introduce large nonresponse bias for items measuring any type of altruistic behavior.
The second item with an even larger error was moderate exercise in the last week. After a thorough review of potential sources of bias, it can be concluded that the term “moderate” exercise was interpreted incorrectly by a large portion of respondents, although the wording of the original question had not been changed. The estimate from the RDD text-to-web survey was much closer to an estimate from the National Health Survey (NHS) 2017–2018 for both walking and moderate exercise (such as playing golf) combined. In the NHS questionnaire, respondents were first asked about walking, including its frequency and time spent, which was followed by instructions to exclude any walking when answering the subsequent questions on moderate exercise. This is something that would be challenging to incorporate fully in a short smartphone survey. However, including a question without the required introduction and a proper definition (except for “e.g., gentle swimming, social tennis, golf”), the result was a large measurement error related to the questionnaire and question design, as well as a potential interviewer effect (NHS was interviewer-administered).
Discussion
This study demonstrated the applicability of a RDD text-to-web approach to data collection as an alternative to both less cost-effective “traditional” probability survey methods, and less accurate nonprobability online panels. Importantly, it discussed the approach from five different perspectives: methodological, technical, ethical, cost, and accuracy. Based on my experience with conducting a survey of this type, as well as by integrating findings reported in other studies (Bucher & Sand, 2022; Kim & Couper, 2021), I can conclude that arguably the most important methodological and technical solutions include the following: 1. using a reliable mobile number verification approach, such as matching mobile numbers with those from a sample provider’s database or screening by trained operators (for cost, response and, if applicable, stratification purposes) 2. using a text messaging service that offers multiple functionalities, including return texts and responsive messaging features (to receive feedback and to build trust) 3. using a URL shortener (including for link-click analysis) 4. carrying out survey experiments (to determine the most effective ways of collecting data from the cost-benefit perspective, also due to a lack of existing evidence).
Nevertheless, there are different ethical constraints in different countries, which should be carefully considered by market, public opinion and other social research organizations when designing a survey of this type.
The findings on the accuracy of the RDD text-to-web survey offer valuable insight on the usability of cost-effective probability-based web survey data collection. Importantly, this study is the first to comprehensively investigate the accuracy of attitudinal, opinion-based, and behavioral estimates in a survey of this type. It employs a benchmarking approach, in contrast to previous studies that focused on presenting differences in those estimates between surveys conducted using RDD text-to-web and an alternative mode, employing an “effects of mode” approach. One key aspect of any RDD text-to-web study with a potential effect on accuracy is (non)response. The final AAPOR RR1 of 1.5% was much lower than the response rate from the study conducted in South Korea (AAPOR RR1: 5.3% [Kim & Couper, 2021]). The low response rate in my study may be partially explained by generally lower response rates during the COVID-19 pandemic (see, e.g., Krieger et al., 2023), which were also a result of an increasing number of surveys and participant fatigue (see, e.g., De Koning et al., 2021). However, the final response rate in my study was still twice as high as in the study conducted in Germany (AAPOR RR1: .8% [Bucher & Sand, 2022]). Due to a low response rate, the effects of a digital divide (Couper, 2017), and excluding the offline population and people without smartphones, one could expect lower accuracy than reported in this study. The differences in non-demographic estimates between telephone samples (AOPBS) and RDD text-to-web were generally not as substantial as in the study from Kim and Couper (2021), which indicates that the effects of mode might be less substantial in Australia than South Korea. Also, the sample proved to be slightly more accurate than the most accurate volunteer panel from AOPBS (based on calculations by Lavrakas et al., 2022, p. 265) and slightly less accurate than the probability AOPBS samples. This is somewhat consistent with the findings of Couper et al. (2017) and Antoun et al. (2019) on undercoverage bias and nonresponse bias in mobile and smartphone surveys.
Nevertheless, most of the gaps in accuracy between my RDD text-to-web sample and the AOPBS probability samples could potentially be explained with the effect of a social, economic, and health crisis on one particular estimate. Higher levels of self-reported psychological distress were consistent with findings from Biddle and Gray (2021) who saw an increase in average psychological distress in Australia in 2020, which also fluctuated substantially over time. An increase in the average K-6 score was even more substantial among respondents younger than 45 years of age. This age group is generally under-represented in most probability samples, including my RDD text-to-web study. Thus, they received larger weights, which resulted in more deteriorated estimates of psychological distress after raking and a greater impact on AAE, and especially RMSE scores. Furthermore, it is important to note that socio-demographic estimates exhibited significantly higher accuracy compared to non-demographic estimates (i.e., attitudes, opinions, and behaviors), consistent with findings from studies establishing the accuracy of probability and nonprobability samples (e.g., Lavrakas et al., 2022). This highlights the significance of conducting this benchmarking study using a RDD text-to-web sample and non-demographic items with matching nationally representative benchmarks. It would be worthwhile to investigate in future research the influence of variable selection, encompassing different aspects of people’s lives, on the outcomes of benchmarking studies. This exploration should not be limited to RDD text-to-web studies.
Taking into account cost and time efficiency of the proposed approach, including the possibility for a rapid data collection, as well as considering an absence of interviewer effect in comparison to telephone or face-to-face recruitment, I have to agree with Kim and Couper (2021) and Bucher and Sand (2022) that the studied approach presents a suitable alternative to a more traditional cross-sectional survey recruitment based on probabilistic principles. These include probability-based online panel surveys, telephone surveys, and interactive voice response surveys. Also, the data collected with RDD text-to-web were more accurate and cost-effective than the most accurate volunteer panel from AOPBS. It is of note that all nonprobability online panels from AOPBS were chosen based on strict criteria, including ISO 26362 accreditation, and complying with ESOMAR (i.e., 28 Questions to Help Buyers of Online Panels) (Lavrakas et al., 2022), and should represent some of the highest quality volunteer online panels in Australia. In line with the conclusions from Ilieva et al. (2002), market (and public opinion) research in particular would benefit from using an easy-to-implement and cost-efficient option for rapid survey data collection such as RDD text-to-web, which, at the same time, offers acceptable levels of accuracy.
Moreover, RDD text-to-web survey data collection certainly has the potential to be developed further. For example, it would be beneficial to determine the most effective response maximization by testing the approach after the COVID-19 pandemic, which might have influenced nonresponse error, as previously discussed. Additionally, future research can help identify other concepts and topics that cannot be measured accurately with the proposed data collection approach. These are associated with limitations of this study, which should also be recognized, both on how this survey was conducted and how benchmarking studies that compare the quality of samples are carried out in general. First, including a bigger sample and a wider range of (randomly selected) benchmarks from different topics could make my findings more robust. This is a limitation of most existing benchmarking studies to date (e.g., Dutwin & Buskirk, 2017; MacInnis et al., 2018). Second, the major influence of only one survey item from AOPBS on conclusions shows how important is the design of a benchmarking study. This was later confirmed by two other items that contained a significant error, but except within the sources of benchmarks, this study could not compare the estimates to the estimates of other probability and nonprobability surveys in attempts to disentangle coverage and nonresponse bias from measurement bias. This leads to the third and final point, which is that survey researchers investigating survey data quality would benefit from having a methodological framework for benchmarking analysis. The principles would guide researchers through the design of such a study, including what data sources of benchmarks to use, criteria for including benchmarks, investigated item categories (e.g., modal vs. all), and benchmarking measures.
Footnotes
Declaration of conflicting interests
The author(s) declared no potential conflicts of interest with respect to the research, authorship, and/or publication of this article.
Funding
The author(s) disclosed receipt of the following financial support for the research, authorship, and/or publication of this article: This work was supported by the Department of Education, Skills and Employment, Australian Government.
Notes
Australian online panels benchmarking study data,additional information
The AOPBS data are not the focus of this study but are used as reference samples as the accuracy of different probability and nonprobability surveys, as part of this study, have already been thoroughly investigated (see Kaczmirek et al., 2019; Lavrakas et al., 2022; Pennay et al., 2018). Instead, the AOPBS data are used to make comparisons in accuracy between the RDD text-to-web survey data and four AOPBS samples, relative to the nationally representative benchmarks.
For that purpose, all AOPBS estimates were taken from Lavrakas et al. (2022, pp. 263–264), except for estimates for one item, that is, Psychological distress, Kessler 6 – Hopeless. They were calculated using the same unit record file, as well as the calibration weight, as the authors of the study. 15 The single K-6 item benchmark was added from the National Health Survey 2014-15.
All AOPBS surveys which produced estimates used in this study, that is, RDD Standalone, RDD end-of-survey recruitment, Address-Based Sampling and Volunteer Panel 2 surveys, used the same Health, Wellbeing and Technology Questionnaire with a total of 13 secondary demographics and six non-demographic benchmarks. Volunteer Panel 2 was selected since its AAE scores for secondary demographics, both weighted and unweighted, were the lowest of all five AOPBS nonprobability panels (AAE weighted data = 4.93); it was followed by Panel 3 (AAE weighted data = 5.89), Panel 1 (AAE weighted data = 6.05), Panel 4 (AAE weighted data = 6.18) and Panel 5 (AAE weighted data = 6.84) (Lavrakas et al., 2022, p. 265).
Sources of benchmarks
Government funded nationally representative data sources of benchmarks.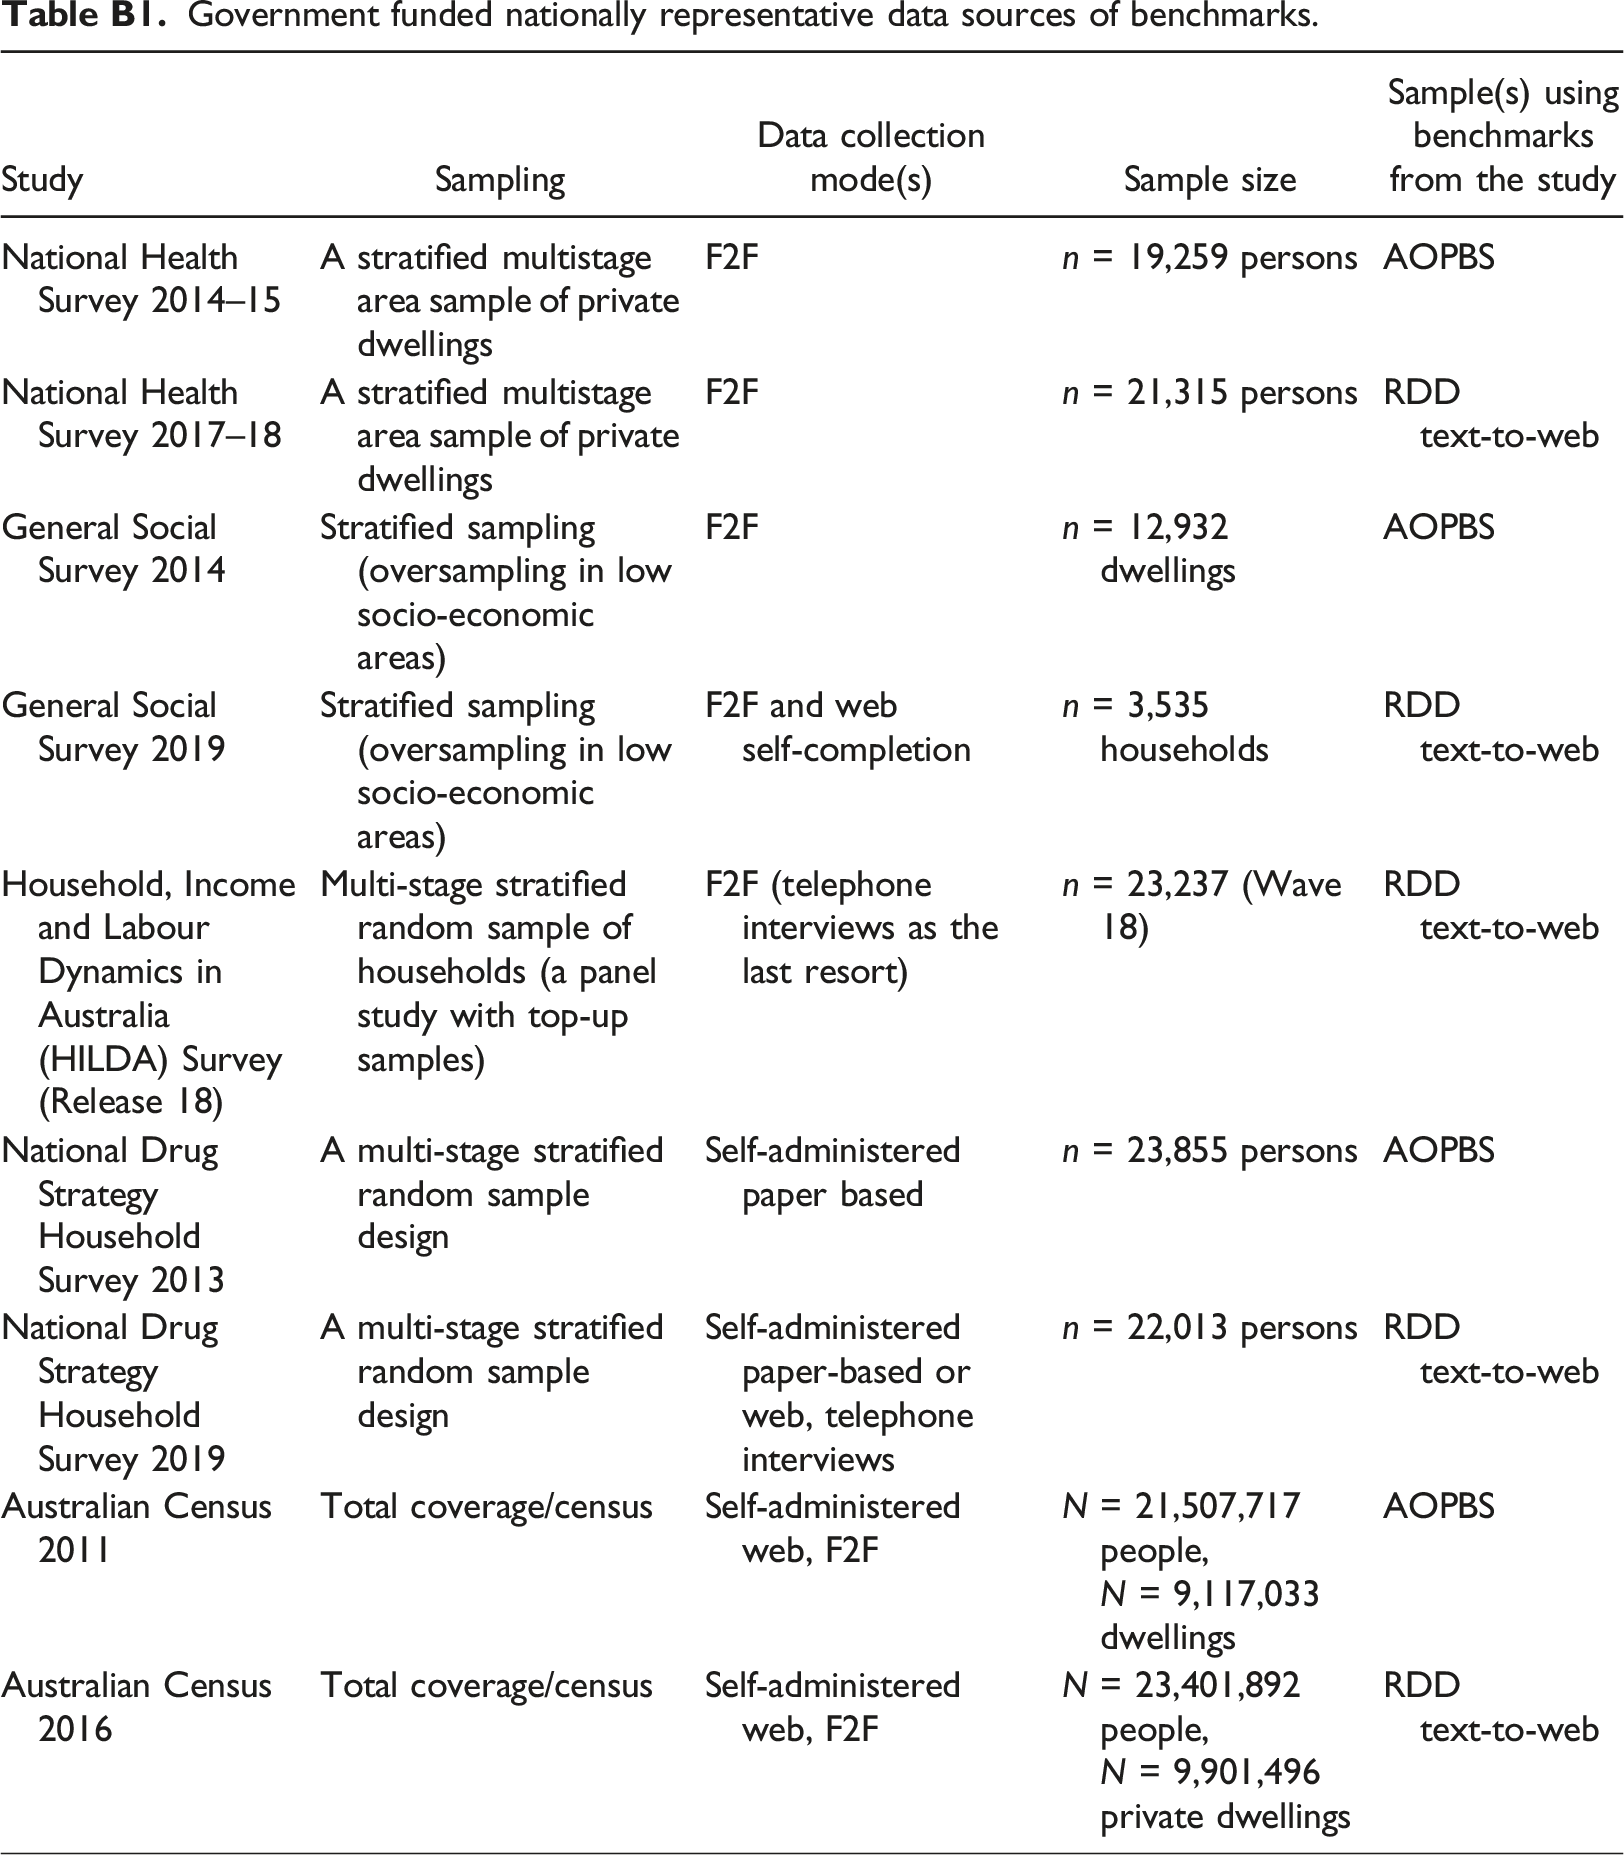
Study
Sampling
Data collection mode(s)
Sample size
Sample(s) using benchmarks from the study
National Health Survey 2014–15
A stratified multistage area sample of private dwellings
F2F
n = 19,259 persons
AOPBS
National Health Survey 2017–18
A stratified multistage area sample of private dwellings
F2F
n = 21,315 persons
RDD text-to-web
General Social Survey 2014
Stratified sampling (oversampling in low socio-economic areas)
F2F
n = 12,932 dwellings
AOPBS
General Social Survey 2019
Stratified sampling (oversampling in low socio-economic areas)
F2F and web self-completion
n = 3,535 households
RDD text-to-web
Household, Income and Labour Dynamics in Australia (HILDA) Survey (Release 18)
Multi-stage stratified random sample of households (a panel study with top-up samples)
F2F (telephone interviews as the last resort)
n = 23,237 (Wave 18)
RDD text-to-web
National Drug Strategy Household Survey 2013
A multi-stage stratified random sample design
Self-administered paper based
n = 23,855 persons
AOPBS
National Drug Strategy Household Survey 2019
A multi-stage stratified random sample design
Self-administered paper-based or web, telephone interviews
n = 22,013 persons
RDD text-to-web
Australian Census 2011
Total coverage/census
Self-administered web, F2F
N = 21,507,717 people, N = 9,117,033 dwellings
AOPBS
Australian Census 2016
Total coverage/census
Self-administered web, F2F
N = 23,401,892 people, N = 9,901,496 private dwellings
RDD text-to-web
Accuracy of Individual Items
Accuracy of RDD text-to-web sample in comparison to AOPBS samples. aSocio-demographic items. bAttitudinal and opinion-based items. cBehavioral items. Bench – benchmark, RDD text-to-web: from data collected as closely in time to 2020 as possible – Australian Census 2016, National Health Survey 2017-18, National Drug Strategy Household Survey 2019, HILDA Release 18 (2018), and General Social Survey 2019; AOPBS: from Lavrakas et al. (2022) – Australian Census 2011, National Health Survey 2014-15, National Drug Strategy Household Survey 2013; General Social Survey 2014; UW – unweighted, W – weighted (post-stratification). added from the National Health Survey 2014-15 (K-6 score from AOPBS was replaced with a single indicator).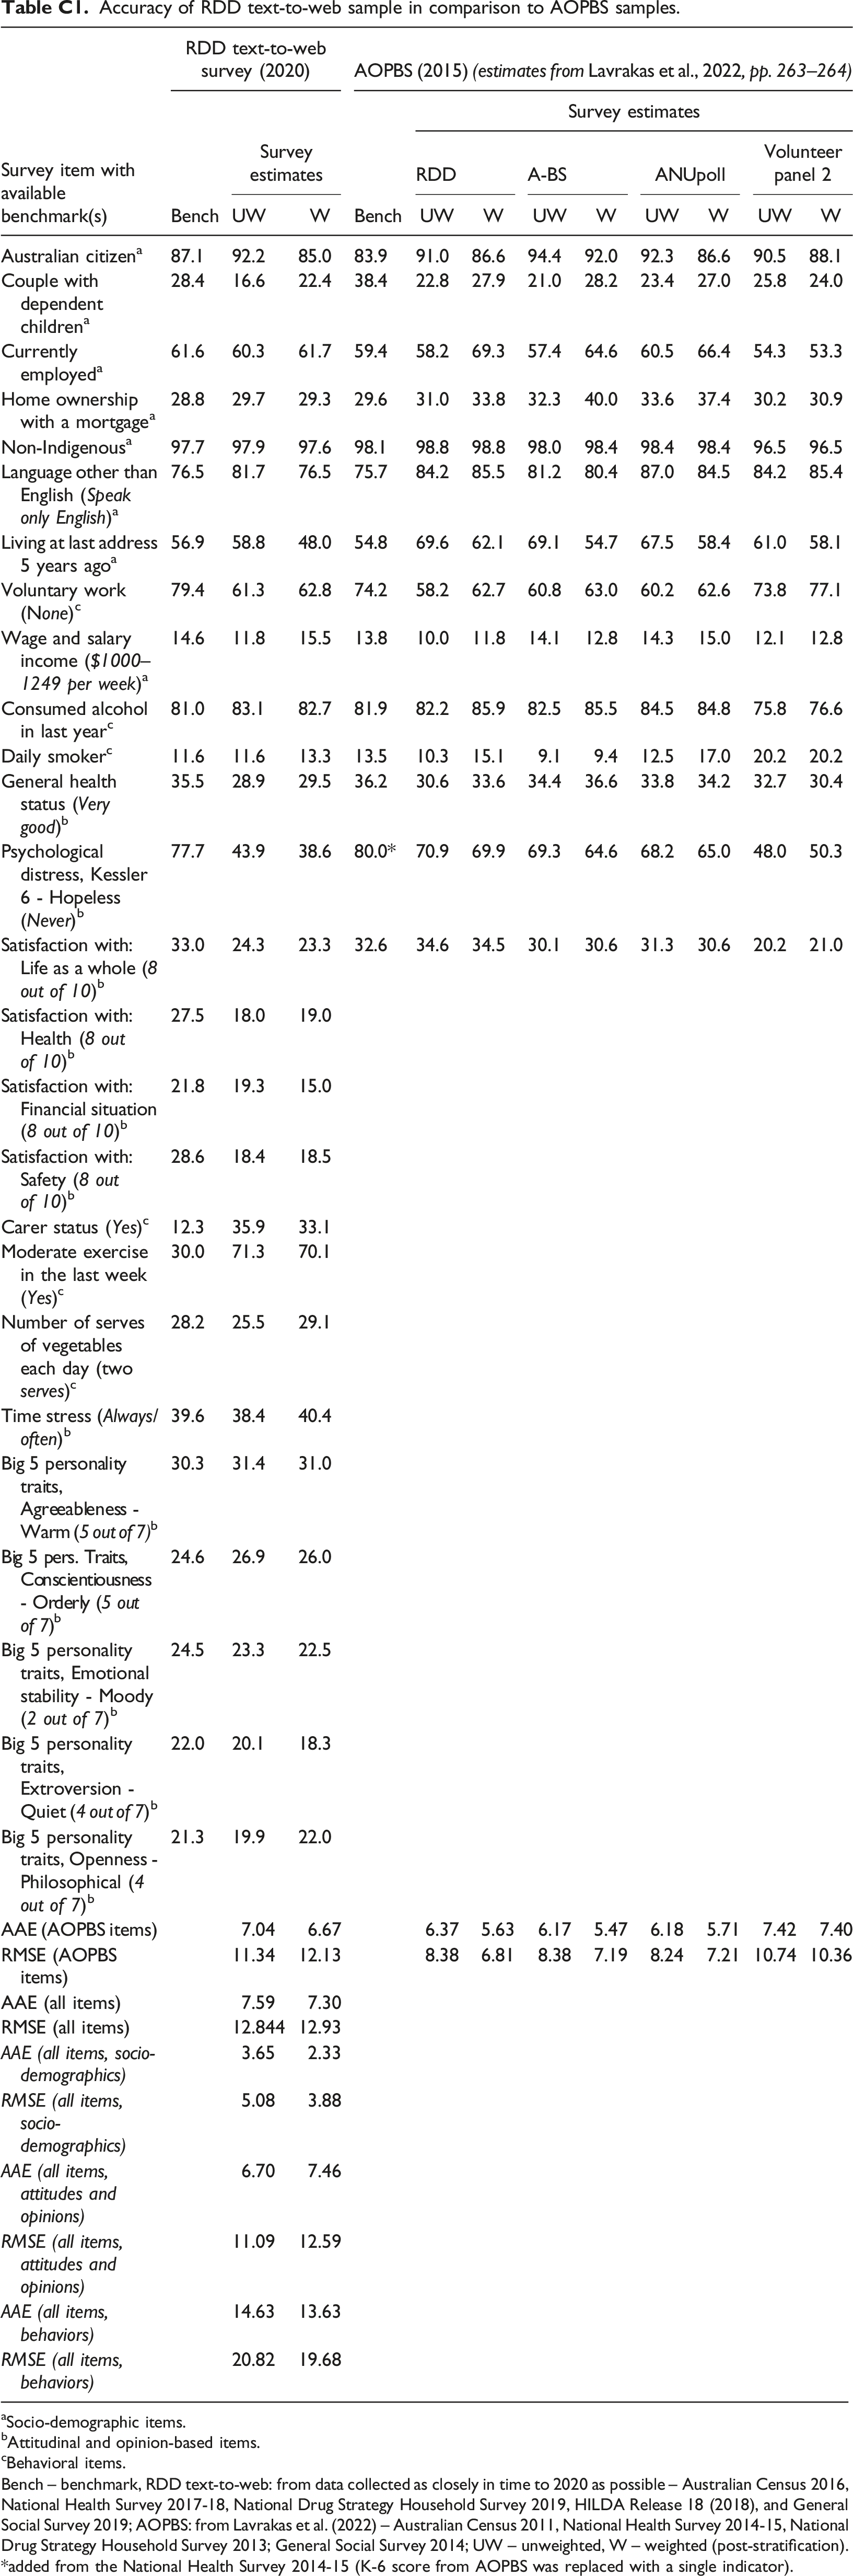
Survey item with available benchmark(s)
RDD text-to-web survey (2020)
AOPBS (2015) (estimates from Lavrakas et al., 2022, pp. 263–264)
Bench
Survey estimates
Bench
Survey estimates
RDD
A-BS
ANUpoll
Volunteer panel 2
UW
W
UW
W
UW
W
UW
W
UW
W
Australian citizen
a
87.1
92.2
85.0
83.9
91.0
86.6
94.4
92.0
92.3
86.6
90.5
88.1
Couple with dependent children
a
28.4
16.6
22.4
38.4
22.8
27.9
21.0
28.2
23.4
27.0
25.8
24.0
Currently employed
a
61.6
60.3
61.7
59.4
58.2
69.3
57.4
64.6
60.5
66.4
54.3
53.3
Home ownership with a mortgage
a
28.8
29.7
29.3
29.6
31.0
33.8
32.3
40.0
33.6
37.4
30.2
30.9
Non-Indigenous
a
97.7
97.9
97.6
98.1
98.8
98.8
98.0
98.4
98.4
98.4
96.5
96.5
Language other than English (Speak only English)
a
76.5
81.7
76.5
75.7
84.2
85.5
81.2
80.4
87.0
84.5
84.2
85.4
Living at last address 5 years ago
a
56.9
58.8
48.0
54.8
69.6
62.1
69.1
54.7
67.5
58.4
61.0
58.1
Voluntary work (None)
c
79.4
61.3
62.8
74.2
58.2
62.7
60.8
63.0
60.2
62.6
73.8
77.1
Wage and salary income ($1000–1249 per week)
a
14.6
11.8
15.5
13.8
10.0
11.8
14.1
12.8
14.3
15.0
12.1
12.8
Consumed alcohol in last year
c
81.0
83.1
82.7
81.9
82.2
85.9
82.5
85.5
84.5
84.8
75.8
76.6
Daily smoker
c
11.6
11.6
13.3
13.5
10.3
15.1
9.1
9.4
12.5
17.0
20.2
20.2
General health status (Very good)
b
35.5
28.9
29.5
36.2
30.6
33.6
34.4
36.6
33.8
34.2
32.7
30.4
Psychological distress, Kessler 6 - Hopeless (Never)
b
77.7
43.9
38.6
80.0*
70.9
69.9
69.3
64.6
68.2
65.0
48.0
50.3
Satisfaction with: Life as a whole (8 out of 10)
b
33.0
24.3
23.3
32.6
34.6
34.5
30.1
30.6
31.3
30.6
20.2
21.0
Satisfaction with: Health (8 out of 10)
b
27.5
18.0
19.0
Satisfaction with: Financial situation (8 out of 10)
b
21.8
19.3
15.0
Satisfaction with: Safety (8 out of 10)
b
28.6
18.4
18.5
Carer status (Yes)
c
12.3
35.9
33.1
Moderate exercise in the last week (Yes)
c
30.0
71.3
70.1
Number of serves of vegetables each day (two serves)
c
28.2
25.5
29.1
Time stress (Always/often)
b
39.6
38.4
40.4
Big 5 personality traits, Agreeableness - Warm (5 out of 7)
b
30.3
31.4
31.0
Big 5 pers. Traits, Conscientiousness - Orderly (5 out of 7)
b
24.6
26.9
26.0
Big 5 personality traits, Emotional stability - Moody (2 out of 7)
b
24.5
23.3
22.5
Big 5 personality traits, Extroversion - Quiet (4 out of 7)
b
22.0
20.1
18.3
Big 5 personality traits, Openness - Philosophical (4 out of 7)
b
21.3
19.9
22.0
AAE (AOPBS items)
7.04
6.67
6.37
5.63
6.17
5.47
6.18
5.71
7.42
7.40
RMSE (AOPBS items)
11.34
12.13
8.38
6.81
8.38
7.19
8.24
7.21
10.74
10.36
AAE (all items)
7.59
7.30
RMSE (all items)
12.844
12.93
AAE (all items, socio-demographics)
3.65
2.33
RMSE (all items, socio-demographics)
5.08
3.88
AAE (all items, attitudes and opinions)
6.70
7.46
RMSE (all items, attitudes and opinions)
11.09
12.59
AAE (all items, behaviors)
14.63
13.63
RMSE (all items, behaviors)
20.82
19.68