
Abstract
Net Promoter Score (NPS) is one of the most popular customer feedback metrics (CFMs) with benefits and limitations. One limitation is that prior research has shown that NPS is not better in explaining outcome variables such as sales growth or churn than other CFMs. Most prior research, however, has not considered combinations of CFMs, CFMs related to the antecedents of customer satisfaction, and CFMs with affective components. Therefore, we argue that NPS should be supplemented with other CFMs, e.g., emotions. In an empirical investigation in the mobile phone industry, we choose Net Emotional Value (NEV) to measure of emotions. We show that a combination of NPS and NEV leads to a better explanation of two out of three outcome variables compared to using NPS only or NEV only. We also illustrate how emotional profiles and driver analyses can be used to identify the most relevant emotions of Detractors, Passives, and Promoters and conclude with limitations and potential for further research.
Introduction
Most companies capture customer feedback through surveys. However, the customer feedback metrics (CFMs) they use differ: some focus on customer satisfaction, some use Net Promoter Score (NPS), and others report a customer satisfaction index (CSI) – a multi-item measure of customer satisfaction. NPS, in particular, has become a popular metric since Reichheld (2003) published it in the Harvard Business Review. NPS is based on the likelihood to recommend a company, measured in a survey with an 11-point-scale. Respondents that give a rating between zero and 6 are considered Detractors, respondents that give a rating between 7 and 8 are considered Passives, and respondents that give a rating between 9 and 10 are considered Promoters. NPS is defined as the share of Promoters minus the share of Detractors. Therefore, its range is between −100% and +100%.
According to Bain & Company (2020), 77% of 1200 executives who participated in an international survey, stated that their companies currently use or will use NPS by 2023. NPS is popular because it has its benefits: • It is simple and easy to implement (e.g., Bendle et al., 2019). • It is established with top management (e.g., Bendle et al., 2019). • It allows for benchmarking. Companies offering software to measure NPS, e.g., NICE Systems, provide benchmark data for different countries and industries (e.g., NICE Systems, 2023). • It proposes three customer segments (Detractors, Passives, Promoters) and helps to understand customer needs when combined with a follow-up process (e.g., Reichheld & Markey, 2011).
Nevertheless, both academics and practitioners remind of the limitations of NPS: • It requires larger sample sizes than CFMs that are based on average calculations (e.g., Baehre, O’Dwyer, O’Malley, & Lee, 2022; Pingitore et al., 2007). • It is more prone to cultural bias than other CFMs. Especially in countries like Japan or Korea, NPS is typically lower (e.g., Seth et al., 2016). • It is not better in explaining outcome variables such as sales growth or churn than other CFMs.
With respect to the last aspect, most prior research has focused on comparing NPS to other CFMs in terms of its ability to explain outcome variables such as sales growth or churn – especially because Reichheld (2003) had claimed based on correlation analyses that NPS was the most effective metric across many industries. Most prior research, however, has not considered: • Combinations of CFMs, • CFMs related to the antecedents of customer satisfaction, and • CFMs with affective components.
In the next section, we derive this research gap based on a more detailed overview of prior research.
Prior research on CFMs and research gap
Research that compares NPS with other CFMs.
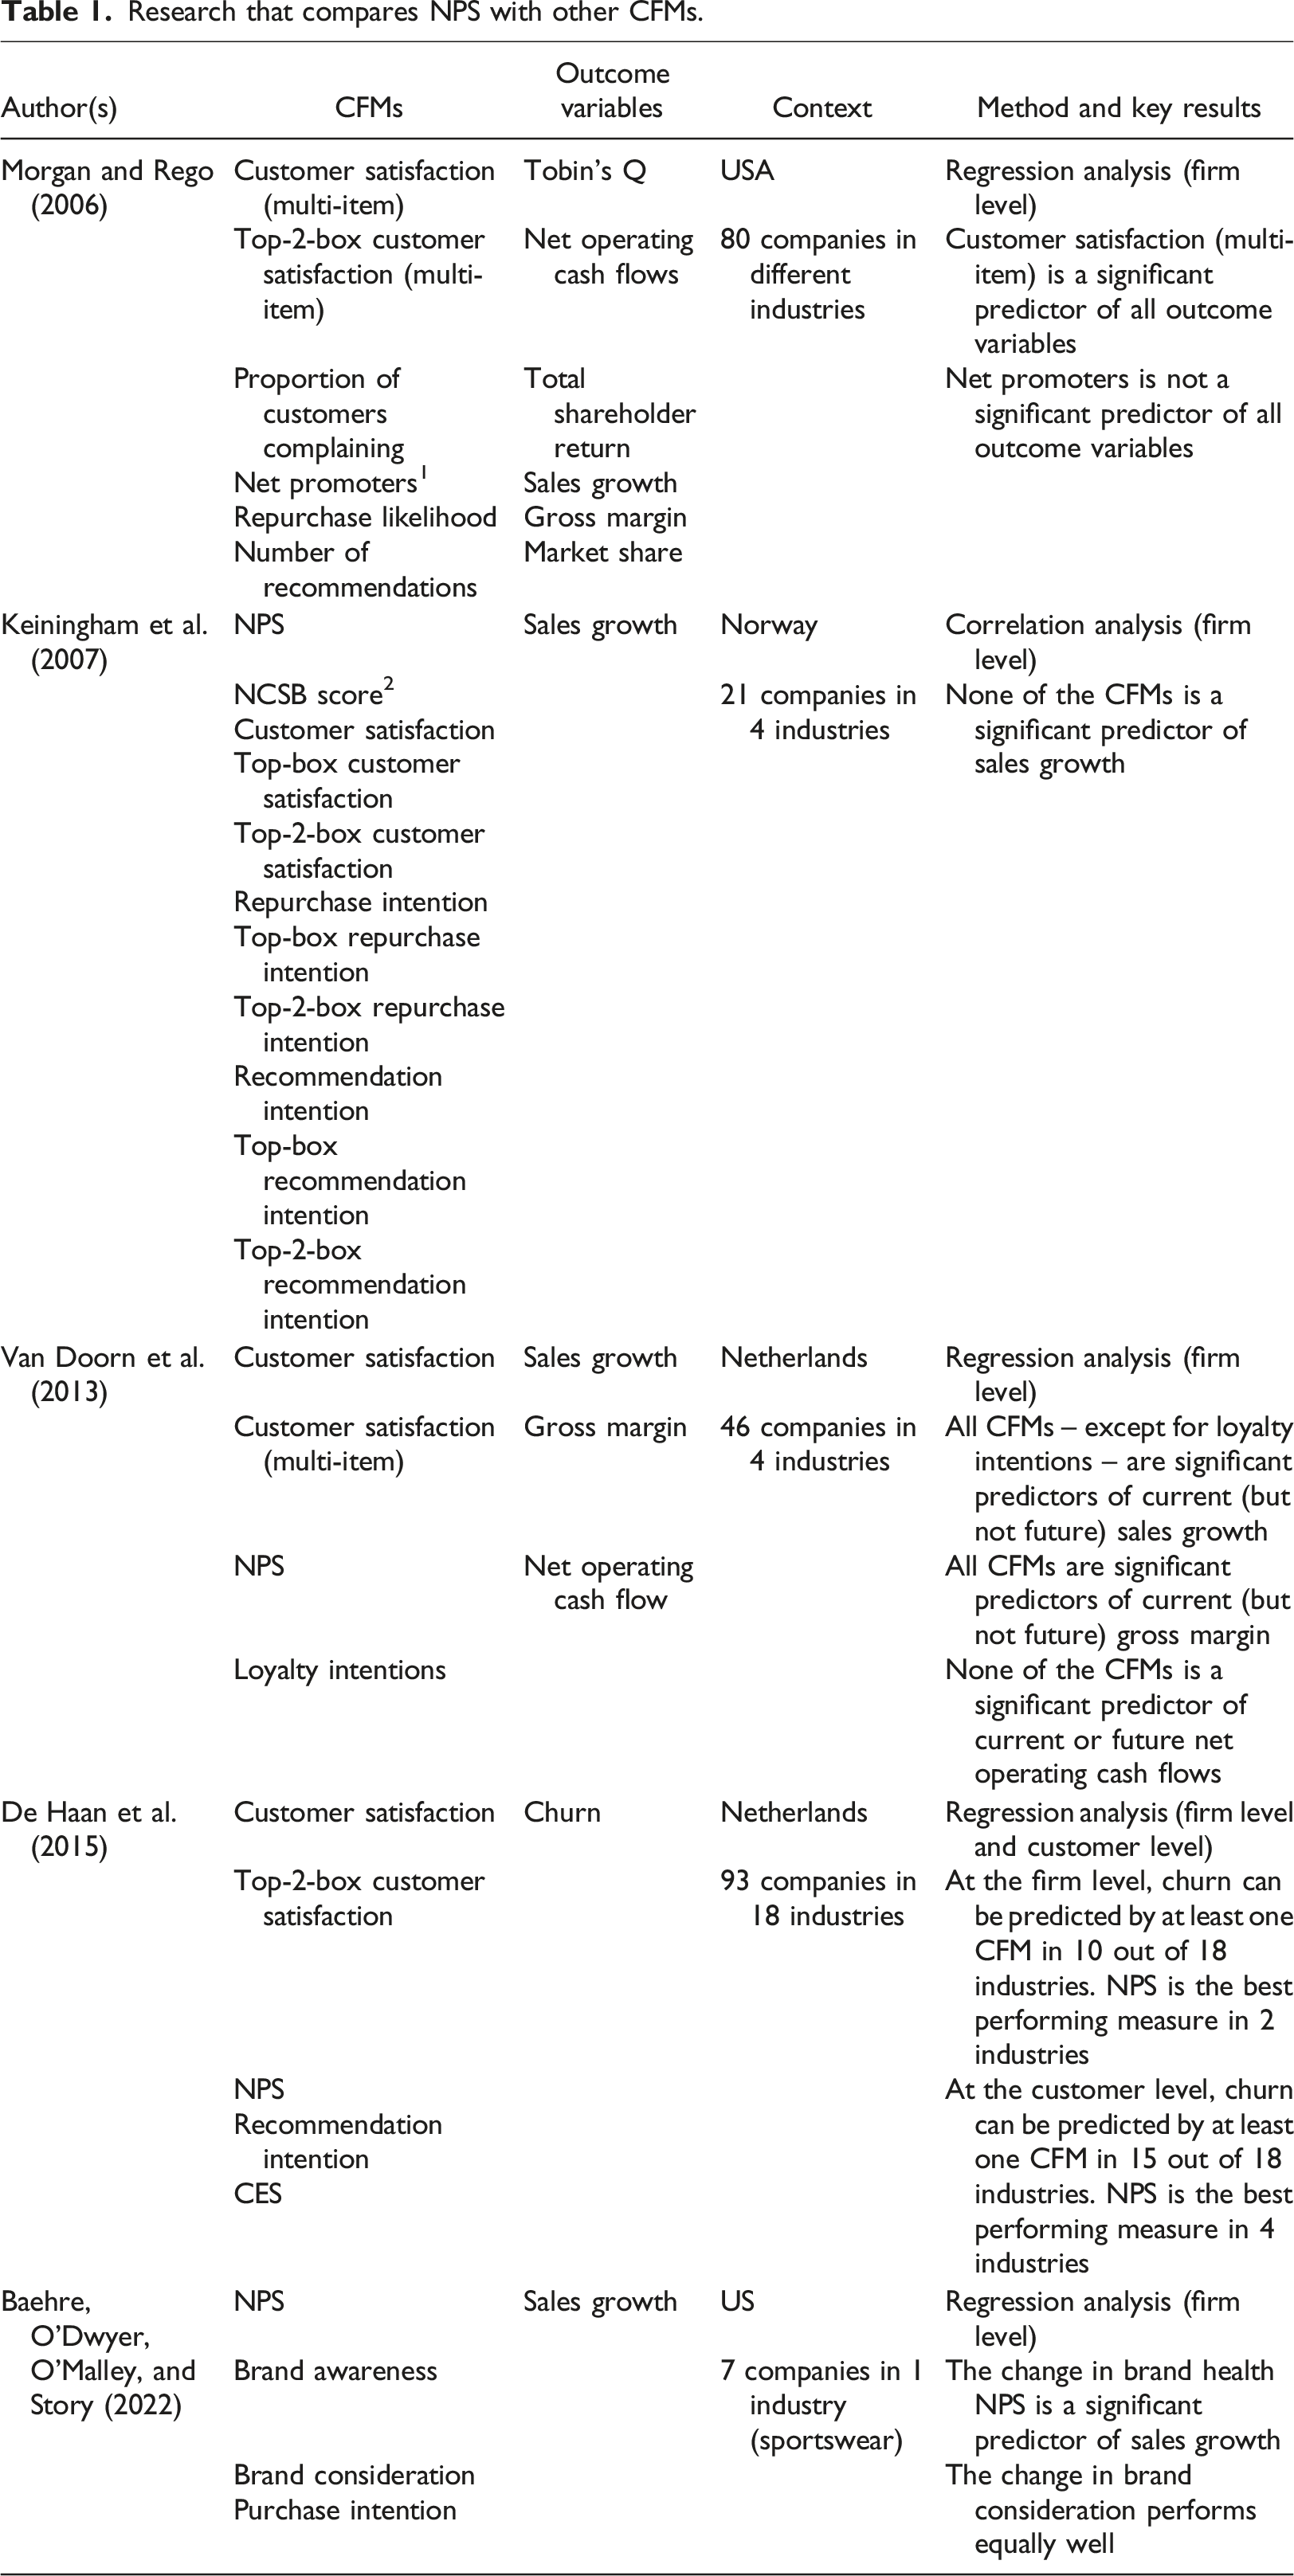
Morgan and Rego (2006) respond to Reichheld (2003) with data from the United States. They test six different CFMs and six different outcome variables and find that customer satisfaction – measured with three items according to the American Customer Satisfaction Index (ACSI) – is a significant predictor of all outcome variables, whereas “net promoters” is not. However, they do not measure NPS as suggested by Reichheld (2003). Therefore, “net promoters” cannot be compared to NPS. Keiningham et al. (2008) share this opinion in their response to Morgan and Rego (2006).
Keiningham et al. (2007) find, based on data from Norway, that none of the eleven CFMs they investigate is a significant predictor of sales growth.
Van Doorn et al. (2013) replicate the findings by Morgan and Rego (2006) in The Netherlands, but measure NPS as originally suggested by Reichheld (2003). They find that all CFMs – except for loyalty intentions – are significant predictors of current (but not future) sales growth. Similarly, they show that all CFMs are significant predictors of current (but not future) gross margin. However, according to their results, none of the CFMs is a significant predictor of current or future net operating cash flows. Therefore, Van Doorn et al. (2013, p. 317) conclude: “Taken together, our study suggests that the predictive capability of customer metrics, such as NPS, for future sales growth or gross margin is limited. The customer metrics included in this study perform equally well in predicting current company performance.”
In The Netherlands, too, De Haan et al. (2015) consider five CFMs and focus on churn as an outcome variable. They find that at the firm level churn can be predicted by at least one CFM in 10 out of 18 industries. NPS is the best performing CFM in two industries. At the customer level, churn can be predicted by at least one CFM in 15 out of 18 industries. NPS is the best performing CFM in four industries.
In a recent study, Baehre, O’Dwyer, O’Malley, and Lee (2022) argue that NPS is a measure of brand health and that a survey should therefore address both customers and non-customers. They compare NPS to other measures of brand health like brand awareness, brand consideration, and purchase intention and find that the change in “brand health NPS” is a significant predictor of sales growth. Additionally, they show that the change in brand consideration performs equally well.
Overall, prior research confirms that there is no single best CFM in terms of its ability to explain outcome variables, in particular sales growth or churn. Most prior research, however, does not consider combinations of CFMs. Exceptions are Keiningham et al. (2007) and De Haan et al. (2015). Keiningham et al. (2007) do not find improvements when using combinations of CFMs. De Haan et al. (2015) find that the prediction of churn improves when combining NPS with customer satisfaction or Customer Effort Score (CES) with customer satisfaction. Therefore, they conclude: “This means that by combining CFMs (i.e., having a dashboard of metrics that measure multiple dimensions […]), firms can obtain better predictions about their customer base as a whole.”
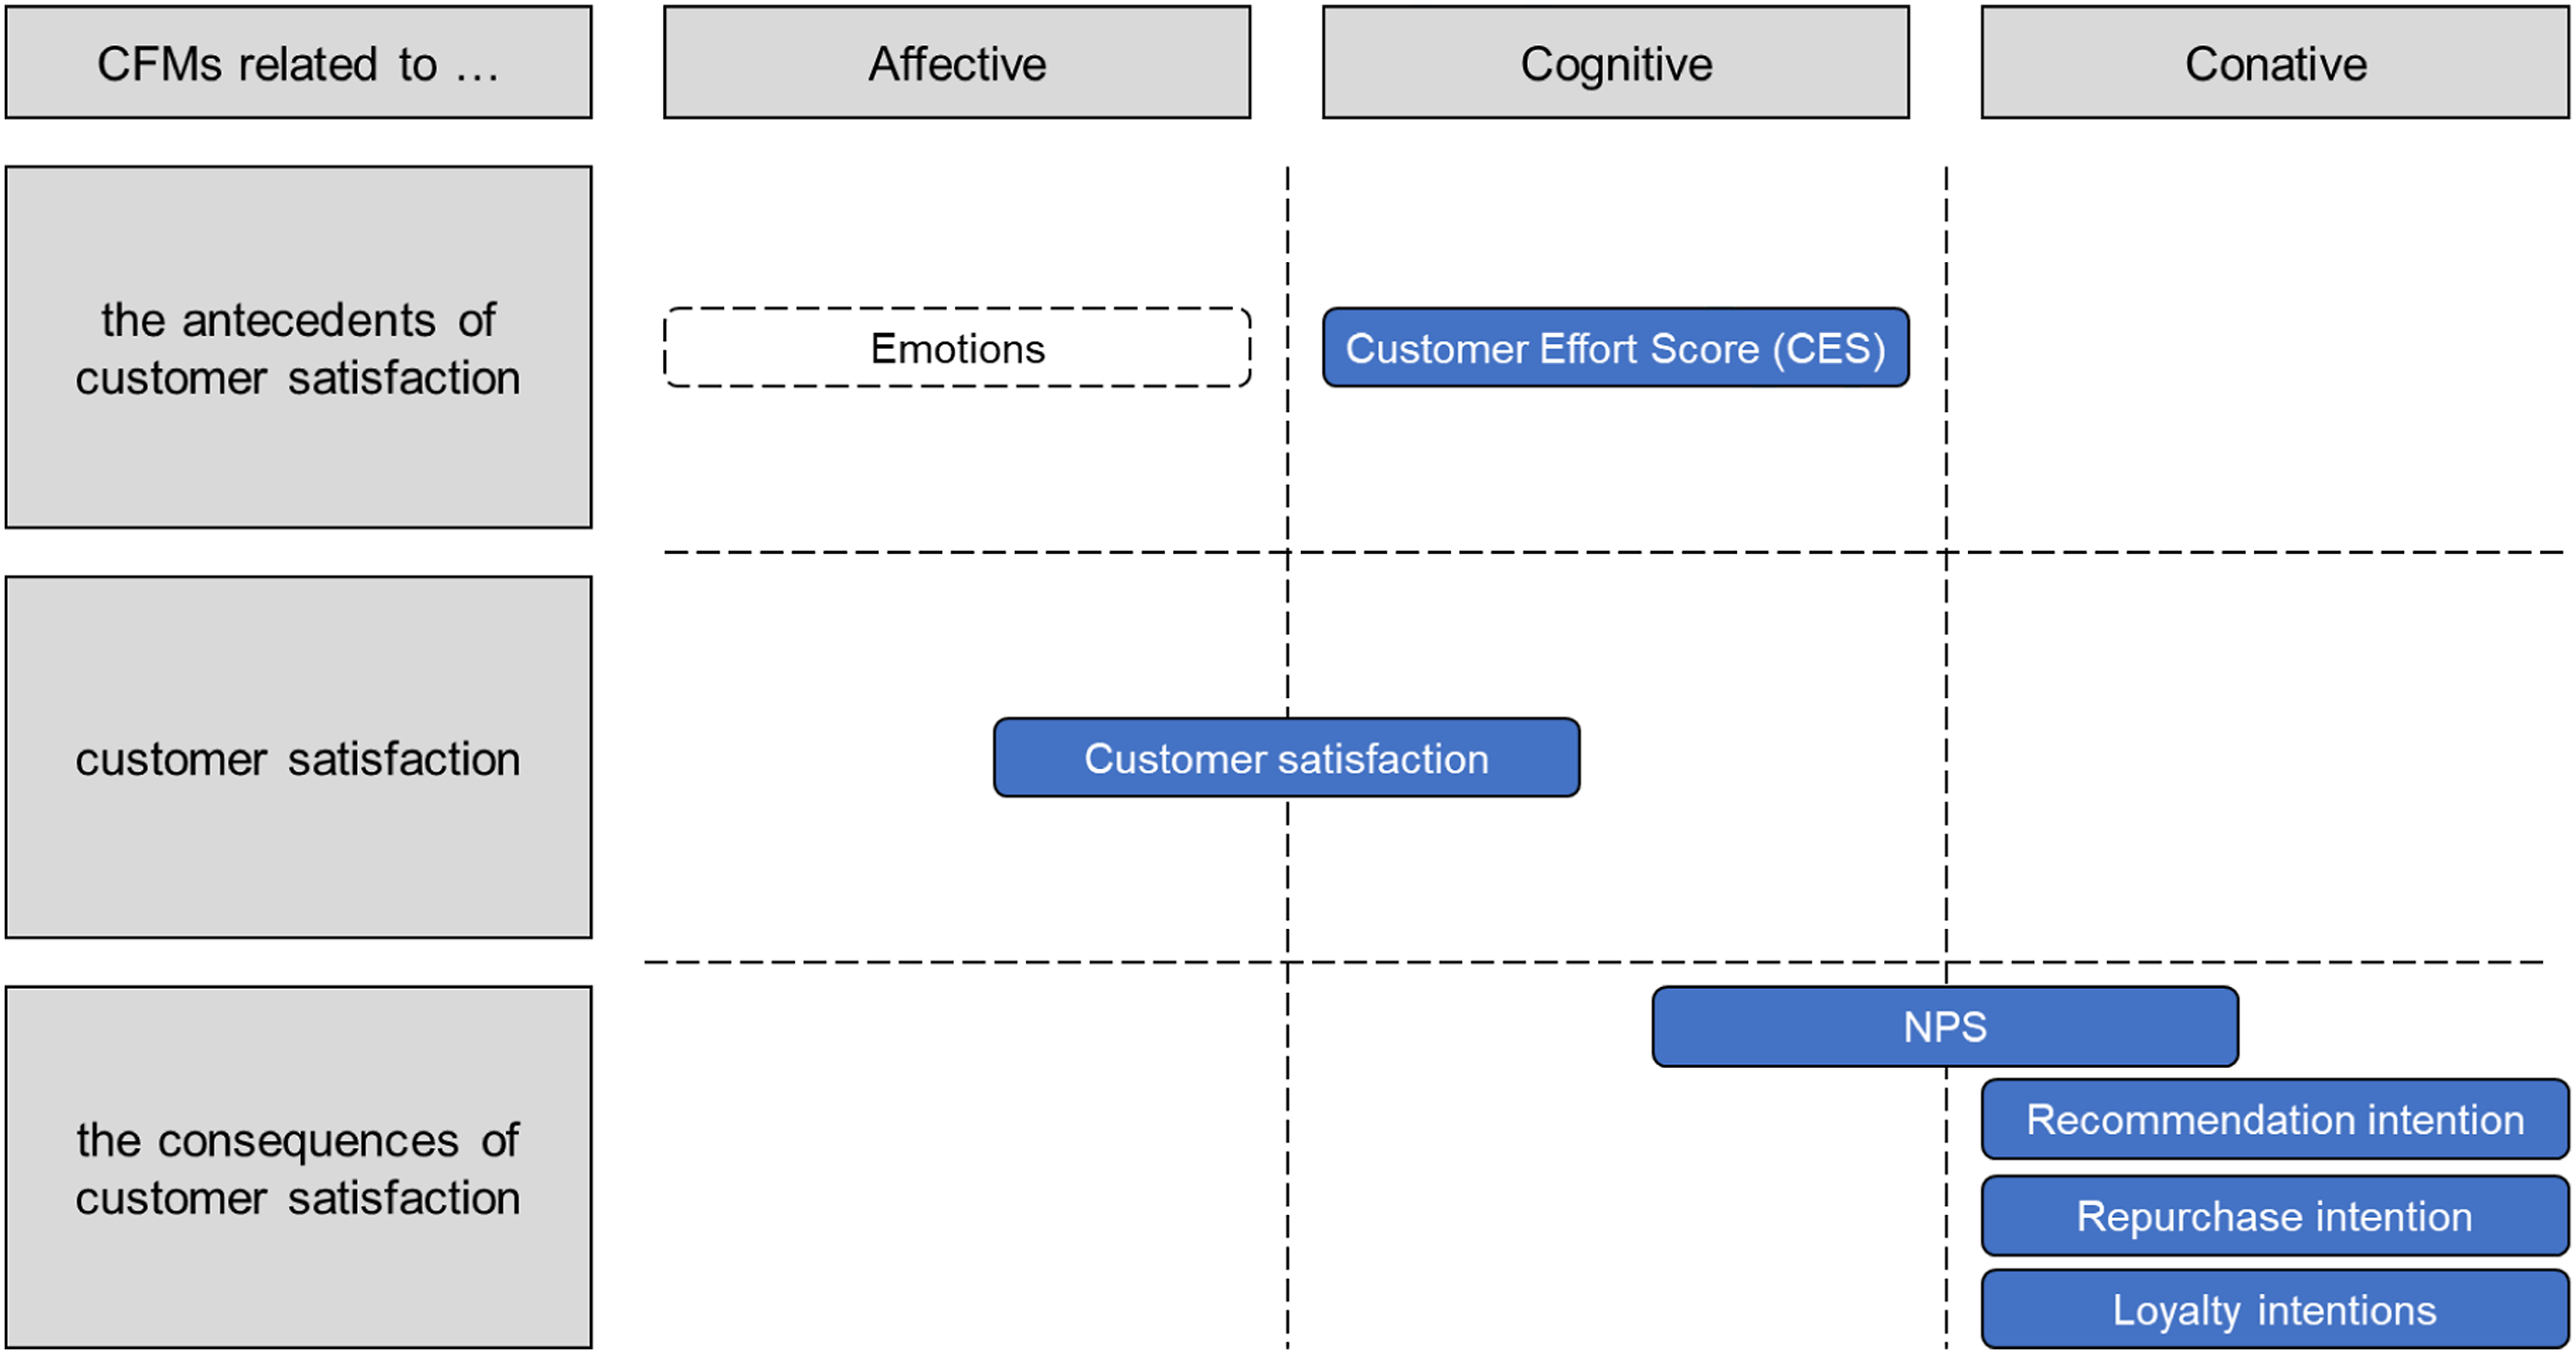
Figure 1 summarizes the CFMs used in prior research. Based on Table 1 and Figure 1, we derive the following conclusions and research gaps: • Most CFMs investigated in prior research are related to customer satisfaction or to the consequences of customer satisfaction (e.g., NPS, recommendation intention, repurchase intention, loyalty intentions). • Most prior research has not considered CFMs related to the antecedents of customer satisfaction. CES, as suggested by Dixon et al. (2010), is one exception. It measures the perceived effort to complete a transaction with a company. • Most CFMs shown in Figure 1 have cognitive or conative components (e.g., De Haan et al., 2021). Customer satisfaction is one exception. We argue in line with Homburg et al. (2006) that customer satisfaction has both affective and cognitive components.
4
• Thus, we consider CFMs related to the antecedents of customer satisfaction that have affective components a research gap and suggest that companies should measure emotions. Westbrook and Oliver (1991) find that emotions are important antecedents of customer satisfaction, and Oliver (1993) expands the antecedents of customer satisfaction to include positive affect (i.e., positive emotions) and negative affect (i.e., negative emotions) – in addition to ratings of product attributes or service attributes. Similarly, Sandström et al. (2008, p. 119) argue for services: “To fully leverage experience as part of a value proposition, organizations must manage the emotional dimension of experiences with the same rigor they bring to the management of service functionality”. • Moreover, as outlined above, most prior research has not considered combinations of CFMs, which we consider another research gap. Therefore, we propose that companies should measure both NPS and emotions. Categorization of CFMs used in prior research.
3
In the next section, we discuss how emotions can be measured.
Measurement of emotions
The concept of emotions has been extensively investigated in different disciplines. Izard (1971) mentions anger, contempt, disgust, fear, guilt, interest, joy, sadness, shame, and surprise as basic emotions. Ekman (1992) as well as Ekman and Rosenberg (1997) identify anger, disgust, fear, joy, sadness, and surprise as basic emotions, whereas Plutchik (1980, 2003) describes anger, anticipation, disgust, fear, joy, sadness, surprise, and trust as basic emotions in his “wheel of emotions”. According to him, basic emotions – or primary emotions – can be further split into secondary emotions. Secondary emotions are a combination of primary emotions.
Although emotions are important antecedents of customer satisfaction, they are rarely measured in practice (e.g., Razzaq et al., 2017). Emotions can be measured by analyzing text (e.g., Araujo et al., 2014; Fang & Zhan, 2015; Mingione et al., 2020), by analyzing facial expressions (e.g., Ekman and Rosenberg, 1997), or by using neural science approaches (e.g., Costafreda et al., 2008). However, according to Lucas et al. (2009), self-reported measures are the most efficient way to capture emotions.
Emotions behind NEV (Shaw, 2007).
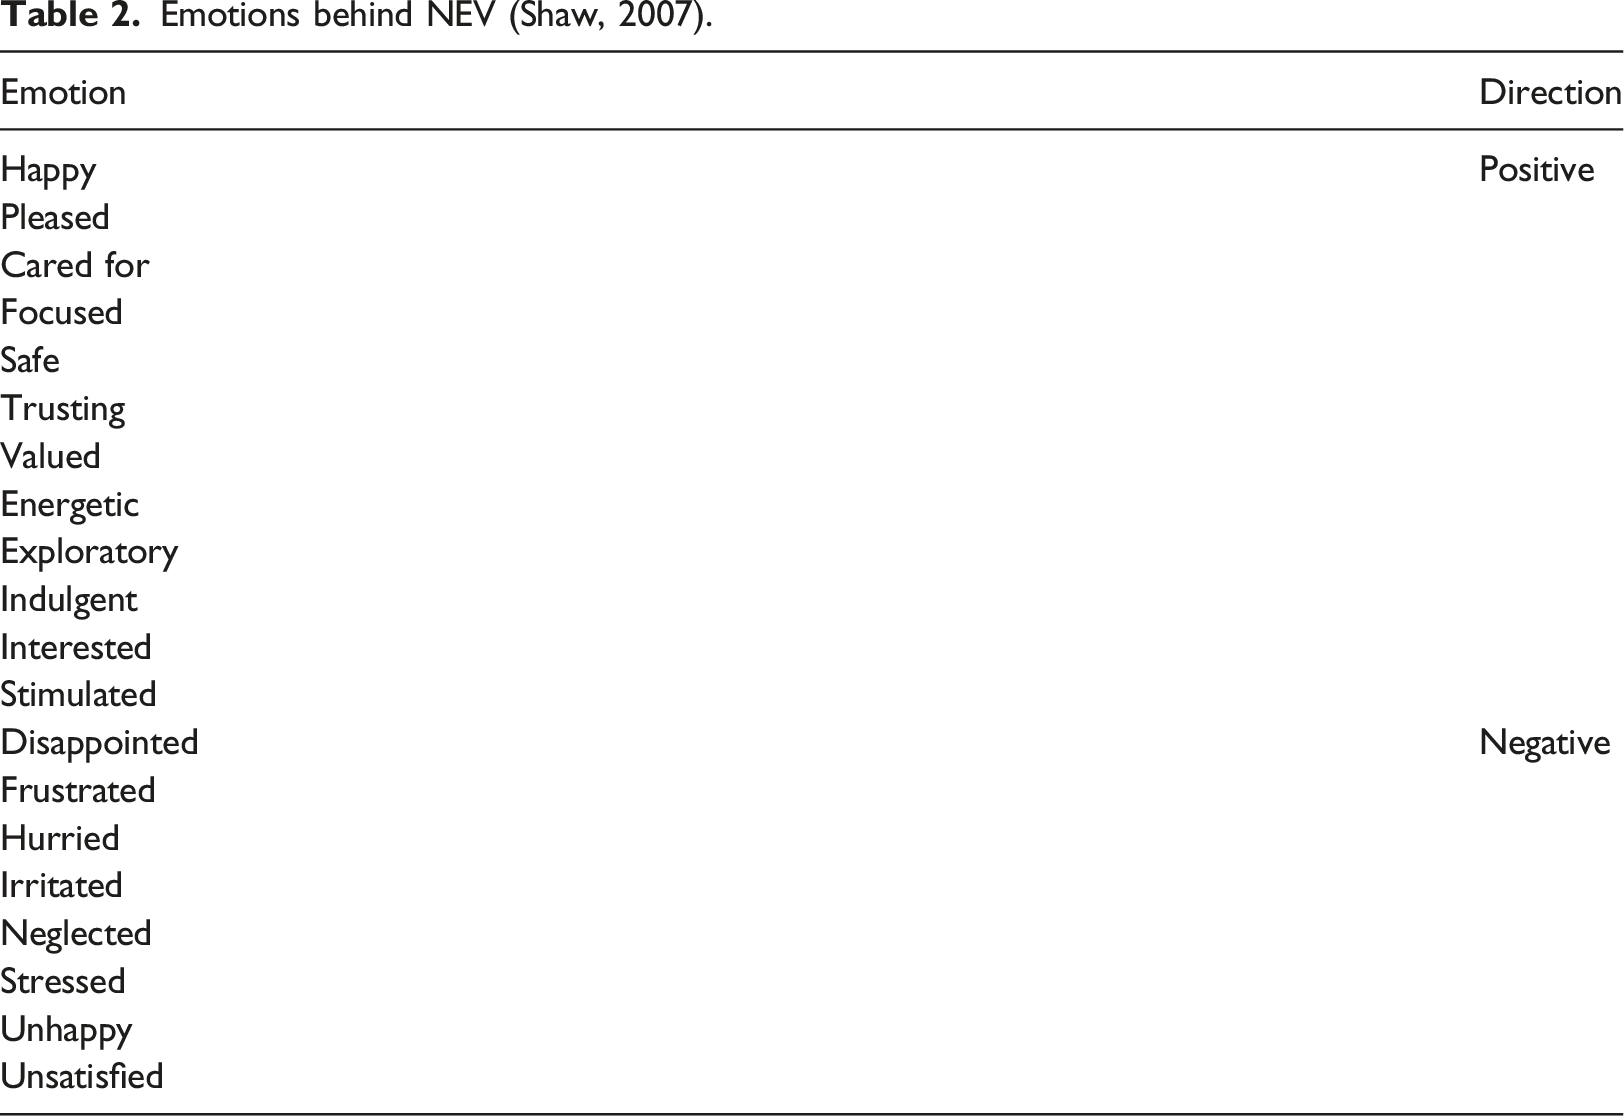
Shaw (2007) does not systematically argue based on previous research how he chooses the 20 emotions. However, most of them can be linked to the primary or secondary emotions according to Plutchik (2003) or to emotions that are relevant in marketing according to Bosch et al. (2006).
Exceptions are the positive emotions cared for, safe, and exploratory, as well as the negative emotions hurried, neglected, and stressed.
Moreover, there are primary or secondary emotions according to Plutchik (2003) that are not considered by Shaw (2007): additional positive emotions that could be integrated are enthusiastic, hopeful, optimistic, and proud; additional negative emotions that could be considered are angry, bored, concerned, contemptuous, and remorseful.
To measure emotions, Shaw (2007) uses a 5-point scale (“not felt at all”, “slightly felt”, “moderately felt”, “strongly felt”, “very strongly felt”). Richins (1997) uses a similar 4-point scale (“not at all”, “a little”, “moderately”, “strongly”).
Since NEV has received more attention among practitioners than among researchers, we test it as a measure of emotions. We both test a version with 20 emotions, as suggested by Shaw (2007), and a version with 29 emotions, considering the additional emotions described above.
Based on this, we investigate the following research questions (RQs): • RQ1: How well does NPS explain outcome variables? • RQ2: How well do emotions explain outcome variables? • RQ3: How well does a combination of NPS and emotions explain outcome variables?
Methodology
Distribution of the respondents.
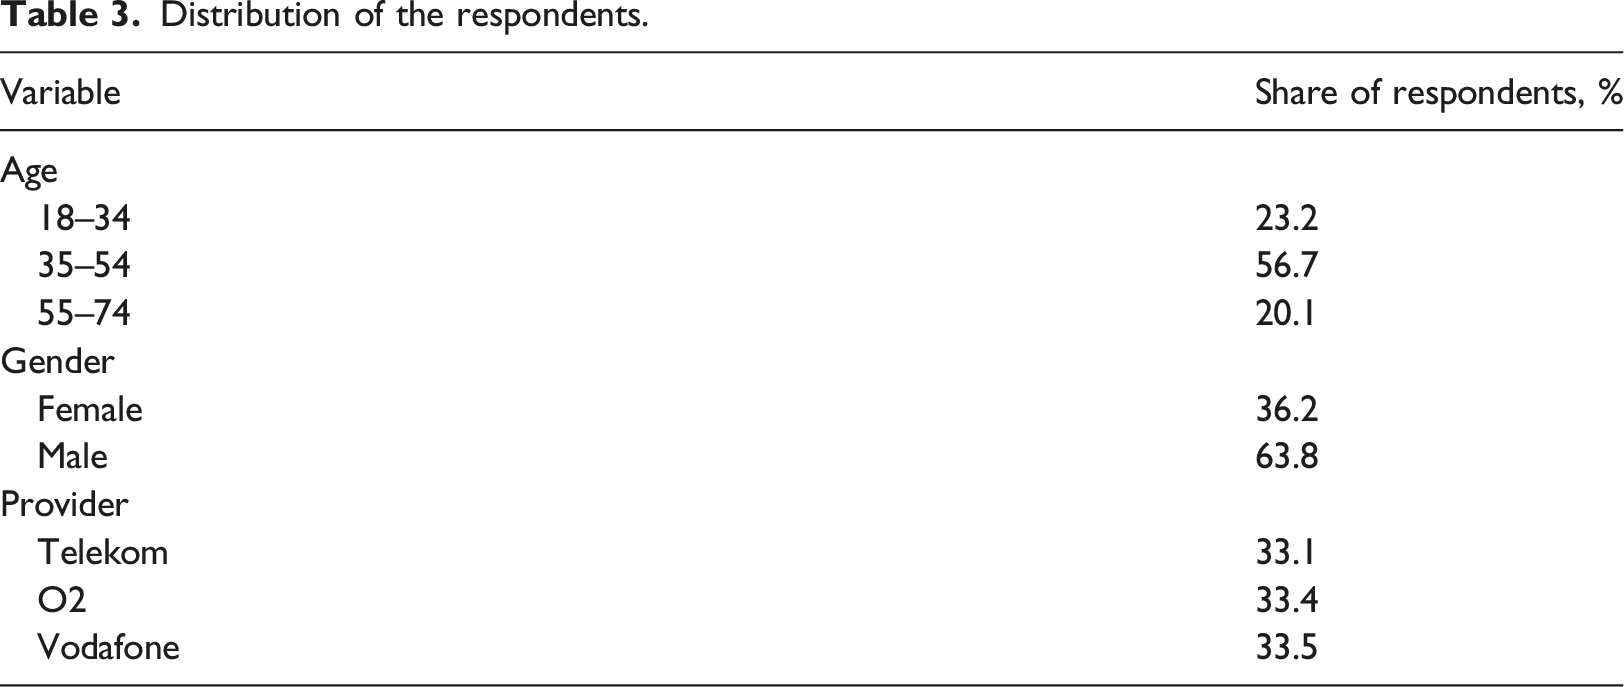
As outlined above, we both test a version with 20 emotions, as suggested by Shaw (2007), and a version with 29 emotions, considering the additional emotions described above. We measure NPS as suggested by Reichheld (2003). NEV and NPS are the CFMs investigated in our study. The outcome variables in our study are repurchase intention, cross-buying intention, and average monthly sales. All three outcome variables are easy to understand for respondents, which allows the use of single-item scales (e.g., Hair et al., 2009). Specifically, we use the following questions: • NEV: When I think of my experience with [provider], I feel […].
5
• NPS: How likely is it that you would recommend [provider] to a friend or colleague?
6
• Repurchase intention: How likely is it that you will renew your contract with [provider]?
7
• Cross-buying intention: How likely is it that you will use other [provider] products or services in the future?
8
• Average monthly sales: What is your average monthly bill with [provider]?
9
Results
Descriptive results for NEV.
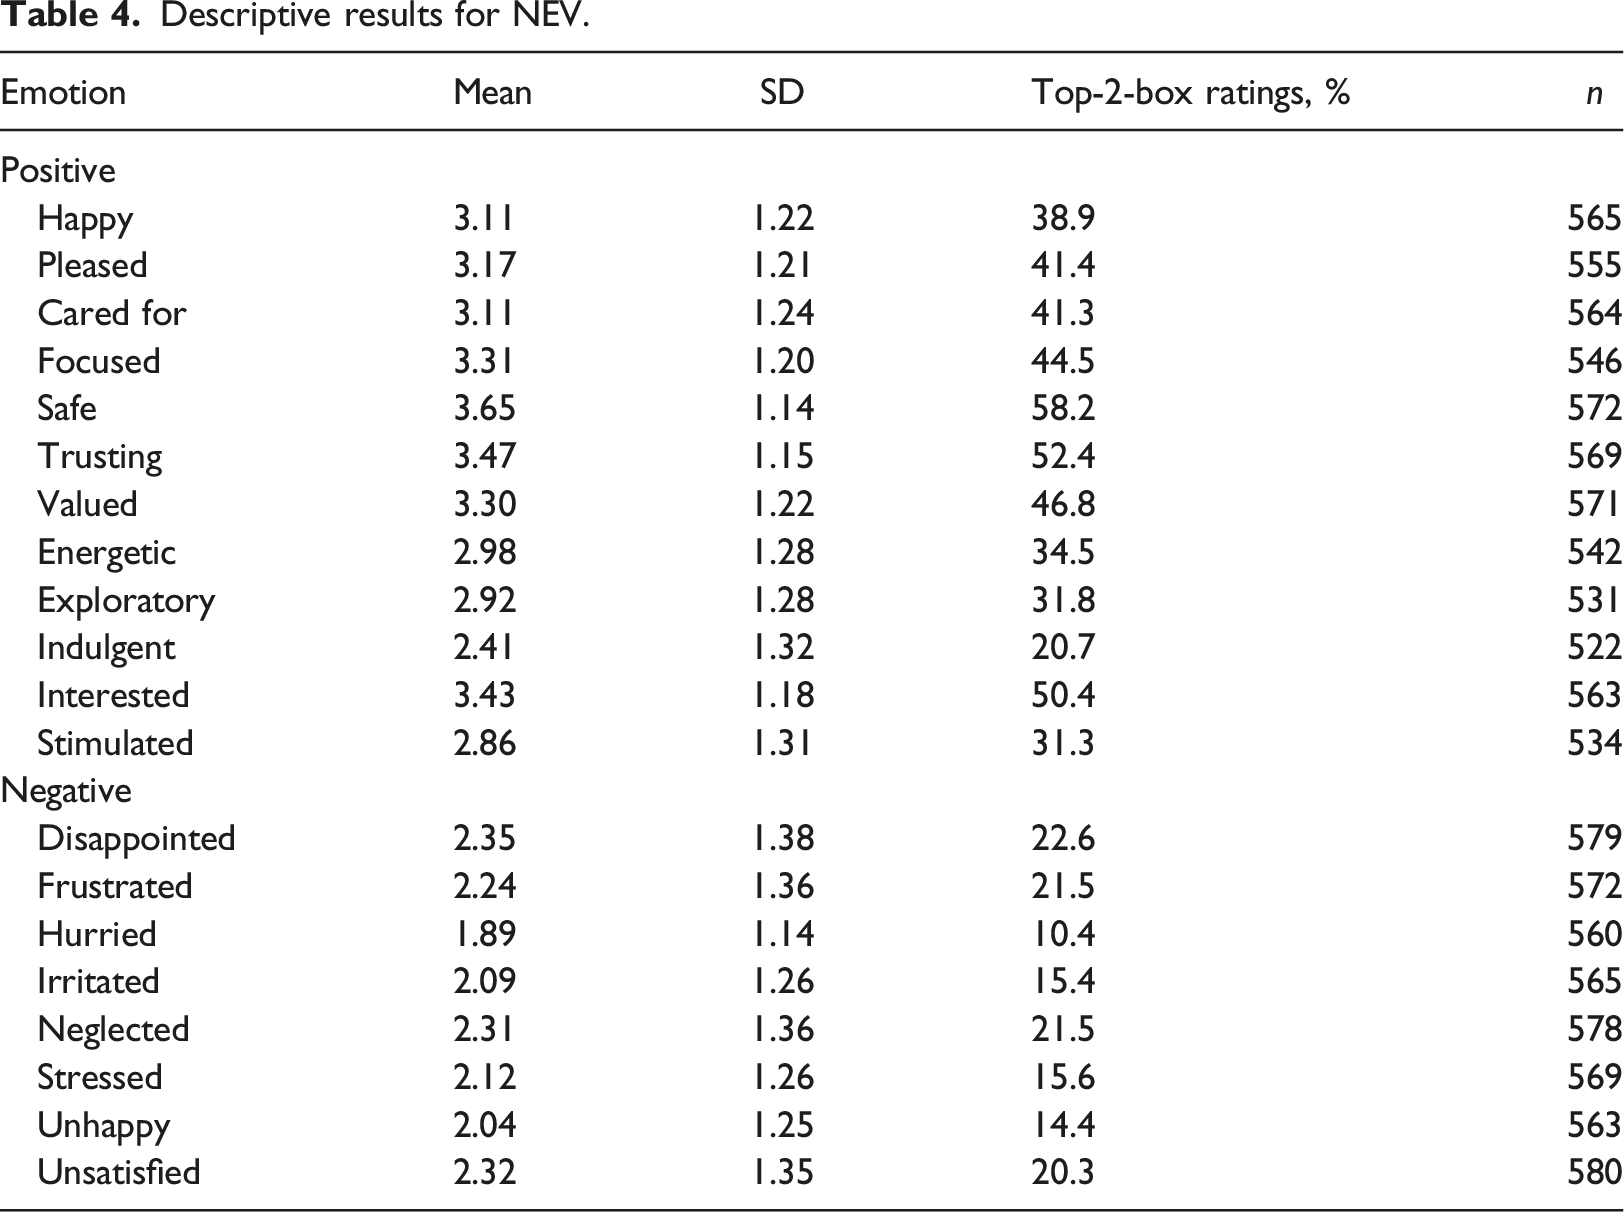
To calculate NEV on a respondent level, we use top-2-box ratings. We assume that respondents have an emotion when they rate it with a 4 or a 5. Respondents were only included when they rated all emotions, which results in a sample size of n = 464 for NEV. Overall, 16.8% of all respondents have a negative NEV (−8 to −1), 16.4% have a neutral NEV (0), and 66.8% have a positive NEV (1–12, see Figure 2). NEV.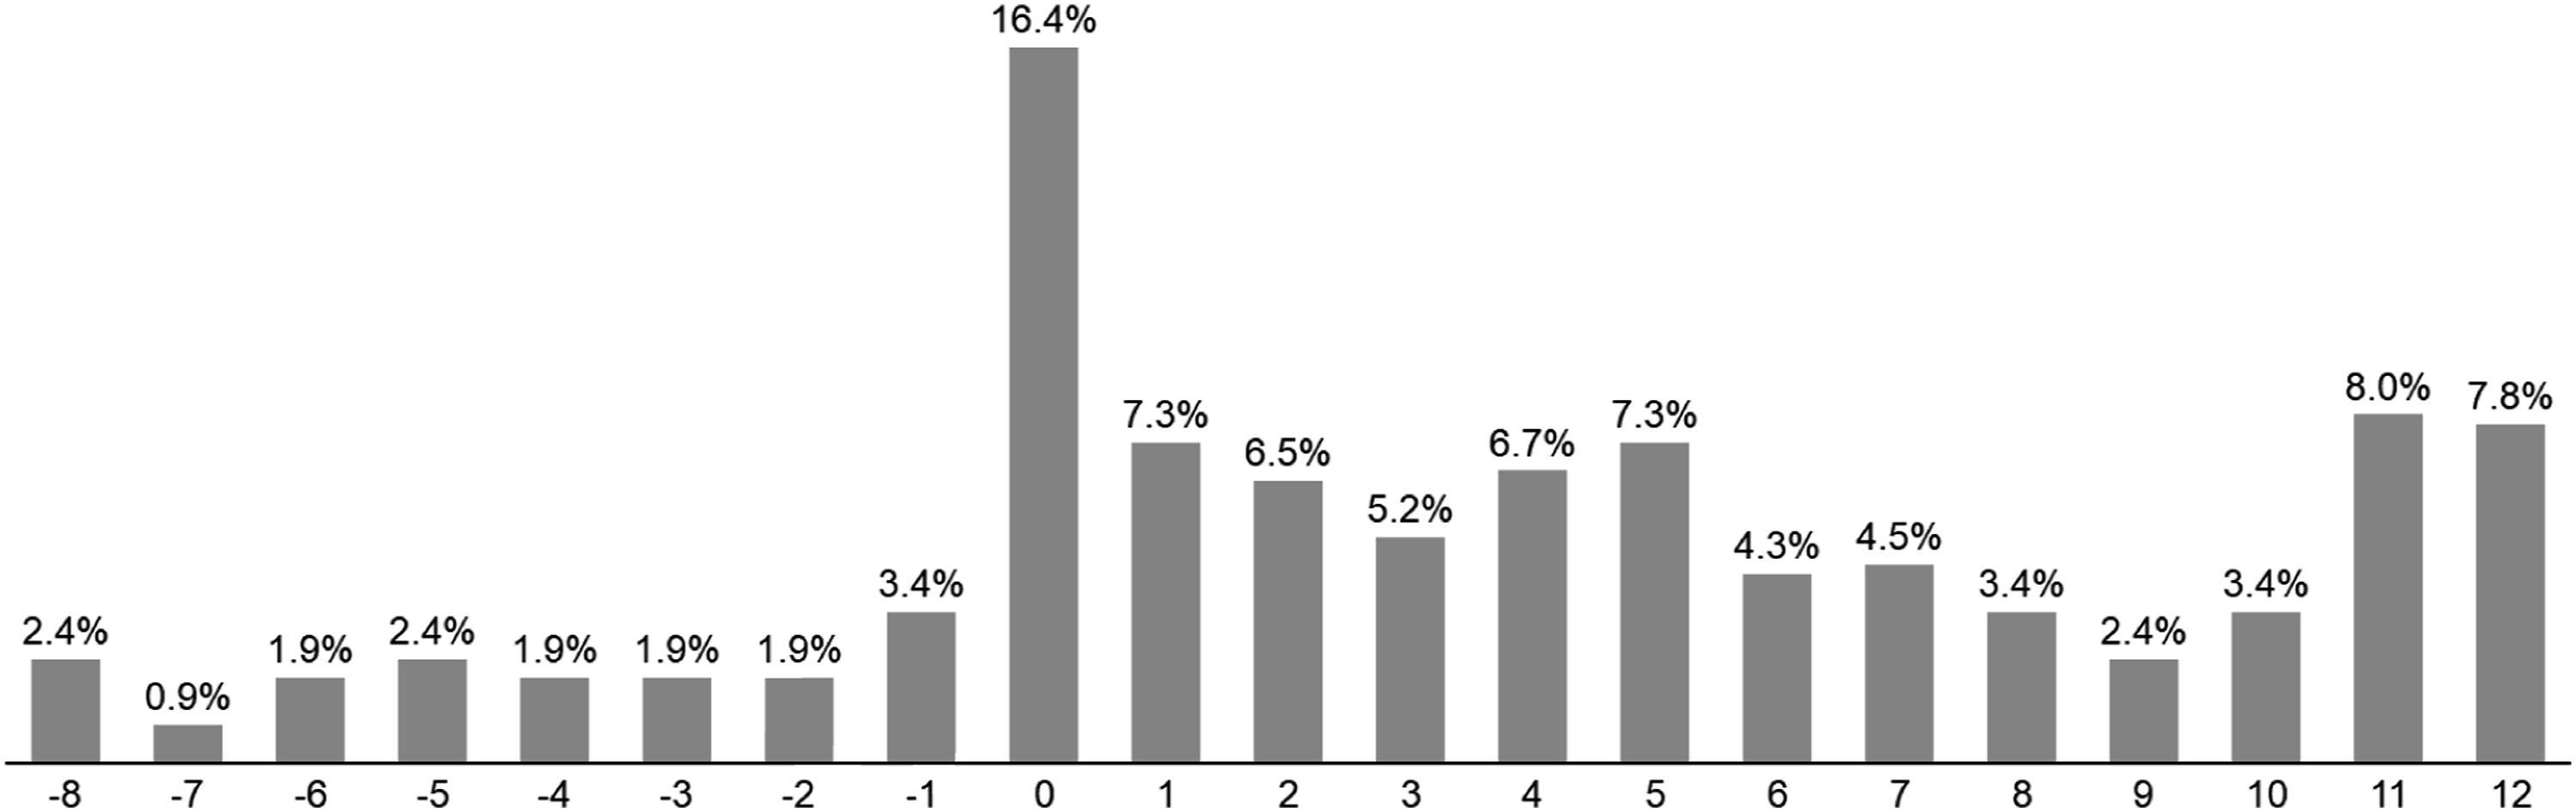
Rotated factor solution for 20 emotions.
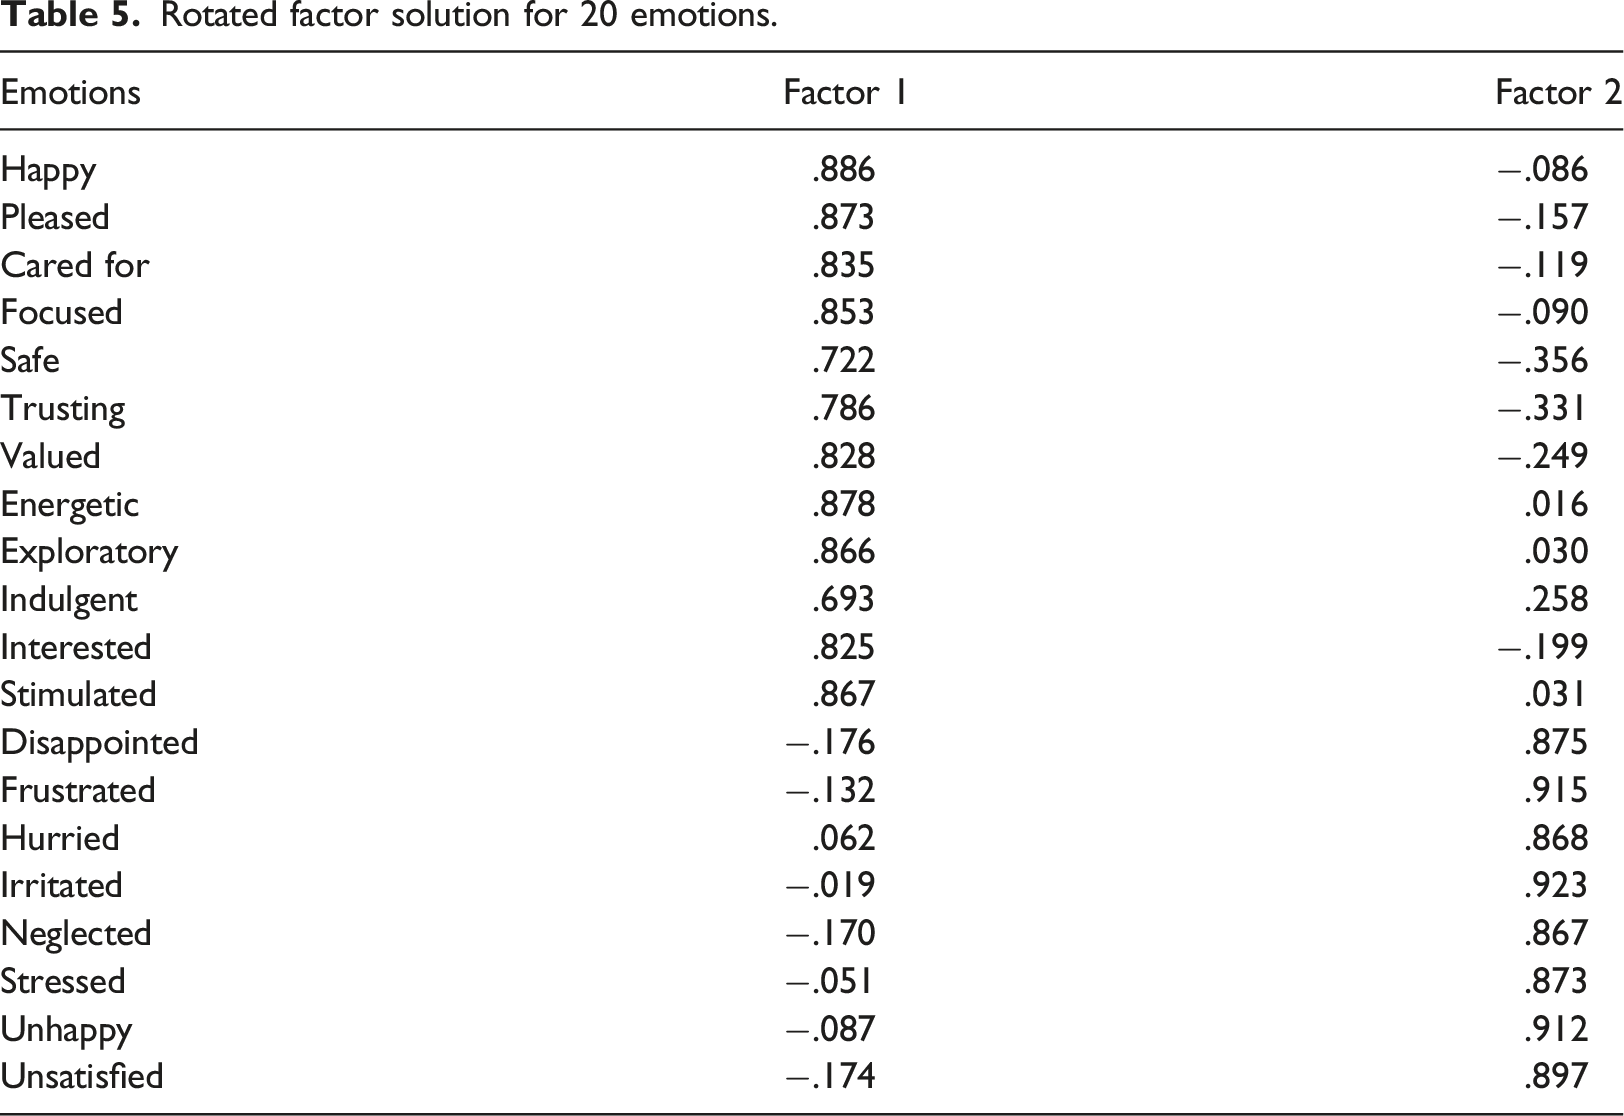
We also conduct a factor analysis for the 29 emotions. Again, Bartlett’s test of sphericity is significant (Χ2 = 15427.197, df = 406, p = .000), and there are two factors with Eigenvalues larger than one. They explain 75.0% variance. Again, all positive emotions load factor 1, and all negative emotions load on factor 2. Cronbach’s alpha is .972 for the positive emotions and .976 for the negative emotions.
Furthermore, a correlation analysis between NEV based on 20 emotions and NEV based on 29 emotions is significant (r = .987, p = .000). Also, only 4.6% of the respondents are classified differently when comparing NEV based on 20 emotions and NEV based on 29 emotions.
Because of these results and because of the shorter scale, which creates less respondent fatigue, we use NEV based on 20 emotions for further analyses.
To investigate RQ1-RQ3, we run ANOVAs with three different outcome variables, i.e., dependent variables: repurchase intention, cross-buying intention, and average monthly sales. We test three models that differ in the independent variables: model 1 uses NPS only, model 2 uses NEV only, and model 3 uses both NPS and NEV. For NPS, we use the three categories Detractors, Passives, and Promoters. For NEV, we use the three categories negative, neutral, and positive (see Figure 2).
ANOVA results.
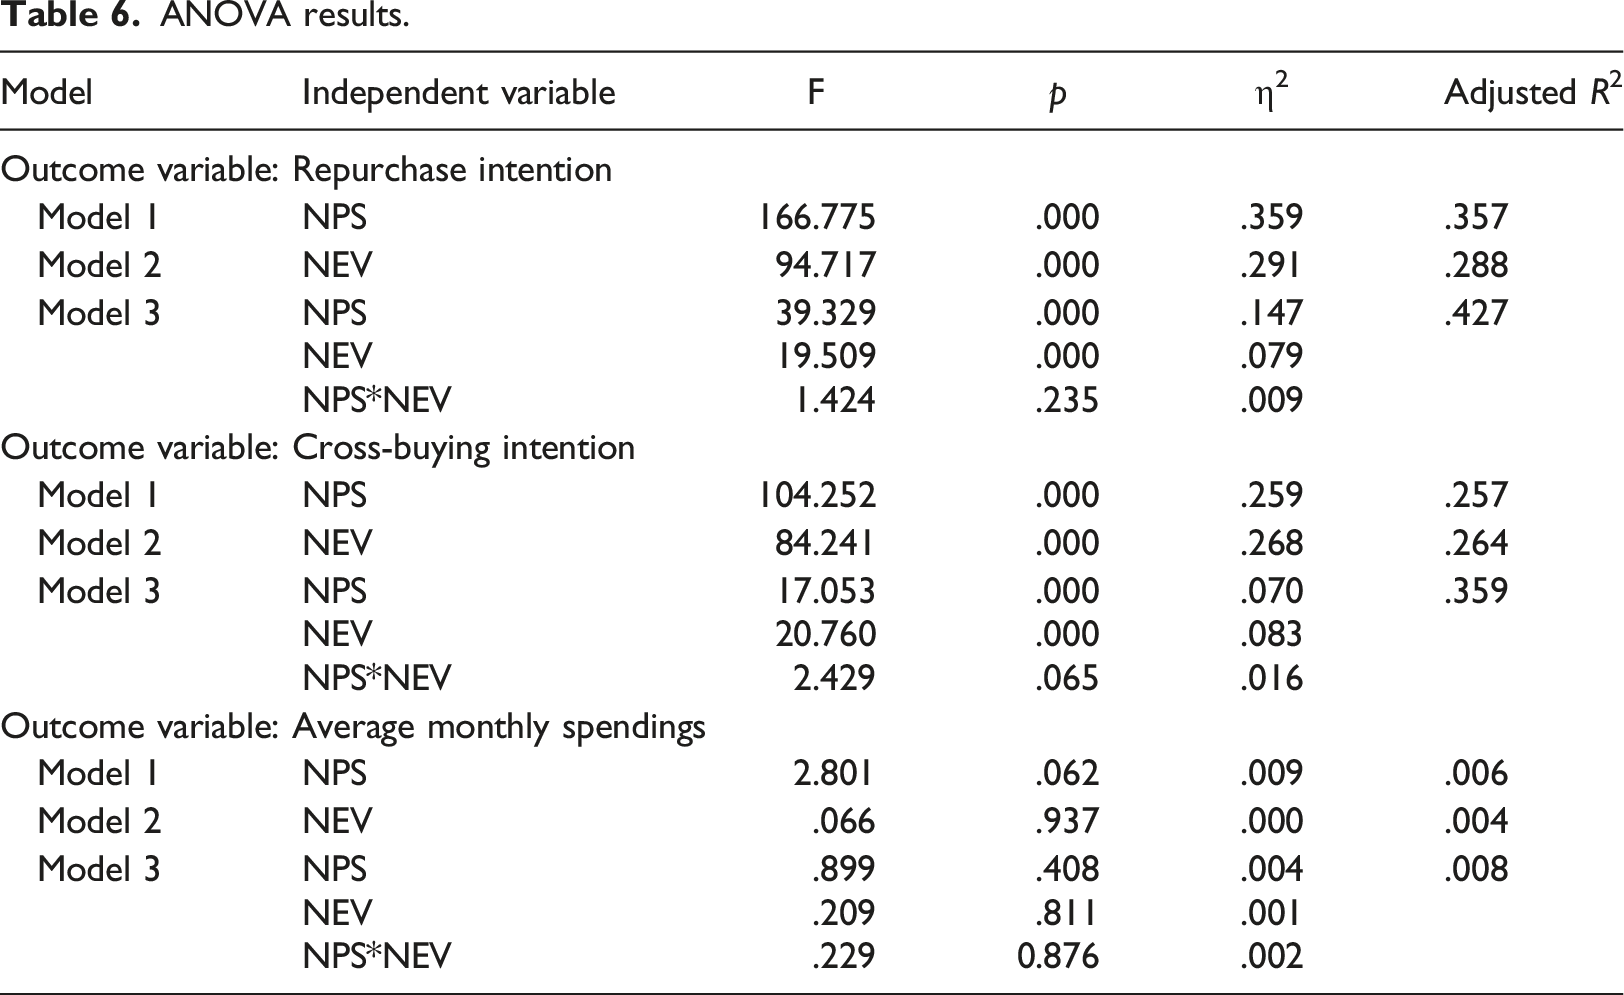
For repurchase intention as an outcome variable, model 3 explains most variance (adjusted R2 = .427). The interaction effect between NPS and NEV is not significant. Figure 3 illustrates this. Effect of NPS category and NEV category on repurchase intention.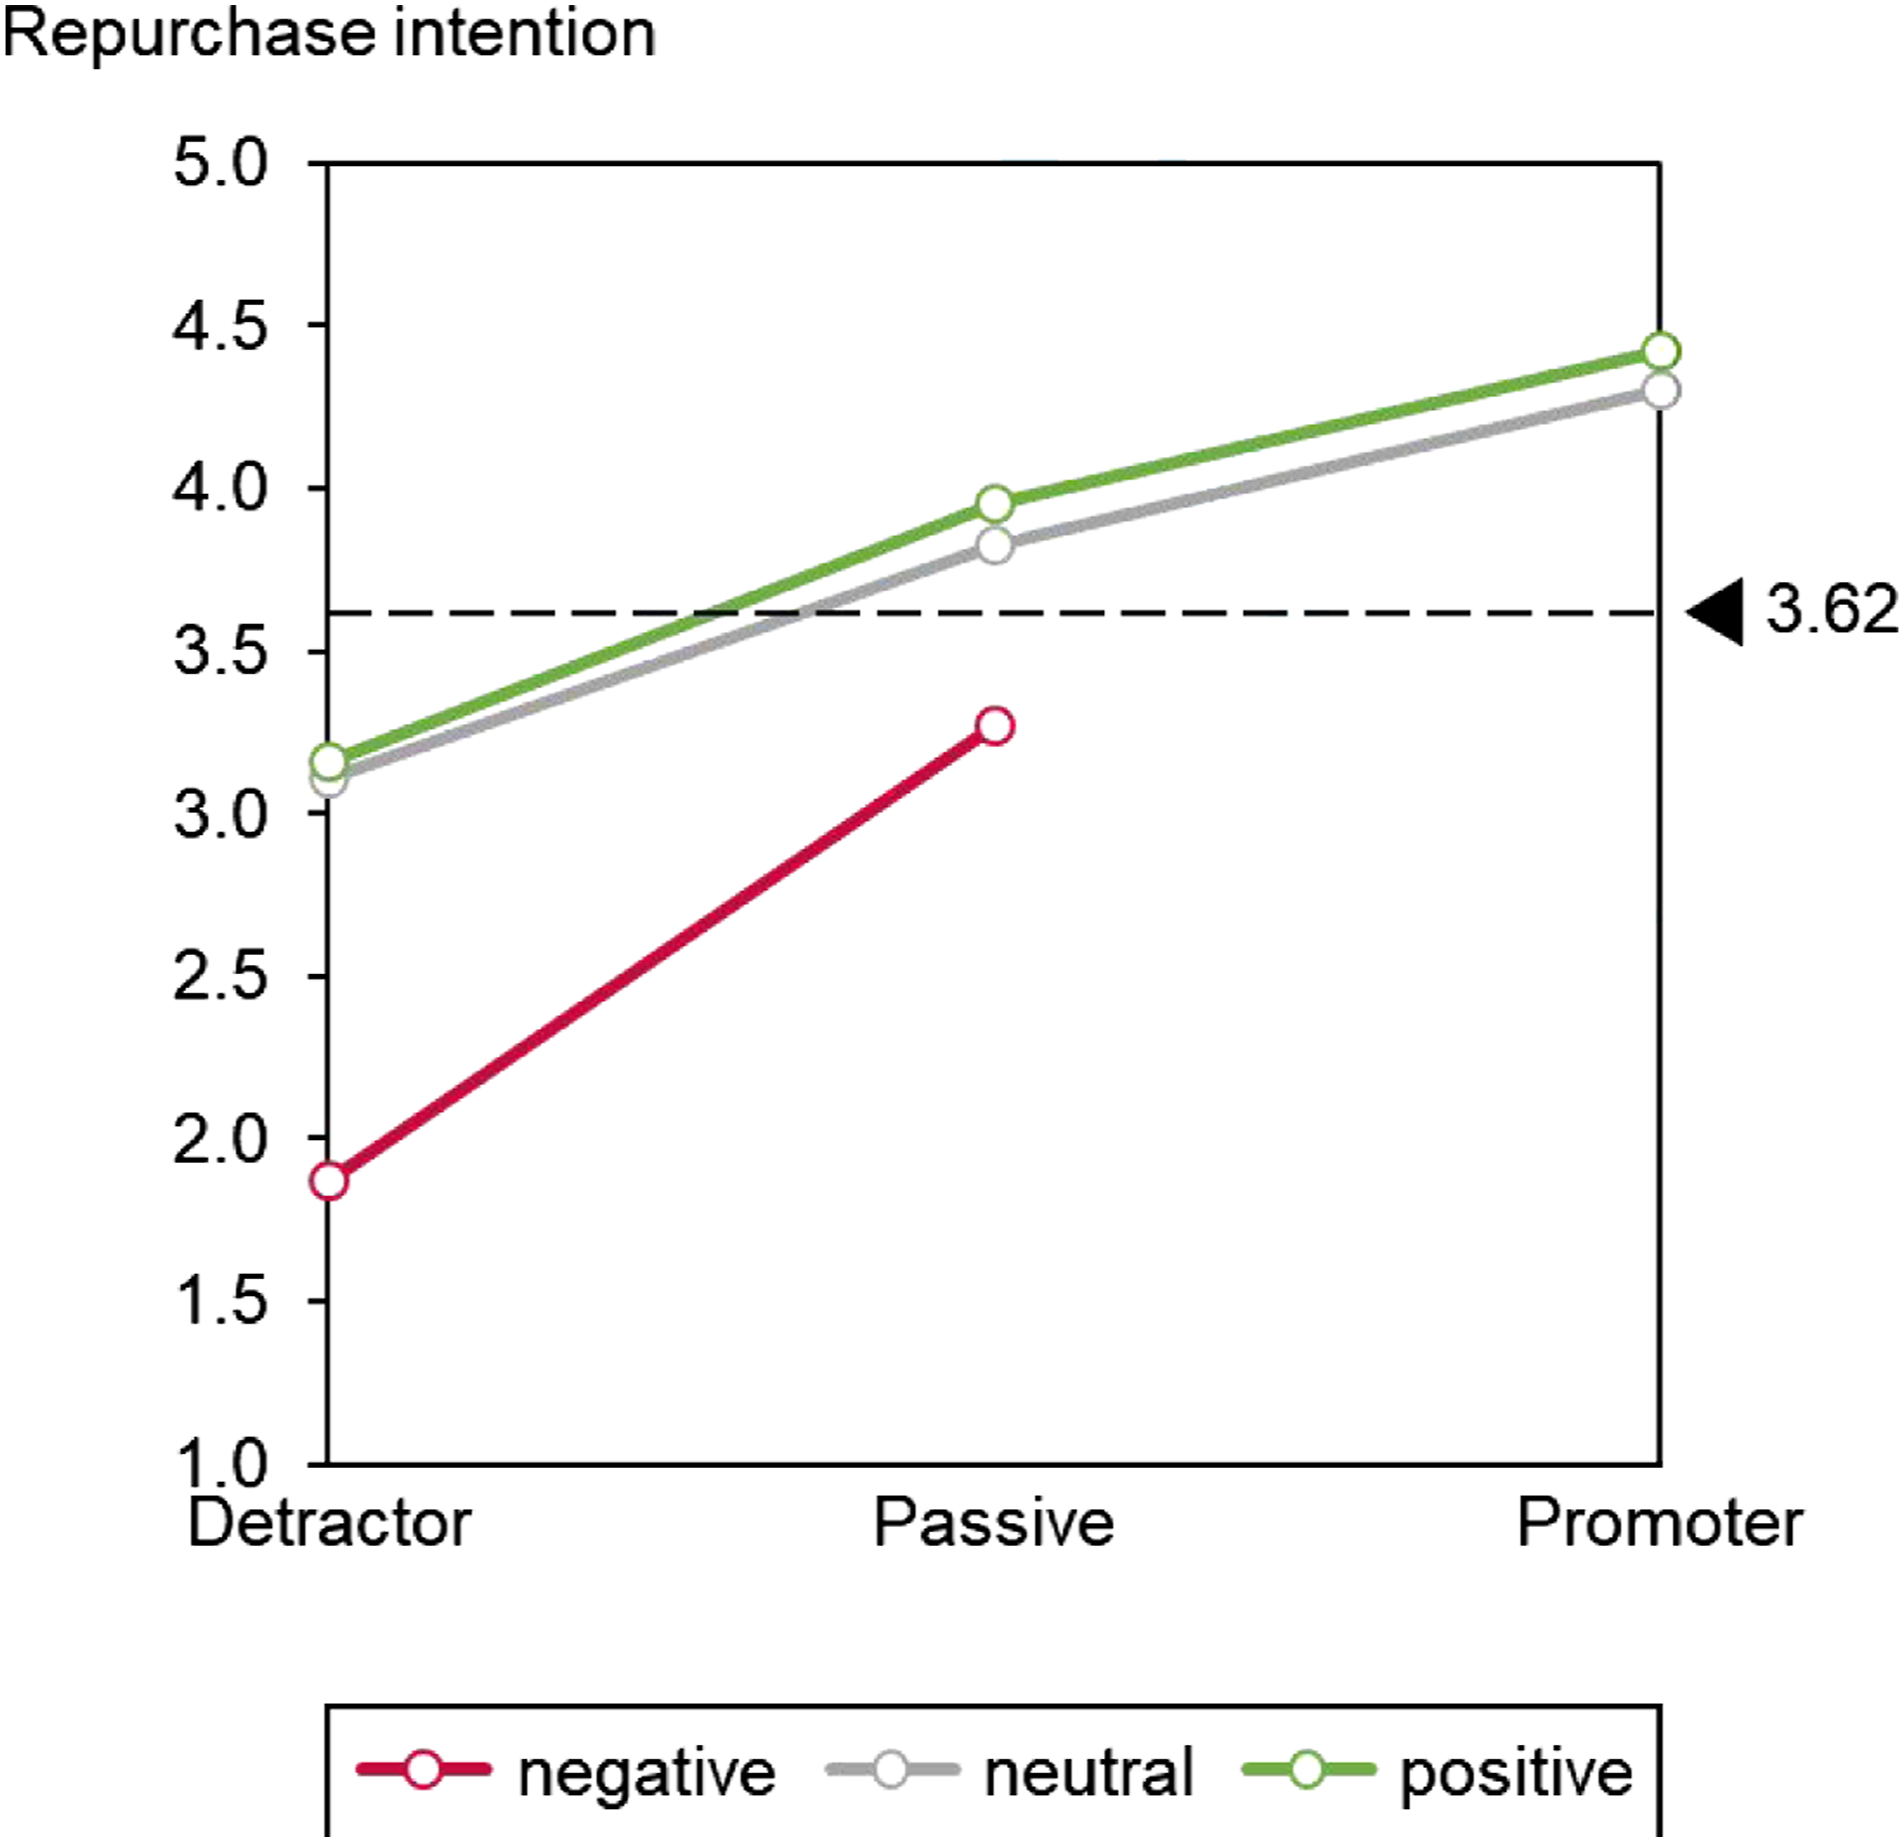
For cross-buying intention as an outcome variable, model 3 explains again most variance (adjusted R2 = .359). The interaction effect between NPS and NEV is significant, as Figure 4 shows. Promoters with a positive NEV have a higher cross-buying intention than Promoters with a neutral NEV, and Detractors with a negative NEV have a lower cross-buying intention than Detractors with a neutral NEV. Effect of NPS category and NEV category on cross-buying intention.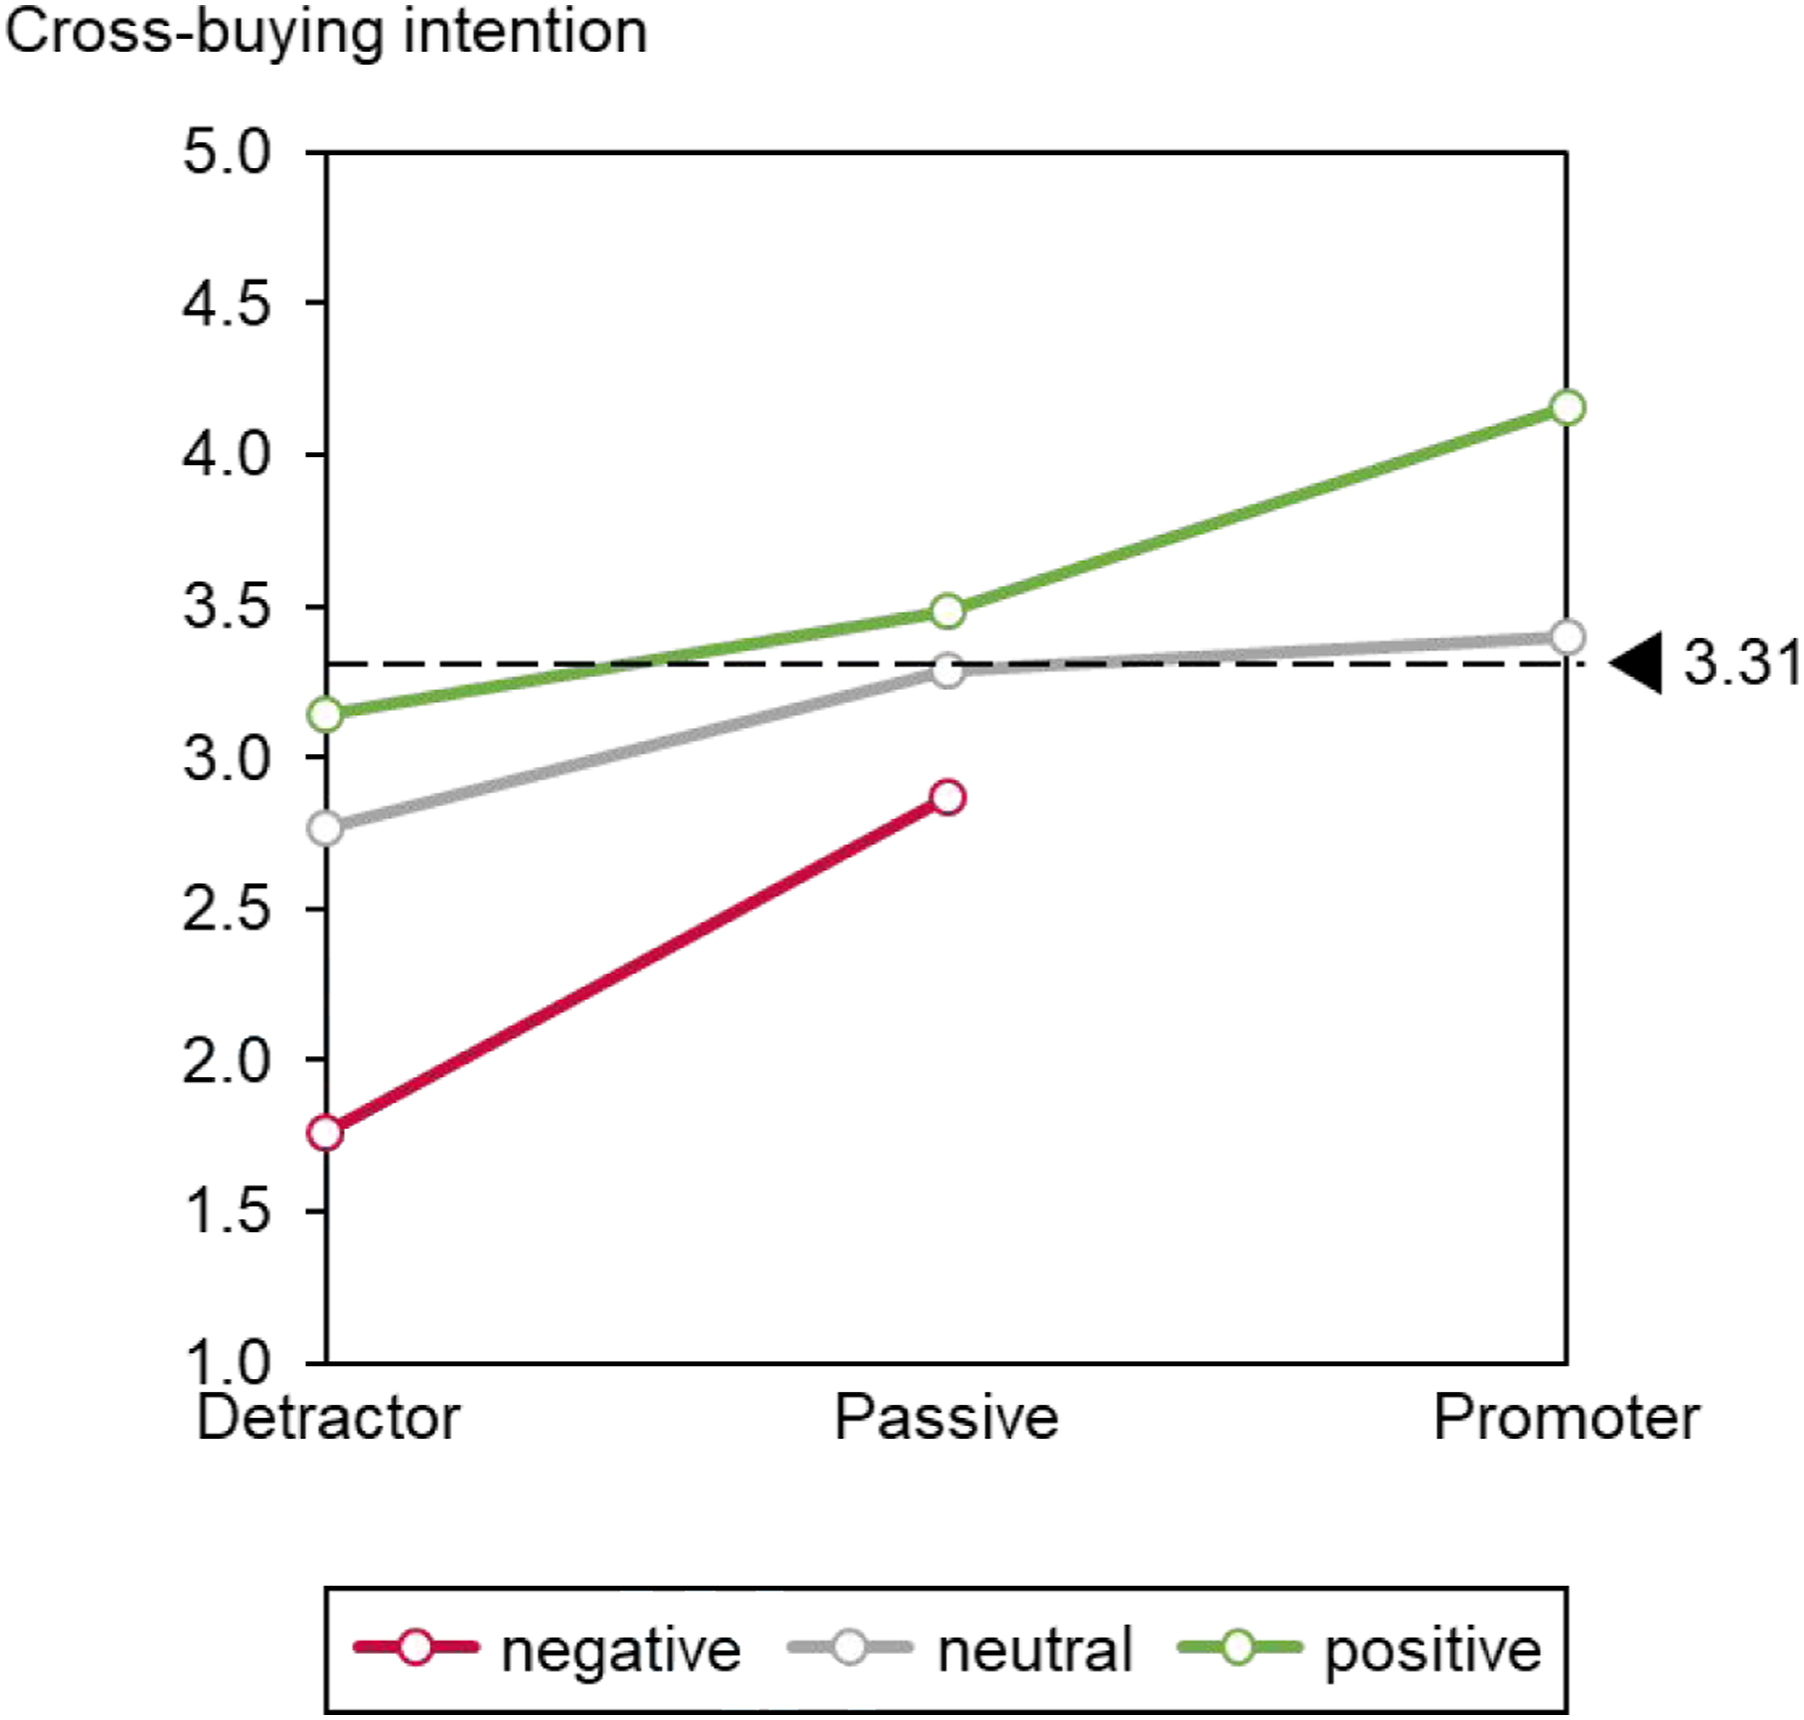
For average monthly spendings as a dependent variable, model 1 is marginally significant. Model 2 and model 3 are not significant.
Discussion
Our results show that emotions explain repurchase intention and cross-buying intention – in addition to NPS. Therefore, we recommend using NPS in combination with emotions, e.g., with NEV, to generate additional insights. For example, we find Promoters with a positive NEV have a higher cross-buying intention than Promoters with a neutral NEV, and that Detractors with a negative NEV have a lower cross-buying intention than Detractors with a neutral NEV (see Figure 4).
An emotional profile for Detractors, Passives, and Promoters provides more details. Figure 5 illustrates that Promoters mainly feel safe (87%), trusting (83%), and valued (79%), whereas Detractors mainly feel disappointed (44%), frustrated (40%), and neglected (37%). Emotional profile for detractors, passives, and promoters.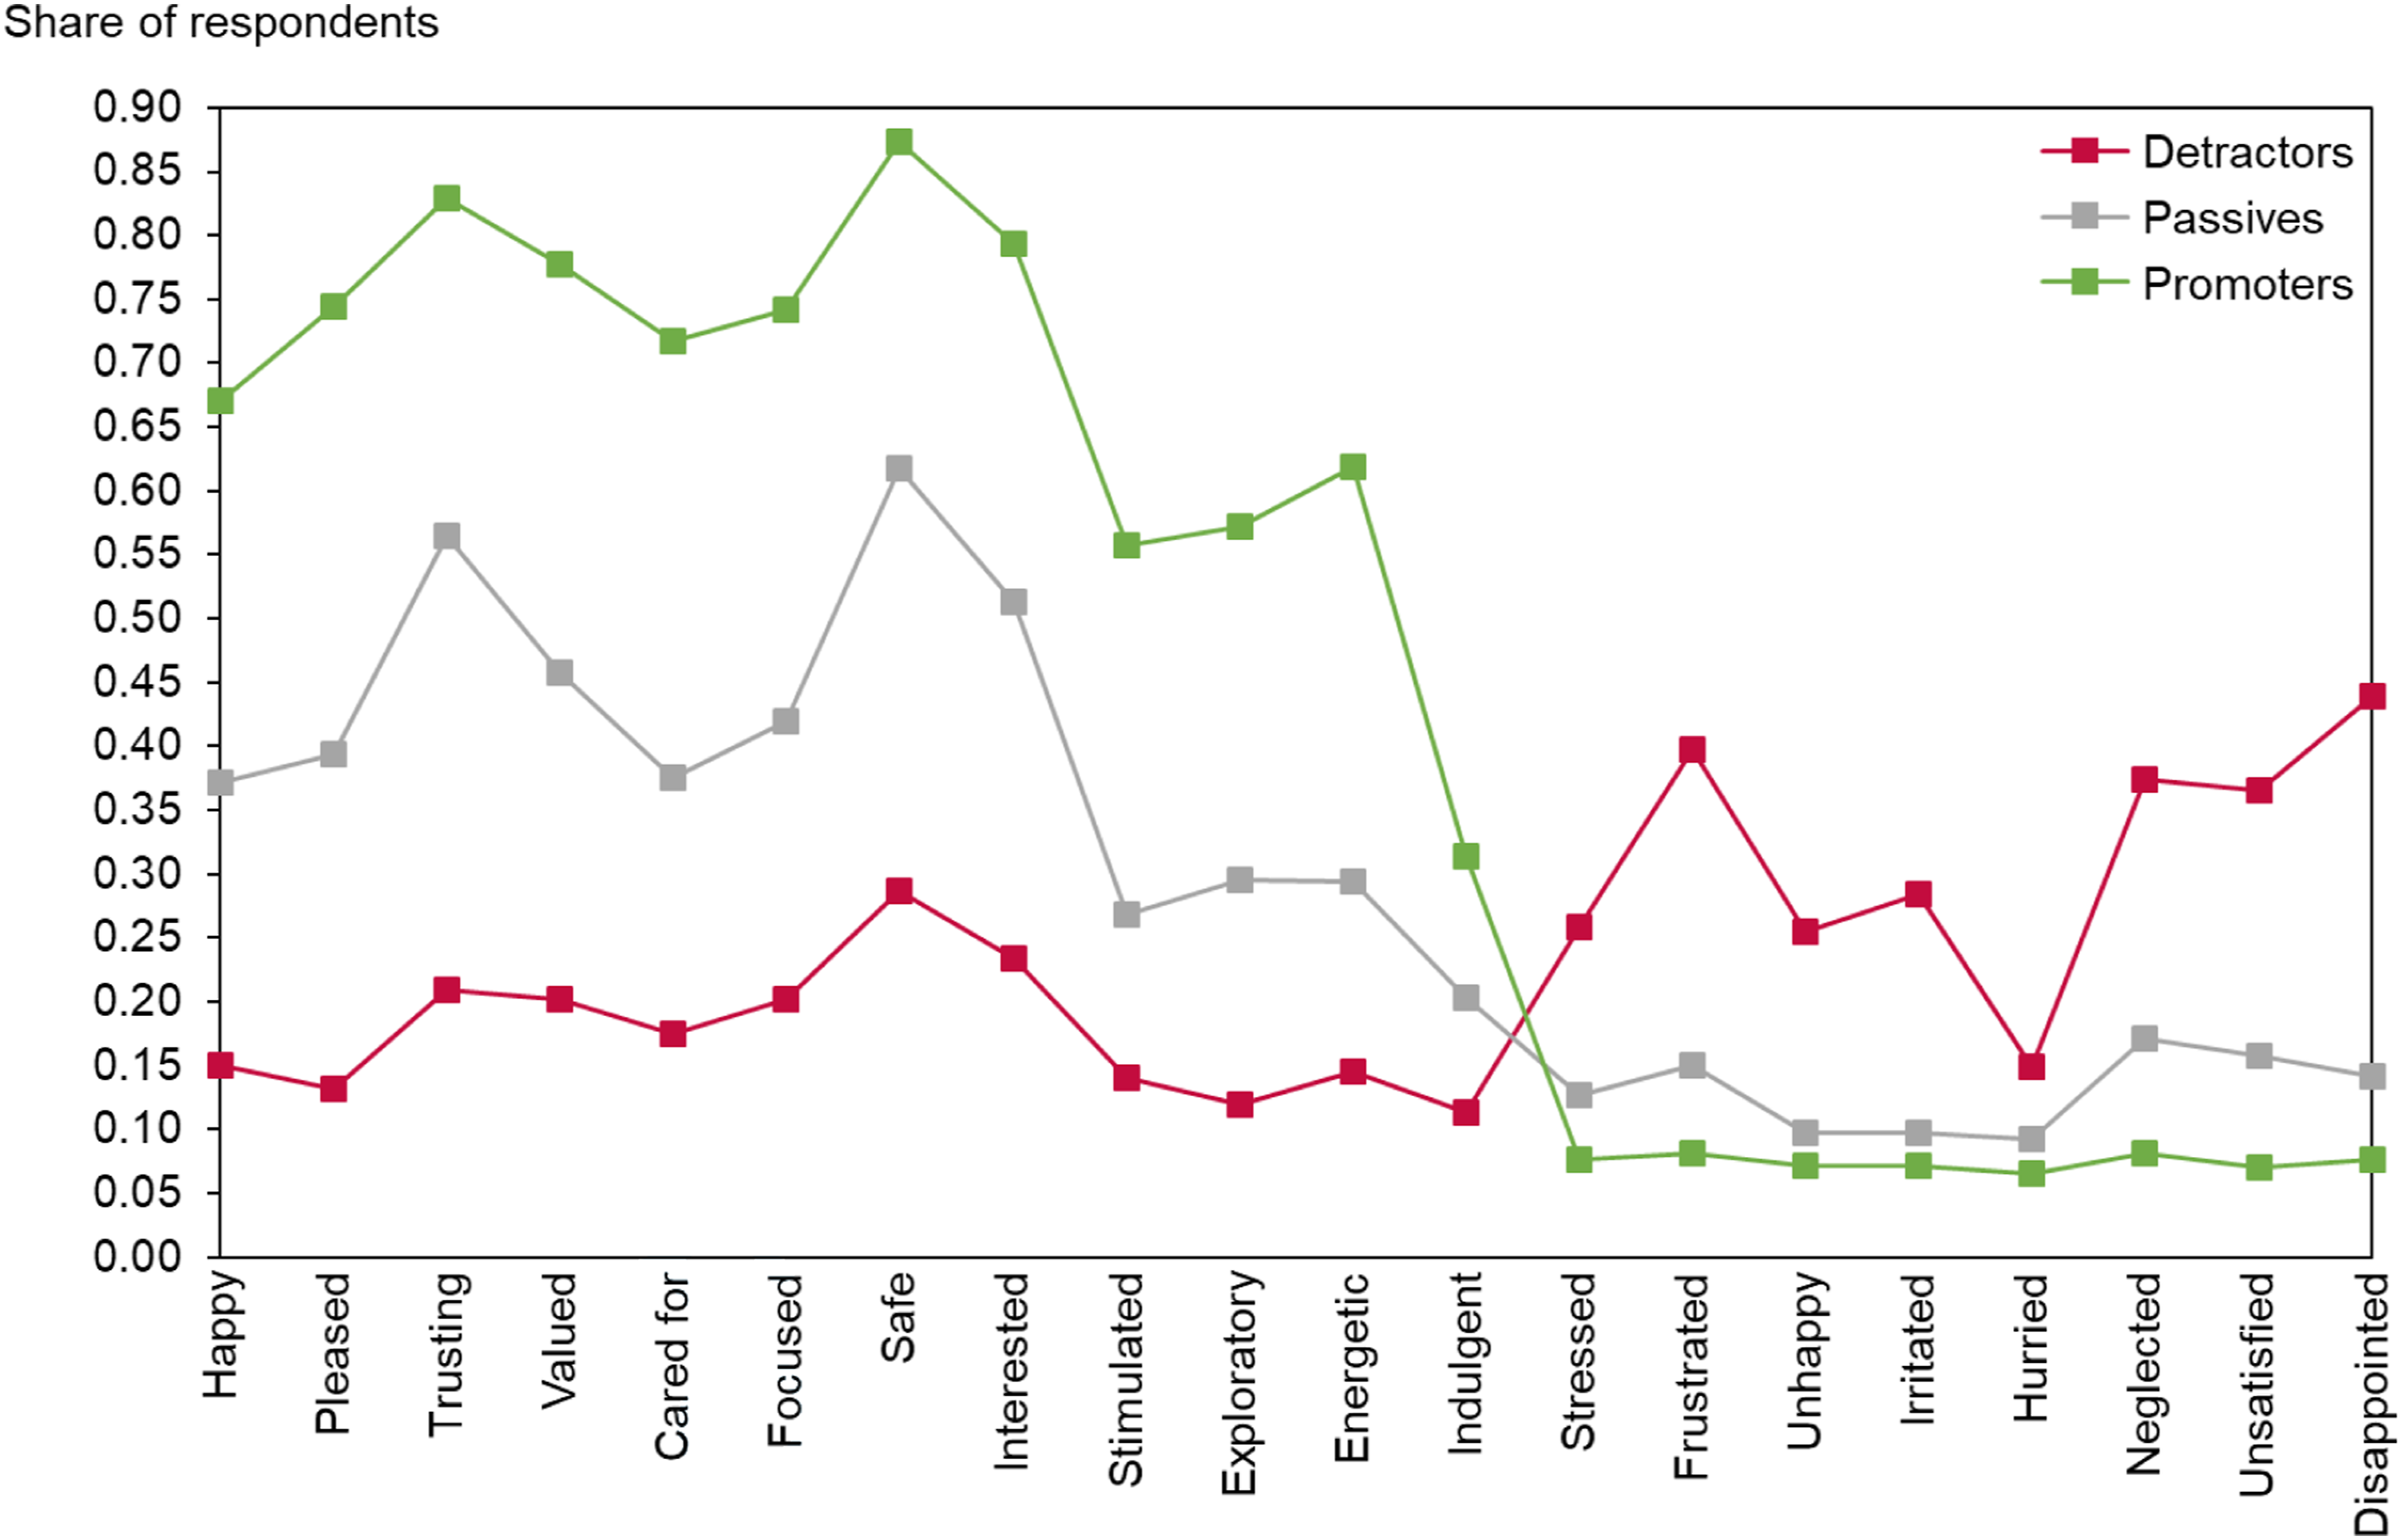
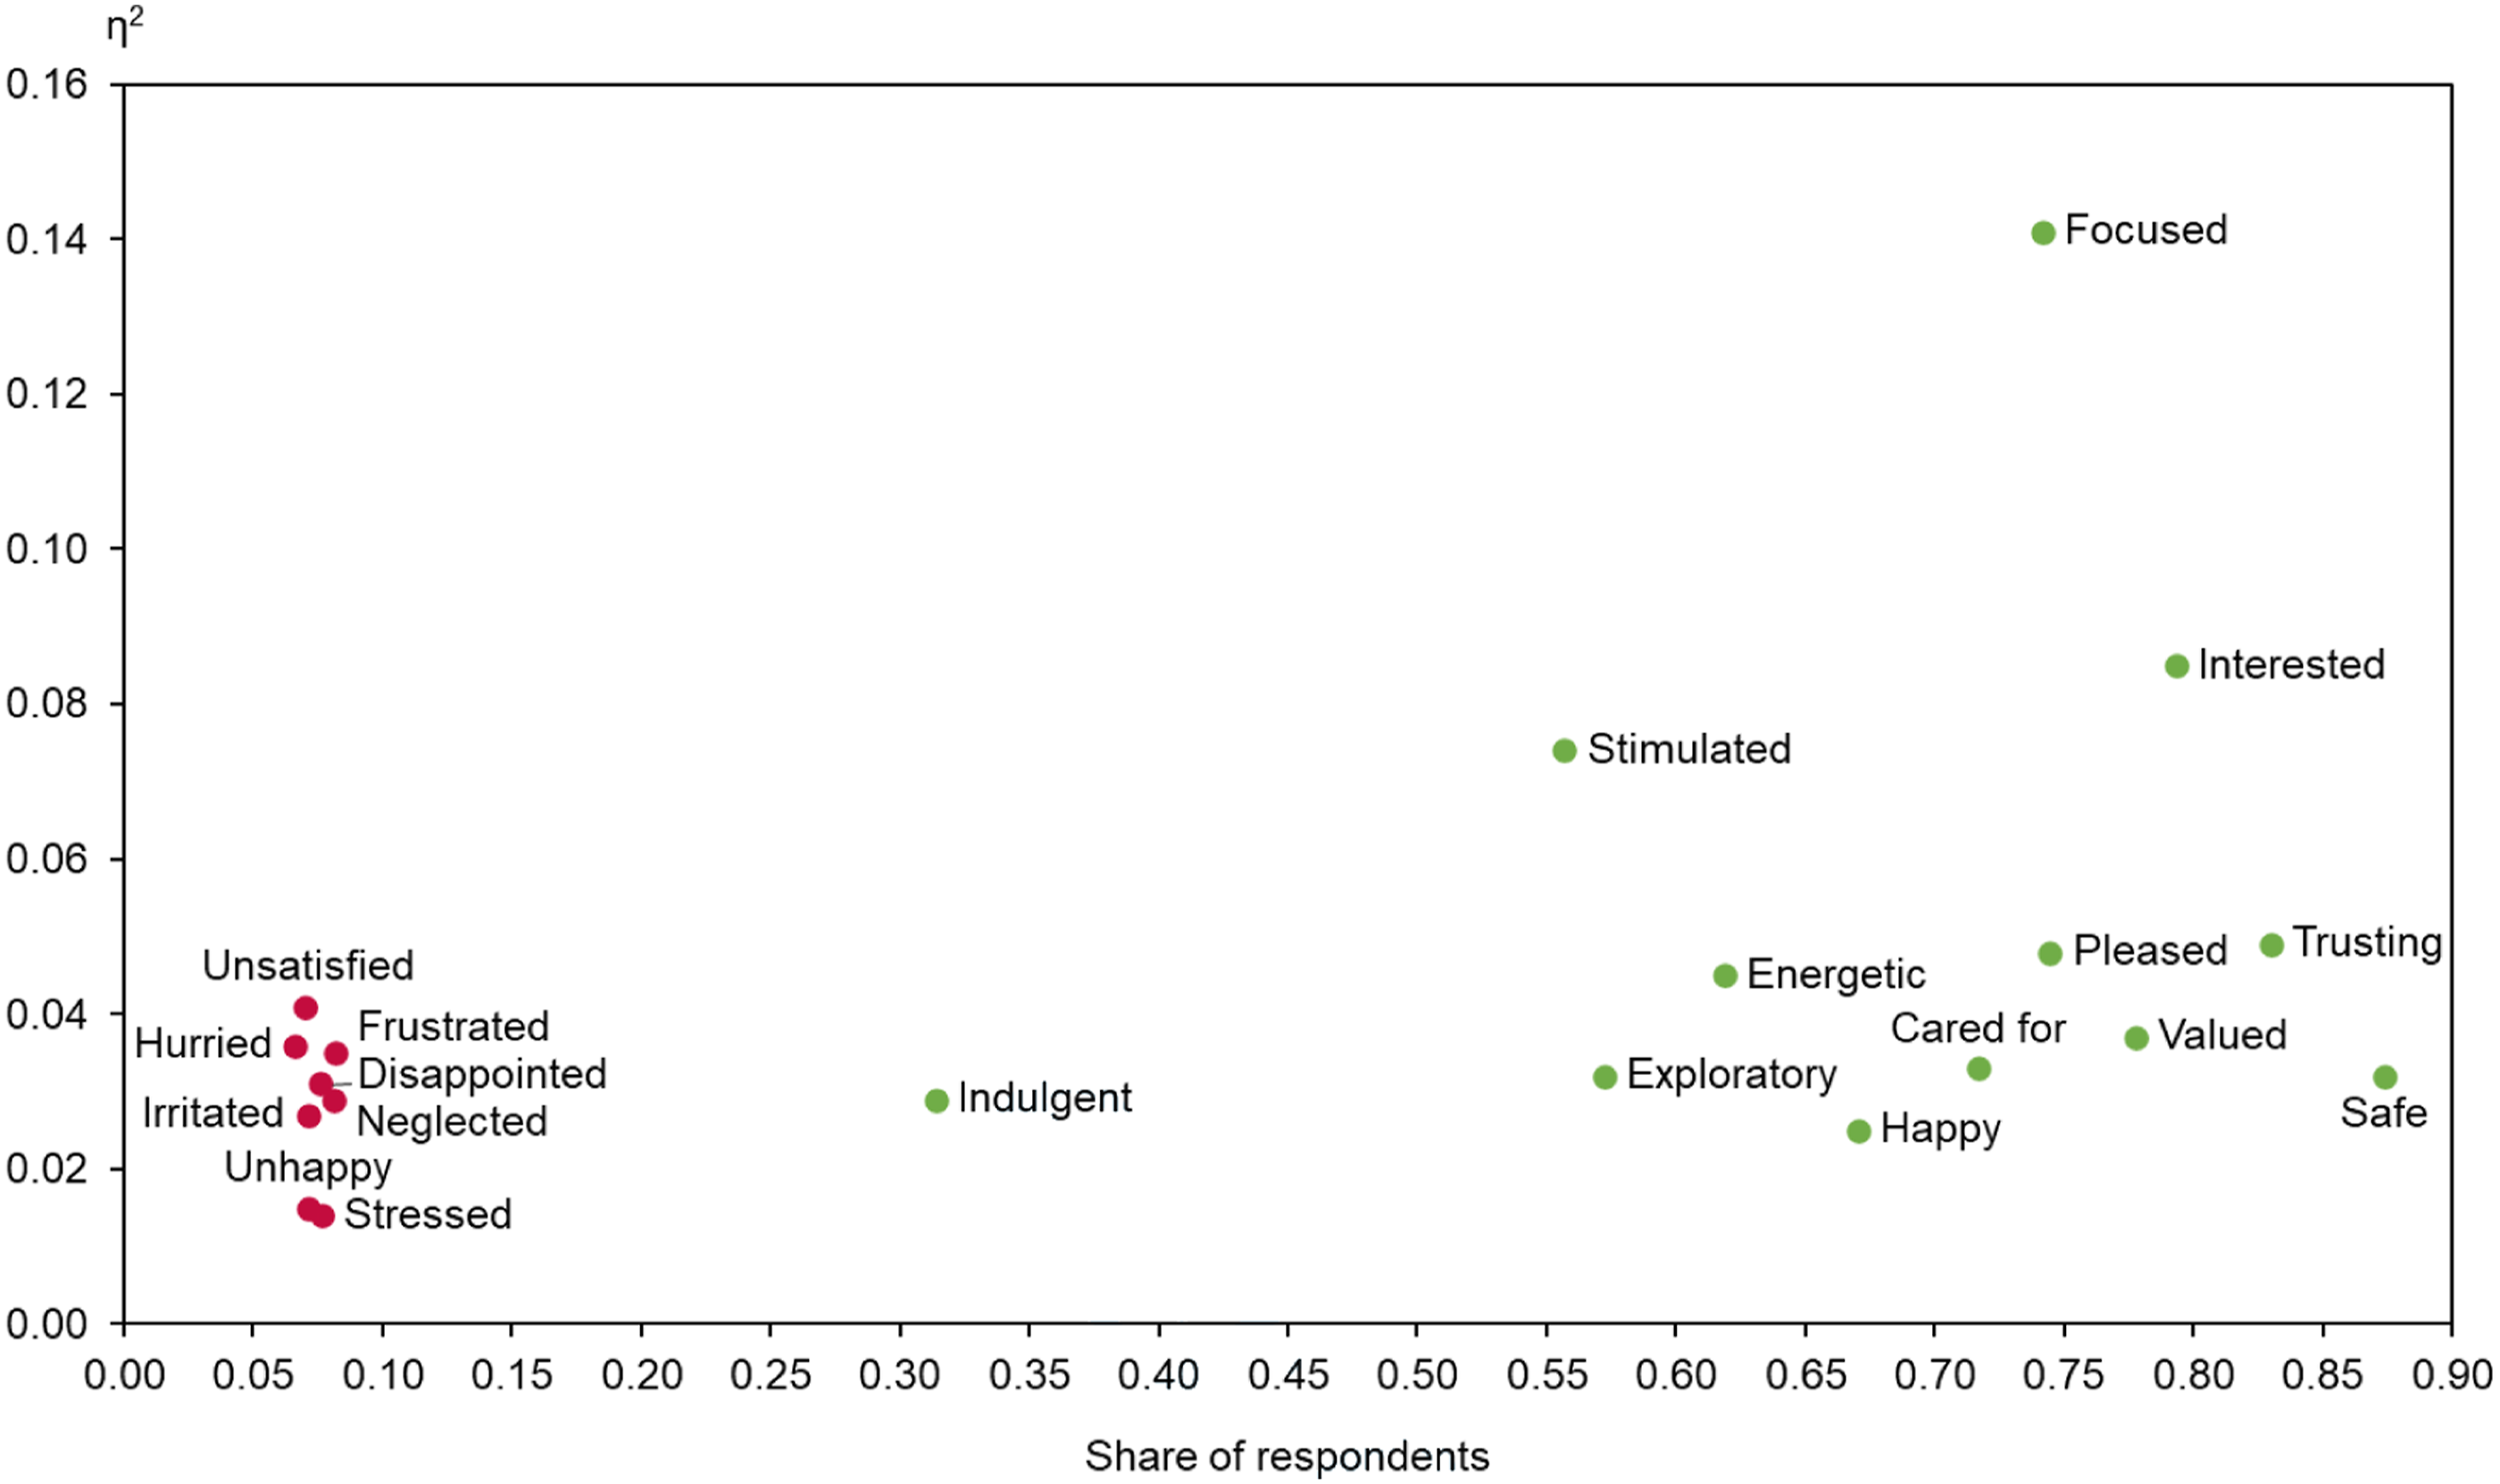
To identify emotions with the highest relevance, a driver analysis provides useful results. Figures 6 and 7 illustrate this for Detractors and for Promoters. The horizontal axis shows the share of respondents that feel an emotion, the vertical axis shows the relevance of that emotion for cross-buying intention.
10
For Detractors, for example, feeling stressed has the highest relevance. For Promoters, for example, feeling focused has the highest relevance. Driver analysis for cross-buying intention for detractors. Driver analysis for cross-buying intention for promoters.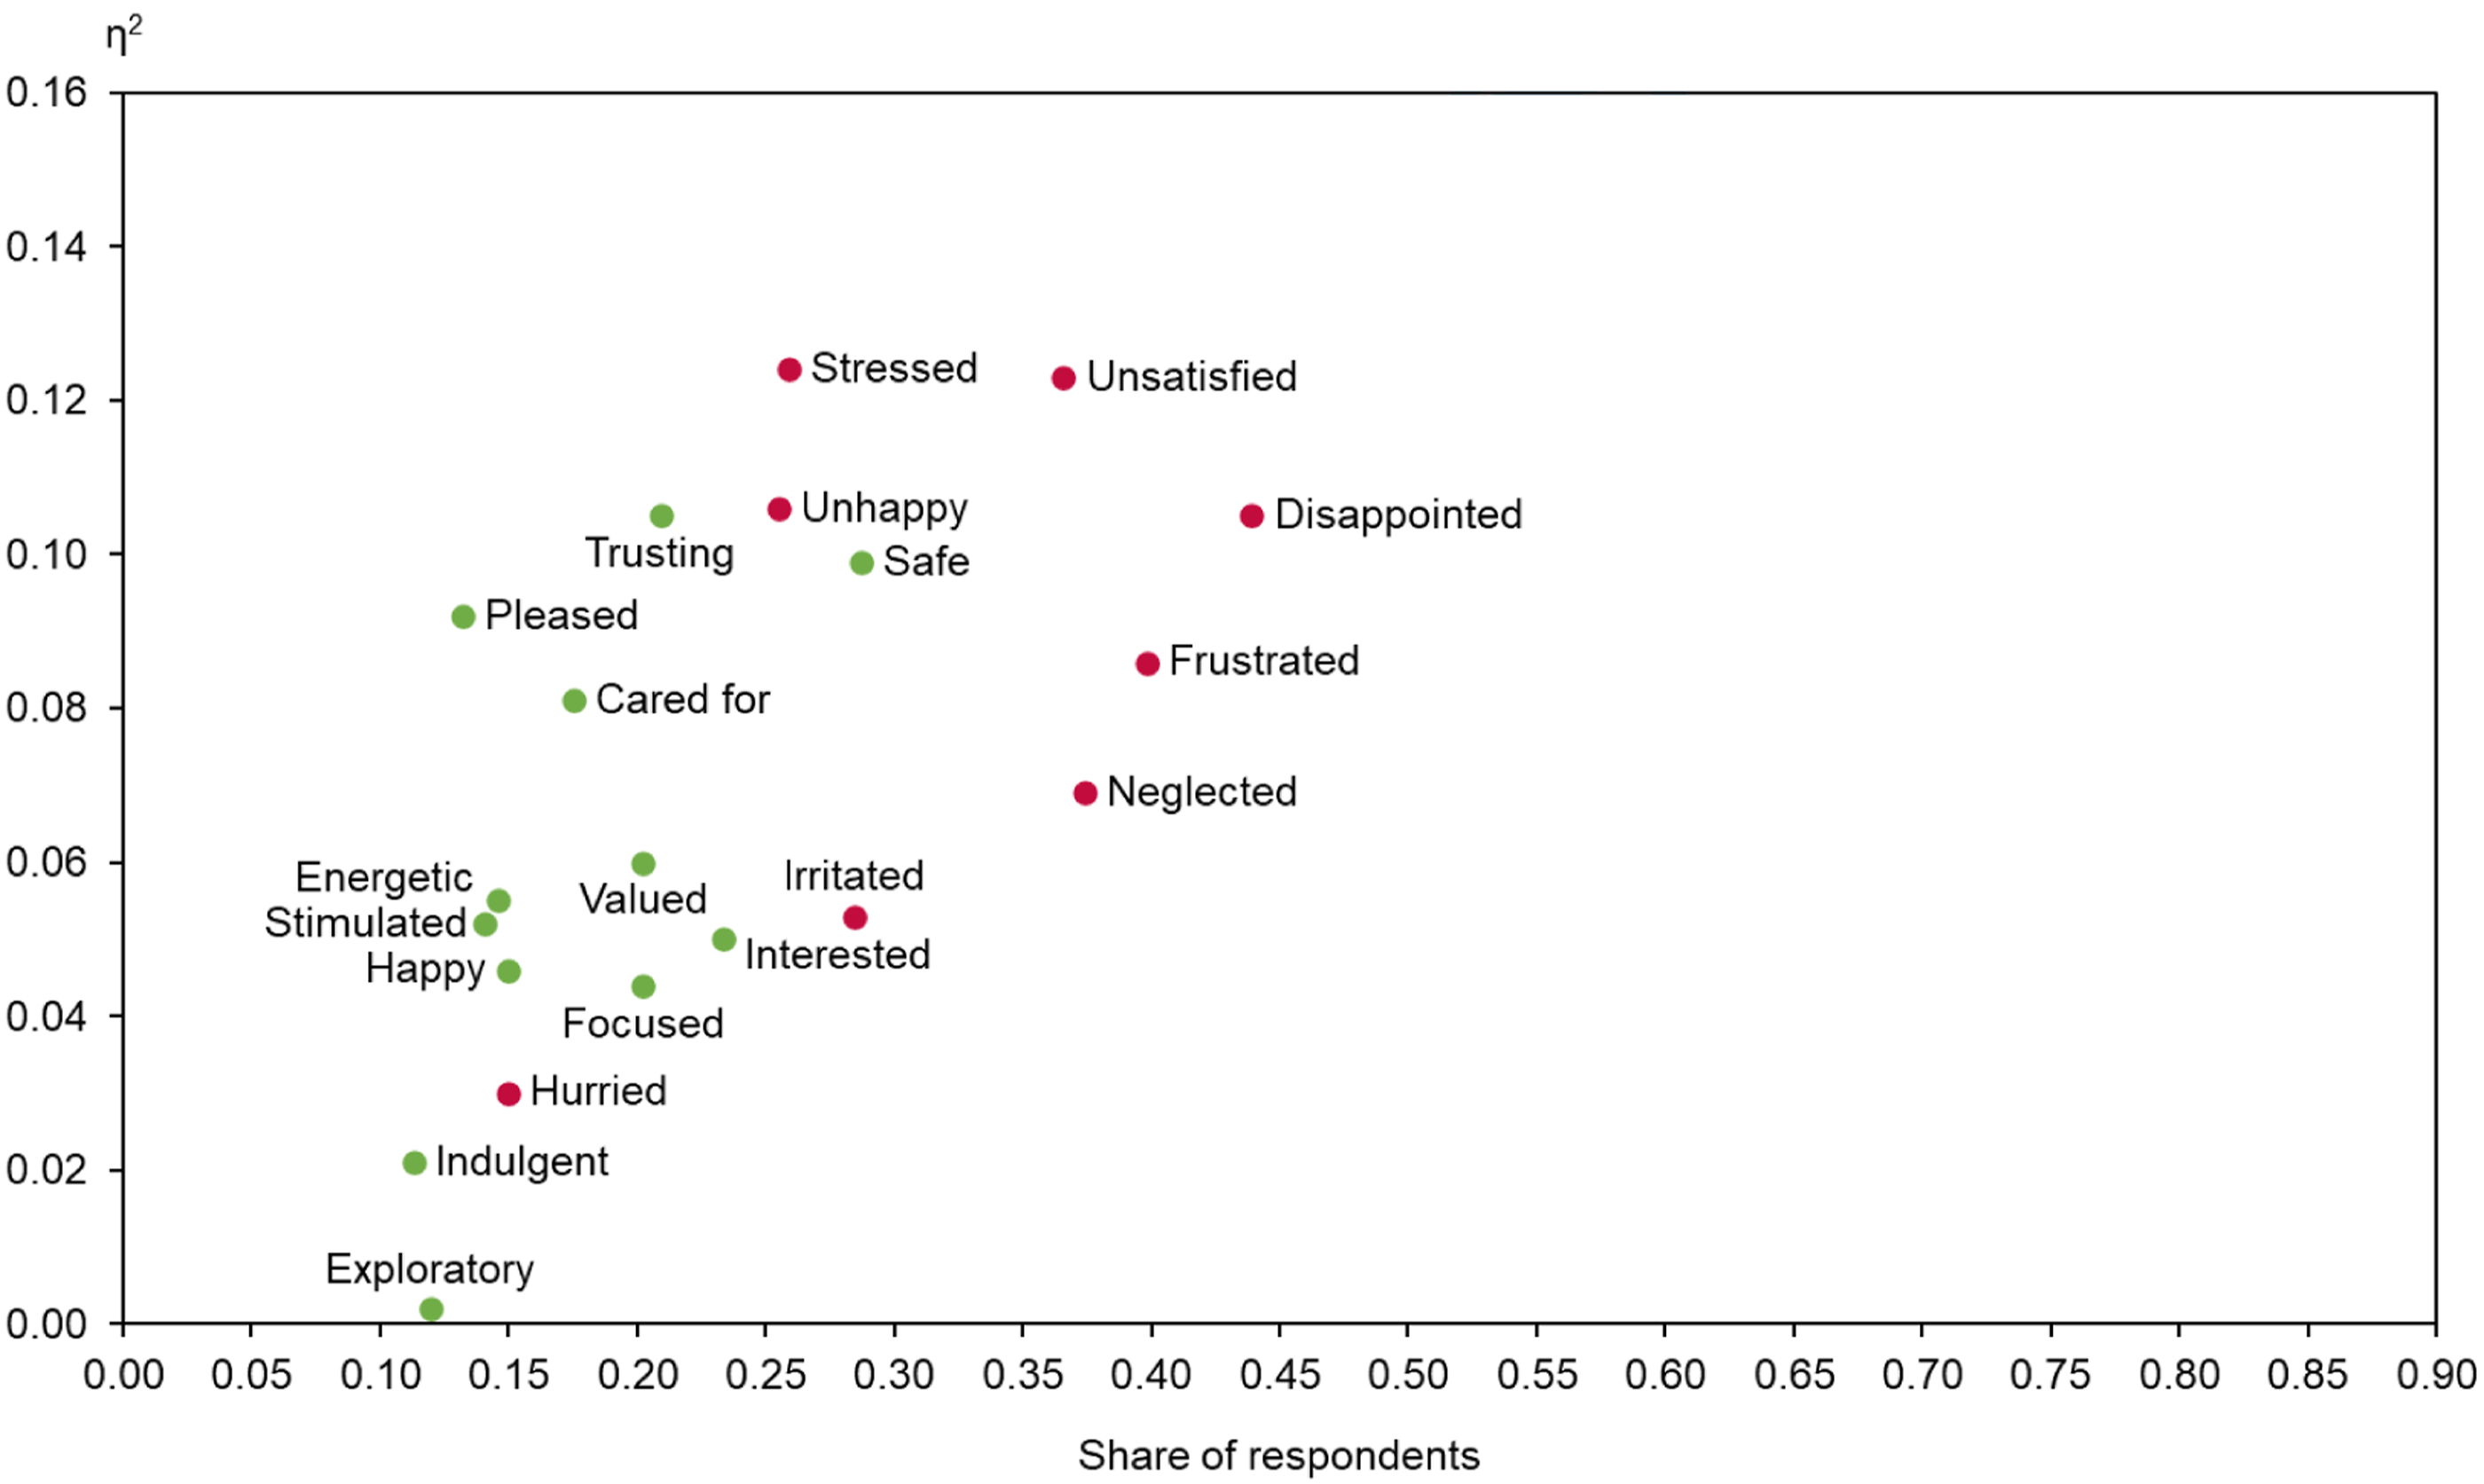
As proposed by De Haan et al. (2015), Figures 5–7 could be part of a dashboard that combines different CFMs. It enables a more detailed analysis of the different NPS categories. Additional split variables (e.g., sales channels or sales regions) could be added as well.
These insights are relevant in advertising, but also in personal encounters. Staff in pre-sales, sales, and after-sales should be trained accordingly. Furthermore, a monitoring of emotions could be established based on different data sources (e.g., survey data and text data).
The fact that average monthly spendings can hardly explained by NPS or NEV can be potentially explained by the industry. In the mobile phone industry, customers have contracts with durations of 12 months or 24 months, and average monthly spendings are rather constant. Instead of lowering average monthly spendings, customers that are Detractors or customers that have a negative NEV will rather not prolong their contracts.
Limitations and further research
We are aware that our study has limitations: • This paper focuses on one industry and one country. Emotions can be different in other industries and other countries. Further research could therefore adapt the emotions behind NEV and test alternative measures of emotions (e.g., Richins, 1997) to address some inconsistencies in NEV, e.g., unsatisfied as a negative emotion. According to Figure 2, we suggest that unsatisfied is rather a consequence of a negative emotion. Also, further research could apply NPS and emotions in both a hedonic and utilitarian consumption situation (e.g., Ladhari et al., 2017). • We assumed that negative emotions lead to negative consequences, and that positive emotions lead to positive consequence. However, negative emotions and positive emotions can coexist (e.g., Manthiou et al., 2020). • We used self-reported measures. Further research could use objective measures for outcome variables, e.g., actual repurchase behavior, actual cross-buying behavior, and actual monthly sales, which requires access to transaction data. • We conducted our analysis on the customer level. Further research could investigate the combination of NPS and NEV on the firm level. A time lag in the outcome variables could then be considered (e.g., Van Doorn et al., 2013).
In terms of further research, we see potential in different areas: • Customers write text in emails, in social media posts, or in forums. This text can be analyzed to identify emotions (e.g., Araujo et al., 2014; Fang & Zhan, 2015; Mingione et al., 2020). Further research could compare results based on survey data and results based on text data. • Also, as mentioned above, a monitoring of emotions could be established. Emotions could then be linked to different touchpoints along the customer journey (pre-sales, sales, and after-sales). • Differences between B2C and B2B are another avenue for further research. In business-to-consumer relationships, emotions have been investigated a lot more than in business-to-business relationships, although emotions are decisive in problematic business-to-business relationships (e.g., Ribas & De Almeida, 2021). • Lastly, the role of emotions in relationship surveys versus transactional surveys could be investigated further. We focused on the role of emotions in relationship surveys, i.e., surveys that are typically conducted every 12 months to assess the overall relationship. Emotions could also be measured in transactional surveys, i.e., surveys that are typically conducted after a specific transaction to assess a specific transaction. Here, emotions could be measured in combination with Customer Effort Score (CES), as suggested by Dixon et al. (2010). Also, emotions towards an employee could be distinguished from emotions towards a company (e.g., Manthiou et al., 2020).
Footnotes
Declaration of conflicting interests
The author(s) declared no potential conflicts of interest with respect to the research, authorship, and/or publication of this article.
Funding
The author(s) received no financial support for the research, authorship, and/or publication of this article.