
Abstract
The Net Promoter Score (NPS) is a popular metric for measuring customer loyalty and is claimed by Reichheld to predict a company’s growth. However, various academic studies provide controversial results regarding its reliability and prediction powers. This study analyzes how respondents answer the likelihood-to-recommend (LTR) question in different predescribed and validated situations. One thousand participants are presented with situation descriptions that consist of previous and recent experiences with a bank and are asked how they would respond to the LTR question after such an experience. The results indicate that respondents do not always give a high score for good experiences, and a low score for bad experiences. However, with a high number of respondents, the different answering approaches even out, and the NPS results are higher for good than for bad experiences. Additionally, we notice that whereas negative experiences are evaluated as low by all respondents, Generation X and Boomers tend to give lower scores for neutral and positive experiences. Those with lower income and basic education give lower scores for neutral experiences. The recent experience influences the customer’s likelihood of recommending more than the previous experiences with the company.
Introduction
Customer satisfaction and loyalty are effective ways for a company to improve future sales (Baehre et al., 2022; Gruca & Rego, 2005; Marsden et al., 2005), market share (Morgan & Rego, 2006), and customer profitability (Jahnert & Schmeiser, 2021; Korneta, 2018). After Reichheld (2003) proposed that the only number a company needs to grow is the Net Promoter Score (NPS), it has gained immense popularity amongst companies for its straightforward and easy application in various sectors (Florea et al., 2018), and some critique from researchers because of the methodological and other approaches to the original NPS study (Baehre et al., 2022; Fisher & Kordupleski, 2019).
Even if the company has provided a decent service level, this does not mean that the customer’s intention to recommend, which the NPS measures, would consistently translate into an actual recommendation, or that a detractor would criticize the company (Stahlkopf, 2019). Therefore, it is important to understand customers’ views on how they answer the likelihood-to-recommend (LTR) question.
This study examines the NPS methodology from the customer’s perspective. The NPS, one of the most popular measures of customer satisfaction and loyalty, defines whether the customer is a promoter, detractor, or has a neutral attitude. However, the LTR scale does not explain how to choose the score or what these scores mean; therefore, customers must interpret the scale. When calculating the NPS value, 9-10 in the LTR scale are defined as promoters, 7-8 as neutrals, and 0–6 as detractors. The NPS is calculated as the difference between the percentages of promoters and detractors. However, this rationale for grouping the scores has been challenged by several researchers (Grisaffe, 2007; Kristensen & Eskildsen, 2014; Lewis & Mehmet, 2020; Pingitore et al., 2007).
We conducted a pre-study of semi-structured interviews with 20 respondents in September 2022 to determine how they answered the LTR question. The logic for answering the questions differed among respondents. Some respondents were optimistic, giving a score of 10 when nothing bad happened, whereas others never give a score of 10 in their lifetimes. Interpretations of the different scores on the scale differed among the respondents. Additionally, the influence of the most recent experience with the company varied. Seven respondents were willing to recommend a company even after a bad experience, whereas six stated that one bad experience meant no positive recommendation.
Customers’ views on how they answer the LTR question are analyzed in previous literature only briefly, mainly by categorizing customer comments (Følstad & Kvale, 2018) and analyzing their explanations for the selected score (Lewis & Mehmet, 2020). Nevertheless, in all previous studies, conclusions have been made about the scores, but the actual customer experience has been unknown. Therefore, the interpretation is biased by customer experiences being different, and studying the impact of the recent experience is impossible as the recent and previous experiences are unknown.
The aim of this study is to define the influence of the recent experience on the LTR score. We also describe the logic behind answering the LTR questions in different scenarios and how different sociodemographic factors influence the NPS score.
This study analyzes customer views by comparing answers to the LTR questions in the same imaginative situations. To compare the subjective evaluations of individual respondents for the same questions and circumstances, we created nine different situations wherein positive, neutral, and negative previous and recent experiences are combined. This enables us to understand customer reactions after knowing the underlying situation and enrich the current literature by understanding how respondents react to different situations and how the recent experience impacts NPS results. We use an ISO-certified panel of 1000 respondents to understand the influence of education, gender, income level, generation of respondents, and the previous and recent experiences on the likelihood of a recommendation. In the literature review, we discuss NPS classification logic, individual differences, circumstances influencing NPS answers, and NPS relations with actual customer sentiment.
Literature review
Problems with NPS Classification Logic and its Relation with the Customer’s Real Sentiment
Several authors have discussed the issues with the classification logic of NPS. Fisher & Kordupleski (2019) criticize the NPS logic of defining passives, classifying them as customers who do not recommend the brand. Many studies have upheld the idea of concentrating only on promoters because companies with the highest share of top-2-scores are the most successful, regardless of their detractors or passives (Baehre et al., 2022; Morgan & Rego, 2006; van Doorn et al., 2013).
In contrast, Grisaffe (2007) questions the logic of showing a score of 6 as a detractor, as some customers can take it as being on the positive side of the scale’s midpoint. Lewis & Mehmet (2020) find that customers who are defined as passive according to the NPS classification expressed as much appreciation towards the company as customers classified as promoters; hence, they propose that from the perspective of customers’ attitudes, the promoter definition should be extended to scores of 7–10. They show that customers with a highly positive attitude towards the company mainly choose a score of 10, whereas customers with a moderately positive attitude towards the company respond between 7–10, with 10 and 8 being the most selected options.
Seal & Moody (2008) indicate that the classification, in general, loses the “shades of difference in the strength of perception,” as both 0 and 6 mean the same, whereas they do not necessarily show the same level of customer loyalty and respondent’s perceived likelihood to recommend the company or product. Fisher & Kordupleski (2019) propose focusing more at NPS numbers not classifications, as customers who choose scores of 5–6 can potentially be converted into passives, and passives can potentially be improved into promoters when customer needs are understood more precisely. Eskildsen & Kristensen (2011) propose calculating only the average of all LTR scores rather than categorizing them to obtain better insight into different answers.
In some cases, the selected score does not correspond to customer sentiment about the company. Considering that the respondent may only have brief exposure to the brand, as pointed out by Fisher & Kordupleski (2019), the decision made about recommendation likelihood can be shallow and change completely during the business relationship. Kristensen & Eskildsen (2014) find that customers who would have liked to not answer, selected mostly 0–5 as their LTR score. The share of low score evaluations instead of “no answer” is especially significant for men (57.9%), but much less for women (Eskildsen & Kristensen, 2011).
Customers can also choose a low score to the LTR question not owing to a negative sentiment but because they know they would not be talking about the subject. Schulman and Sargeant (2013) show this in an example of the non-profit sector, where donors often chose a low score because they found the subject not discussable but remained loyal donors.
Additional complexity is added by Stahlkopf (2019), who show that a person could be a promoter and detractor simultaneously — recommending the company to one friend but not another. Customers who have experienced this may struggle to find the “right” answer when answering the LTR question. This leads to the following research question:
How many customers provide logical LTR scores in accordance with the NPS classification considering the scenarios and experiences described to them?
Individual Differences and Circumstances Influencing NPS Answering
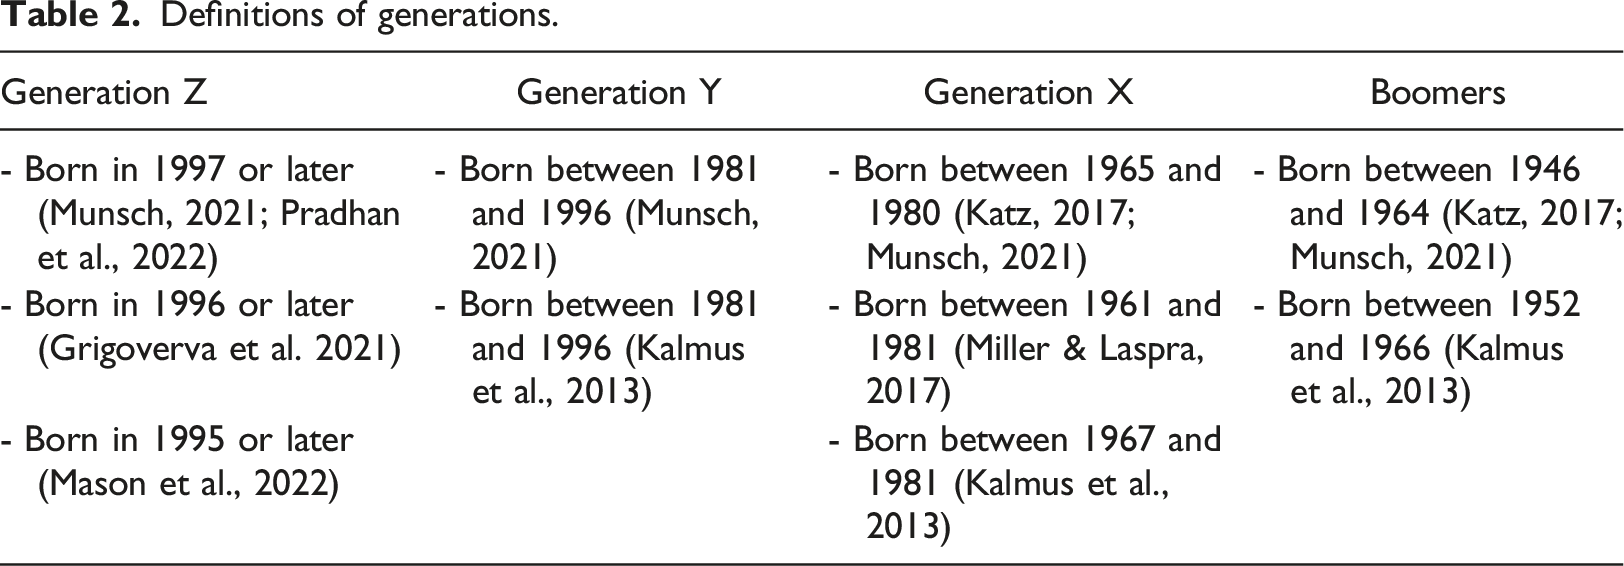
Few studies have been conducted on intergenerational differences in the NPS context. Situmorang (2017) finds that customers born between 1976–1997 (Generation Y) give, on average, a lower NPS to companies than those born from 1998 onwards (Generation Z). Additionally, Katz (2017) finds that Boomers have a high sense of self-importance and believe in the power of individual choice, which may make them less willing to recommend companies. Generation X is a transitional generation; it has seen both material abundance and economic hardship, making them hard-working, busy, and ambitious (Katz, 2017; Miller & Laspra, 2022). Digitalization has significantly changed generations Y and Z. Generation Y is more self-confident and optimistic, coping well with constant change, but is less independent than previous generations (Laor & Galily, 2022). Generation Z has fewer emotional connections with brands and expects more personalized and efficient customer service than previous generations (Gutfreund, 2016). They expect authentic brand recommendations and prefer microinfluencers to macroinfluencers and celebrities (Pradhan et al., 2022). Generation Z consumers generally conduct more online research before purchasing than previous generations (Grigoreva et al., 2021); hence, recommendations play an important role to them.
In terms of gender differences, Eskildsen & Kristensen (2011) show that women are more likely to be promoters than men, and that these women promoters are more likely to choose a score of 10. However, men are more likely to provide high detractor ratings, such as 5 and 6, whereas women may select a score of 0.
Some studies show that more educated, high-earning, and younger customers are more satisfied with their internet banking services than less educated, lower-earning, and older customers (Seyal & Rahim, 2011). Service convenience is most valued by customers with high incomes (Benoit et al., 2017); hence, the general experience may have a significant effect on their LTR score. This leads to the second research question:
To what extent is the likelihood of a recommendation influenced by individual differences of customers, such as generation, gender, income level, and education? The NPS answers can also be influenced by the situation. Følstad & Kvale (2018) find that customers who assess their experience based on a concrete transaction are more likely to recommend the company than those who base their assessment on general brand perception, product experience, and the entire customer journey. As this field is rarely examined, our third and most important research question is as follows:
How do different situations, especially the recent experience, influence the likelihood of a recommendation?
Methodology
Data Collection
Participants are presented with a description of an imaginative situation that consists of either a positive, neutral, or negative previous experience with a bank and a positive, neutral, or negative recent experience with this bank (nine combinations in total). The participants are then asked to evaluate how likely they are to recommend this bank to their friends or colleagues.
The situations were created based on the principles of the SERVQUAL model (Parasuraman et al., 1991) while also acknowledging the results of previous research by Benoit et al. (2017); Darzi & Bhat (2018); Shamsi et al. (2023); and Teeroovengadum (2022). Previous experience included descriptions of reliability (technical reliability of cards and online banking), tangibles (online banking channel appearance and simplicity of use), and responsiveness (speed and friendliness of responses to questions). Recent experiences were based on responsiveness (speed and friendliness of responses), assurance (knowledge of employees), and empathy (friendliness and attention) in a service situation wherein customers were trying to change their payment card limits. Online banking is referred to as the main banking channel because it is used by 91% of the customers in Estonia (Remmelg, 2022).
Main tone (-s) of situations defined by respondents.
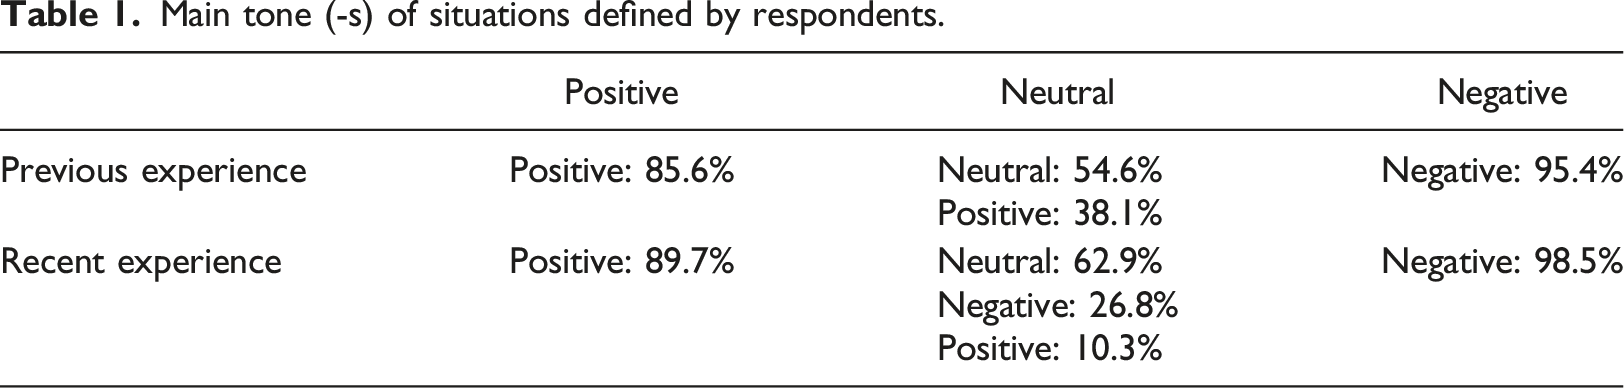
The research sample of the main study is sourced from Norstat, an online panel provider in Estonia. The panel used is ISO-certified and offers a representative sample of 1000 respondents. The questions were presented in Estonian or Russian language, depending on respondents’ preferred language. Online surveys and public sample lists have been also used in similar research (Lewis & Mehmet, 2020).
Data Analysis
Definitions of generations.
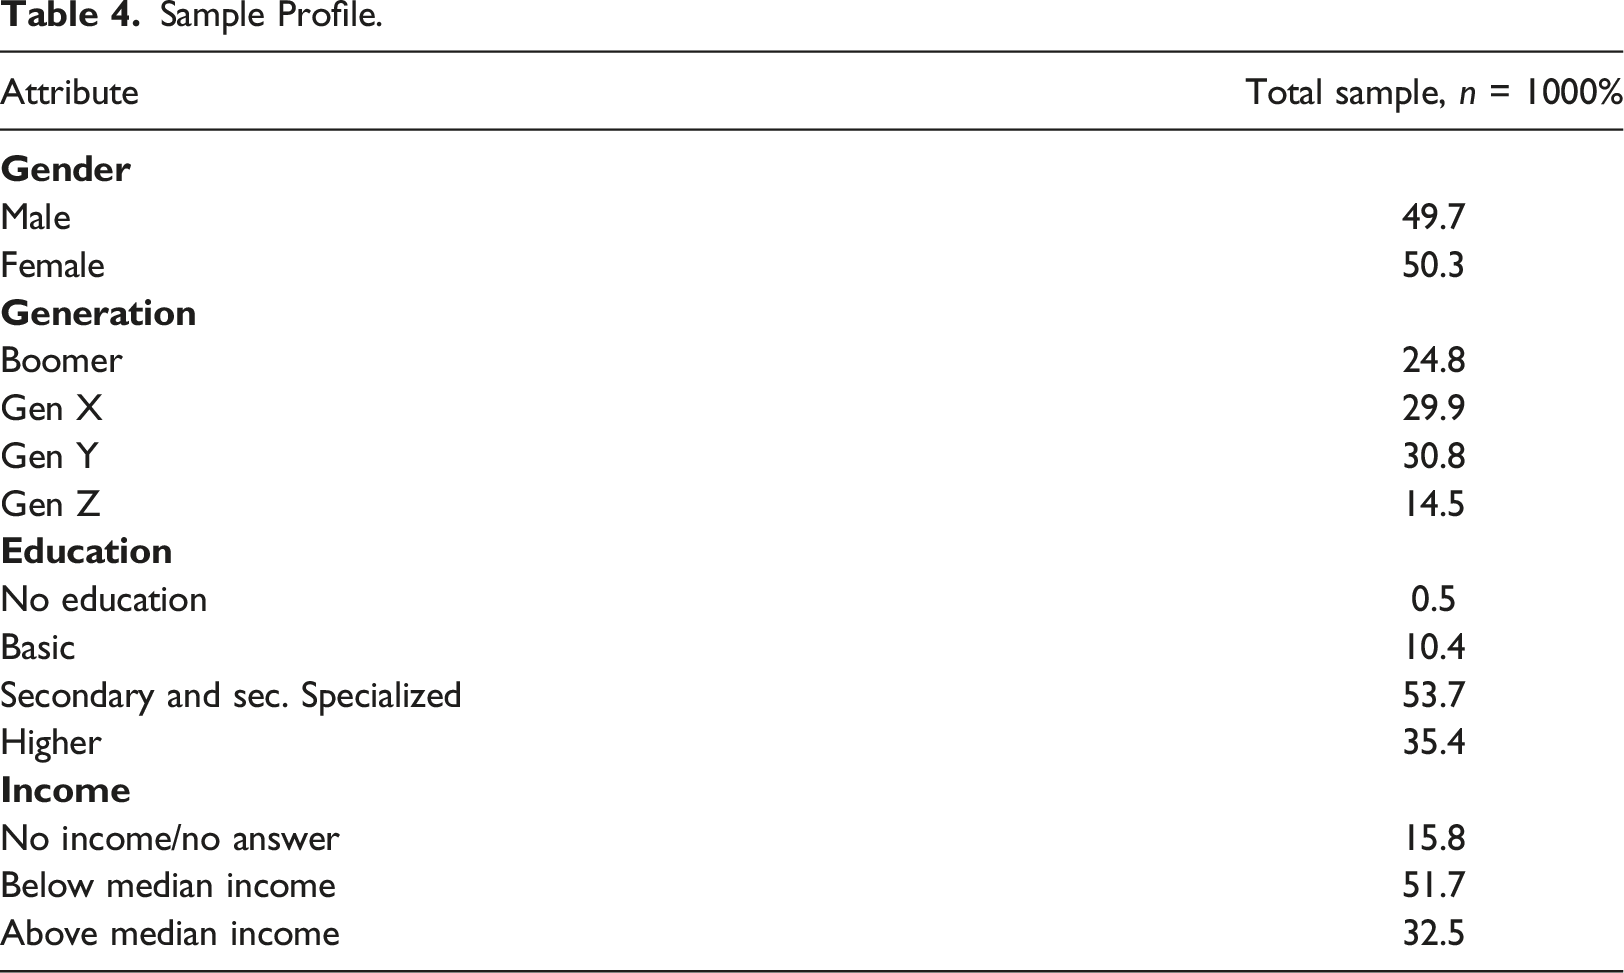
The respondents are divided into three groups based on their net income: below the Estonian median net income, above the Estonian median net income. Those who have no income or do not wish to answer are excluded from the analysis. Information about gender, generation, education, and net income groups is coded and analyzed using the SPSS statistical analysis tool. Customers without prior education are excluded from analysis. NPS values are calculated using Microsoft Excel.
Logic of answering.
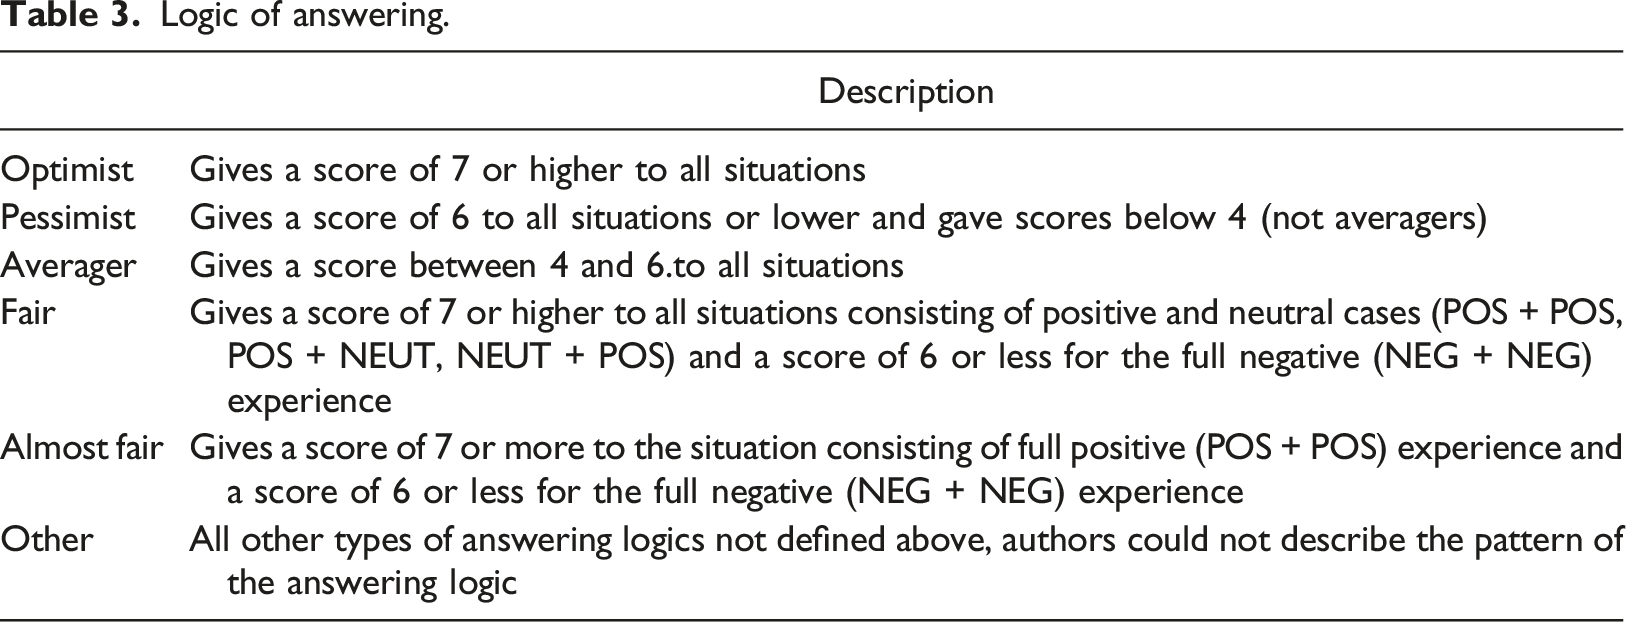
When analyzing the results, we calculate NPS for different scenarios and customer groups. Using the Mann–Whitney U test, we test different groups to understand which groups have statistically different distributions of answers. We describe the statistically relevant differences based on the answers’ distribution and the share of promoters, neutrals, and detractors. We also conduct a regression analysis to determine the factors influencing the LTR scores in different situations.
Results
General Overview
Sample Profile.
NPS for different situations.
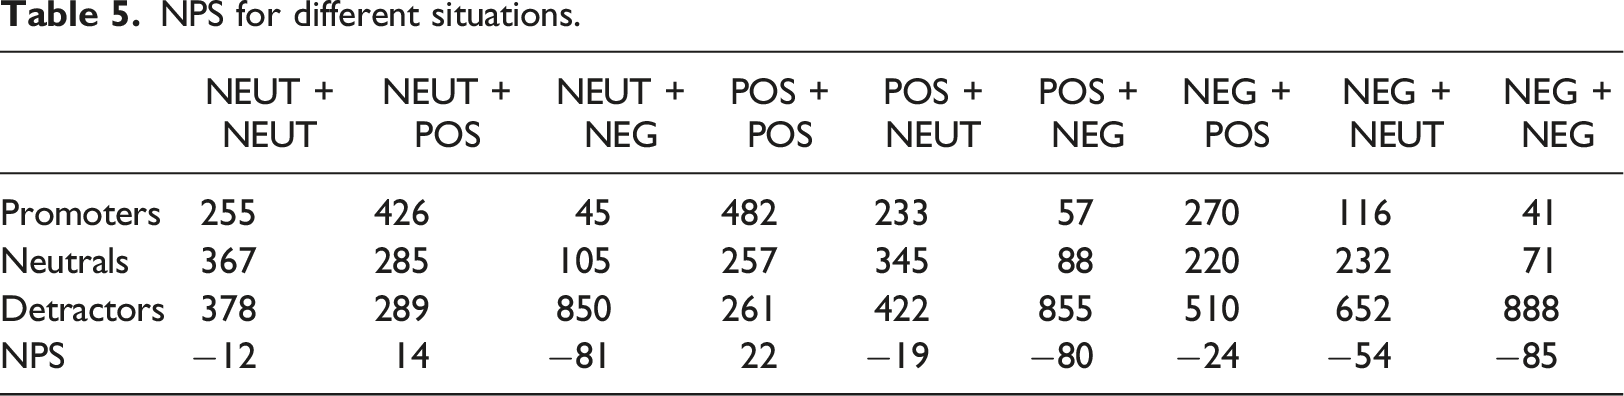
The resulting NPS varies from −85 points for a full negative experience (NEG + NEG) to 22 points for a fully positive experience (POS + POS). Responses with a negative recent experience receive the lowest NPS, depending on whether the previous experiences are positive (−80), neutral (−81), or negative (−85). However, regarding the recent neutral experience, the NPS is significantly lower (−54) when the previous experience is negative than when it is positive or neutral (−19 and −12, respectively). The effect of the recent positive experience is stronger when previous experiences are either positive (22) or neutral (14) but less so when the previous experience is negative (−24).
Regression analysis for different scenarios.
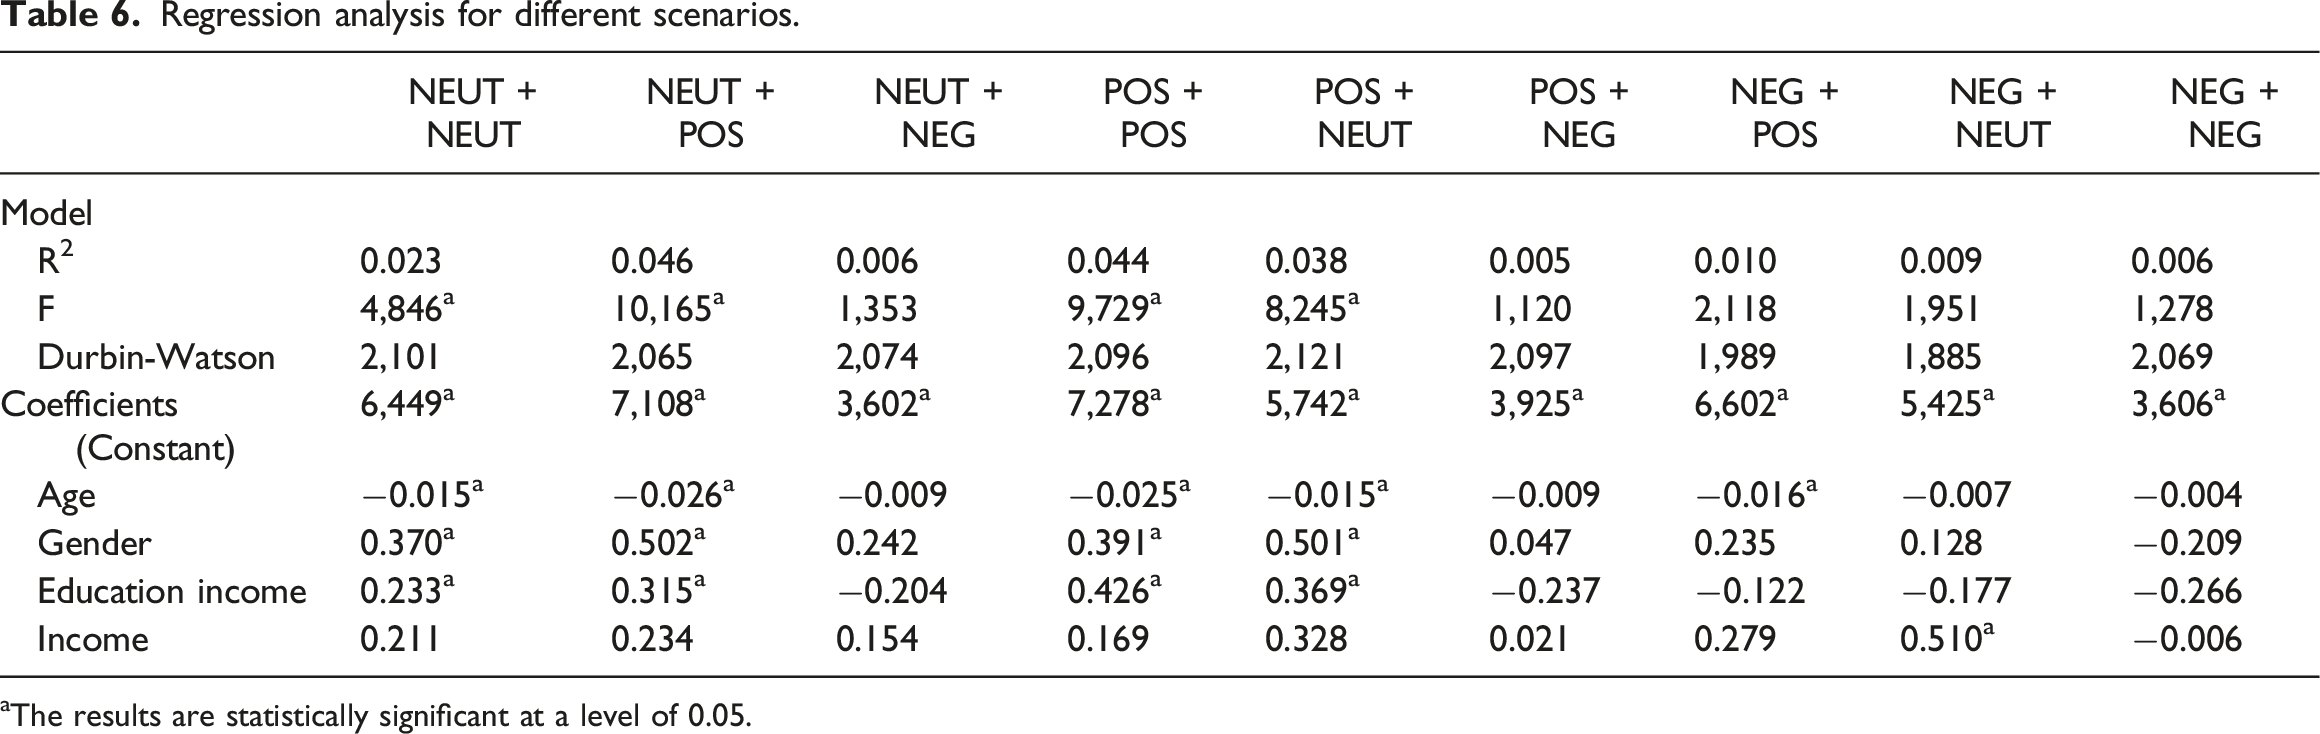
aThe results are statistically significant at a level of 0.05.
Table 6 shows that although the R2 values are below 5% and age, gender, education, and income only slightly describe the variability of the answers, they have a statistically relevant influence on LTR scores in some situations. In situations involving positive and neutral experiences, younger respondents, women, and respondents with higher education are more appreciative and are willing to give a high LTR score. The customer income group does not significantly affect the given score in most situations.
Regression analysis with previous experience as an influencing factor.
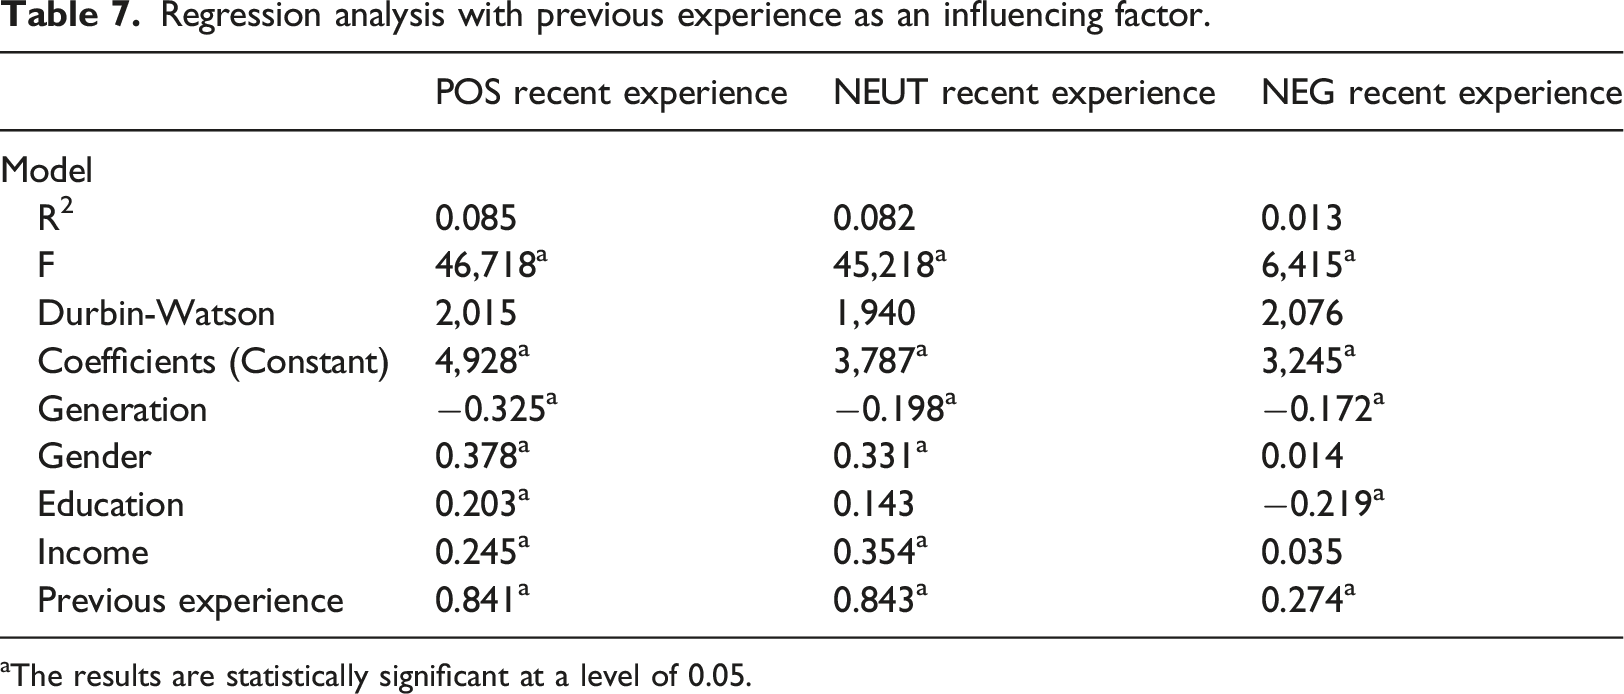
aThe results are statistically significant at a level of 0.05.
Regression analysis with recent experience as an influencing factor.
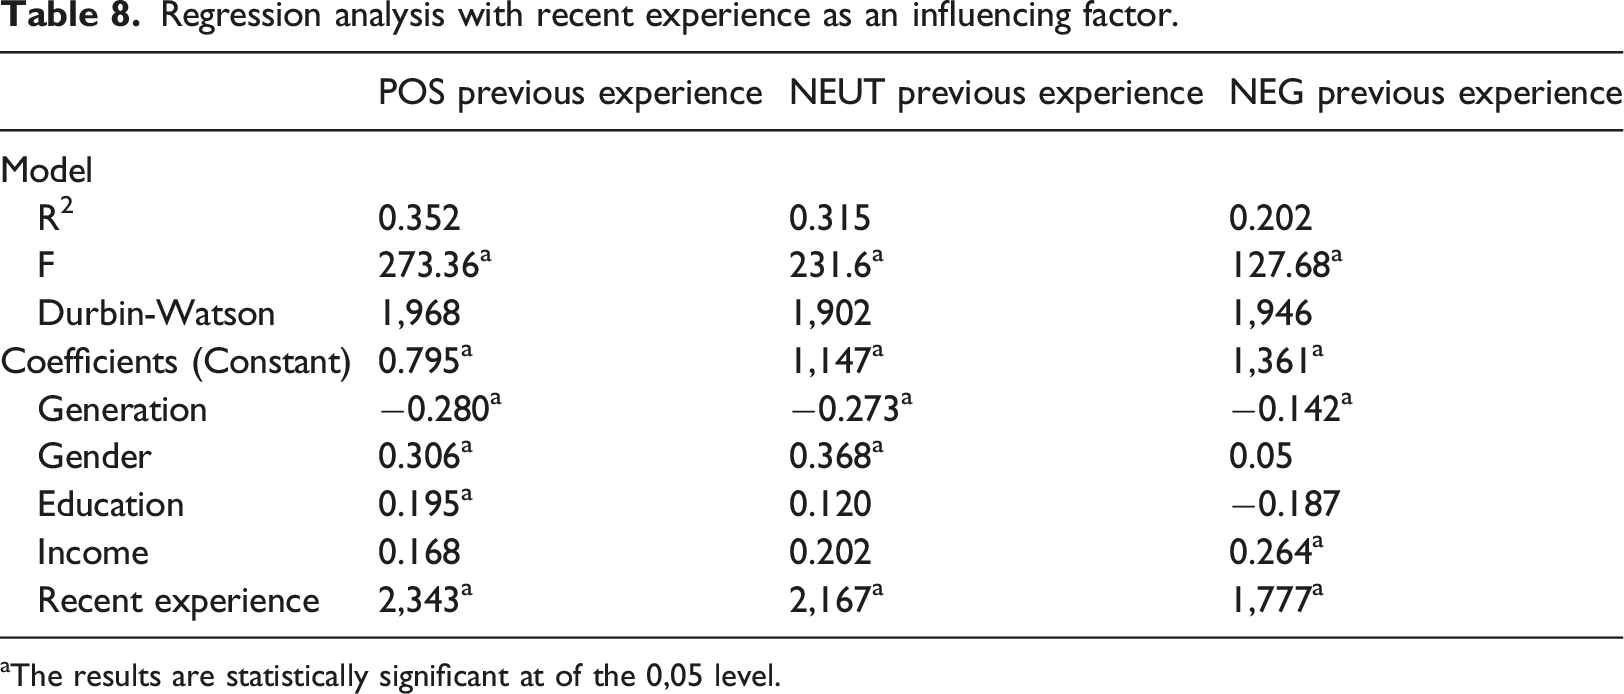
aThe results are statistically significant at of the 0,05 level.
Differences in Responses by Genders, Generations, Education, and Income Group
NPS by gender, generation, education, and income group.
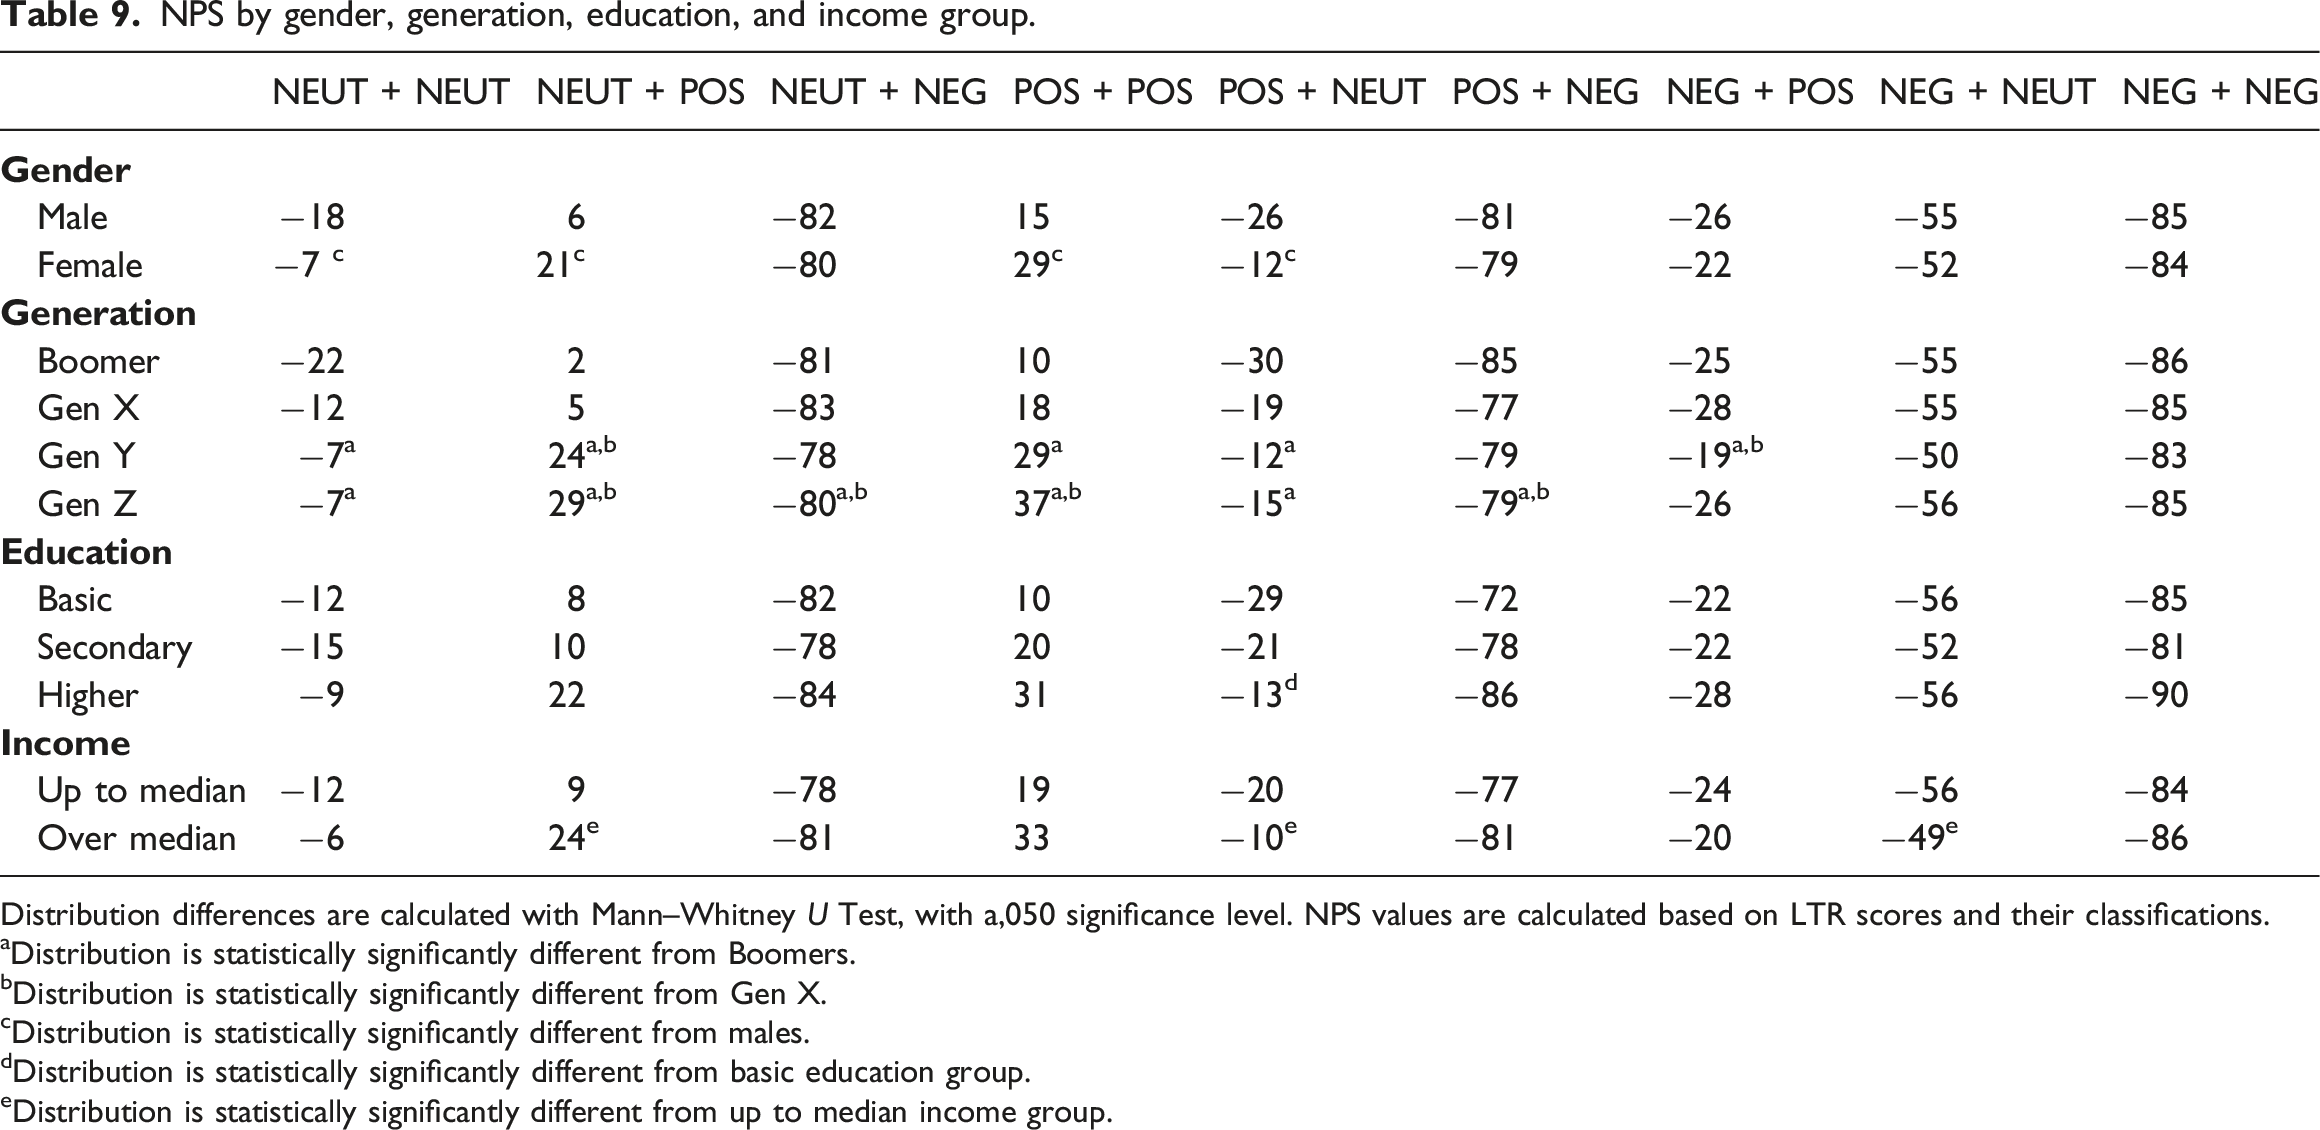
Distribution differences are calculated with Mann–Whitney U Test, with a,050 significance level. NPS values are calculated based on LTR scores and their classifications.
aDistribution is statistically significantly different from Boomers.
bDistribution is statistically significantly different from Gen X.
cDistribution is statistically significantly different from males.
dDistribution is statistically significantly different from basic education group.
eDistribution is statistically significantly different from up to median income group.
The answers from respondents with different educational levels have a statistically similar distribution across all the situations. The distribution of answers from basic and higher education customers for situations with previous positive and neutral recent experiences differs statistically.
Regarding different net incomes, a statistically different distribution of responses has emerged in scenarios with previous neutral and recent positive, previous positive and recent neutral, and previous negative and recent neutral experiences.
Regarding the neutral previous and recent experiences, significantly more men choose a score of 5 (23% of male respondents, 16% of female respondents), resulting in a significantly higher share of detractors (42% for men compared to 34% for women). Regarding neutral previous and positive recent experiences, and positive previous and neutral recent experiences, the share of detractors among men is significantly higher, as they select a score of 5 much more often. For neutral previous and positive recent experiences, 33% of men are detractors, compared to 25% of women. For positive previous and neutral recent experiences, 47% of men are detractors, compared to 37% of women. Even for positive previous and recent experiences, a score of 5 is selected by men much more often (15% of male respondents and 9% of female respondents).
Table 9 reveals that generations Z and Y define neutral situations as neutral or even positive, whereas Generation X and Boomers are more critical and have a much higher share of detractors. In situations where the previous experience is neutral or positive and the recent experience is negative, Generation Z respondents choose a score of 6, whereas Boomers and Generation X choose 0 and 1. This results in similar NPS values, but a different distribution of answers.
The scenario with a previous positive experience and neutral recent experience is defined as negative (detractors) by 37% of respondents with higher education and 50% of respondents with basic education. Regarding previous neutral and recent positive experiences, the higher-income group has a larger share of promoters (48%) than the lower-income group (40%). Regarding previous positive and recent neutral experiences, the share of detractors is higher in the lower-income group (44%) than in the higher-income group (35%).
Differences in Logic of Answering
Logic of answering.
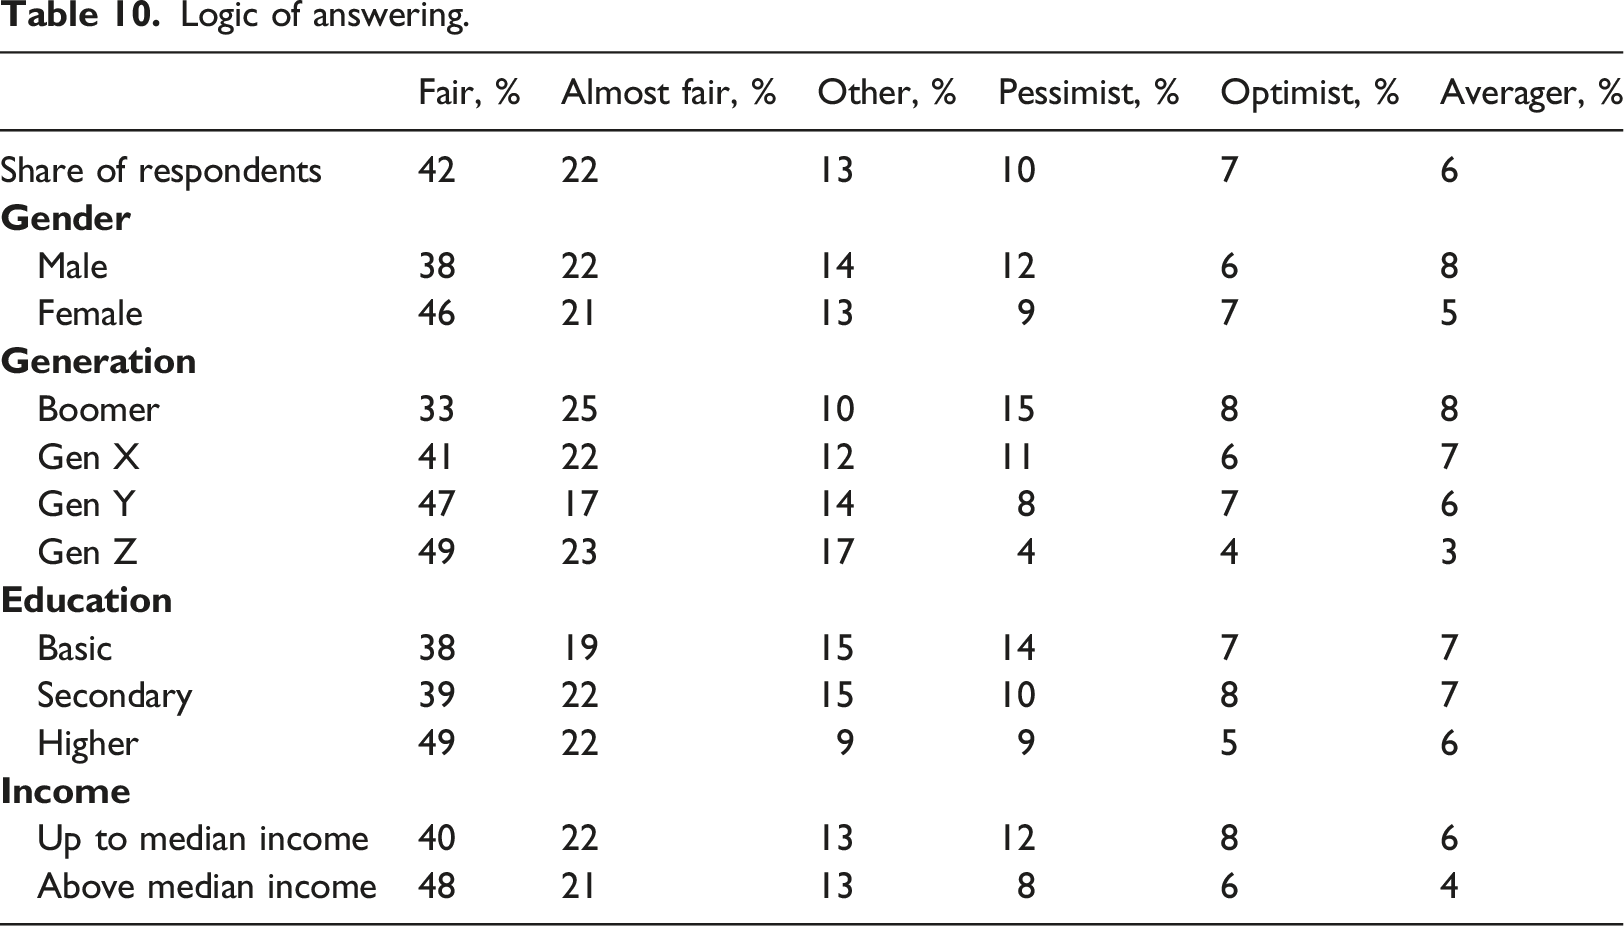
Table 10 shows that women generally answer per anticipation (fair and almost fair) across different scenarios, whereas men have a higher share of pessimists and averagers. Respondents with higher education and above-median income also have a higher share of fair and almost fair respondents. Across generations, Generation Z has the lowest share of pessimists and averagers and the highest share of fair and almost fair respondents.
Discussion
The NPS has been researched from a customer perspective through analyzing customers’ comments and explanations of the score (Følstad & Kvale, 2018; Lewis & Mehmet, 2020); however, the customer’s experience before answering the LTR question has been unknown. Therefore, it was impossible to evaluate the extent of the differences caused by the situation and the respondents.
Our study provides a unique perspective on the logic of different responses to the LTR question. Nine validated descriptions of different bank experiences were presented to 1000 respondents. Because the descriptions presented to the respondents were equal for all respondents, we could eliminate the influence of unknown experiences, concentrating on the respondents’ reactions to the situation and the score they assigned to the likelihood of a recommendation.
The Logic of Answering
In our pre-study, the respondents described a distinct logic for answering the LTR question; hence, we assumed that though all respondents evaluated the same questions, the answering logic would differ. Our research confirms this finding, showing that even in similar situations, respondents’ answering logic is different. A total of 16% of all respondents (pessimists and averagers) qualify as detractors in all situations. Based on the explanation during our pre-study, and results from Schulman and Sargeant (2013), these respondents possibly know that they do not discuss banking experiences with any of their friends or colleagues or, in general, do not recommend anything to anyone. It can also mean that averagers provide scores comparing the scale’s midpoint, with 6 being over average and 4 below average, as proposed by Grisaffe (2007). Approximately, 7% of all respondents are optimists, which implies, based on our pre-study explanations, that they define themselves as optimists or always reply 10 to avoid additional questions.
We do not find any reasonable pattern for 13% of the respondents. This could be because people may recommend the same company to some of their friends but not to others (Stahlkopf, 2019). Our pre-study explanations suggest that people may find it acceptable to talk about their positive experiences but keep the negative ones to themselves, or vice versa.
In response to RQ1, we show that 64% of the respondents give logical LTR scores, which are in accordance with the NPS classification, considering the scenarios and experiences described to them. In addition, despite the various answering logics, the total NPS scores are reasonable. Overall, the scenario with positive previous and recent experiences receive the highest NPS, whereas that with negative previous and recent experiences receive the lowest NPS.
NPS by Genders, Generations, education, and Income Group
Eskildsen & Kristensen (2011) show that women are more likely to be promoters than men, and choose a score of 10 than men. Our research shows that women are significantly more appreciative of positive and neutral experiences, whereas there is no statistically different distribution of answers for negative experiences. In none of the scenarios do we observe any tendency for women to choose a score of 10, more likely than men. Eskildsen & Kristensen (2011) also find that men tend to give high detractor ratings, such as 5 and 6, while women tend to give a score of 0. Our findings indicate a clear tendency for men to choose a score of 5 in neutral and positive scenarios but not in negative ones. Additionally, our findings do not indicate that women are more likely to select a score of 0 in any situation. Therefore, we complement the previous research by stating that the tendency for men to give high detractor ratings applies only in positive and neutral situations; however, the tendency for women to give lower ratings is not confirmed.
Based on previous research, we expect Generation Z respondents to have higher NPS scores than Generation Y (Situmorang, 2017). Our study does not find statistically significant differences in the answer distribution between Generation Y and Generation Z. One possible reason is that Generation X is more broadly defined by Situmorang (2017) (born in 1976–1997 instead of 1981–1996). Additionally, Situmorang’s (2017) study is conducted in 2016, when the respondents from Generation Z are only 18 years old or younger, which may have influenced their preferences compared to Generation Y. In our research, in 2023, the respondents from Generation Z are aged 18–26, so they are more likely to have their households and make independent consumption decisions; therefore, their answers are more similar to those of Generation Y.
Our research shows that Boomers and Generation X representatives respond similarly to the LTR question, as do generations Y and Z. Nonetheless, a line of difference was observed between generations X and Y. Significant differences are observed in the scores of generations Y and Z compared with Boomers and Generation X. Boomers and Generation X give lower scores in most situations, which may mean that they are more critical in general or less likely to recommend. Our findings are in line with those of Katz (2017), Laor & Galily (2022), Pradhan et al., (2022), and Grigoreva et al., (2021), who find that Boomers believe more in the power of individual choice, that Generation Y may be less independent than Generation X and Boomers, and that for Generation Z, recommendations play a bigger role.
The education and income of the respondents influence answers in situations involving neutral previous or recent experiences. Considerably, the tone of neutral experiences is defined as neutral by the majority in the testing group; although, some define it as positive or negative. We can see that respondents with basic education and up to the median income are less likely to be promoters when their recent experience is neutral, despite positive earlier experiences. In addition, respondents with lower income are less likely to be promoters of previous neutral and recent positive experiences and are more critical when responding to previous negative and recent neutral experiences. Unfortunately, it is not known whether critical responses also mean they are less loyal when experiencing neutral situations, but this would be an interesting subject for further research.
In response to RQ2, we find that although individual differences only partially explain the variability in LTR scores, they still have a significant influence in certain cases. In neutral or positive experiences, women are more appreciative and gave higher scores, whereas men give a score of 5 to the LTR question more often. Boomers and Generation X representatives are more critical and give lower scores in most situations than representatives of Generation Y and Z. Education and income influence how respondents interpret neutral situations.
The Influence of the Recent Experience
Our study reveals that the recent experience is influential when answering the LTR question. In comparing Tables 7 and 8, we find that adding the recent experience as an independent variable helps regression models better explain the variability in LTR scores. The effect of the recent experience is particularly significant when it is negative. Table 5 reveals that in the case of negative recent experience, the NPS varies between −80 and −85 regardless of previous experience. This is also supported by Tables 7 and in which the role of previous experience is much smaller in the case of a negative recent experience. Previous experience plays a more important role when the recent experience is positive or neutral.
Følstad & Kvale (2018) find that customers who assessed their experience based on concrete recent transaction are more likely to recommend the company than those who based their assessment on general brand perception, product experience, and the entire customer journey. This can also mean that problems are attributed to the company in general, and positive emotions are emphasized in comments as recognition of the recent good-service touchpoint. Our study supports this statement when the recent experience is not negative. Regarding neutral previous experience and positive recent experience, 42.6% are promoters, whereas for positive previous experience and neutral recent experience, only 23.3% of respondents are promoters.
In response to RQ3, our results show that recent experience has a significantly greater effect on the LTR score than the previous experiences. This effect is particularly strong when the recent experience is negative.
Conclusions and Practical Implications
Our study analyzes the differences in customer answers to LTR questions in different predescribed scenarios. NPS has not been studied before based on pre-described situations and with a high-quality sample. We analyze both the logic behind answering the LTR question and the influence of the recent experience. We find that respondents have distinct answering logic, but when the number of respondents is adequate, the NPS fairly evaluates the experienced situation.
Our research complements the existing literature by specifying customer reactions to different scenarios by combining positive, neutral, and negative previous and recent experiences. 1. Complementing the findings of Følstad & Kvale (2018) that customers who assessed their experience based on concrete recent transaction were more likely to recommend the company, our findings confirm that the recent experience with the company largely affects NPS results compared to the general opinion and previous experiences with the company, especially for negative recent experiences. 2. Contrary to Eskildsen & Kristensen (2011), our study does not find that women tend to give a 10 or 0, and that men tend to give a 5 to the LTR question. In the case of positive and neutral experiences, women are more likely to be promoters. For negative experiences, there is no significant difference between men and women. 3. Unlike Situmorang (2017), we find no statistically relevant differences in the answer distribution between generations Y and Z. However, the line goes between generations X and Y. In most situations, Boomers and Generation X give lower LTR scores than generations Y and Z. This is in line with Laor & Galily (2022), who state that digitalization has significantly changed both generations Y and Z; thus, they are likely to act similarly. 4. We also find that in situations without negative experiences, customers who are older or have a lower education level are more likely to give a lower score when defining how likely they are to recommend a company or service to their friend or colleague.
Our study’s results have several practical implications. Organizations using NPS to understand customer feedback should consider the following aspects: 1. The NPS may not be suitable for organizations with a low number of respondents for the LTR score. Individually, respondents may have a completely different answering logic, which levels out with a higher number of respondents. 2. Boomers and Generation X representatives may give low scores to positive and neutral experiences than younger respondents in similar situations. 3. Customers with lower incomes may give lower scores to neutral experiences than those with higher incomes in similar situations. 4. Customers with basic education may give lower scores to neutral experiences than those with higher education in similar situations. 5. Negative experiences can disrupt the relationship. The recent negative experience with a company strongly influences customer recommendation probability. Regarding the recent positive experience, previous general experience also plays a role.
Limitations
The scores are given based on situation descriptions with no real emotions attached, which is not necessarily the case when answering the LTR question. However, this is the only possibility to ensure that all respondents provided feedback on the same situation based on their beliefs and values. In real life, emotions are involved, but experiences can also be objectively different. Therefore, in the case of different responses, it is not possible to understand whether the response was different because of the person or event.
Footnotes
Declaration of Conflicting Interests
The author(s) declared no potential conflicts of interest with respect to the research, authorship, and/or publication of this article.
Funding
The author(s) received no financial support for the research, authorship, and/or publication of this article.