
Abstract
A major challenge in web-based cross-cultural data collection is varying response rates, which can result in low data quality and non-response bias. Country-specific factors such as the political and demographic, economic, and technological factors as well as the socio-cultural environment may have an effect on the response rates to web surveys. This study evaluates web survey response rates using meta-analytical methods based on 110 experimental studies from seven countries. Three dependent variables, so-called effect sizes, are used: the web response rate, the response rate to the comparison survey mode, and the difference between the two response rates. The meta-analysis indicates that four country-specific factors (political and demographic, economic, technological, and socio-cultural) impact the magnitude of web survey response rates. Specifically, web surveys achieve high response rates in countries with high population growth, high internet coverage, and a high survey participation propensity. On the other hand, web surveys are at a disadvantage in countries with a high population age and high cell phone coverage. This study concludes that web surveys can be a reliable alternative to other survey modes due to their consistent response rates and are expected to be used more frequently in national and international settings.
Survey Response in a Cross-Cultural Setting
In an increasingly globalized world, cross-national research and thus cross-national datasets have grown in popularity in academic research. At the same time, concerns about methodological issues related to cross-national surveys have been growing. One such methodological concern is the differences in response rates across countries. Using data from large, representative samples of consumers from 11 countries of the European Union, Baumgartner and Steenkamp (2001) found that survey participants' response styles had systematic effects, in particular with respect to the proportion of reverse-scored items and midpoint scores. They also found that these style differences could result in varying response rates across countries.
Given the cost-intensive and inflexible nature of face-to-face surveys, there has been an international shift toward using web-based cross-cultural surveys for data collection (e.g., GfK consumer panel 1 , CRONOS 2 , and OPPA 3 ). Using web-based data collection methods poses methodological challenges such as non-response bias, with systematic non-response leading to errors (Bethlehem, 2010; Groves & Peytcheva, 2008; Kreuter, 2013). Although the non-response rate (percentage of non-response) is not equal to non-response bias 4 , these two concepts are strongly related (Groves & Peytcheva, 2008).
While previous cross-cultural research on non-response has often focused on comparing response rates, (De Leeuw et al., 2018; Hox and De Leeuw, 1994; Johnson et al., 2020) it has not examined related non-response bias for feasibility reasons (i.e., response bias analyses require the characteristics of a sample to be known before it is recruited, as demonstrated by Jans et al. (2018). However, as low response rates are likely to result in more systematic non-response bias than high response rates, comparing bias across studies with varying response rates from different countries can be problematic 5 .
The literature on factors that influence non-response at the micro-level is diverse and well explored. Focusing on web response rates, Keusch (2015) provides a theoretical overview of the correlates of web response rates and shows that, at the micro-level, survey design attributes—such as reminders, prenotifications, and timing of invitations—improve web response rates. Keusch (2015) found that sample characteristics (e.g., female, non-Black, topic interest) can also affect web response rates. Similarly, Daikeler et al. (2019) found higher web response rates to web surveys using prenotifications, one and two contact attempts, longitudinal samples, and specific target groups. Previous research comparing modes of data collection (e.g., Daikeler et al., 2019; Lozar Manfreda et al., 2008) found that the response rates to web surveys were on average 12 percentage points lower than for the comparison survey mode, that is, the other survey mode to which web surveys were compared (face-to-face, mail, or telephone). However, these studies did not fully explain the response rate heterogeneity within and across countries. This could be because they only included survey design factors as explanatory variables and marginally considered cross-national differences on the country level, even though international databases were used.
Differences in cross-national and cross-cultural non-survey design factors may also influence response rates. Groves & Couper (2012) implicitly addressed this possibility in their non-response framework for household surveys, which points out that social environment can be a source of non-response. Blom (2012) explicitly addressed the sampling unit representing macro-level factors, such as a country’s gross domestic product (GDP) or the culture in which a survey is conducted, in her conceptual model of country-level contact rates. However, her analysis focused on survey characteristics, and she did not test for macro-level factors. While many research studies have examined survey design factors and sample characteristics, research on the differences in cross-country non-response is still in its infancy (Johnson et al., 2010). Previous research in this area has focused on cultural dimensions and their link to non-response in interviewer-administered surveys (Jans et al., 2018; Johnson et al., 2010) and on cross-cultural dimensions of internet consumption (Hermeking, 2005). To date, macroeconomic and country-level factors have mostly been addressed only in theoretical models. To the best of our knowledge, these factors have never been examined in the context of web non-response.
Our study addresses this research gap related to the differences in response rates between countries 6 with two goals in mind. The first goal is to identify countries in which web surveys provide a valuable alternative as a survey mode. The second goal is to understand the role played by country-specific indicators—such as politics and demographics, economics, technology, and socio-culture—in the response rates to web surveys in comparison to other survey modes. Collectively, this will help us to determine why web surveys work better in some countries than others. Our study uses the strongest methodology available for comparative research, which is a meta-analysis based solely on experimental studies (APA, 2006; Vandenbroucke, 1998). Thus, our study is a cross-national extension of previous research by Daikeler et al., 2019; Lozar Manfreda et al., 2008. Specifically, we focus on experimental web mode comparisons and analyze the response rates to web surveys, the response rates to the comparison mode, and the difference in the two response rates.
Country-Specific Predictors of Web Survey Response Rates
To derive cross-cultural factors that may be relevant for the response rate to web surveys, we drew on the macroeconomic PEST
7
(political, economic, socio-cultural, technological) approach (Cadle et al., 2014, p. 3). The PEST approach covers a wide range of topics and thus serves as a basis for our analytic model. After some adaptations, we derived four country-specific macro factors that might influence country-specific web response rates (see Figure 1). Macro-level factors for web response.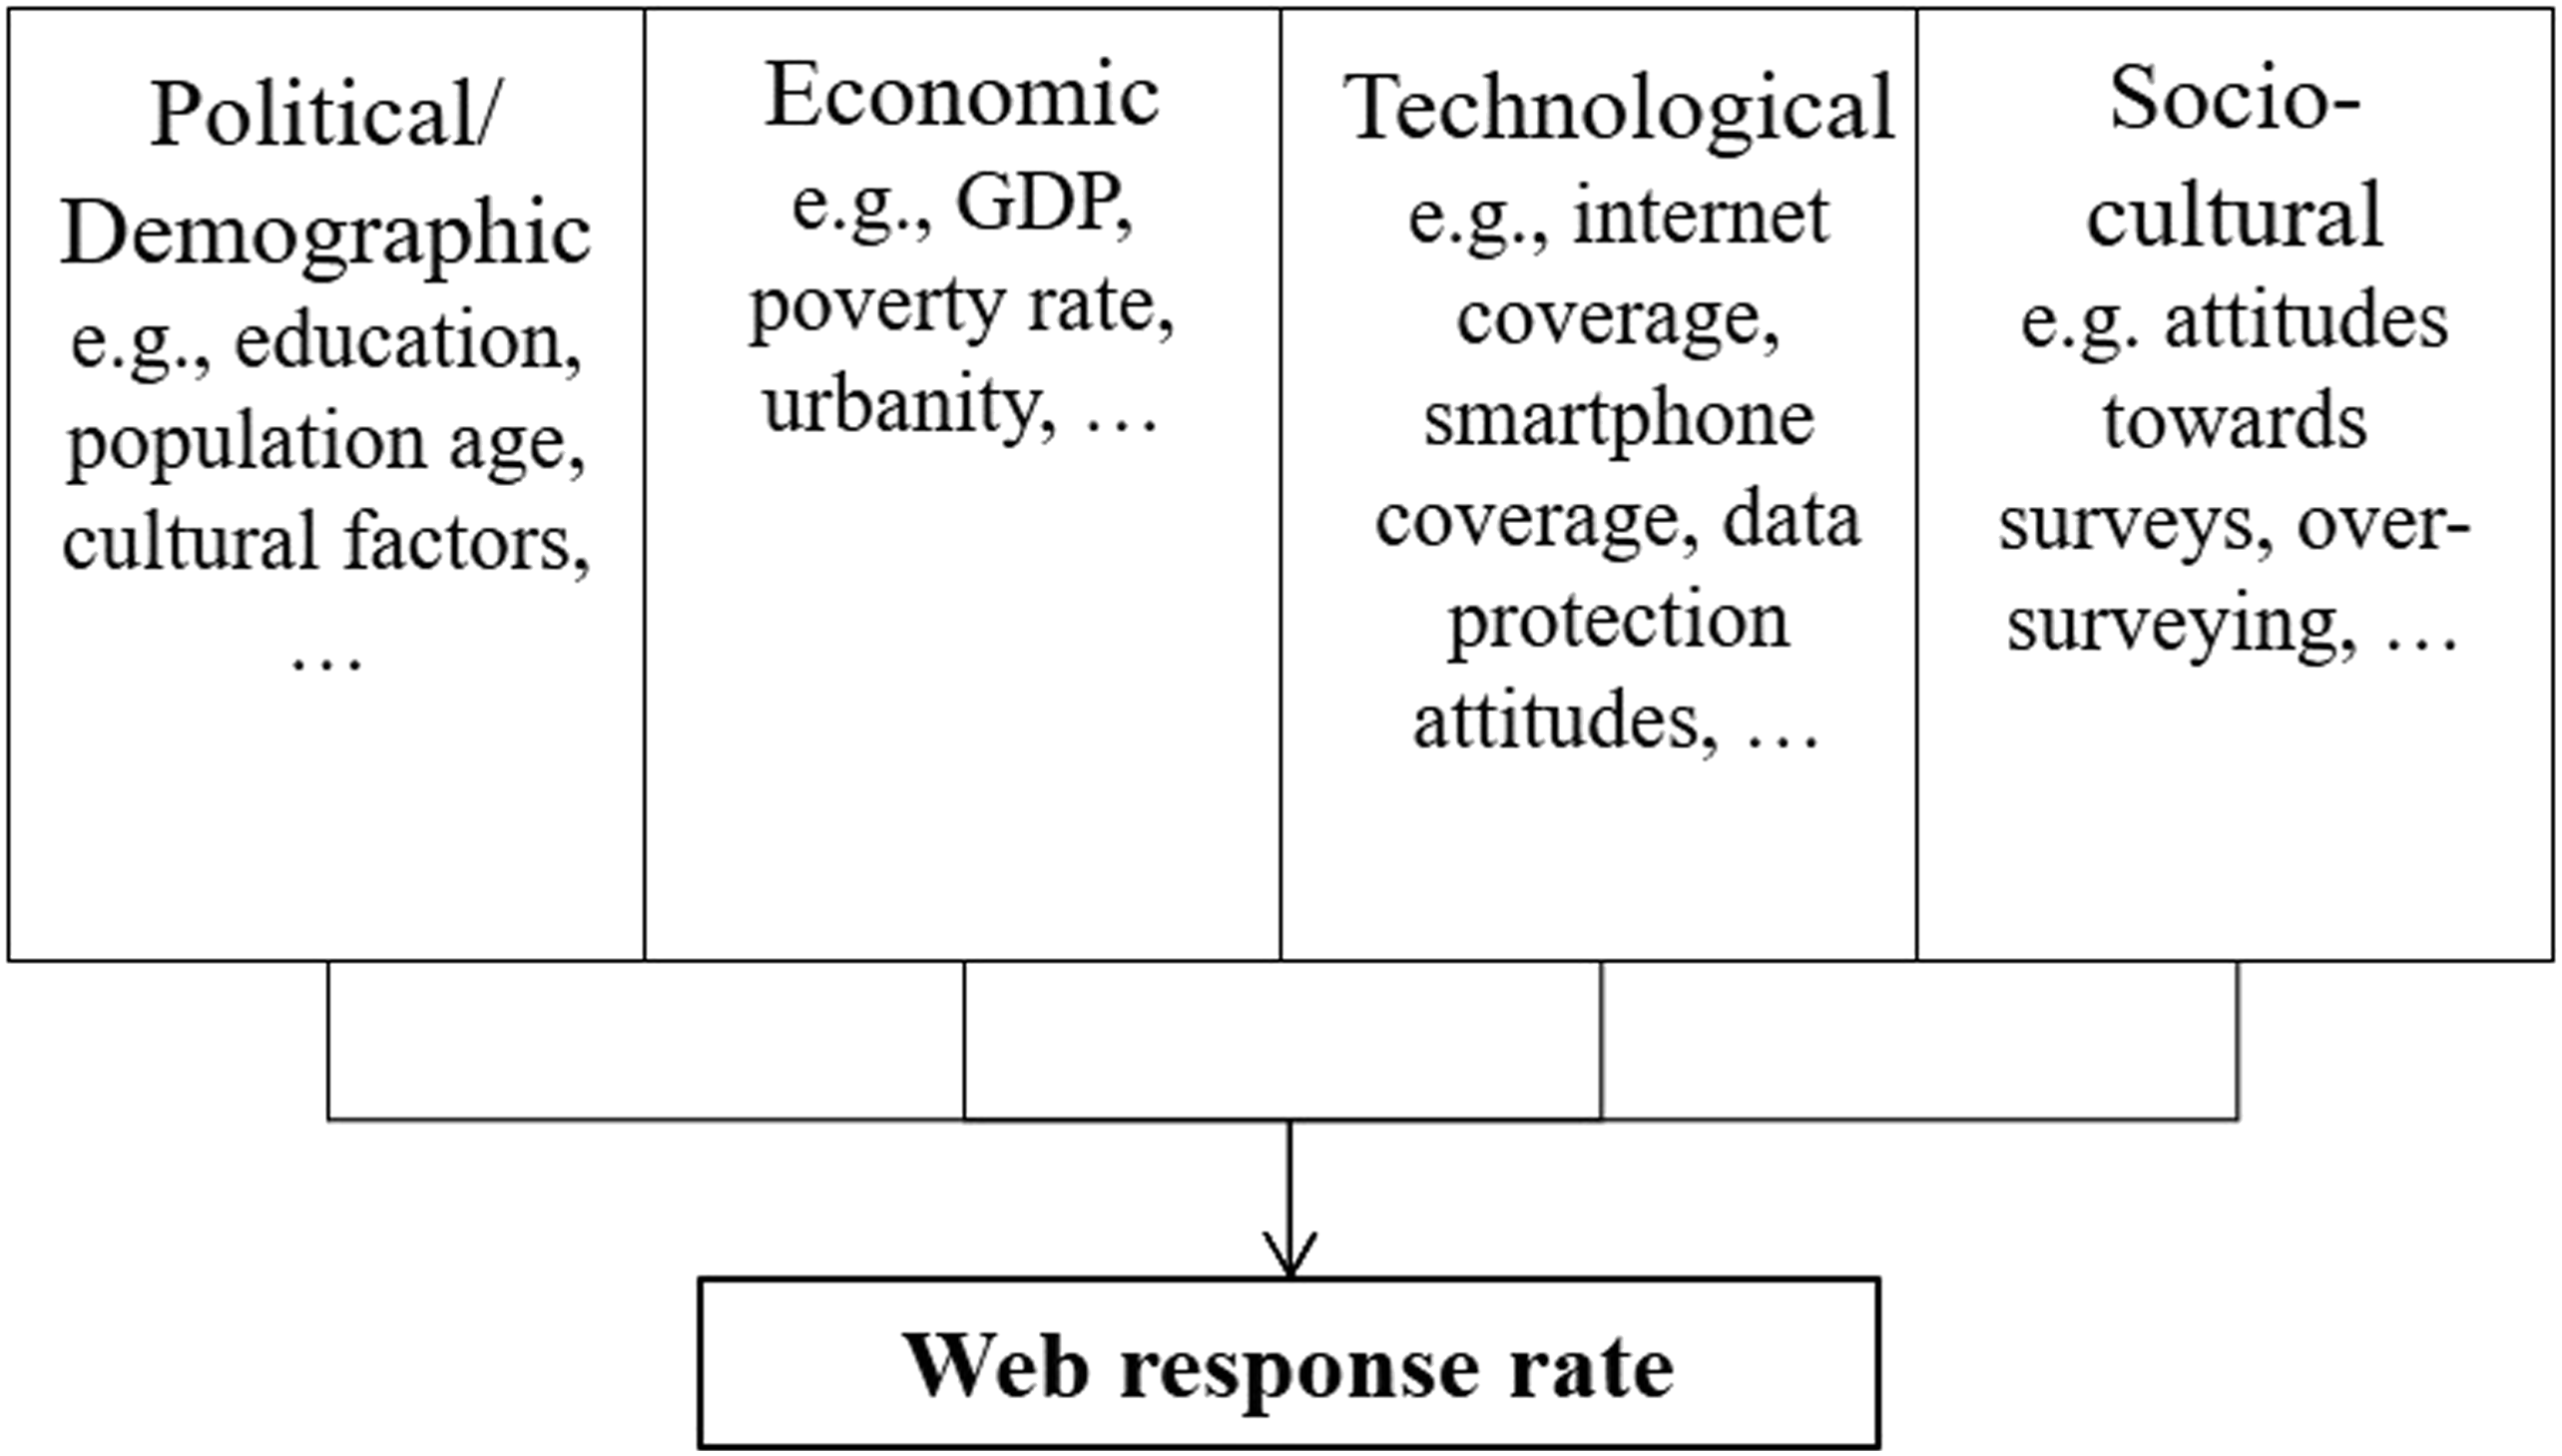
Political and Demographic Factors
The country-specific political and demographic environment affects the acceptance and success of web surveys. The relative performance of web surveys in comparison to other survey modes depends largely on the perceived burden of web surveys (Crawford et al., 2001). The lower the perceived participation burden for a web survey, the more likely respondents are to participate. We expected education and age to be two key determining factors regarding the perceived burdensomeness of participating in a web survey (De Leeuw, 2018; Yetter & Capaccioli, 2010). With respect to educational attainment, we expected that the higher the level of education in a country, the more the use of web surveys would be accepted by the public. More specifically, higher education is often linked to a higher cognitive ability (Falch & Sandgren Massih, 2011), which is thought to reduce the effort of operating an online device and thus facilitate the completion of a survey online (Gordon et al., 2019). In contrast, we did not expect education to have a similar effect on the response rate of other survey modes. Therefore, we assumed that the higher the level of education in a country, the lower the difference in response rates between survey modes.
Furthermore, we expected web surveys to be less accepted in countries with an aging population (Czaja et al., 2006; Gordon et al., 2019) because older people are often less open-minded about new developments and find it harder to learn new skills (Charness & Boot, 2009; Czaja et al., 2006). Hence, older populations often do not have the basic computer skills necessary to complete web-based surveys. Thus, we expected higher response rates of comparison survey modes in countries with a demographically older population, but lower response rates to the web survey mode. This would result in a large difference in response rates, with higher rates for the comparison survey modes.
Hypotheses Regarding the Political and Demographic, Economic, Technological, and Socio-Cultural Factors Influencing Web Response.
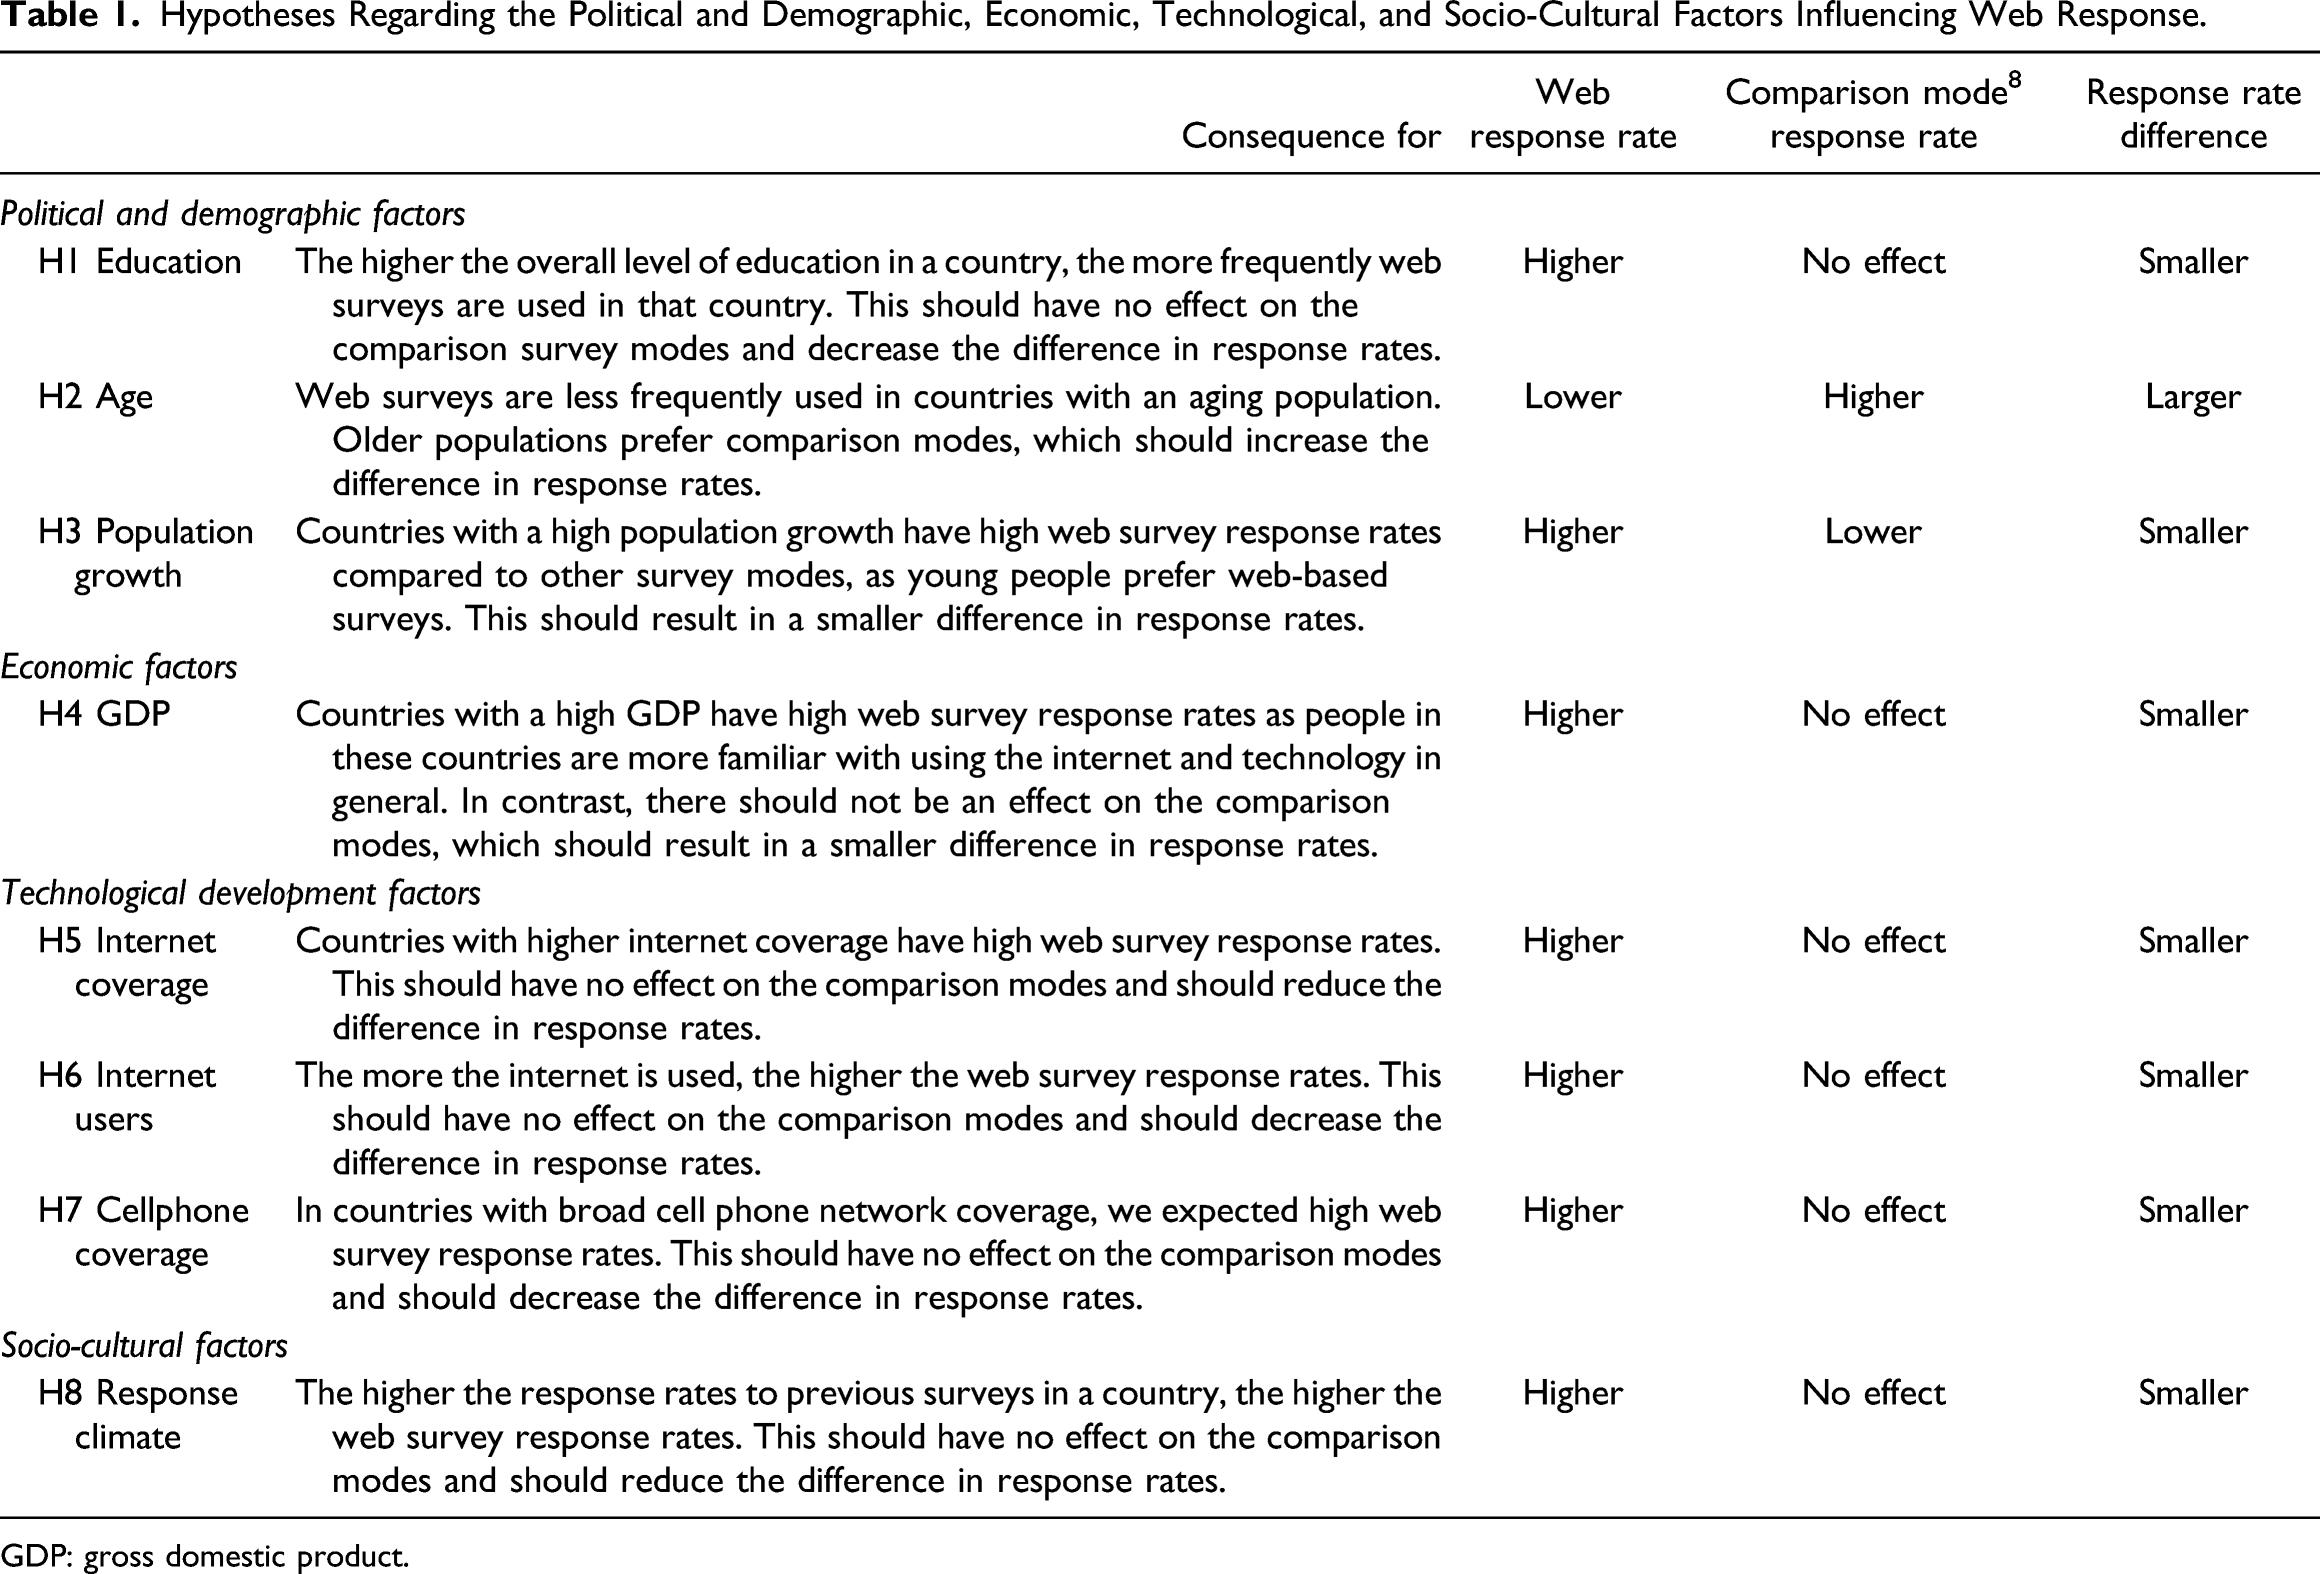
GDP: gross domestic product.
Economic Factors
The wealth of a country plays an essential role in the participation in web surveys compared to other survey modes. In countries with a high level of wealth, all population strata supposedly have internet access (Van Dijk, 2006). As a result, internet usage is socially desirable and embedded in everyday life, and large parts of the population have the necessary skills to use it (Galperin & Fernanda Viecens, 2017). Furthermore, in countries with a high level of prosperity, residents often have a job that requires them to be able to use computers or other internet devices. The general population within these countries are familiar with and use technology every day, and therefore the perceived burden of internet use is minimal (Garrote Sanchez et al., 2021). Thus, for countries with a relatively high GDP, we expected participation in web surveys to be more accepted by the population and there to be a smaller difference in the response rates compared to other survey modes.
Technological Development Factors
Another important factor that may influence the web survey response rate in a specific country is the degree of technological advancement (e.g., Bosnjak et al., 2005; Couper, 2000; Couper et al., 2007; Rookey et al., 2008; Silber et al., 2018). The higher the internet coverage in a country, the easier it is for the population to use it regularly. As a result, people develop web skills, and the burden of participating in a web survey is reduced (Van Deursen & Van Dijk, 2011; Galperin & Fernanda Viecens, 2017). The higher the willingness to participate in a web survey, the lower the difference in response rates between a web survey and other survey modes. The same applies to the proportion of internet users in a population. The more popular the internet is among various social strata, the more likely people are to use it in their everyday life (Teo et al., 1999). Also, the more the internet is used, the lower the burden of using it to answer a survey. This may lead to higher web survey response rates and a lower difference in response rates because the response rates for comparison survey modes should not be affected by the number of internet users.
Finally, increased cell phone network coverage in a country is expected to have a positive effect on web survey response. The provision of mobile internet access throughout a country means that geographical or time limits no longer affect a survey participant’s ability to respond to a web survey (Wright, 2005). On the other hand, for other survey modes, such as face-to-face and mail surveys, these constraints still impact response rates. Therefore, in countries with broad cell phone network coverage, we expected high web survey response rates and a low difference in response rates compared to other survey modes.
Socio-Cultural Factors
Comparative studies have investigated the decreasing response rates to different survey modes in many countries (Atrostic et al., 2001; Brick & Williams, 2013; Curtin et al., 2005; Kreuter, 2013; Rogers et al., 2004; Williams & Brick, 2018) to determine the factors that impact response rates, such as the country-specific survey climate and response propensity (e.g., Barbier et al., 2015; Beullens et al., 2018). One indicator of the acceptance of surveys in a country might be the willingness of its citizens to participate in surveys of any mode (Brüggen et al., 2011; Keusch et al., 2014; Petrova et al., 2007). Unwillingness to participate in a national survey might be fueled by data protection concerns (Gummer & Daikeler, 2018). These concerns may be stimulated by the media, word-of-mouth, or norms. They could also be related to the legislative history of a country (e.g., state security [Stasi] in the GDR). Following this argument, we assumed that the higher the willingness of citizens to participate in previous surveys of any mode in a country (influenced, for instance, by low data protection concerns and a positive attitude toward surveys), the higher their participation in web surveys. This may be because people with positive survey attitudes and low data protection concerns may consider web surveys to be a more convenient and less burdensome way of participating in surveys. Consequently, a positive survey climate may positively impact response to web surveys (Loosveldt & Joye, 2016; Porter et al., 2004). Thus, in countries with high response rates in previous surveys, web surveys should have similarly high response rates, and lower differences in response rates between survey modes can be expected. An overview of all hypotheses is provided in Table 1.
Survey Design Predictors of Web Survey Response Rates
The success of a (web) survey, which is contingent on a favorable response rate, depends strongly on the survey setting and characteristics (Groves & Peytcheva, 2008; Keusch, 2015). The selection of the survey mode not only influences the costs of a survey but the mode’s attributes can also impact the response rate. For example, a paper questionnaire on a desk can act as an automatic reminder for participants, or a personal contact with a telephone interviewer can convince a reluctant respondent of the importance of a survey. In addition, a survey’s methodological toolbox offers a variety of other means for increasing response rates. Incentives can compensate respondents for their time spent; respondents who are pre-recruited from longitudinal surveys are more likely to participate in follow-up studies, and repeated contact attempts can underline the value of a survey. To date, three meta-analyses by Daikeler et al., (2019); Lozar Manfreda et al., 2008 and Shih & Xitao Fan, 2008 have examined these tools and their effectiveness in boosting response rates. They found that prenotifications, one and two contact attempts, the use of longitudinal samples, and specific target groups, such as students, increased the response rate to web surveys in comparison to other survey modes. Notably, the meta-analytic studies showed that incentives are equally effective for all survey modes.
The Present Study
The present study addresses the question of cross-country differences in web survey participation behavior, building on previous studies, such as the study of Shih & Xitao Fan (2008) who found a large part of the heterogeneity in effect sizes remains unexplained. Daikeler et al., 2019; Lozar Manfreda et al. (2008) followed a similar meta-analytic approach, primarily focusing on a survey’s methodological characteristics (such as the use of incentives). Using meta-analytic methods, our research strove to identify the countries in which web surveys had favorably high response rates compared to other survey modes and the country-level indicators that determined the response rates. Thus, we examined whether political and demographic, economic, technological, and socio-cultural country-specific factors influenced the success of web surveys, focusing on three effect sizes: the response rate to web surveys, the response rate to the comparison survey mode, and the difference in response rates between the two. Our findings may provide helpful information for researchers who aim at evaluating whether a web survey is likely to be a successful mode of data collection in a specific country or cross-nationally.
Method
The present study uses the study of Lozar Manfreda et al. (2008) as a starting point and supplements it with more recent studies (see Daikeler et al., 2019).
Measurement of Political and Demographic, Economic, Technological, and Socio-Cultural Factors
To investigate whether political and demographic, economic, technological, and socio-cultural country-specific factors impact survey response rates, we added country-specific information to our dataset. These supplementary data were based on the operationalization of political and demographic, economic, technological, and socio-cultural factors. The country-level indicators were selected with the aid of two criteria. First, to maintain high-quality standards, only indicators referring to the respective country in the exact year were used. Therefore, the linked political and demographic, economic, technological, and socio-cultural data had to cover a period of more than 20 years on a yearly basis. Second, the country indicators had to include all countries presented in this study. After extensive literature and database research, we selected country-level data from the World Bank, the Organisation for Economic Co-operation and Development (OECD), and the International Social Survey Programme (ISSP) databases.
Overview of the Country-Specific Predictors of Web Survey Response Rates.
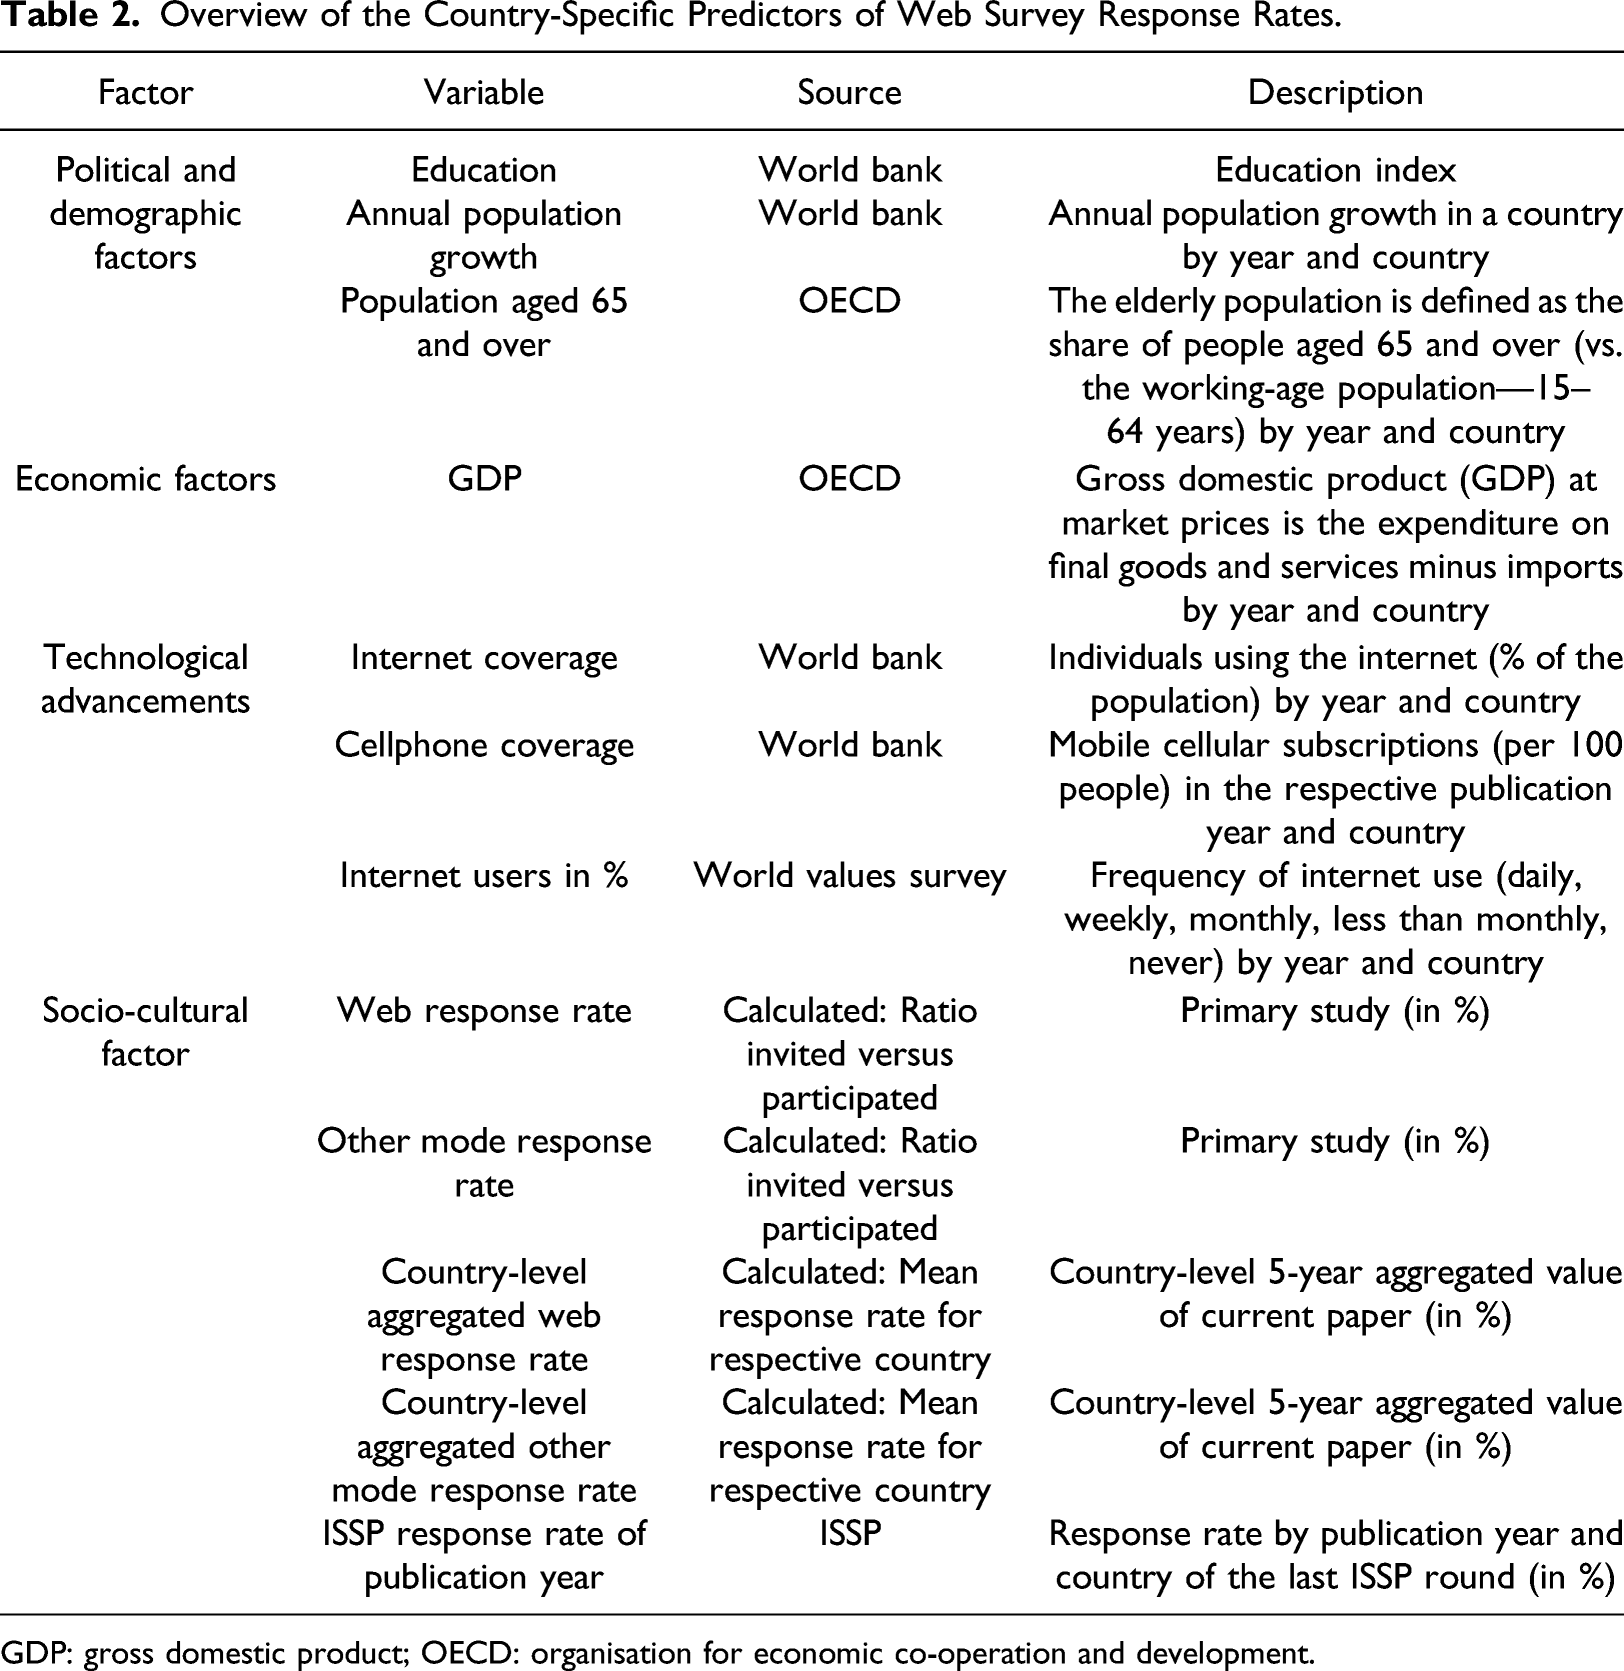
GDP: gross domestic product; OECD: organisation for economic co-operation and development.
The indicators for internet coverage, cellphone coverage, GDP, and persons aged over 65 were highly correlated (see the correlation map in Supplemental Figure A2). 9 In the meta-analyses, inter-item correlation was not found to be problematic because we calculated separate models for each factor, which is a standard approach used in meta-analyses to prevent overfitting and facilitate interpretation (Harrer et al., 2019; Viechtbauer, 2007).
Overview of Meta-Analytic Procedure
Our meta-analysis comprised four steps. First, we conducted a comprehensive literature search using specific search terms. Second, we compared the studies identified by this literature search with our eligibility criteria. We excluded studies that did not meet our criteria. Third, we coded the data needed to calculate the response rates and the survey country. Fourth, we carried out the moderator analysis. Each of these four steps is explained in the following sections.
Eligibility Criteria and Search Strategy
The eligible studies had to meet the following criteria: (1) A split-sample experimental design had to be performed on subjects from the same population who were randomly assigned to different survey modes. (2) One of the survey modes had to be a web-based survey (i.e., a survey using a web questionnaire to collect respondents' answers online, which were entered using a PC or laptop; we excluded mobile-only studies). This web-based survey had to be compared with data from at least one other survey mode (i.e., mail, telephone, face-to-face, or fax surveys). (3) Data had to be available on the response rates to the web and other survey modes as well as on the survey country: that is, the country in which the survey was conducted. (4) Survey participants had to remain in the mode to which they were randomly assigned; that is, studies in which participants could change modes were not eligible. (5) The implementation of the compared survey modes had to be identical, meaning that the survey methodological tools needed to be identical; for example, both modes had to use incentives. We did not impose restrictions related to the population of participants, time period, or geography. Thus, we included studies in our meta-analysis regardless of the respondent population (e.g., student surveys) used in the study and also of the country where the study was conducted. As a first important step to ensure the quality of our meta-analysis, we conducted a comprehensive literature search (see Figure 2 for an overview of our systematic search strategy) using the following search terms: web survey, internet survey, online survey, web-based survey, internet-based survey, electronic survey, which we supplemented with response rate, return rate, participation rate, and non-response rate. Search strategy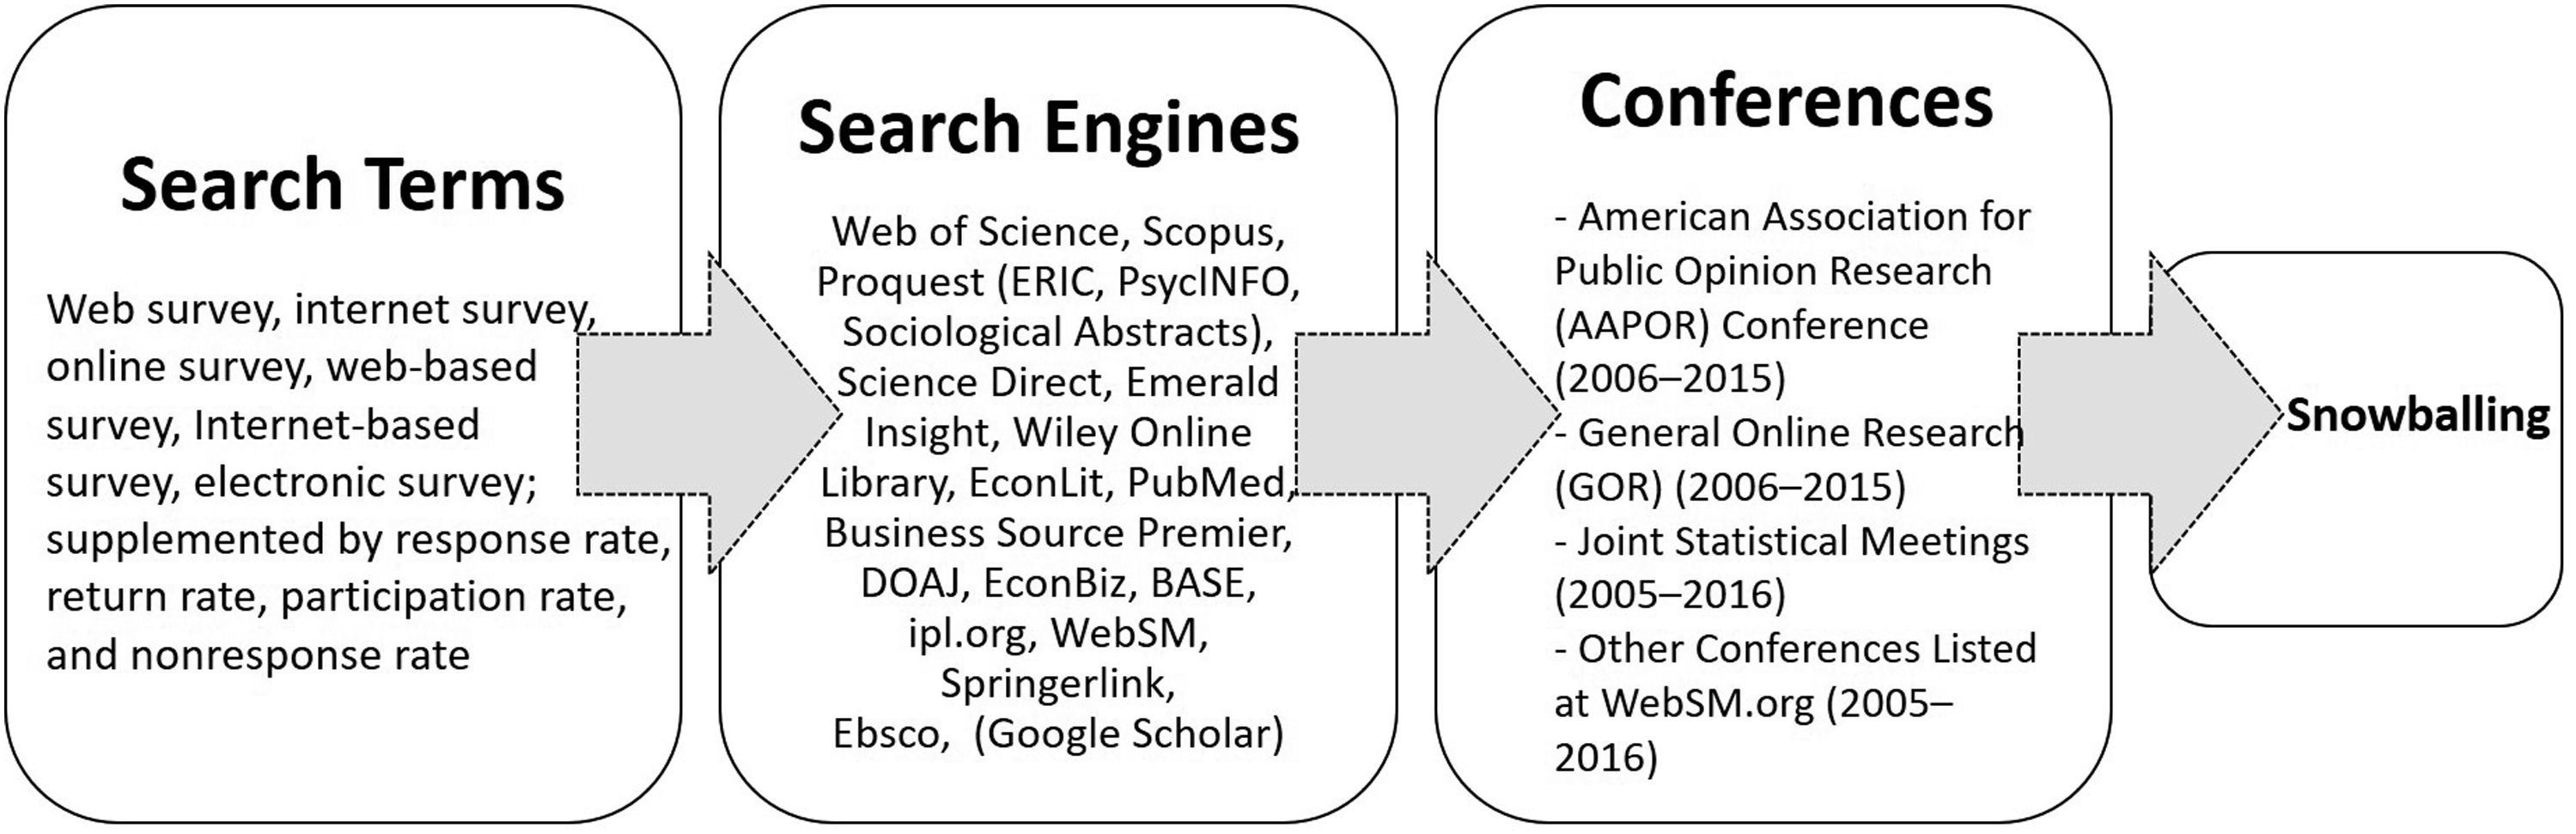
Using the above-mentioned search terms, we searched a list of search engines (see Figure 2). To overcome the publication bias problem (Rosenthal, 1979), we employed several techniques, such as including conference presentations and grey literature in our search. In addition, with the aid of a snowballing technique, we searched the reference lists of the selected publications. In addition, to explicitly collect grey literature, we examined conference abstracts from several relevant conferences (see Figure 2) from the years 2005–2016.
After the literature search and removal of duplicates, 142 manuscripts were identified for screening, of which 75 manuscripts matched our inclusion criteria. In these 75 manuscripts, we identified 110 studies that compared web response rates experimentally to another survey mode (see PRISMA flow chart in Supplemental Figure A1 for more information). These effects were included in our analysis (see Supplemental Table A4 for an overview). The coding reliability between the two independent coders was 92% (Krippendorff, 2004). Discrepancies in coding were resolved in a discussion involving the two coders.
Statistical Methodology and Effect Sizes
Our effect sizes were the web response rate, the response rate to the comparison survey mode, and the difference between the two response rates. Accordingly, we calculated the number of invited and eligible subjects for each mode and compared the results to obtain the difference in response rates. However, raw frequencies were essential for calculating the confidence interval for each effect size. We used the primary study authors’ definition of the response rate and calculated the raw frequencies for cases where insufficient data were provided. We created a dummy variable based on whether the authors provided raw frequencies or response rates. A robustness analysis did not reveal a significant moderation effect of the dummy variable on the average difference in response rates. We calculated the three effect sizes as follows


The interpretation of the web and comparison mode response rates is intuitive; a positive response rate difference (dRRD) means that the response rate for the web mode is higher than for the other modes, and a negative response rate difference means that the response rate is lower for the web mode. Our three effect sizes are closely linked and can be derived from each other. Nevertheless, we decided to report all three effect sizes, as further analyses showed that 32% of the heterogeneity in effect sizes (σ2) at the country level (effect sizes clustered in countries) could be explained by the response rate to the comparison mode (see Supplemental Table A1). Therefore, it was also important to consider the response rate to the comparison mode in order to assess whether web surveys could be the more suitable survey tool for a specific country.
In general, our statistical analysis comprised four steps (see Lipsey & David, 2001). First, we calculated the weighted average response rate difference and the confidence interval per country by weighting each effect size with the inverse value of its variance. This variance component consisted of the variance of sampling errors at the study level and an estimate of the variance between the studies (Borenstein et al., 2009). We performed a random-effect analysis because we wanted to draw conclusions for the population going beyond the included studies (Hedges & Vevea, 1998).
Due to the limited number of countries in our study, we were not able to perform a multilevel meta-analysis, which would have enabled us to disentangle the differences between the country level and the characteristics of the studies (study level) (Cheung, 2014). To ensure that study-level characteristics did not confound our substantive conclusions, we first conducted a sensitivity analysis (see Sensitivity Analyses in the Results Section), in which we correlated the relevant study characteristics with the country variable. Second, we performed a homogeneity analysis (as suggested by Viechtbauer, 2007, 2010) at the country level to determine whether the effect sizes came from the same population and to test whether a moderator analysis was appropriate. Third, we checked the robustness and quality of our results with a second sensitivity analysis focusing on sample distortions by mode and survey country (Cooper et al., 2019; Littell et al., 2008, p. 126; Viechtbauer, 2010, pp. 418–431) and also conducted an outlier analysis (Viechtbauer, 2010) and a publication bias analysis (Viechtbauer, 2010). In addition, we accounted for the multilevel structure of our data (effect sizes nested in studies nested in countries) by performing a multilevel analysis (see Supplemental Table A1). Fourth, in our main analysis, we examined which country-specific factors had a significant influence on differences in response rates. We estimated separate models for each factor, which is a standard approach in meta-analyses used to address overfitting and facilitate interpretation (Harrer et al., 2019; Viechtbauer, 2007). For the analyses, we used the R-package metafor (Version 1.9–9) (Viechtbauer, 2010). We chose “RD” (risk difference) as the effect size measure. The metafor package automatically transforms a risk difference into a log of the effect size, which makes these outcome measures symmetric around zero and enables a distribution of measures that is closer to a normal distribution.
Results
In this section, first, we report on the descriptive characteristics of the studies we examined. Following this, we investigate whether cross-cultural differences exist in the response rates of the seven countries in our study and, finally, identify which of the four country-specific factors might moderate these differences.
Study Characteristics and Sensitivity Analyses
The 110 effect sizes that we identified as eligible for our study were dominated by two characteristics. First, most (63%) of the web surveys were compared with mail surveys; second, most of the included studies (73%) were conducted in the United States (see Figure 3). Included experiments in percent by comparison mode and survey country (N = 110).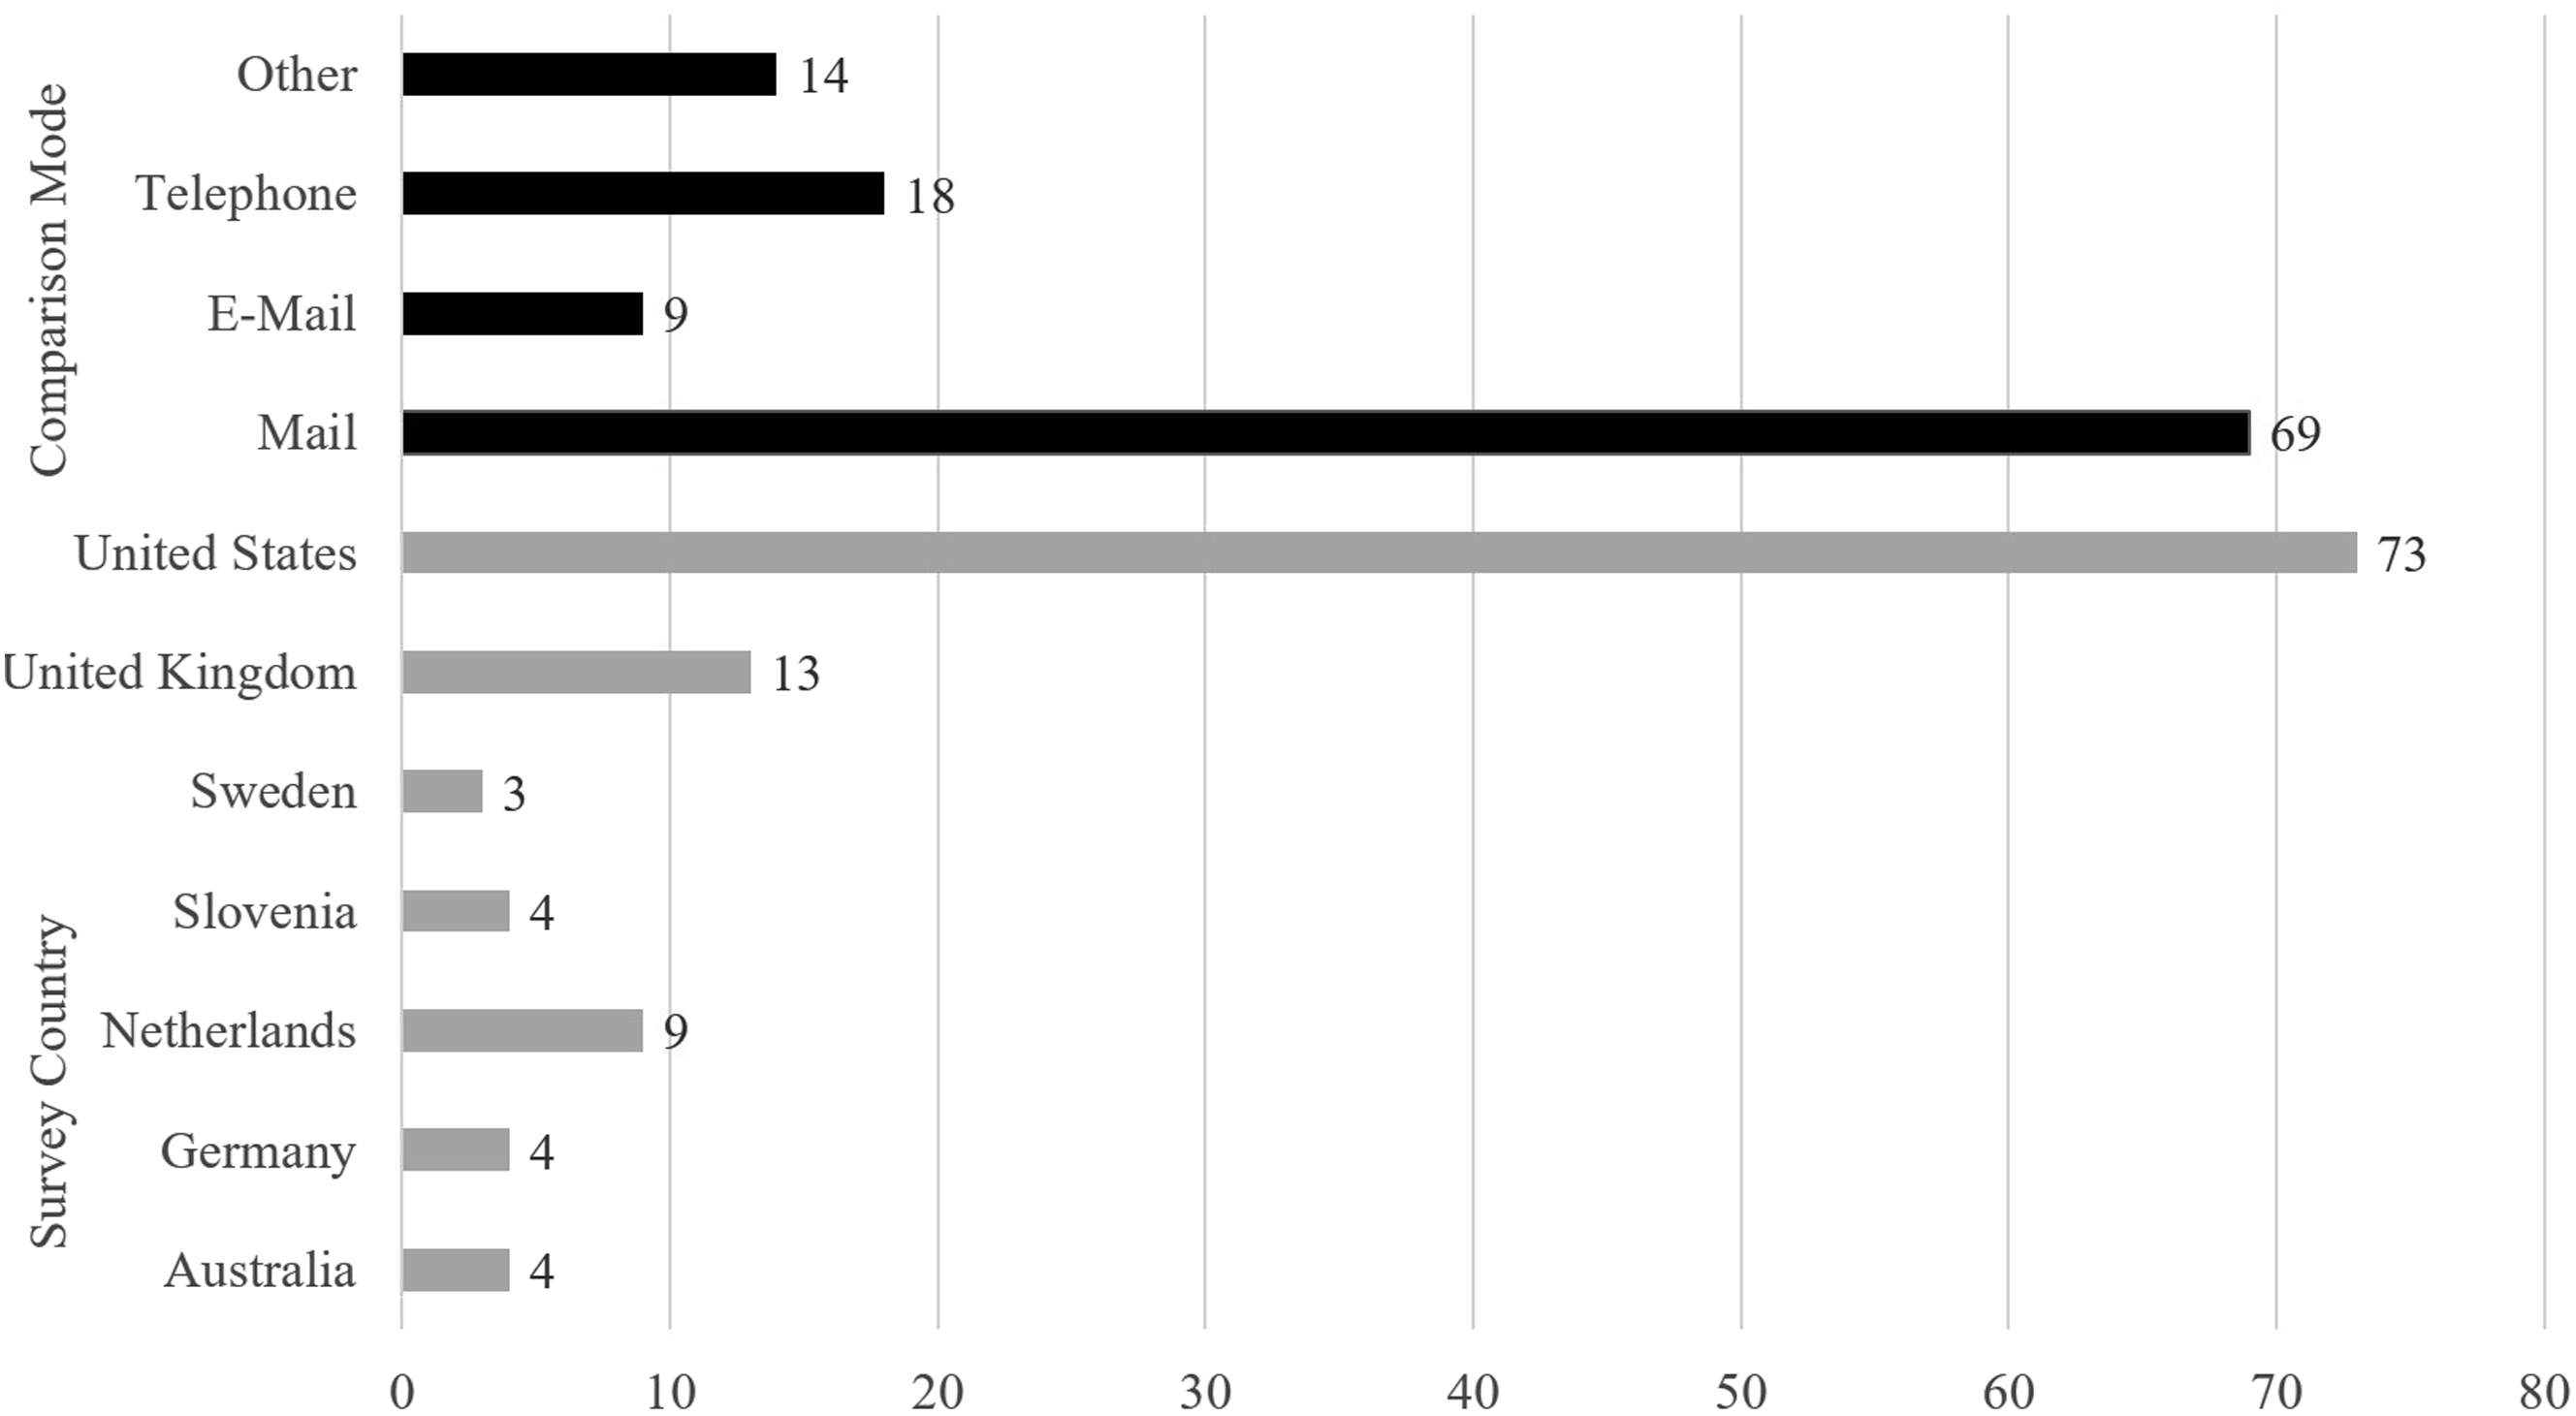
To prevent the strong presence of US studies and mail comparisons from distorting our analyses, we conducted two additional sensitivity analyses to ensure the robustness of our results. To this end, we replicated our results with a subpopulation of the US studies and the mail comparison studies. First, we drew a random sample from a selection of US studies. Second, we performed an analysis on studies including mail comparisons only. However, our results might have been biased, because a correlation may have existed between the comparison mode and the survey country. For this reason, we calculated the results not only for the mail mode but also for the telephone and face-to-face modes. All these further robustness checks replicated the subsequent findings (see Supplemental Table A2, Parts “b” and “c”). In addition, Daikeler et al., 2019; Lozar Manfreda et al., 2008 concluded that the contact mode of a survey, the sample population, and the number of contact attempts determined the difference between the response rates to web surveys and comparison survey modes. Therefore, to avoid pseudo-correlations, we investigated whether these variables correlated with the survey country. Our results showed that these three factors correlated only marginally with the survey country (contact mode r = .13 & p = .17; sample population r = .12 & p = .22; number of contact attempts r = .05 & p = .69).
Before exploring the cultural differences in web survey response rates, we addressed two questions regarding the validity of findings: publication bias and robustness. Publication bias refers to the problem that significant results have a higher probability of being published, which may distort the results of our meta-analysis. Our sensitivity analysis, which was implemented as a funnel plot, did not identify publication bias in our data, as the funnel plot was symmetrical. We also performed several robustness checks, such as excluding outliers, performing separate analyses for old and more recent studies, and applying a multilevel approach for effect sizes nested in papers. All differences in the mean response rates of these additional models were similar to those presented here; we did not detect any substantial differences. This suggests that the overall effect size was robust in terms of magnitude and direction. A detailed description of validity testing is provided in Section A2 of the online Appendix.
Cultural Differences in Web Surveys
For all 110 studies, the difference between the response rates to web surveys and to the comparison survey modes was 12 percentage points (confidence interval: 9 percentage points /16 percentage points). Thus, on average, web surveys recorded a 36% response rate, and the response rate to the comparison survey mode was 48% (see Figure 4). Consequently, the response rates to web surveys were robustly weaker than other survey modes. All three effect sizes were heterogeneous (significant Q-score of the difference 7.501 (df = 114, p ≤ .0001)). A heterogeneous effect size means that the value of the effect size, such as the difference in response rates, was not consistent across the studies, but varied significantly. Consequently, it was advisable to conduct a moderator analysis to explain this heterogeneity (Borenstein et al., 2009). We addressed this heterogeneity by testing the country itself as a possible moderator in a mixed-effects model, and our results showed significant differences in the response rates at the country level for all three effect sizes (see Table A2, Part “a”). This indicated that the participation rate in a web survey depends partly on the respective country in which a survey is conducted. Response rate overview across countries (N = 110).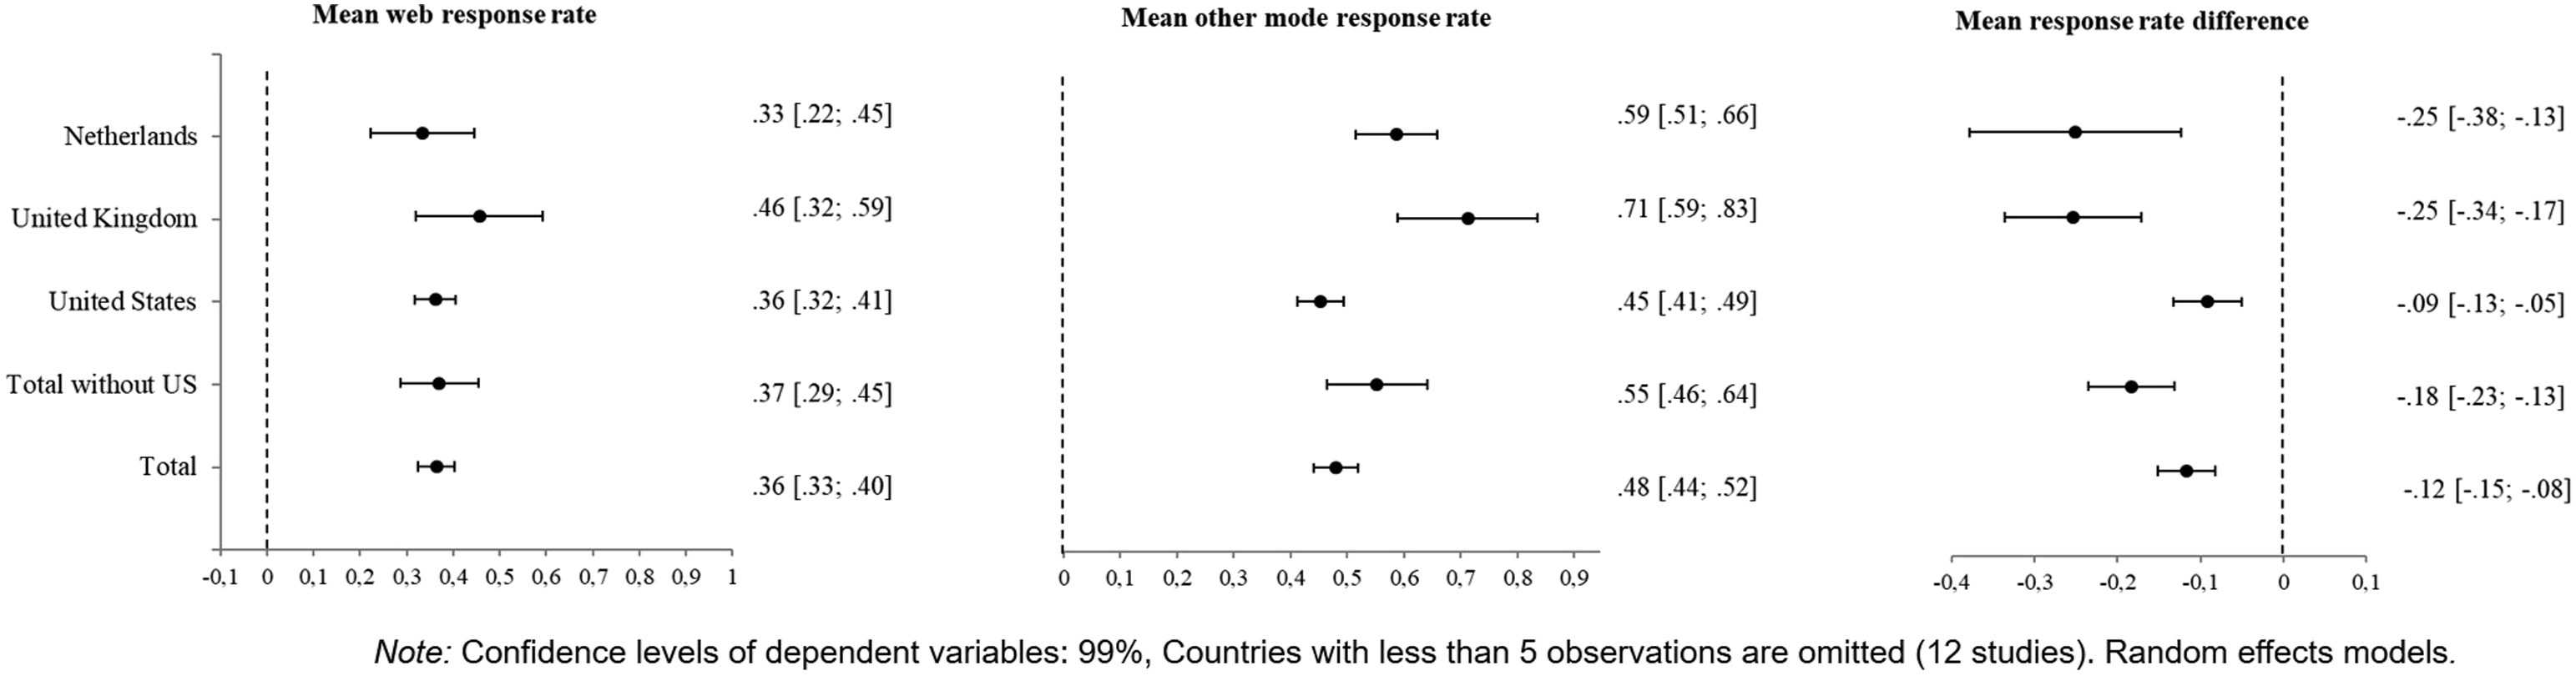
Focusing on the differences between the average effect sizes of the 110 studies in Figure 4, it can be seen that the effect sizes of the web survey mode in the left forest plot are more similar than the effect sizes of the comparison modes in the middle forest plot and the response rate differences shown in the right forest plot. The right forest plot shows that the difference in response rates is significantly different to zero in all three examined countries. The smallest difference between response rates to web surveys and to other survey modes was recorded in the United States, with a difference of 9 percentage points. The United Kingdom and the Netherlands showed larger differences of 25 percentage points each. As the other countries in our sample had fewer than five effect sizes per country, we did not show their individual country values in this forest plot. The overall gap in response rates was 11 percentage points. However, when all studies conducted in the United States were excluded, this number rose to 18 percentage points 10 .
In the next section, we investigate in detail whether the cross-country differences in effect sizes can be explained by political and demographic, economic, technological, and socio-cultural factors.
Country-Specific Predictors of the Success of Web Surveys 11
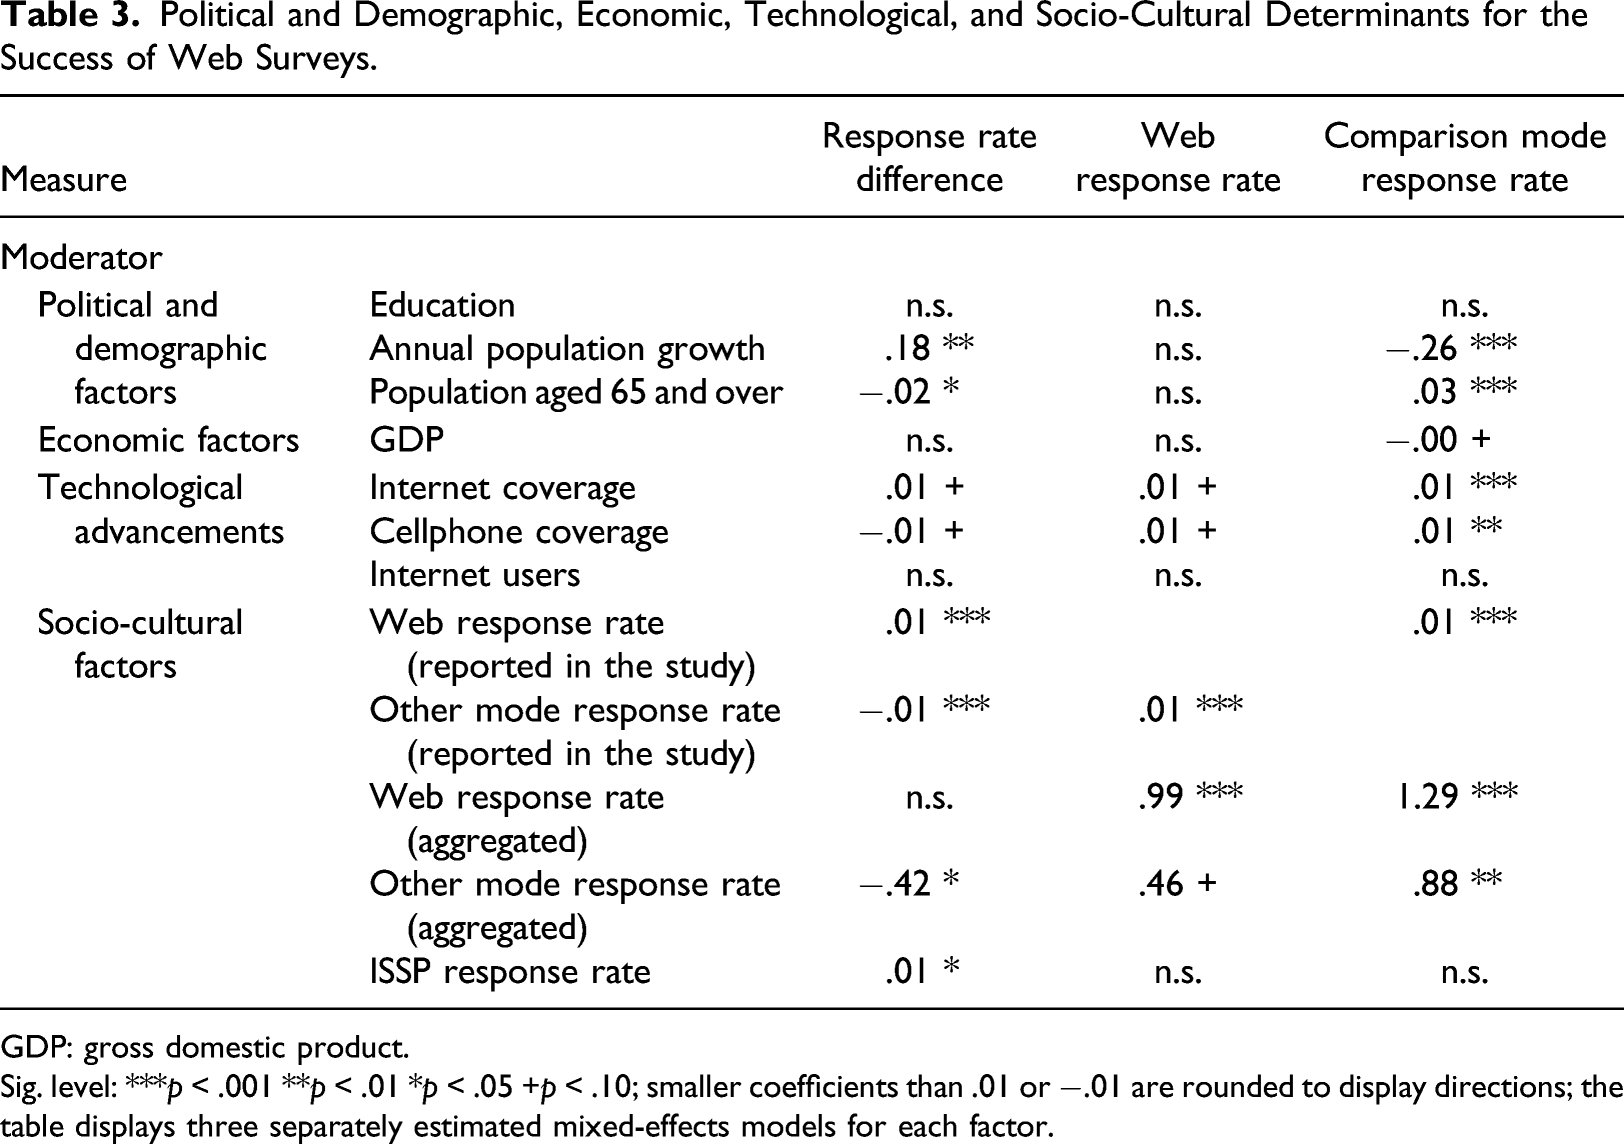
Political and Demographic, Economic, Technological, and Socio-Cultural Determinants for the Success of Web Surveys.
GDP: gross domestic product.
Sig. level: ***p < .001 **p < .01 *p < .05 +p < .10; smaller coefficients than .01 or −.01 are rounded to display directions; the table displays three separately estimated mixed-effects models for each factor.
With respect to economic factors (H4), we expected a higher GDP to be linked to higher prosperity and innovation. Thus, we expected more of the population to have regular access to the internet. Therefore, for prosperous countries, we expected a high web response rate and a low difference between the response rates to different modes. However, the results of our analysis did not support this expected positive effect of GDP on the success of web surveys compared to other survey modes (see Row 6 in Table 3).
The technological advancements of a country (see H5–H7 in Table 1) should also be considered in researchers' decisions to employ a survey mode. Our results showed that the higher the internet and cell phone coverage in a country, the higher the response rates to the web-based mode relative to other survey modes (one percentage point more coverage results in one percentage point more web response rate, see Rows 7 and 8 of Column 4 in Table 3). With respect to the difference in response rates, Table 3 shows that for every percentage point more internet coverage in a country, the difference between the response rates to web-based surveys and to comparison survey modes shrinks by one percentage point (see Row 7 of Column 3 in Table 3). The opposite effect occurs regarding cell phone coverage. The higher the cell phone coverage in a country, the larger the difference between the response rates to web surveys and to comparison survey modes (see Row 8 of Column 3 in Table 3). In other words, the higher the cell phone coverage, the greater the disadvantage of conducting web surveys compared to other modes of data collection. The number of actual internet users had no significant effect on response rates. To summarize our results regarding the technological advancements of a country, internet and cell phone coverage moderated the response rates for web surveys. More specifically, our results showed that the better the cellphone coverage, the higher the web survey response rate, but, at the same time, the difference between the response rates to web surveys and comparison survey modes was also larger.
Finally, to address Hypothesis 8 (see Table 1), we examined whether the socio-culture influenced country-specific survey response. Our analysis showed that a positive propensity to participate in surveys led to higher response rates. For every percentage point more web response, the response rate for the comparison mode also grew by one percentage point (see Rows 11 and 12 in Table 3). However, considering the aggregated response rates from the last 5 years, our analysis also revealed that the comparison survey mode benefited almost twice as much (.46 percentage points increase in web response rate compared to a .88 percentage points increase in the response rate for the other mode) from a positive propensity to participate in surveys. On the whole, if the country-specific response rates for the comparison survey modes were generally high, web surveys also achieved higher response rates, and vice versa. The difference in response rates was mainly moderated by the response rates to the comparison survey mode, absolute, and aggregated. The higher the response rates to the comparison survey mode, the larger the difference in response rates. This phenomenon is also reflected in the response rate to the ISSP. The higher the response rate to the ISSP in a country, the larger the difference between the response rates to web surveys and their comparison survey mode (for each percentage point more response rate, the difference in response rates rises by one percentage point). This suggests that if the ISSP has a high response rate in a country, a large difference can be expected between web-based and comparison survey modes.
Furthermore, following Cadle et al’s. (2014) suggestion that socio-cultural factors are important for evaluating a country’s business environment, we conducted an additional moderator analysis using several cultural concepts: Hofstede’s individualism and uncertainty avoidance dimensions (Hofstede, 2016); Schwartz values concerning hedonism, conservation, and openness to change (Schwartz & Boehnke, 2004); the trust values of the World Values Survey (Inglehart et al., 2014). We did not find any significant effects of these moderators. As we did not have a strong theoretical expectation that linked web survey participation behavior to these cultural concepts (Daikeler et al., 2019), we decided against reporting these supplementary analyses in our Results section; instead, we report the complete results of these supplementary analyses in the Supplemental in Table A3.
Discussion
Summary of Results
Our research investigates whether the success of a web survey depends on country-specific factors and which country-specific indicators favor high web survey response rates. We developed our research questions based on an examination of previous meta-analytic studies (Daikeler et al., 2019; Lozar Manfreda et al., 2008) that used an international database, but did not investigate the heterogeneity of effect sizes at the country level. In our study, we meta-analyzed a dataset that consisted of 110 random split-sample experiments. Our results show that within-country factors are a source of heterogeneity for each of the three effect sizes: the web survey response rate, the response rate to the comparison survey mode, and the difference between the response rates to these survey modes. In an attempt to understand why cost-effective and time-saving web surveys may be more appropriate in some countries and less appropriate in others, our meta-analytical study investigated whether country-specific factors had an impact on web survey response rates. We examined four country-specific factors: political and demographic, economic, technological, and socio-cultural factors.
One of our main findings was that the heterogeneity of the differences between the response rates to web-based survey modes and other survey modes within countries was, to a large degree, due to the response rates of the comparison survey mode. Web surveys performed similarly across countries, unlike other survey modes. On average, the United States had 9% percentage points difference in survey response rates, whereas the U.K. and the Netherlands had 25% percentage points difference in survey response rates. However, the average response rates to web surveys in these countries were quite similar, 36%, 46%, and 33%, respectively, whereas the response rates to the comparison survey mode varied more, with 45%, 71%, and 58%, respectively. Given that the response rates to the comparison survey mode varied considerably across countries, the decision about whether to implement a web survey in a specific country should always take into account the expected response rates for alternative survey modes. As Kunert et al. (2002) and De Heer (1999) showed, preference for certain survey modes depends on the individual resources of a country.
With respect to the country-specific factors that moderate cross-country differences in survey response rates, our results showed that three out of four macroeconomic factors had an impact on the web survey response rate. A higher web survey response rate was linked with high population growth, high internet coverage, and a high response propensity. However, web surveys had a serious disadvantage compared to other survey modes when a country’s population was older and cell phone coverage was high. Previous research also reports age as a moderating factor of response rates to different modes in survey research (*Bech & Kristensen, 2009; Revilla et al., 2017).
With respect to political and demographic factors, we found that the higher the population growth and the lower the proportion of older people in a country, the better web surveys performed within a country. For countries with a high level of education, we expected web surveys to perform better, as most of the literature reports that higher educated individuals exhibit a higher propensity to respond to web surveys (e.g., Millar et al., 2009; Mulder & de Bruijne, 2019). However, we did not find this positive effect in our analysis. This could be due to the similarity of the educational levels in the countries in our study.
As a proxy for economic factors, we examined the GDP of the countries in our study and expected a positive association with web response rates. However, we found that this factor did not have an impact on the response rates to web-based survey or comparison survey modes. Again, a possible reason for this non-significant effect could be that the countries in our study had a similar economic status, as previous literature reports a link between income and mode preferences (e.g., Millar et al., 2009)
Regarding the technological factors, we found that web surveys were more appropriate for countries with high internet coverage rates. This finding was in line with our expectations and the literature (see, e.g., Smyth et al., 2014). We assumed that high internet coverage rates enable a population to use the internet regularly, and regular usage reduces the burden of completing a web survey. However, our results also showed that the better the cell phone coverage of a country, the higher the response rates for the comparison survey modes. Consequently, the difference in the response rates to web surveys and comparison survey modes was larger in countries with high cell phone coverage. From today’s perspective, this finding is surprising as we often equate cell phone coverage with mobile internet coverage. However, most of the studies that we analyzed were completed at a time when the mobile internet was not yet available. Therefore, this indicator may influence web survey response rate differently in the future, and our study should be replicated when more recent studies are available.
With respect to country-based socio-cultural factors, we found that web surveys work well in countries with high response rates to comparison survey modes and high ISSP response rates. This finding is in line with the results of a study conducted in a region in Belgium. This study showed that a low propensity to participate in surveys leads to lower web response rates and a higher number of contact attempts (Barbier et al., 2015). Our study, therefore, enabled us to generalize Barbier et al. (2015) results regarding survey participation propensity and response rates across countries. With respect to decisions about which survey mode to use in a country, we conclude that web surveys probably work well in a country where comparative survey modes also perform well. In addition, although switching the survey mode might decrease the survey response rate, it also might bring organizational and financial benefits. Overall, web surveys are a useful alternative to traditional survey modes especially when a country has a young, technology-oriented, and survey-friendly population.
Limitations and Further Research
First, 73% of the studies we examined were conducted in the United States and, despite our robustness analysis, evidence from other countries is needed to further strengthen our findings. Additional evidence is especially important because most of the experimental studies were conducted in western countries. Including more (diverse) countries would lead to more statistical power and a deeper understanding of the moderating factors. Furthermore, including more countries would enable researchers to use multilevel meta-analytic models, enabling an examination of country-level variance.
A second limitation is that our sample largely consists of comparisons between web-based and mail surveys. On the one hand, this is not surprising because many studies compare self-administered modes. On the other hand, mail surveys have only recently begun to play a more prominent role as a survey mode again.
Third, some empirical studies (e.g., Johnson et al., 2018; Rammstedt et al., 2017) and theoretical approaches (e.g., Cadle et al., 2014) include value-oriented concepts, such as the models suggested by Hofstede (2016) or Schwartz and Boehnke (2004). We tested several value concepts such as Hofstede’s individualism and uncertainty avoidance dimensions (Hofstede, 2001); the Schwartz values concerning hedonism, conservation, and openness to change (Schwartz & Boehnke, 2004); and the trust values of the World Values Survey (Inglehart et al., 2014). However, we did not find any significant effects of these concepts. Nevertheless, the concepts we tested are not optimal because, for example, Hofstede’s values are not available as a time series.
Fourth, there are several possible alternative political and demographic, economic, technological, and socio-cultural factors that influence the response rate of web surveys. The selection presented was made based on the feasibility of the database and the inclusion criteria outlined in the Methods section. We recommend conducting further research to explore alternative operationalizations, which would help test the generalizability of the findings of the present study.
Fifth, we decided against including survey-based indicators such as incentives, sample population, or contact attempts because Daikeler et al. (2019) showed that these indicators explain only a very small amount of the heterogeneity of the difference in survey response rates. While the studies we examined were not randomized across countries, comparison modes, or survey-based indicators, our sensitivity analyses, separated by mode, did not indicate a systematic mode bias in our results.
Sixth, the costs and the effort required to implement a certain survey mode are two determining factors that impact survey mode choice. In our meta-analysis, we could not take these two factors into account due to a lack of information in the primary studies we examined. In a cross-country context, the costs for web surveys should be quite homogeneous across countries, whereas the costs for interviewer-administered comparison survey modes depend strongly on country-specific conditions, such as the infrastructure, wages, availability of interviewers, and the competition between organizations conducting the interviews.
Seventh, as outlined in the Introduction, response rates are likely to be directly related to non-response bias, but this is not necessarily always the case and should be investigated in future studies. Such studies require that the characteristics of the population are known before the sample is drawn (and in the case of meta-analyses that they are published and well documented). Our findings reveal cross-national differences in the country-level indicators that influence survey response rates (see Table 3), thus raising the question as to whether differences in the social structure across countries are systematically related to non-response within a country. Such systematic non-response bias would, in turn, affect cross-national comparability in cross-national settings (Jans et al., 2018).
Last, the increasing popularity of mobile web surveys calls for them to be included in future survey mode comparisons and in meta-analyses. This avenue of research seems especially promising in a cross-cultural context because many people in Asian and African countries access the internet mainly with their smartphones (Statista, 2018).
Conclusion and Practical Implications
Because web surveys perform consistently with relatively high response rates, our findings suggest that they can be used as an alternative to other survey modes in all of the countries included in the study. Web surveys can be a reliable alternative, especially when other survey modes are not feasible due to high survey costs, long field times, or decreasing response rates. At the same time, in almost all countries of our study, the web survey response rate was lower than the rates of other survey modes. Consequently, using a web survey is likely to decrease the response rate, and survey designers will have to account for this during the study planning phase (e.g., by drawing larger samples, sending more reminders, or providing higher incentives) 12 . This is especially relevant in cross-national settings where more traditional survey modes perform less consistently, and fieldwork is often challenging and time-consuming. In such settings, web surveys are expected to be increasingly the survey mode of choice.
Supplemental Material
sj-pdf-1-mre-10.1177_14707853211050916 – Supplemental Material for A Meta-Analysis of How Country-Level Factors Affect Web Survey Response Rates
Supplemental Material, sj-pdf-1-mre-10.1177_14707853211050916 for A Meta-Analysis of How Country-Level Factors Affect Web Survey Response Rates by Jessica Daikeler, Henning Silber and Michael Bošnjak in International Journal of Market Research
Footnotes
Funding
The author(s) received no financial support for the research, authorship, and/or publication of this article.
Supplementary material
Supplementryl material for this article is available online.
Notes
References
Supplementary Material
Please find the following supplemental material available below.
For Open Access articles published under a Creative Commons License, all supplemental material carries the same license as the article it is associated with.
For non-Open Access articles published, all supplemental material carries a non-exclusive license, and permission requests for re-use of supplemental material or any part of supplemental material shall be sent directly to the copyright owner as specified in the copyright notice associated with the article.