
Abstract
Background and objective:
All-trans retinoic acid (ATRA), a promising therapeutic agent, has been confirmed in animal experiments as playing a protective role against renal diseases. The renin-angiotensin aldosterone system (RAAS) plays a key role in the pathogenesis of renal diseases, and RAAS inhibitors can prevent the progression of kidney diseases. In our previous study, we found that ATRA could play a protective role against glomerulosclerosis (GS) lesions in rats, and its effect was similar to RAAS inhibitors. However, whether ATRA treatment was associated with RAAS expression was not clear.
Methods:
Six-week-old male Wistar rats were divided into three groups: sham operation group (SHO), glomerulosclerosis model group without treatment (GS) and GS model group treated with ATRA (GA). At the end of 13 weeks, the relevant samples were collected and analyzed.
Results:
The mRNA and protein expression of angiotensin-converting enzyme 1 (ACE1) in the GS group was notably higher when compared with the SHO group. However, mRNA and protein expression of ACE1 in the ATRA treatment group was markedly down-regulated when compared with the GS group. Angiotensin-converting enzyme 2 (ACE2) expression (mRNA or protein) in the GS group was reduced compared with that in the SHO group, and ATRA markedly increased the mRNA and protein expression of ACE2 compared with the GS group. The levels of protein expression of angiotensin I and angiotensin II were significantly up-regulated in the GS group compared with those in the SHO group, and ATRA reduced their expression in the GA group when compared with the GS group.
Conclusion:
ATRA is associated with RAAS expression in GS rats, but its detailed mechanism needs to be elucidated by further research.
Keywords
Introduction
Glomerulosclerosis (GS) is a common pathological finding which often progresses to renal failure. 1 Accumulation of extracellular matrix (ECM), such as collagen IV (Col-IV) and fibronectin (FN), is an important feature of GS lesions. The pathogenesis of GS is very complicated, and there is little useful therapy.
The activated renin-angiotensin aldosterone system (RAAS) can stimulate ECM production. 2 Activation of the RAAS is a major contributing factor to the pathogenesis and progression of renal diseases. 3 Enhanced RAAS activation contributes to proteinuria and chronic kidney disease by increasing glomerular and tubulointerstitial oxidative stress, promoting fibrosis. 4
Retinoic acid, as an active metabolite of vitamin A, includes all-trans retinoic acid (ATRA), 13-cis retinoic acid and 9-cis retinoic acid, and exerts various effects on physiological processes such as cell growth, differentiation, apoptosis and inflammation. 5 ATRA, as an important subgroup of retinoic acid, is a promising therapeutic agent for many diseases, such as acute promyelocytic leukemia, 6 pulmonary fibrosis, 7 renal interstitial fibrosis, 8 etc. In our previous study, we found that ATRA could achieve a similar effect to a RAAS inhibitor (benazepril) to prevent the progression of GS lesions in GS rats.9,10 However, whether the ATRA treatment was associated with the expression of RAAS in GS rats was not elucidated. This study was performed to investigate the association of ATRA treatment with RAAS expression.
Materials and methods
Animal model
All the procedures were approved by the animal ethics committee of Guangxi Medical University. Sixty 6-week-old male Wistar rats were divided into three groups at random: sham operation group (SHO, n=20), GS model group without treatment (GS, n=20) and GS model group treated with ATRA (GA, n=20). The SHO group was subjected to a sham operation and tail vein injection of 0.9% saline solution alone. GS disease in the GS group was induced by uninephrectomy and a single tail vein injection of adriamycin (ADR) (Wanle Pharmaceutical Co., Shenzhen, China) at a dose of 5 mg/kg on day 7 after the uninephrectomy treatment. All the animals survived the surgery. The rats in the GA group were treated with ATRA (Sigma Co., USA; 15 mg/kg·d) in corn oil once daily by oral gavage, from the time of injection of ADR to the end of the experiment. At the end of 13 weeks, the 20 rats in each group were sacrificed. Their renal tissues were collected for histological and molecular biology analysis.
Renal morphology
After 10% neutral formaldehyde fixation, the renal tissues were dehydrated through a graded ethanol series and embedded in paraffin. Sections were prepared on a microtome and stained with Masson’s trichrome staining. Blue granular or linear deposits were interpreted as positive areas for collagen staining. Renal damage was viewed by light microscopy, and the severity of the renal lesion was defined by the glomerulosclerosis index (GSI). The GSI was scored according to the method of Raij et al. 11 The severity of the lesion was examined in 100 glomeruli selected at random, graded from 0–4 points in accordance with the percentage of morphological changes on each glomerulus (0=0%, 1+=1–25%, 2+=26–50%, 3+=51–75%, 4+=76–100%). The number of glomeruli showing a lesion of 0 was n 0, of 1+ n 1, of 2+ n 2, of 3+ n 3, and of 4+ n 4. 12 The 100 glomeruli were examined independently, and the GSI was obtained by the formula as follows: GSI=(0×n 0+1×n 1+2×n 2+3×n 3+4×n 4)/(n 0+n 1+n 2+n 3+n 4)= (0×n 0+1×n 1+2×n 2+3×n 3+4×n 4)/100. The scores obtained by two investigators were averaged.
Immunohistochemical analysis of collagen IV, fibronectin, angiotensin I, angiotensin-converting enzyme 1, angiotensin-converting enzyme 2 and angiotensin II
The analysis was implemented using the streptavidin–peroxidase immunohistochemical method. Renal tissue samples were fixed in 10% neutral formaldehyde, dehydrated with ethanol, and embedded in paraffin. Serial 4 μm sections were collected sequentially on glass slides. The paraffin was removed from the sections with xylene and rehydrated in graded ethanol. In order to retrieve antigenicity from formalin fixation, we incubated the sections for 10 min in 10 mmol/l sodium citrate buffer using a microwave oven. Endogenous peroxidase activity was blocked by further pretreatment with 3% hydrogen peroxide and methanol. Finally, the sections were incubated with antibody against Col-IV (Shanghai Changdao, Co., Inc., China), FN (Beijing Zhongshan Co., Inc., China), angiotensin I (Santa Cruz), angiotensin-converting enzyme 1 (ACE1) (Abcam, Cambridge, MA), angiotensin-converting enzyme 2 (ACE2) (Abcam, Cambridge, MA) and angiotensin II (Santa Cruz) overnight at 4°C. The sections were washed thoroughly in phosphate-buffered saline (PBS) solution and incubated with rabbit anti-mouse biotinylated second antibody immunoglobulin (Shanghai Changdao, Co., Inc., China) for 30 min. Finally, the sections were stained with diaminobenizidine (Maixin Bio, Co., Inc., China). We obtained negative controls by replacing specific antisera with PBS solution. Brownish yellow granular or linear deposits in the cells or matrix were interpreted as positive areas. Semi-quantitative evaluation was performed by computer-assisted image analysis (Leica Co., Germany). The positive staining of Col-IV, FN, ACE1, ACE2, angiotensin I or angiotensin II was measured at 400-fold original magnification in 100 glomeruli which were selected from coded sections of each rat at random.
Real-time reverse transcription polymerase chain reaction to detect ACE1 and ACE2 mRNA expression in renal tissue
Renal tissue was homogenized and total RNA was extracted with TRIzol (Beijing Tiangen, Co., China). Primers of ACE1, ACE2 and β-actin were designed according to primer design principles by Primer Premier 5.0. The primer sets used were: F 5’-CAGGTTCGTGGAGGAGTATGA-3’ and R 5’-TGCCCTCTATGGTAATGTT -GG-3’ for ACE1; F 5’-CTAAGAAACGGAGCCAATGAAG-3’ and R 5’-TATCCT- GAAAGACCATCCACCT-3’ for ACE2; F 5’-GCCCCTGAGGAGCACCCTGT-3’ and R 5’-ACGCT CGGTCAGGATCTTCA-3’ for β-actin. One microgram total RNA from the renal tissue of each rat was reverse transcribed into cDNA with an ExScript RT reagent kit (Takara Biotechnology, Co., Dalian, China). ACE1, ACE2 and β-actin were amplified with SYBR Premix Ex Taq (Beijing Tiangen, Co., China). The analysis for each sample was performed in triplicate. The average threshold cycle (Ct, the cycles of template amplification to the threshold) was worked out as the value of each sample. The data of fold change were analyzed using 2−ΔΔCt13: fold change = 2−ΔΔCt. For example, the ΔΔCt for ACE1 mRNA expression in GS group was as follows: ΔΔCtACE1 = (CTACE1, GS group – CTβ-actin, GS group) – (CTACE1, SHO group – CTβ-actin, SHO group), and the fold change for ACE1 mRNA expression in GS group was 2−ΔΔCtACE1.
Western blot analysis of angiotensin I, ACE1, ACE2 and angiotensin II protein expressions in renal tissue
Total protein was extracted from renal tissue using a standard method. Samples were then processed in duplicate by SDS-PAGE gradient gels and transferred to PVDF membranes. The membranes were blocked with 5% milk blocking buffer for 1 h at room temperature, followed by overnight incubation with primary antibodies to angiotensin I (1:300) (Santa Cruz), ACE1 (1:100) (Abcam, Cambridge, MA), ACE2 (1:2000) (Abcam, Cambridge, MA) and angiotensin II (1:300) (Santa Cruz) overnight at 4°C. β-actin was used as an internal control and was detected by the application of anti-β-actin antibody (1:1000) (Abcam, Cambridge, MA). The membranes were washed twice for 10 min each in Tris-buffered saline with 0.5% Tween 20 (TBST) then probed with an infrared secondary antibody for 1 h at room temperature. Washes twice for 10 min in TBST were repeated after incubation with the secondary antibody. Membranes were imaged using LiCor Odyssey scanner (Li-Cor, Lincoln, NE). 14 Protein expression was calculated by ratio (objective gene / β-actin).
Statistical analysis
The data are shown as mean ± standard deviation. Analysis of covariance and Student–Newman Keuls post-tests were performed to determine the differences among groups. Pearson’s correlation coefficient was used to determine the relationships between the indicators for detection. A value of p<0.05 was considered as a significant difference. Statistical analysis was performed using SPSS version 13.0 (SPSS, Chicago, IL, USA).
Results
Renal morphology
Light microscopy was performed to observe the changes of glomerular morphology. Glomerular morphology was normal in the sham group (Figure 1). Extensive damage was observed in the GS group, such as glomerular hypertrophy, balloon adhesion and wall thickening, degeneration of glomerular epithelial cells and infiltration of widespread mononuclear cells (Figure 1). The glomerular lesions in the GA group were reduced when compared with the GS group (Figure 1). Quantitative analysis showed that the GSI of the GS group was much higher than that of the SHO group, and the GSI of the GA group was reduced when compared with that of the GS group (Figure 1).

Statistical parameters for GSI and morphological characteristics of glomerulus under light microscopy in three groups. ※: p<0.01 compared with SHO, ★: p<0.01 compared with GS. Collagen deposition was markedly observed (A2) when compared with the SHO group (A1). The pathological changes in the ATRA group (A3) were remarkably reduced when compared with those in GS group (A2). SHO: sham operation group; GS: GS model group; GA: GS model group treated with ATRA. All Masson, ×400.
Protein expression of Col-IV, FN, angiotensin I, ACE1, ACE2 and angiotensin II in the glomerulus
Immunohistochemical staining for Col-IV, FN, angiotensin I, ACE1, ACE2 and angiotensin II was performed. The staining for Col-IV, FN, angiotensin I, ACE1 and angiotensin II was markedly enhanced in the majority of glomerulus, glomerular endothelial cells, glomerular basement membrane, mesangial cells and visceral epithelial cells of GS rats when compared those in the SHO group, and their expression in the GA group was reduced when compared with the GS group (Figure 2). However, in the GS group, the glomerular staining for ACE2 was markedly reduced compared with that in the SHO group, and ACE2 expression in the GA group was increased compared with that in the GS group (Figure 2).
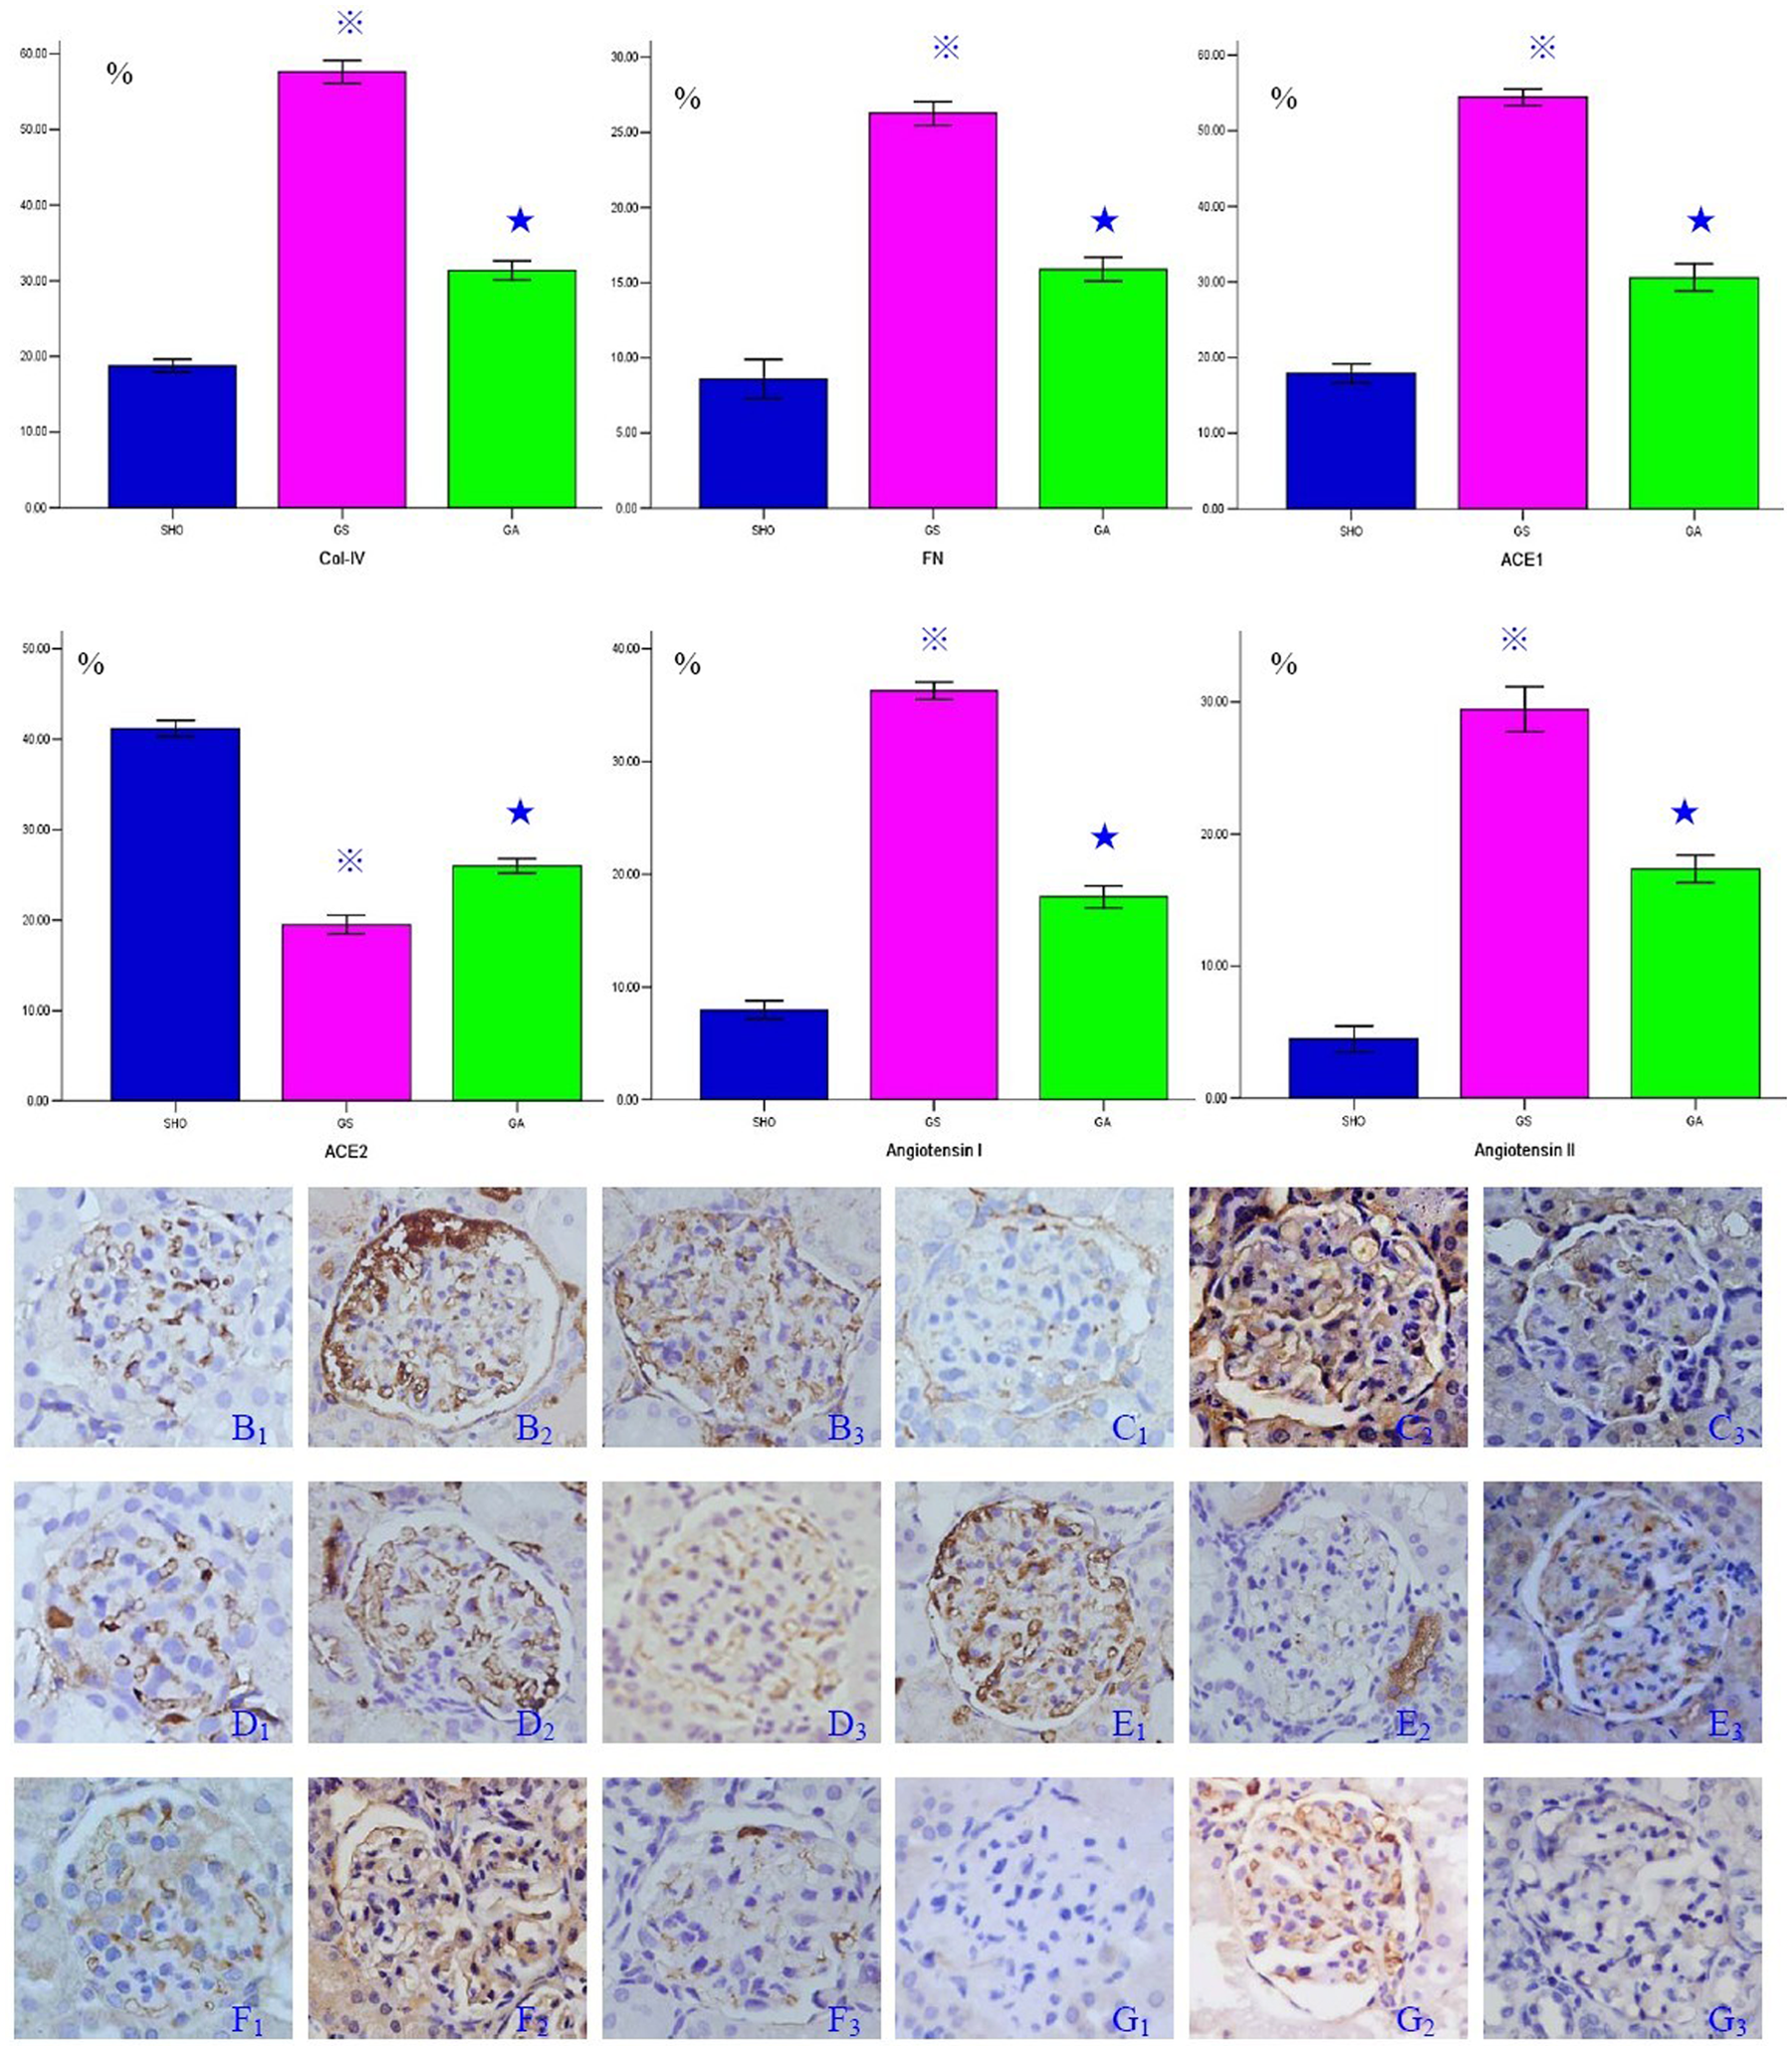
Statistical parameters for the immunohistochemistry of Col-IV, FN, ACE1, ACE2, angiotensin I and angiotensin II in glomerulus, and the typical immunohistochemical staining of Col-IV (SHO: B1, GS: B2, GA: B3), FN (SHO: C1, GS: C2, GA: C3), ACE1 (SHO: D1, GS: D2, GA: D3), ACE2 (SHO: E1, GS: E2, GA: E3), angiotensin I (SHO: F1, GS: F2, GA: F3) and angiotensin II (SHO: G1, GS: G2, GA: G3) in glomerulus in three groups. ※: p<0.01 compared with SHO, ★: p<0.01 compared with GS. Stainings for Col-IV, FN, ACE1, angiotensin I and angiotensin II in the GS group (B2, C2, D2, F2 and G2) were markedly increased when compared with those in the SHO group (B1, C1, D1, F1 and G1). The positive stainings of Col-IV, FN, ACE1, angiotensin I and angiotensin II in the ATRA group (B3, C3, D3, F3 and G3) were markedly reduced when compared with the GS group (B2, C2, D2, F2 and G2). Positive staining for ACE2 in the GS group (E2) was down-regulated when compared with that in the SHO group (E1), and the positive stainings in the ATRA group (E3) were remarkably increased when compared with the GS group (E2). Col-IV: collagen IV; FN: fibronectin; ACE1: angiotensin-converting enzyme 1; ACE2: angiotensin-converting enzyme 2; ATRA: all-trans retinoic acid; SHO: sham operation group; GS: GS model group; GA: GS model group treated with ATRA; Magnification 400×.
Association of ATRA treatment with ACE1 and ACE2 mRNA expression
Higher ACE1 mRNA expression was demonstrated in the renal tissue of the GS group when compared with the SHO group (p<0.01; Figure 3). However, mRNA expression of ACE1 in the ATRA treatment group was down-regulated when compared with the GS group (p<0.01; Figure 3). The mRNA expression of ACE2 in the GS group was reduced compared with the SHO group (p<0.01; Figure 3), and the mRNA expression of ACE2 in the GA group was increased compared with the GS group (p<0.01; Figure 3).

Statistical parameters of mRNA expressions of ACE1 and ACE2 in three groups. ★: p<0.01 compared with the SHO group, ※: p<0.01 compared with the GS group. SHO: sham operation group; GS: glomerulosclerosis model group without treatment; GA: GS model group treated with ATRA.
Association of ATRA treatment with angiotensin I, ACE1, ACE2 and angiotensin II protein expression
When compared with those in SHO group, the levels of protein expression of angiotensin I, ACE1 and angiotensin II in the GS group were significantly higher, and the levels of protein expression of angiotensin I, ACE1 and angiotensin II in the ATRA treatment group were markedly reduced compared with those in the GS group (Figure 4). The level of protein expression of ACE2 in the GS group was down-regulated when compared with that in the SHO group (p<0.01; Figure 4). However, the level of protein expression of ACE2 in the GA group was markedly increased when compared with that in the GS group (p<0.01; Figure 4).
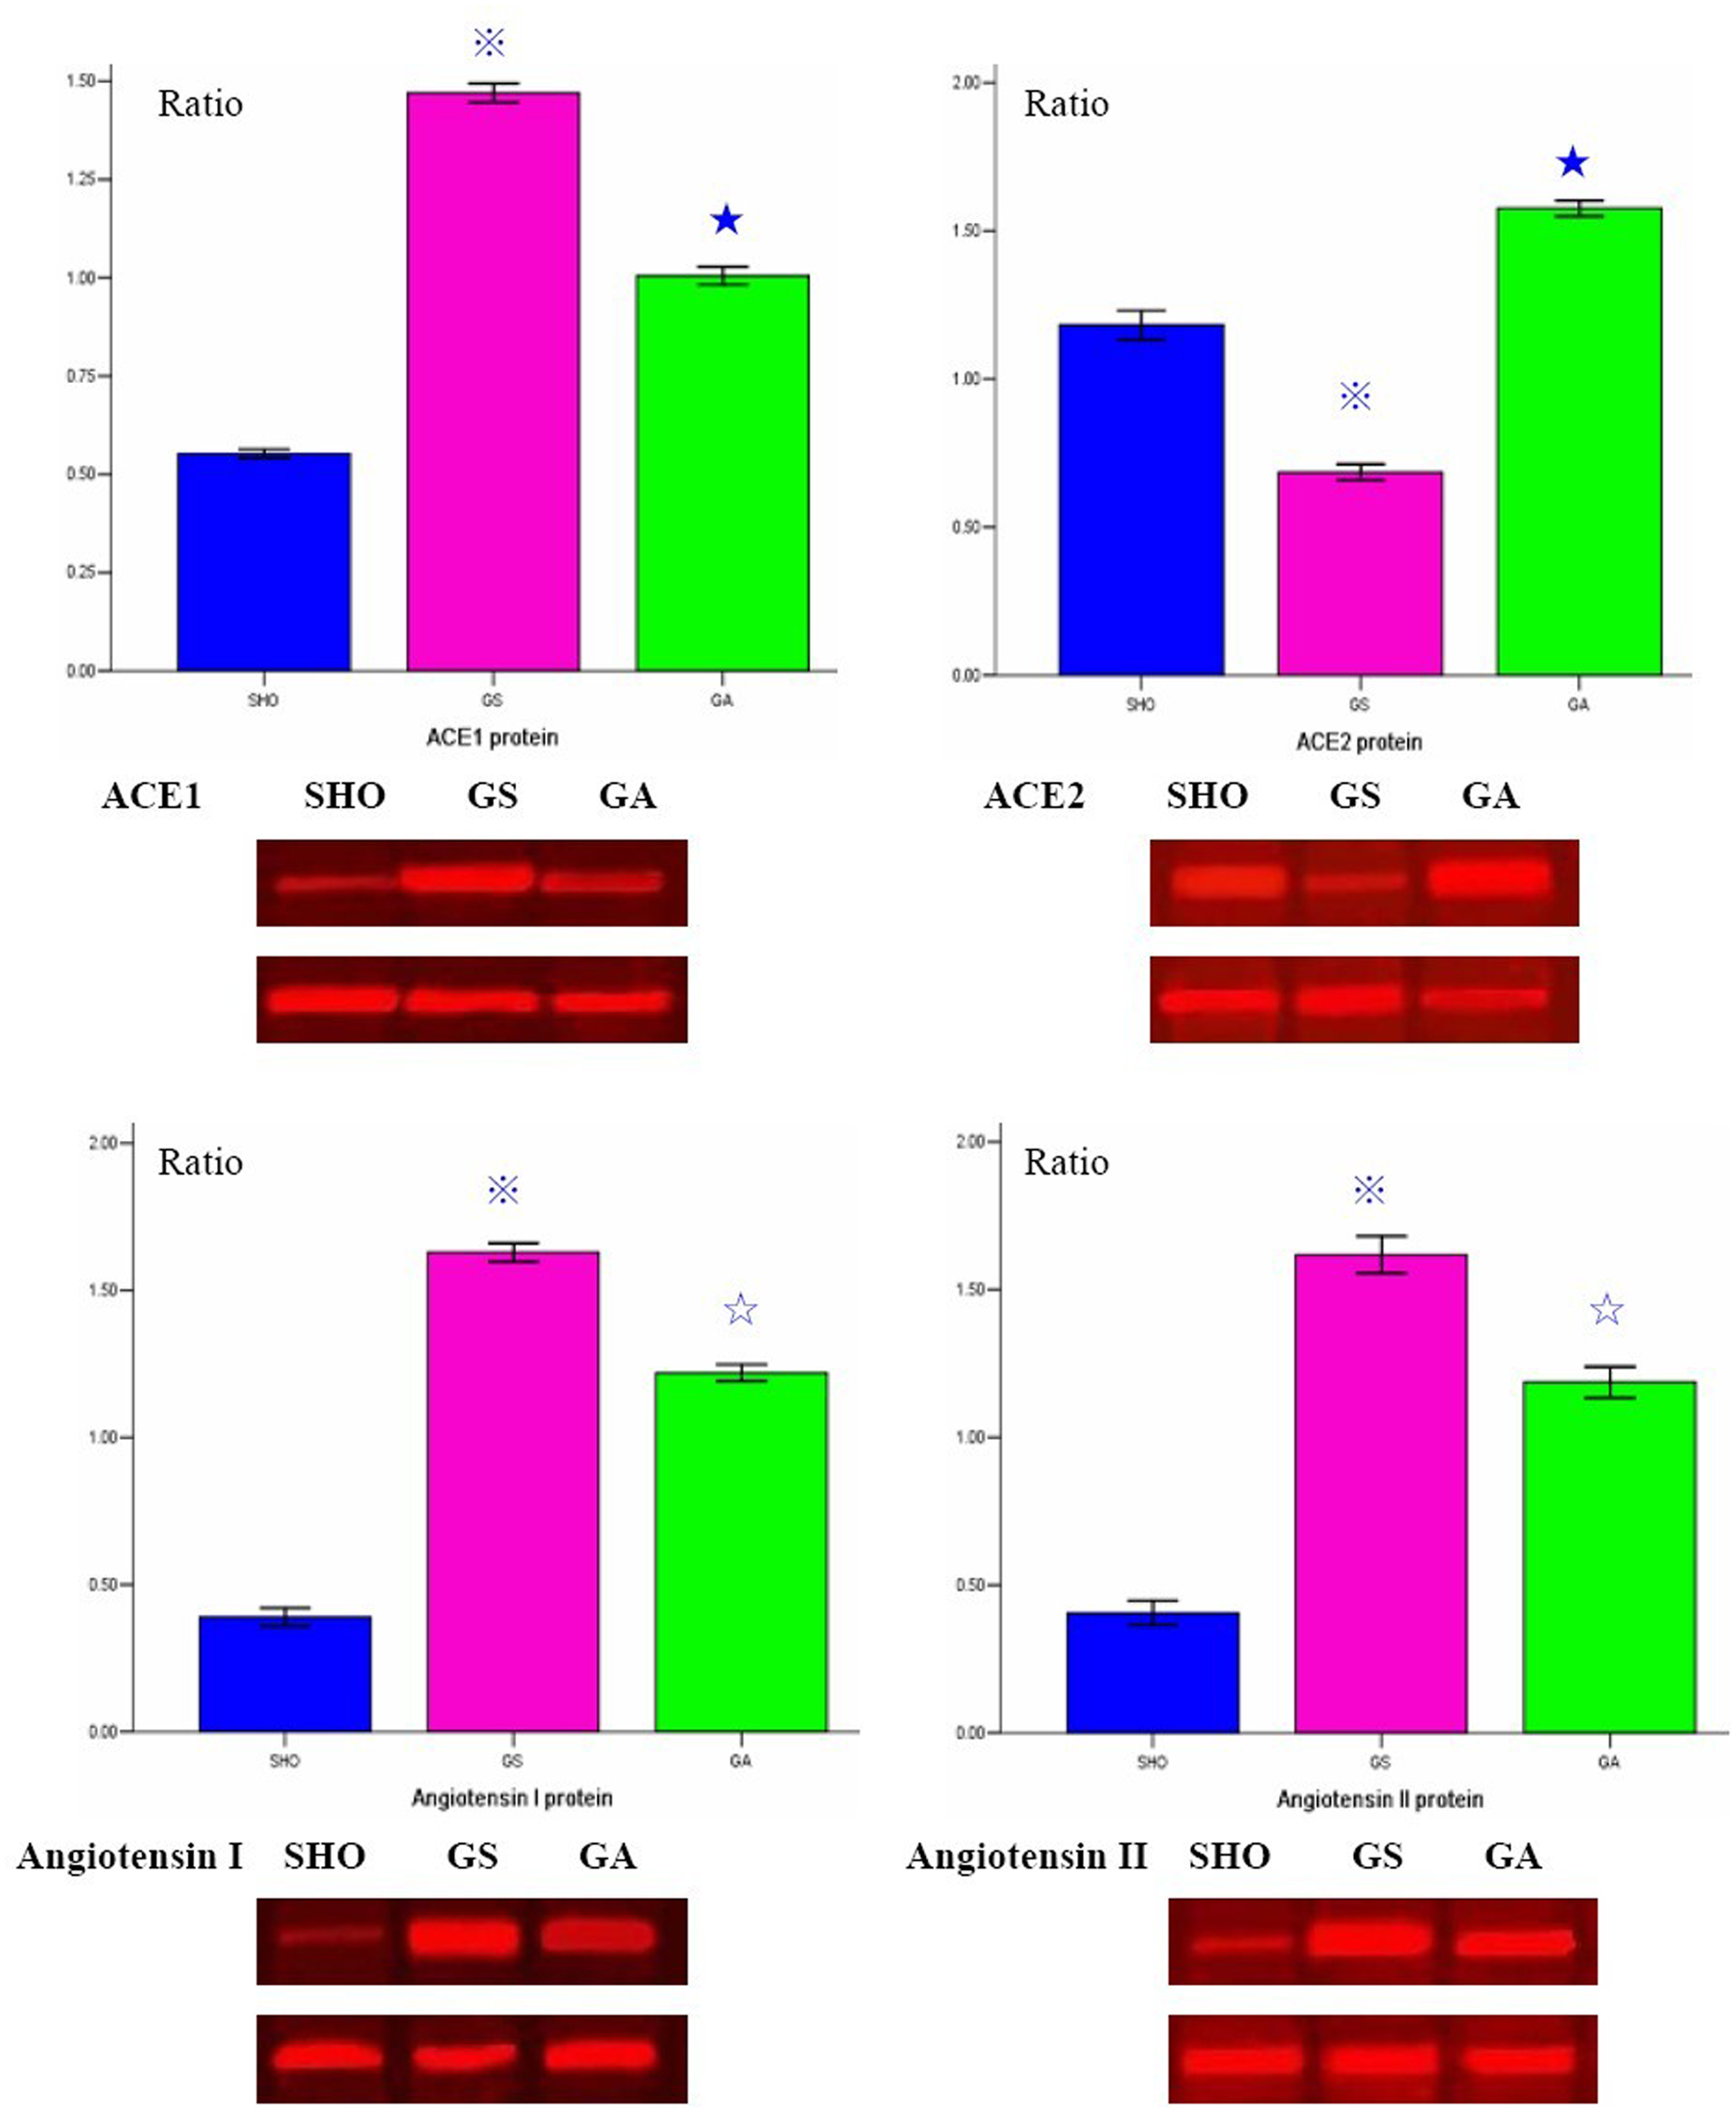
Statistical parameters of levels of protein expression of ACE1, ACE2, angiotensin I and angiotensin II, and the western blot figures in three groups. ★: p<0.01 compared with the SHO group, ※: p<0.01 compared with the GS group, ✰: p<0.05 compared with the GS group. SHO: sham operation group; GS: glomerulosclerosis model group without treatment; GA: GS model group treated with ATRA.
Correlation analysis
Correlation analysis between angiotensin I, ACE1, ACE2 or angiotensin II and GSI, Col-IV or FN was performed in our study. Significantly positive correlation was observed between angiotensin I and GSI, Col-IV or FN (r=0.721, r=0.863, r= 0.887; each p<0.01). There was a positive correlation between ACE1 protein and GSI, Col-IV, or FN (r=0.821, r=0.857, r=0.803; each p<0.01). Furthermore, angiotensin II was positive correlated with GSI, Col-IV, or FN (r=0.798, r=0.823, r=0.855; each p<0.01). Interestingly, there was a negative correlation between ACE2 protein and GSI, Col-IV, or FN (r=–0.916, r=–0.825, r=–0.843; each p<0.01).
Discussion
Pathological change in GS is similar to that seen in micrangium lesions. Accumulations of FN and Col-IV are the important indicators in evaluating the grade of glomerulosclerotic lesions in the progression of GS. In our study, we found that the GSI and the levels of protein expression of Col-IV and FN in glomerulus in GS rats were increased when compared with those in the SHO group. This indicated that the GS model in our study was successfully established. Furthermore, the GSI and the levels of protein expression of Col-IV and FN in glomerulus in the GA group were reduced when compared with those in the GS group. ATRA could reduce the accumulation of ECM and alleviate the GS lesion. These results are similar to those reported elsewhere.15,16
Activation of the RAAS contributes to the pathogenesis and progression of renal diseases. ACE1, a key enzyme of the RAAS, can convert the inactive angiotensin I into the vasoactive and aldosterone-stimulating peptide angiotensin II. 17 Angiotensin II is the major effect messenger of the RAAS and exhibits a wide range of responses, such as inducing the accumulation and deposition of collagen.18,19 ACE2, a homolog to the carboxypeptidase ACE1, is able to convert angiotensin II to a peptide with opposing effects, angiotensin-(1-7). 20 Increased ACE1 and angiotensin II levels are a risk factor for renal diseases, and ACE2 is a protective factor against renal diseases.
In this study, we first reported the expression of angiotensin I, ACE1, ACE2 and angiotensin II in GS rats, induced by ADR. We found that the levels of angiotensin I, ACE1 and angiotensin II in the GS group were notably increased when compared with those in the SHO group. Interestingly, expression of ACE2 in the GS group was down-regulated when compared with that in the SHO group. There was a positive correlation between angiotensin I, ACE1 or angiotensin II and GSI, Col-IV, or FN. Furthermore, there was a negative correlation between the ACE2 protein and GSI, Col-IV, or FN. We speculated that the mechanism of GS morbidity was as follows: ACE1 was activated in GS rats induced by ADR. As a result, the increased ACE1 degraded more angiotensin I and up-regulated the level of angiotensin II. However, the activation of ACE2 was impaired and angiotensin II accumulated in the kidney. This increased angiotensin II could induce the progression of GS. ACE2 might be a protective gene against GS lesion in our study. However, the detailed mechanism remains to be elucidated in the future.
In recent years, there have been some studies reporting the role of ACE2 in the pathogenesis of GS. Oudit et al. 21 found that deletion of the ACE2 gene led to the development of angiotensin II-dependent glomerular injury in male mice. Ji et al. 22 also found that the activity of ACE2 was reduced in the renal cortex in renal wrap hypertension rats, and was associated with GS lesions. Leehey et al. 23 found that the level of glomerular angiotensin II was increased significantly in streptozotocin diabetic rats compared with non-diabetic control rats, accompanied by a reduction in ACE2 activity. The results from these studies were similar to our findings. Thus, ACE2 may be a gene protective against GS lesions.
In our previous reports, 5 we found that ATRA could alleviate GS lesions induced by ADR in rats. We also found that ATRA could achieve a similar effect to a RAAS inhibitor to prevent the progression of GS lesions in GS rats. 9 There is increasing evidence that ATRA influences gene expression of components of the RAAS. 24 In this study, we found that ATRA could up-regulate the expression of ACE2 and could inhibit the expression of angiotensin I, ACE1 and angiotensin II. Zulli et al. 25 found that ATRA could stimulate ACE2 expression in rabbit atherosclerotic plaques. Zhong et al. 24 found that chronic ATRA treatment increased the gene and protein expression of ACE2, resulting in the reduction of blood pressure and the attenuation of myocardial damage in spontaneously hypertensive rats. ATRA was associated with the up-regulated expression of ACE2, and this conclusion was similar to our findings in GS rats.
We also widely reviewed reports about the association of ATRA treatment and the expression of angiotensin I, ACE1 and angiotensin II. There was no study reporting the relationship between ATRA treatment and angiotensin I expression. There were few reports studying the association of ATRA with ACE1 expression. Interestingly, there were some studies reporting the association of ATRA treatment with angiotensin II expression. Choudhary et al. 26 reported that the pressure overload-induced production of angiotensin II was inhibited by retinoic acid via up-regulation of ACE2 expression in the development of cardiac remodeling in a pressure overload rat model. They also first reported the evidence that ATRA prevented angiotensin II- and stretched-induced apoptosis. 27 He et al. 28 found that ATRA inhibited the angiotensin II-induced increase in cell growth and collagen secretion in neonatal rats with cardiac fibroblasts. Haxsen et al. 29 reported that ATRA could inhibit the actions of angiotensin II on vascular smooth muscle cells. The results on the association of ATRA treatment with angiotensin II expression from the abovementioned reports are similar to our findings. The conclusions reached in our study may be robust to some extent.
ATRA exerts its biological effect by high-affinity binding to retinoic acid receptors (RARs), which consist of three isoforms – RARα, RARβ and RARγ30,31 – the distribution of which may vary in different cells and tissues. 30 Podocyte injury can result in the onset of GS. He et al. 32 performed an interesting study to explore whether ATRA could reverse the effects of HIV-1 infection in podocytes, and found that ATRA reversed the abnormal phenotype in HIV-1-infected podocytes by stimulating RARα-mediated intracellular cAMP production. ATRA may regulate the expression of angiotensin I, ACE1, ACE2 and angiotensin II by stimulating the RARα signaling pathway; more studies should be conducted to confirm this.
There were some limitations to our study. For example, the question of whether there was a difference of blood pressure among SHO rats, GS rats and GA rats should be investigated in the future. Furthermore, cell culture to explore the effect of ATRA on the expression of angiotensin I, ACE1, ACE2 and angiotensin II should be performed in vitro in future studies.
There were also limitations in using histochemistry and western blot for analysis of angiotensin I and II. In our study, the antibody for angiotensin I / angiotensin II was polyclonal, and there may be non-specific staining, especially in the histochemical analysis. This might affect the protein expression results for angiotensin I / angiotensin II. Interestingly, our results for mRNA expression of angiotensin I and angiotensin II were similar to the protein expression of angiotensin I and angiotensin II. The results for protein expression of angiotensin I and angiotensin II may therefore be robust to some extent. However, further studies should be performed in the future.
In conclusion, we found that ATRA treatment was associated with an increased level of ACE2 and reduced expression of angiotensin I, ACE1 and angiotensin II. However, its detailed mechanism still needs to be elucidated.
Footnotes
Acknowledgements
The authors would like to gratefully acknowledge the most helpful comments on this paper received from Professor Liang Rong, Department of Pediatric-Neonatology, Baylor College of Medicine, Houston, Texas, USA.
Conflict of interest
The authors have declared that no competing interests.
Funding
This study was supported by the Nature Science Foundation of China (No. 81150017), the Natural Science Foundation of the Guangxi Zhuang Autonomous Region (No: 0640103) and the Education Department of Guangxi Zhuang Autonomous Region (No: 0810).