
Abstract
Flexible and rigid polyurethane foams are used in applications subjected to impact loads. Integrating a three-dimensional, continuous fibre reinforcement meets high requirements for stiffness and strength. A fundamental comparison of the impact compressive properties was carried out for contributing to a reasonable choice between these variants. A rigid and flexible foam with a bulk density of 85 kg/m3 each was investigated with and without reinforcement by a warp-knitted spacer fabric. The material testing was conducted using a drop weight tester in accordance with a German standard. Three impacts are applied by a hammer with a flat surface larger than the area of the sample plate. Different impact energies were investigated and the deformation behaviour was analysed using a high-speed camera. Much higher energy absorptions at low deformations were found with rigid foam. Peak stresses and decelerations were lower with flexible foam if the load did not densify the material. Reinforcing the foams leads to an anisotropic deformation and improves the impact compressive properties, especially in the case of the flexible variant. The four materials analysed had a similar rebound and largely maintained their performance when subjected to the repeated impact load.
Keywords
Introduction and state of the art
The global output of polyurethane (PUR) foam is currently around 19 million tons per year.1,2 The advantages in the application are the simple production of complex geometries, the low bulk density and the excellent thermal insulation as well as energy absorption. 2 Different types of this plastic offer a wide range of mechanical properties. 3 However, reinforcements are necessary in the case of structural applications to meet the requirement of high stiffness and strength. Spacer fabrics are used for example for this purpose. These textiles can consist of two warp-knitted fabric surfaces that are kept at a defined distance by spacer threads. 4 Their continuous manufacturing process using double-bar warp knitting machines is highly productive and therefore suitable for meeting industrial demands. 5 Resulting semi-finished products have a width up to 3.5 m and a thickness up to 60 mm. 6 Draping and thus adapting to complex shapes is easily possible. 5 The integration into a foam results in a three-dimensional (3D), continuous fibre-reinforced porous matrix. These composites are manufactured in structural reaction injection moulding (SRIM). 7 The research group responsible for this paper is working on this topic. Proof has been provided of the reinforcing effect of warp-knitted spacer fabrics on the quasi-static mechanical and fatigue characteristics of flexible and rigid PUR foams.8,9 Scientific studies on corresponding composites were also carried out by a research group from the Inner Mongolia University of Technology (Hohhot, China). The focus of this research was the optimisation of the textile structure for the targeted adjustment of the quasi-static compressive properties.10,11 Successful examples of the application of 3D continuous fibre-reinforced PUR foams were in the floor assembly of a snow groomer, 12 a car seat 13 and a pavilion. 14 Materials of such lightweight constructions should simultaneously meet quasi-static mechanical, fatigue, ballistic and impact requirements to guarantee safety. 15
The behaviour of the described composites when subjected to impact compressive loading was therefore investigated. Findings are presented in this paper. Dissipation of the energy is the most important property of a material in this context. 16 Only a minimum of stress should additionally be transmitted, because damage is directly caused by this. 17 The peak deceleration quantifies the change in velocity when objects collide and describes consequently the risk for accidental injuries. 18 Better characteristics in this regard are offered by porous compared to compact materials. 15 This is based on the dissipation of kinetic energy through bending, buckling, plastic collapse and fracture of cell walls. 19 PUR foams in particular are established for this purpose in the transport sector, 20 vehicle construction 21 and protective equipment. 22
Some scientific investigations into the impact compressive properties also exist. Sims and Bennett studied the cushioning performance of a PUR flexible foam with a bulk density of 27 kg/m3. 23 Twenty impacts of 10.4 J were applied to plates with a thickness of 50 mm and an area of 150 × 150 mm2. It was demonstrated that the peak deceleration after the third impact was constant at 11.4 g, which proved the load capacity for several times. Basit and Cheon proved the increasing energy absorption with increasing bulk density. 24 Cylindrical samples with a diameter of 42 mm and a height of 40 mm were subjected to a load of 100 J. The PUR rigid foam absorbed 30% in the case of 67 kg/m3 and 40% in the case of 89 kg/m3. The increasing energy absorption below room temperature was shown by Hwang et al. 17 Cubes with a volume of 50 × 50 × 25 mm3 and a bulk density of 90 kg/m3 were stressed with 110 J for this purpose. Around 27% at 25 °C and 81% at −163 °C were absorbed. Linul et al. provided additional evidence of the decreasing performance of PUR rigid foam above room temperature. 25 This was achieved by compressing cubes with bulk densities between 100 kg/m3 and 300 kg/m3 and a volume of 15 × 15 × 15 mm3 at a speed of 2.77 m/s. The compressive modulus was reduced by up to 85% and the plateau stress by up to 75% when comparing 20 °C and 110 °C. The influence of load velocity was investigated by Mane et al. 26 A PUR rigid foam with a bulk density of 288 kg/m3 was characterised in a comparable quasi-static and impact test. The energy absorption determined for the faster load was 50% higher. Studies have also been published about the impact compressive properties of fibre-reinforced foams. Kim et al. examined a PUR rigid foam with a bulk density of 120 kg/m3 containing 20 wt.% short glass fibres. 27 Cubes with a volume of 50 × 50 × 50 mm3 were each subjected to 80 loads. The critical impact energy was found to be in the range between 1092 J/m2 and 1228 J/m2. There was no significant decrease in performance below this. Proof was provided in this way that short-fibre-reinforced rigid foams can be subjected to repeated impacts up to a certain level. The effect of crack propagation through short glass fibres in PUR foams subjected to impact compressive loading was found by Yu et al. 28 Chen et al. used six warp-knitted spacer fabrics with different textile structure for the reinforcement of a PUR flexible foam with a bulk density of 150 kg/m3. 29 The drop hammer had a diameter of 25 mm and applied 15 J, which was absorbed by the composites up to about 85%. It was concluded that denser fabric surfaces and finer spacer threads with a larger angle of inclination lead to better impact performance.
The content of this paper are investigations that enable a scientifically correct comparison of the impact compressive properties of 3D continuous fibre-reinforced and unreinforced PUR flexible and rigid foams. Repeated loading was considered allowing the evaluation of reusability after impact. The findings allow a selection from these four material variants for applications in line with the requirements.
Experimental work
Materials
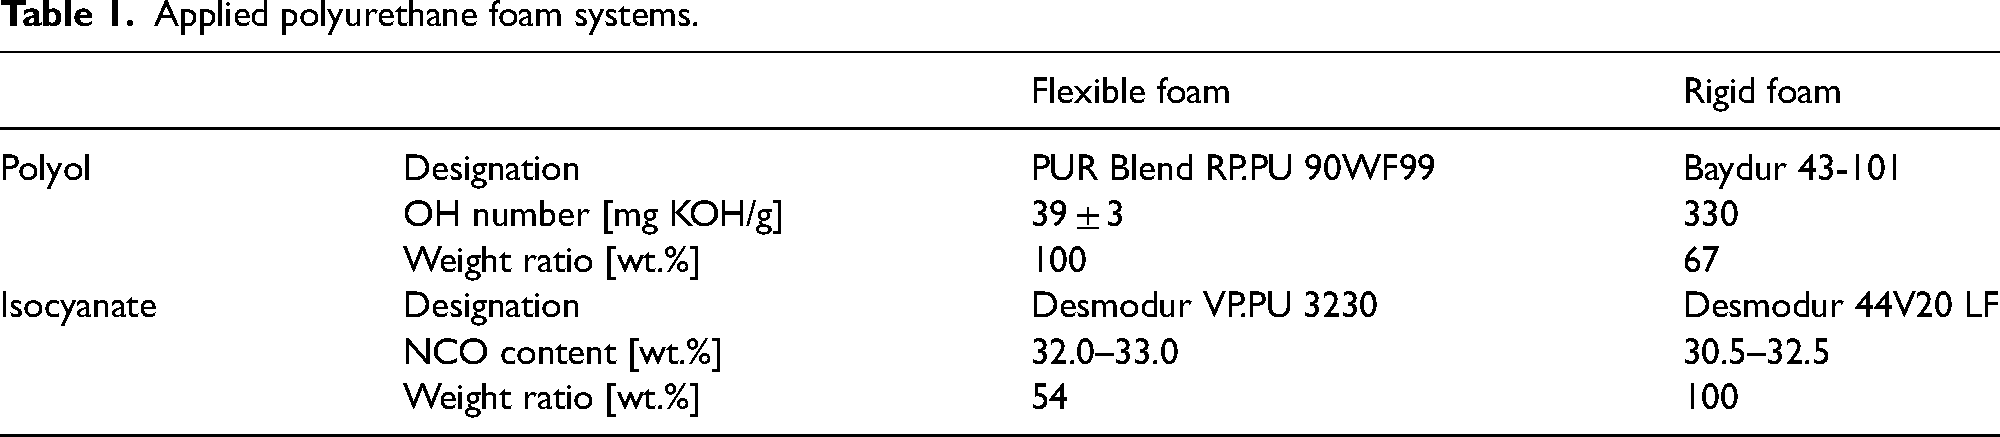
PUR foams can have flexible or rigid characteristics. Resulting impact compressive properties are contrasted in this investigation. The known influence of bulk density was not examined. 30 This parameter was kept constant. The two cold foam systems from Covestro AG (Leverkusen, Germany) listed in Table 1 were used for these reasons. They create an open-cell flexible foam and a closed-cell rigid foam with a free foam density of 40 kg/m3 each. Both systems consist of an aromatic polyisocyanate and a mixture of polyether polyol with all necessary additives for the polyaddition reaction and the formation of carbon dioxide (CO2). The processing time of the flexible foam system is shorter compared to the rigid foam system. The start time is 5 s in contrast to 40 s and the tack-free time is 4 min in contrast to 15 min. The quasi-static compressive characteristics (EC … compression modulus, CCXX … stress at XX% compression) of the resulting flexible foam (EC = 160 kPa, CC10 = 5 kPa, CC40 = 8 kPa) are considerably lower compared to the resulting rigid foam (EC = 10 MPa, CC10 = 500 kPa, CC40 = 650 kPa). 31
Applied polyurethane foam systems.
A spacer fabric by Spiga GmbH (Flöha, Germany) with the designation SAA 40 N was used to reinforce the PUR foams (Figure 1). It is a typical, industrially available variant. This was the reason for the selection. The resulting scientific findings are therefore highly relevant for applications. It consists of polyester fibres and was provided as a semi-finished product with a length of 1.15 m, a width of 0.48 m and a thickness of 40 mm. The two warp-knitted surfaces are made of multifilaments (192 individual filaments with a diameter of 18 μm) as fillets with a tricot lapping. The design results in a macroscopic surface porosity of 8% and a stitch density of 260/in2. The spacer threads are monofilaments with a diameter of 200 μm. They have an “IXI” course between the two warp-knitted surfaces and connect them in this way with the large quantity of 520/in2. This justifies the great potential as a reinforcement structure, although the fibre volume content is only about 4%. The quasi-static compressive properties of the flexible foam (EC = 1100 kPa, CC10 = 13 kPa, CC40 = 38 kPa) and the rigid foam (EC = 30 MPa, CC10 = 700 kPa, CC40 = 1000 kPa) increase greatly by integrating the spacer fabric as reinforcement. 31 The composites have already been applied in the examples described in the introduction.
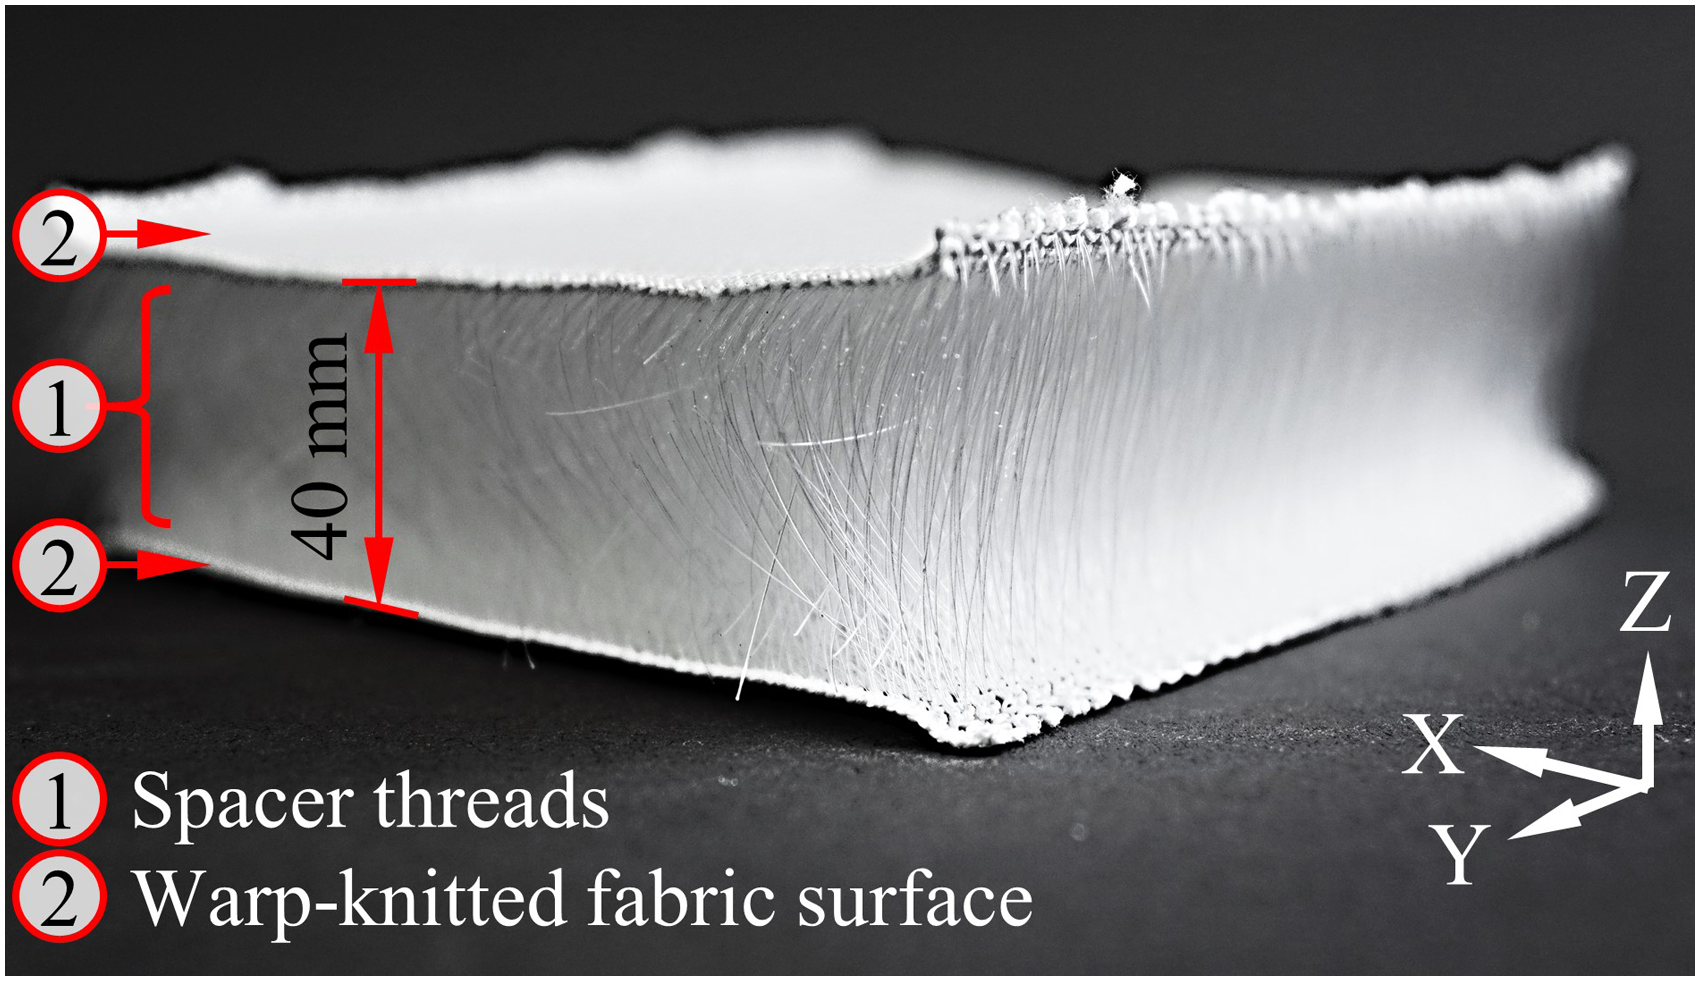
Spacer fabric used for reinforcement.
Manufacturing process
The PUR foams with integrated spacer fabric were manufactured in the SRIM. A moulding tool made of the aluminium alloy AlMg4.5Mn was used for this (Figure 2(a)). The cavity had an area of 150 mm by 150 mm and a thickness of 40 mm. Samples of these dimensions are suitable for the conducted mechanical test. An integrated electrical system heated the moulding tool to 50 °C. The cavity was treated with the release agent MP-4066 by Münch Chemie International GmbH (Weinheim, Germany) before each manufacturing cycle. Cutting the spacer fabric with the USM-G electric circular knife by Hoogs Cutting Systems GmbH & Co. KG (Bonn, Germany) to the area dimensions of the cavity allowed the insertion. The low-pressure machine M8/2 by Mahr Unipre GmbH (Werl, Germany) was used for the mixing of the components of the PUR foam systems and the subsequent injection into the closed moulding tool. The expansion of the foam in the cavity results in the impregnation of the spacer fabric, which takes place gradually through the polyaddition reaction and the arising blowing agent CO2 (Figure 2(b)). Fixing the textile was therefore not necessary. A mechanically loadable adhesion is formed subsequently between the PUR foam and the polyethylene terephthalate (PET) fibres. 32 At least 85 g of PUR reaction mass was required to fill the cavity reproducibly complete with both foam systems. This quantity was used to manufacture the samples, which consequently have the lowest possible bulk density. The tack-free time of the foam systems defined the demoulding time. Unreinforced reference foams were manufactured by omitting the spacer fabric in the described process. Parameters were not adjusted for this purpose. A total of 100 samples were manufactured, including 25 each of the reinforced and unreinforced flexible and rigid PUR foam.
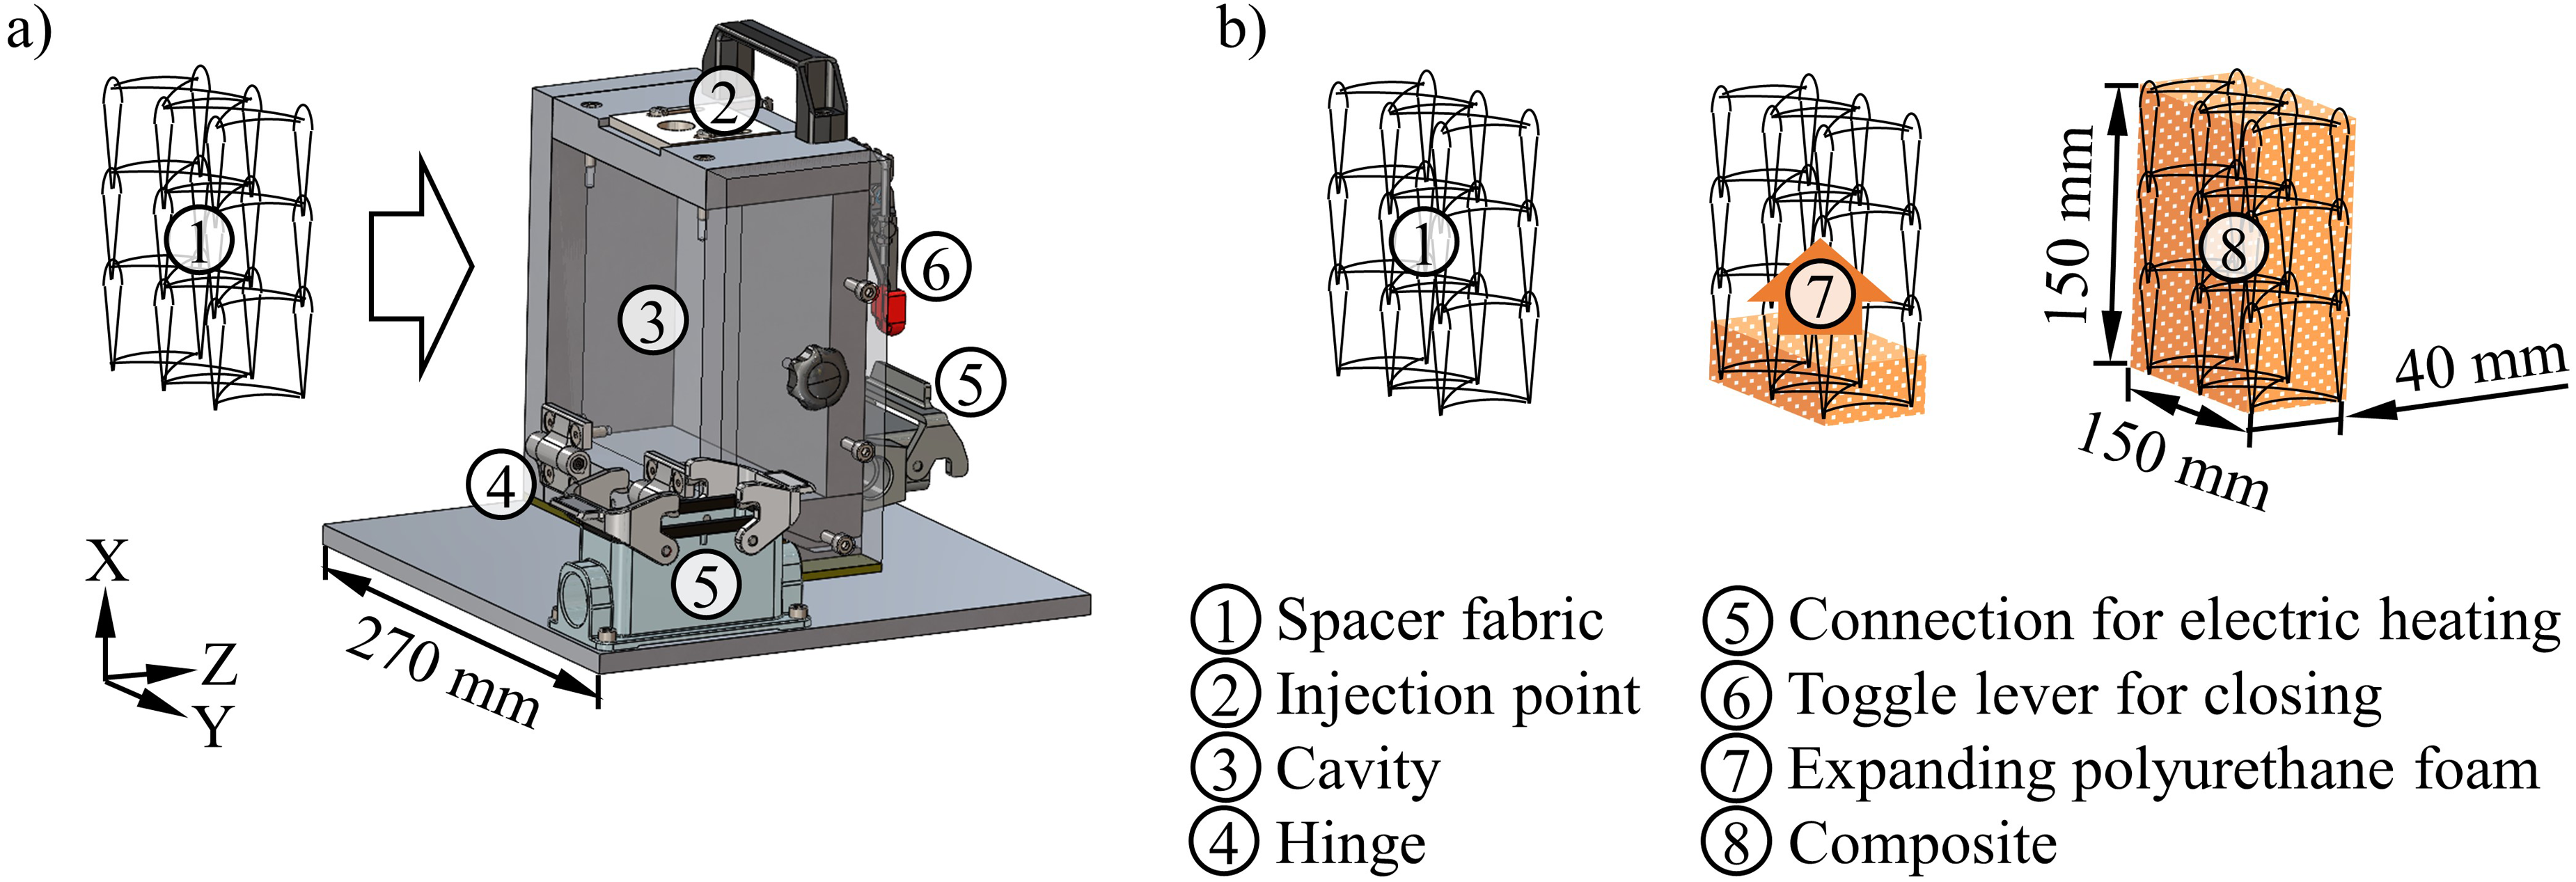
(a) Computer-aided design of the tool for the impregnation of the spacer fabric and (b) scheme of the expansion of a polyurethane foam to manufacture a composite.
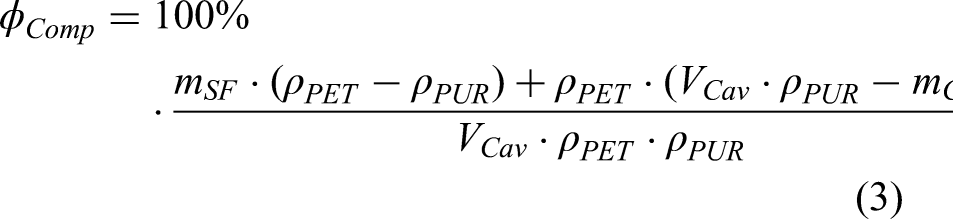
The masses of the spacer fabric
Mass, bulk density and porosity of the spacer fabric, reference foams and composites.
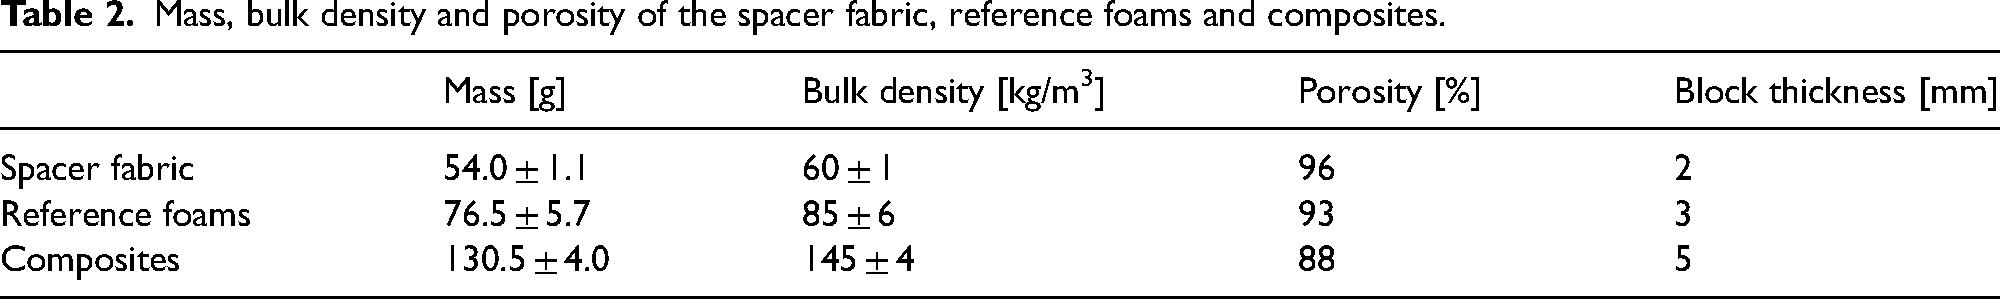
The porosity and block thickness of the investigated materials are crucial for the analysis of their deformation behaviour and the determination of the range for evaluating the energy absorption in the compressive impact test (Table 2). Equation (1) was applied to calculate the porosity of the spacer fabric 

Mechanical testing
The impact compressive properties of the reinforced and unreinforced flexible and rigid PUR foam were examined using the drop weight tester Amsler HIT 2000F by ZwickRoell GmbH & Co. KG (89079 Ulm, Germany) (Figure 3). The procedure was carried out in accordance with the German standard DIN EN ISO 4651. The principle is the meeting of the flat surfaces of a drop hammer (160 mm × 160 mm) and a sample (150 mm × 150 mm). This is shown in the Figures 4 and 5. Three impacts are applied in this way at an interval of 60 ± 15 s. Force and velocity are measured. The characterisation of each material should be carried out with the two drop heights of 0.25 m (2.22 m/s) as well as of 0.75 m (3.84 m/s) and at least two weights in both cases. Recommended is the range between 1.2 kg and 34.4 kg. Four test configurations were defined by this and in consideration of the quasi-static compressive properties (see section Materials). These were 0.25 m with 17 kg and 32 kg as well as 0.75 m with 21 kg and 26 kg, which corresponds to the impact energies 42 J, 78 J, 154 J and 190 J. Variations were determined by testing six samples for each material and test configuration. A total of 96 measurements were accordingly carried out, which included all three impacts. The spacer fabric on its own was additionally tested with 42 J. The impact energy was not increased, as the resistance was already very low. All tests were filmed with the high-speed camera Fastcam Mini UX100 by Photron Ltd (Tokyo, Japan), which was assisted by two spotlights of the type Videolight 4 by Kaiser Fototechnik GmbH & Co. KG (Buchen, Germany). The stress was analysed as force per sample area and the compression as a percentage value of the sample thickness. A tangent was fitted in the resulting curve at the steepest part of the first 15% compression to determine the compression modulus. The energy absorption of a material corresponds to the area under the measurement curve. But in the case of foams, the phase of densification has to be excluded.17,24,26 The beginning is reflected by a significant increase in stress and starts at a remaining porosity of 18% for the investigated materials (see section Results and discussion). The corresponding compressions were calculated by assuming a linear decrease in porosity between the initial and block thickness. The result was 75% for the unreinforced foams, 70% for the reinforced foams and 78% for the spacer fabric. The values were used as a limit for the determination of the energy absorption. Dividing by the mass of the samples calculates the specific energy absorption (SEA), which is highly relevant for technical applications. 33 The rebound in the impact compressive test was also determined, corresponding to the area under the measurement curve during the elastic recovery of the samples. 17 The typical form of plotting these results is the cushion diagram, showing the results of the three impacts together for the investigated energies. An evaluation of the behaviour of a material under repeated impact compressive loading is possible in this way. The residual plastic deformation was also determined. Comparisons were made for this purpose between the thickness of the samples before the first and five minutes after the third impact. These measurements were carried out using the dial gauge 300.0565 by KS TOOLS Werkzeuge-Maschinen GmbH (Heusenstamm, Germany).
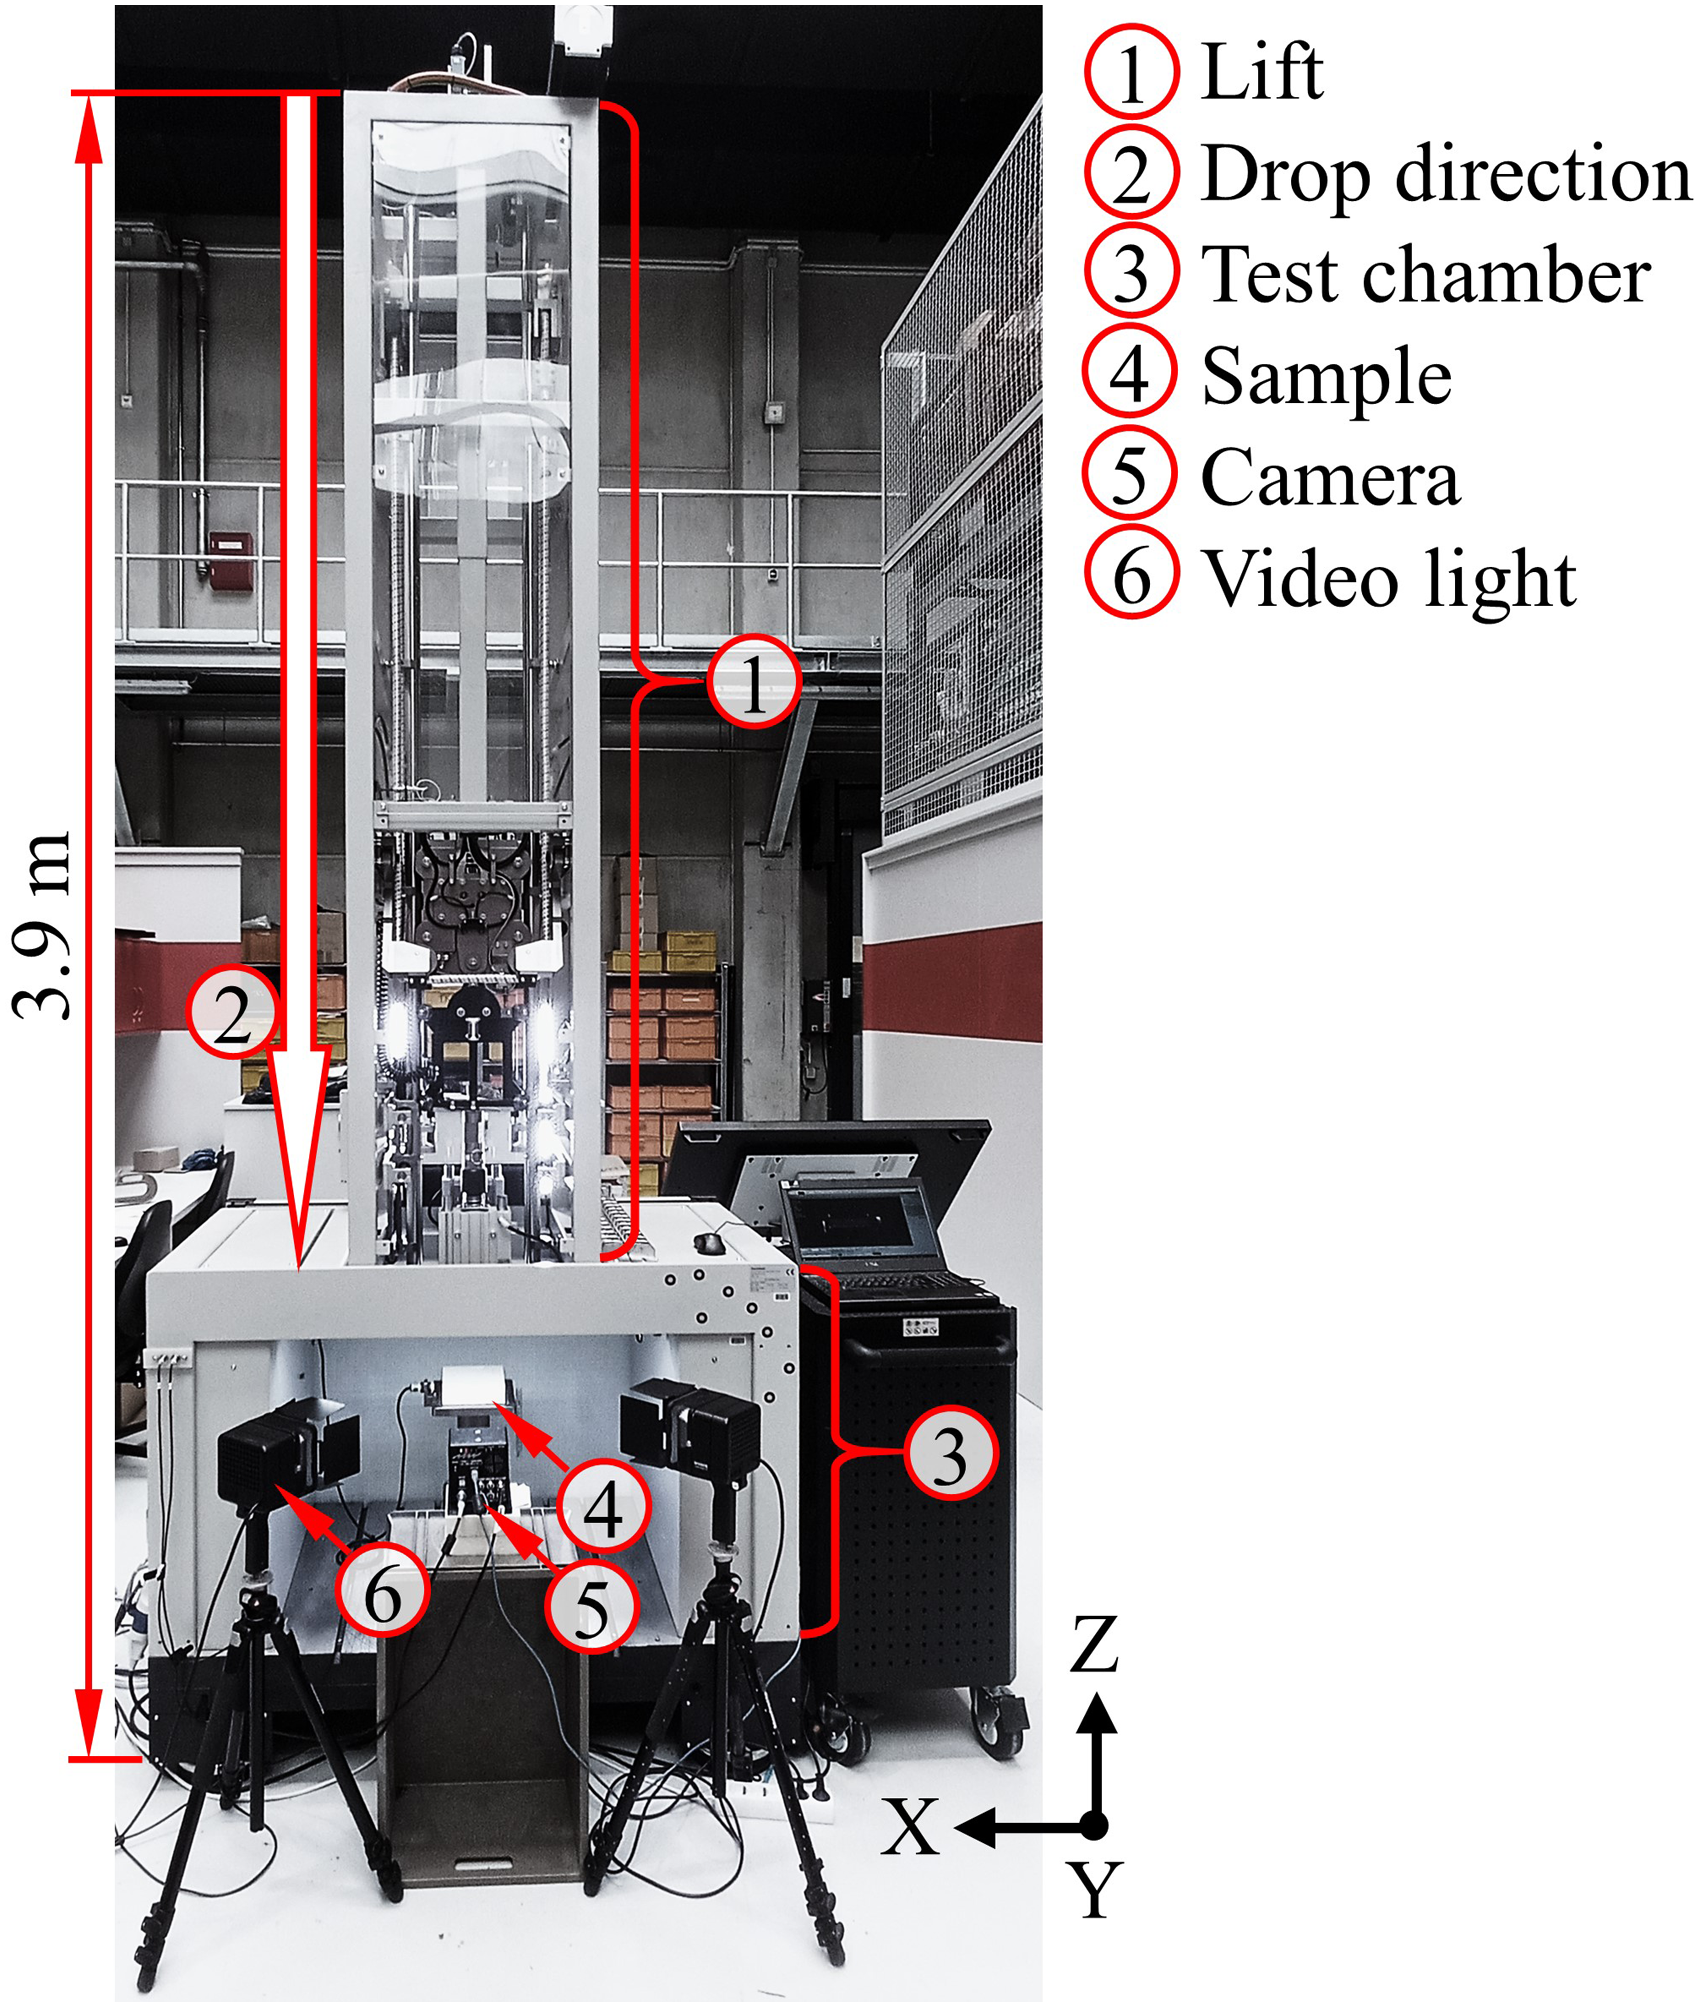
Test setup consisting of drop weight tester and high-speed camera for investigating impact compressive properties.
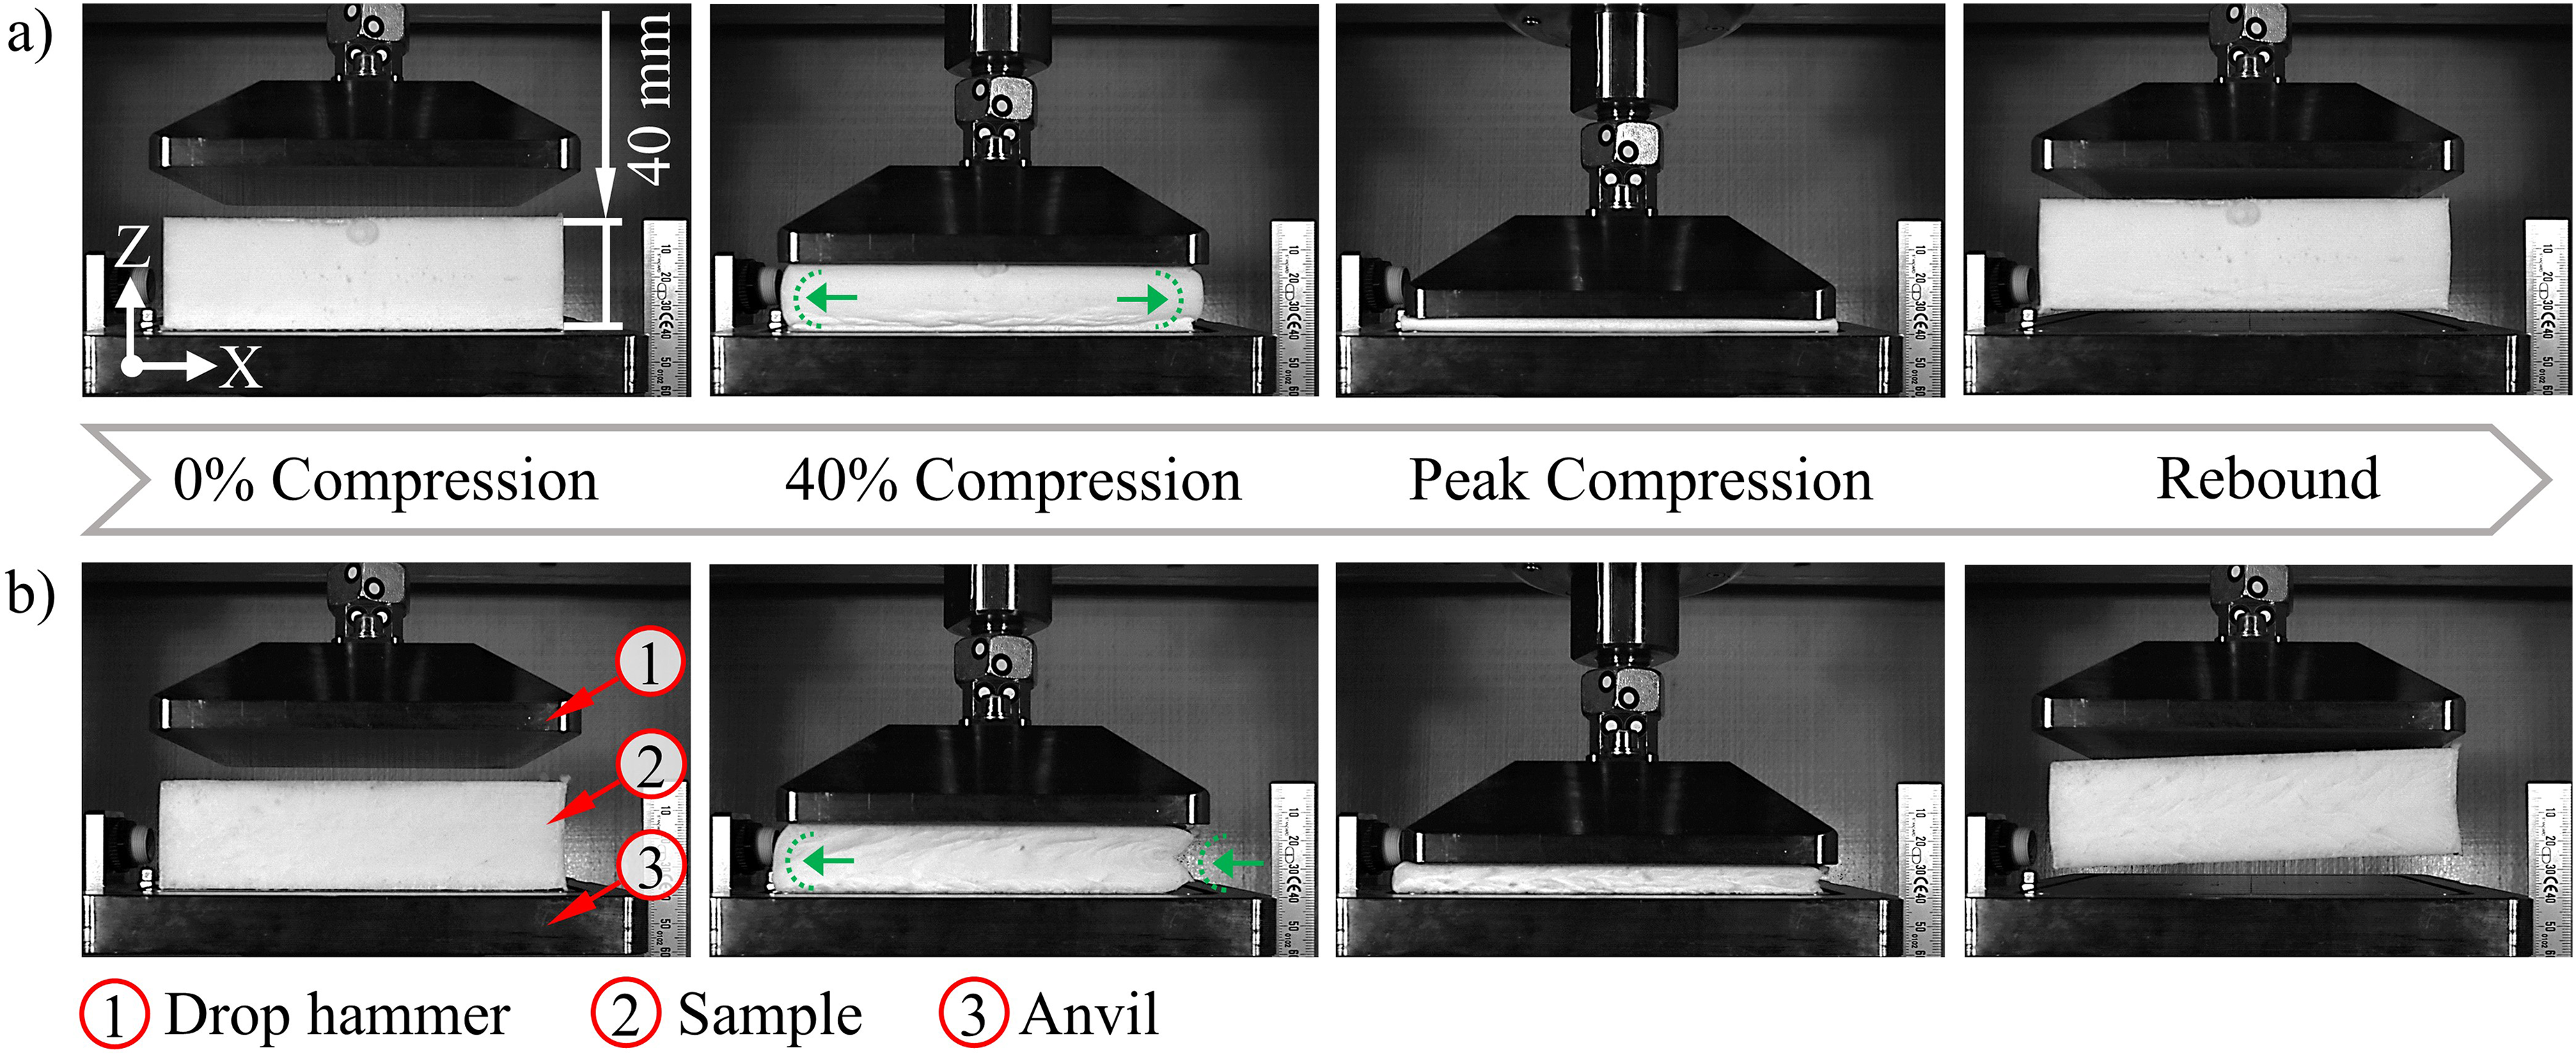
Deformation of the (a) unreinforced and (b) reinforced flexible polyurethane foam at the first impact of the test with 190 J (dotted lines … directions of transverse contraction).
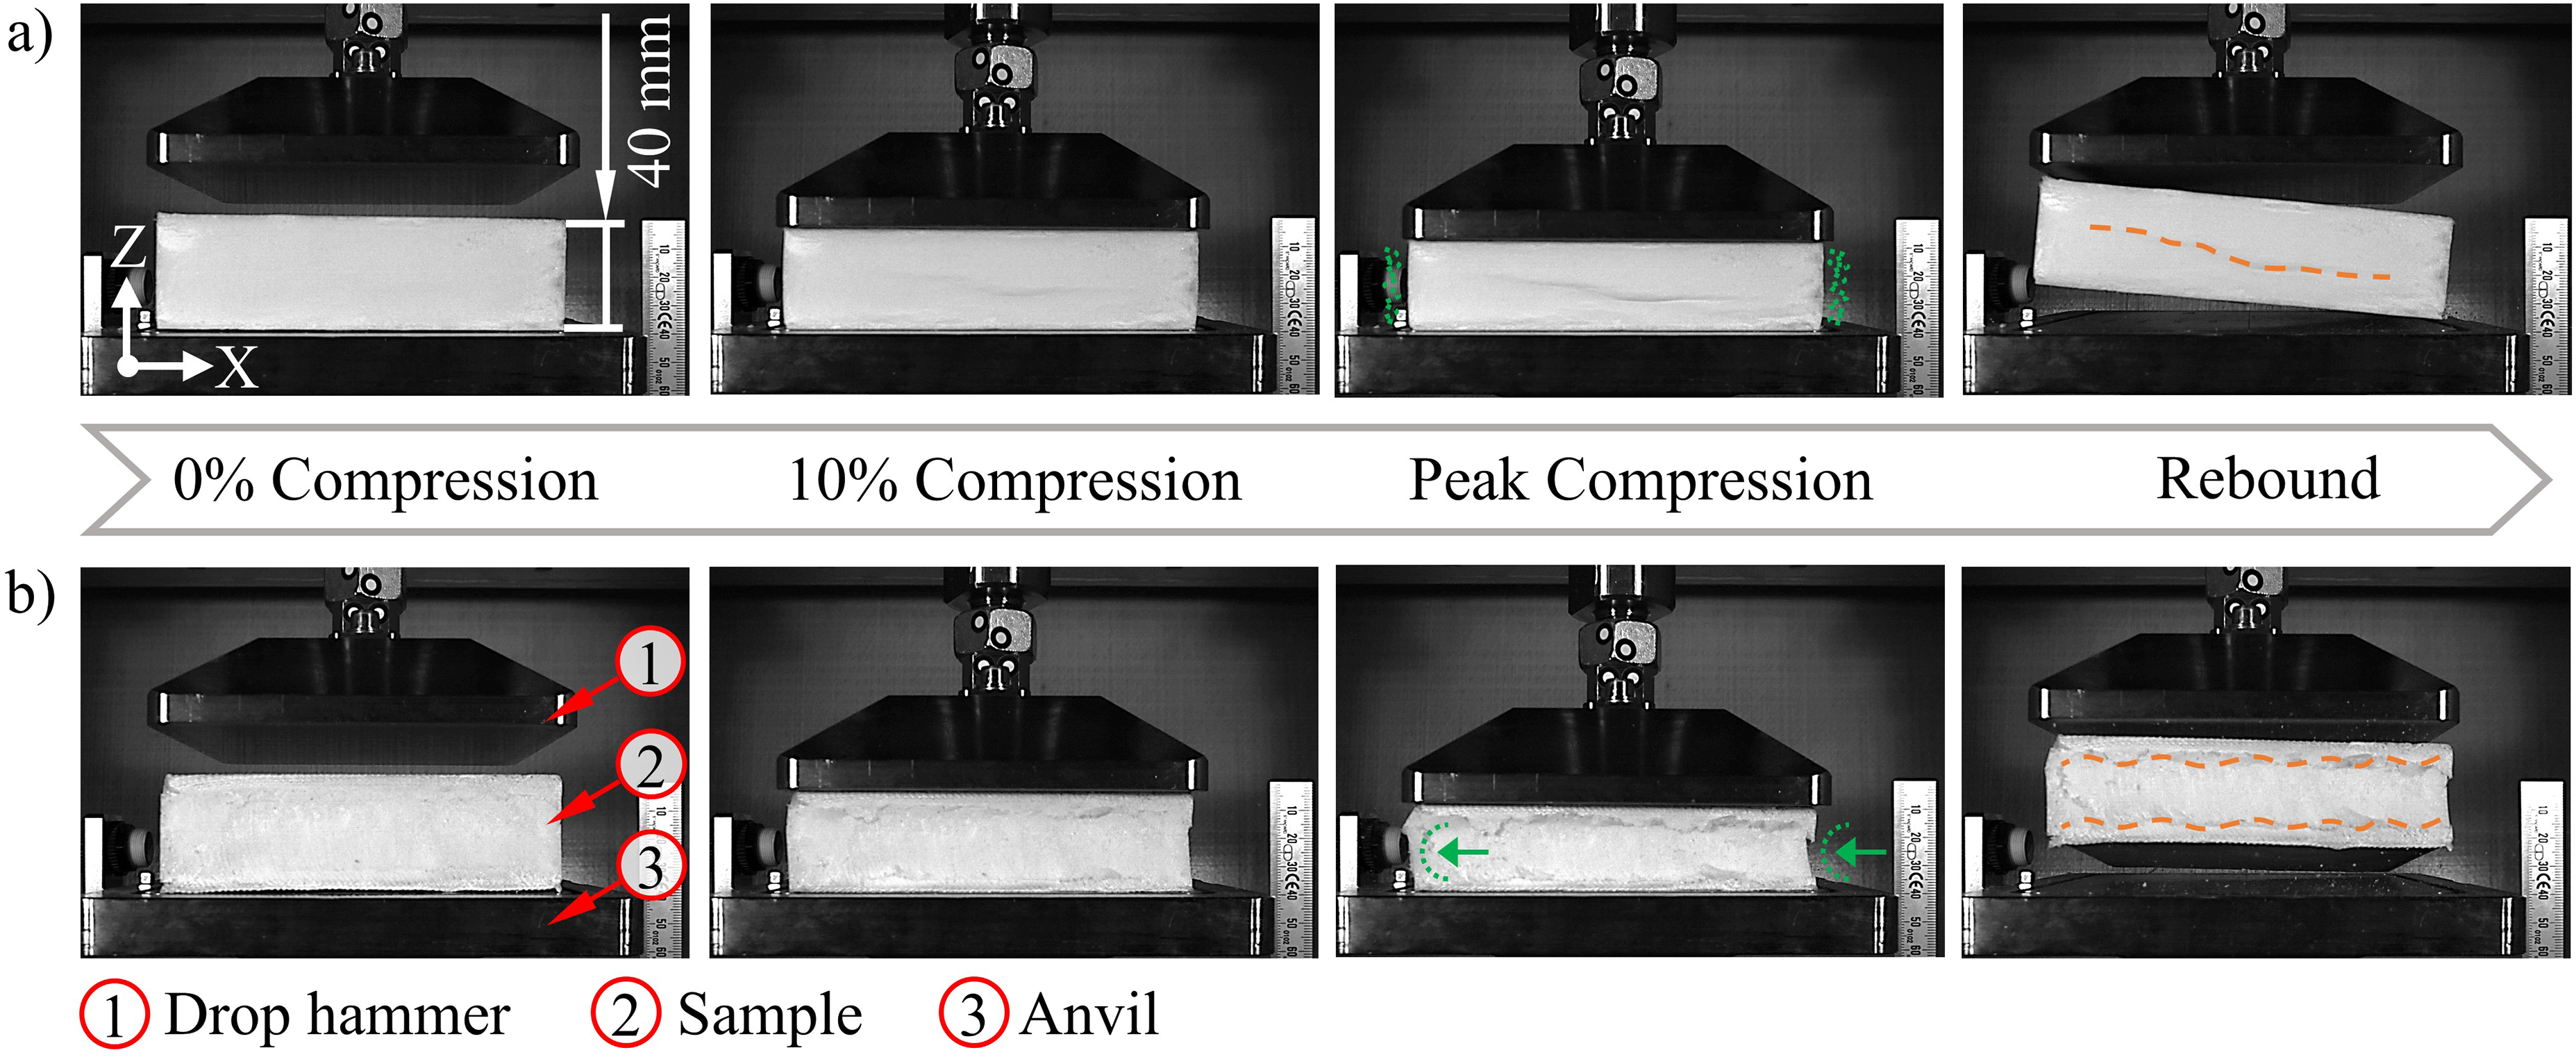
Deformation of the (a) unreinforced and (b) reinforced rigid polyurethane foam at the first impact of the test with 190 J (dotted lines … directions of transverse contraction, dashed lines … failure locations).
Results and discussion
The deformation behaviour was analysed with the high-speed camera. Exemplary videos of tests with the four investigated materials are available by the reference in the Data Availability Statement. The unreinforced PUR foams fail in the weakest row of cells first, which is known for the case of quasi-static compressive loading. 34 The layers nearby subsequently collapse, resulting in the formation of a band front. 27 This continues until the load is dissipated or the block thickness is reached (Figures 4 and 5). Bulging of the outer sides of the unreinforced foams occurs during this process, which can be attributed to escaping air. 23 The flexible variant is completely compacted at the highest impact energy of 190 J, whereas the rigid variant experiences only a noticeable but slight deformation. Both push the drop hammer away afterwards. The flexible foam immediately returns to its original form. The rigid foam shows a remaining deformation in contrast in the area where the first row of cells has failed.
An anisotropic deformation behaviour results from the reinforcement with spacer fabrics (Figures 4 and 5). The outer sides of the two composites bend in one direction according to the spacer threads. Compression takes place subsequently at the highest load of 190 J up to a similar maximum in comparison to the unreinforced foams. Minor differences in the flexible foam result from the different block thicknesses (Table 2). A rebound subsequently also takes place with reinforcement. Complete recovery occurs directly in the case of flexible foam as a matrix. Layers fail at the top and bottom close to the warp-knitted fabric surfaces for the rigid foam. This is based on the sandwich effect. 35 The volume reinforced with spacer threads is the core and mainly absorbs shear loads. The two areas of the warp-knitted fabric surfaces act as facings, which are primarily subjected to tension and compression in their plane. Shear loading caused by the impact vertical to the facings leads to lateral push-out of the centre of the composite, resulting in fractures between the layers.
The residual deformation five minutes after the third impact is constant for the flexible foam for the various impact energies, taking the standard deviation into account (Figure 6). A value of 1.5% is never exceeded. There is no complete recovery because a small proportion of initially closed pores is opened by the test. 23 Complete flexibility is therefore available with and without reinforcement.
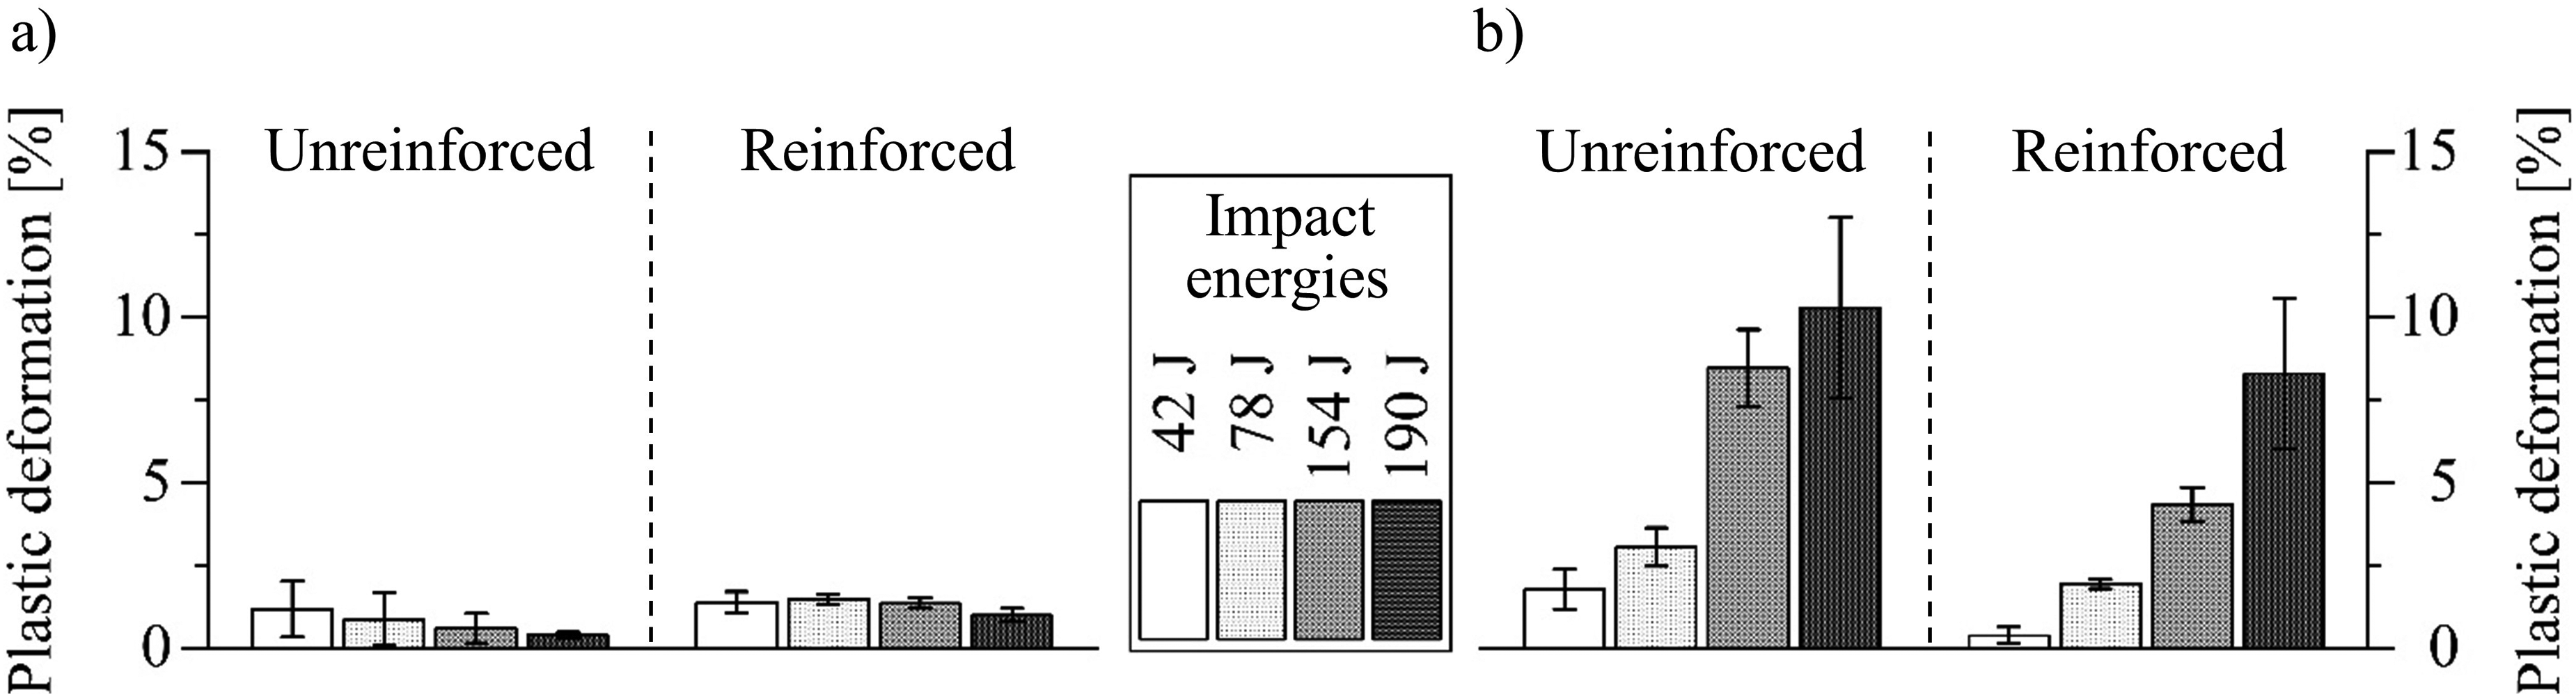
Plastic deformation caused by the three impacts of the test for the (a) flexible and (b) rigid polyurethane foam.
The residual deformation in the case of rigid foam increases in contrast clearly with increasing impact energy. The value in the case of reinforcement is initially at 42 J only 0.4%. This indicates that no damage occurred. Impact loading without lasting consequences is accordingly possible for reinforced rigid foams up to a critical level. Proof has been provided in another investigation. 27 The unreinforced rigid foam exhibits a higher residual deformation for all impact energies investigated. This shows that spacer fabrics reduce the damage level of rigid foam. Adhesion between the fibres and the matrix can therefore not be a weak point. The values at 190 J are slightly above 10% without and just over 8% with reinforcement. This extent indicates destruction of the cell structure, which is expectable at compressions above 5%.19,34 The range of destruction was reached accordingly with the performed test in the case of rigid foam.
Recognisable by stress-strain curves are the three phases of deformation of flexible foams subjected to compressive load. 19 Integrating spacer fabrics does not change the principal progression (Figure 7). The beginning is characterised by a small deflection of all spacer threads and cell walls, which are oriented vertically to the load direction. This results in a linear increase of the curve up to about 5% compression. During the next phase, the deflection of the spacer threads increases and the cell layers collapse one after another. This begins in the row with the lowest strength. Air in the material is compressed and pushed out as the deformation takes place in a few milliseconds. It results in an almost constant curve progression. A very steep rise marks the beginning of the last phase. The reason for the increase in stress is the buckling of the spacer threads and the densification of the foam. Collapsed cells press against each other.
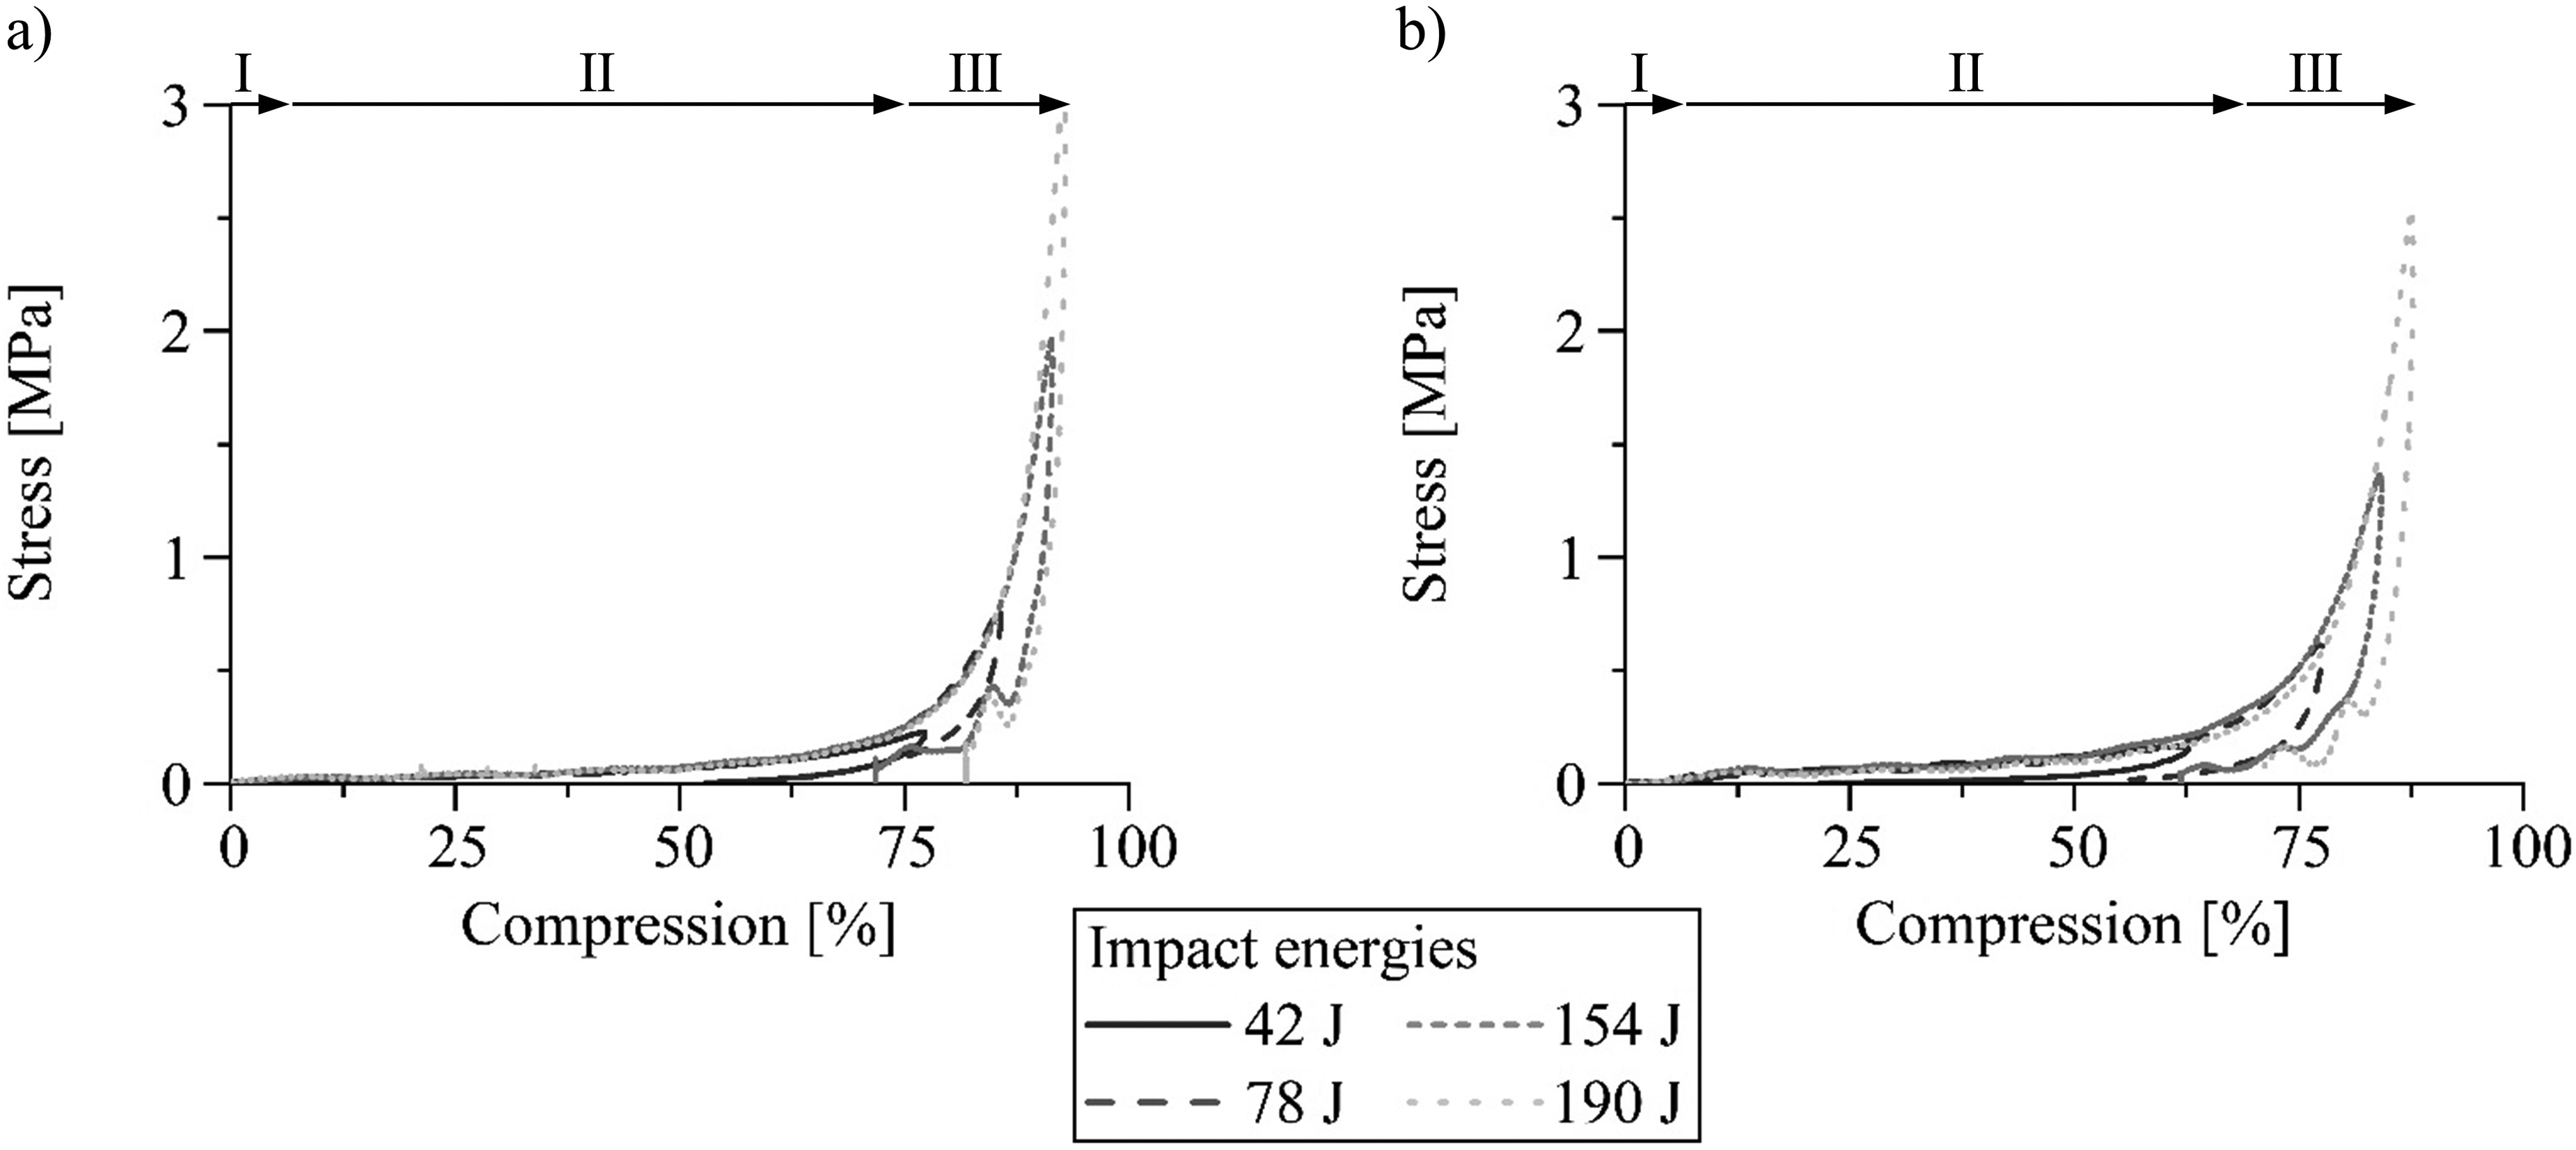
Exemplary stress-compression curves determined during the first impact of the test for the (a) unreinforced and (b) reinforced flexible polyurethane foam (deformation phases: I … bending of the cell walls and spacer threads, II … collapse, III … densification).
The curves determined correspond to each other for the different impact energies in the first two phases. Differences arise in the third phase, which is not reached at all in the case of 42 J. Greater compressions and stresses occur at the higher loads. A plateau is always formed, which is significantly higher compared to the equivalent quasi-static property (see CC40 in section Materials). The characteristic value is 40 kPa (5.0 times higher) without and 64 kPa (1.7 times higher) with reinforcement. Air escaping from the cell structure is the reason for the differences. 23 If there is not enough time for this, the gas is compressed and the stress increases. The foam is subsequently densified to 93% without and 88% with reinforcement at 190 J. This corresponds to the block thicknesses (Table 2), which proves complete compression in each case. The unloading part of the curve shows the nearly complete recovery.
The stress-strain curve of rigid foam subjected to compressive loading is similar to that of flexible foam and can therefore also be divided into the three phases. 19 Bending of the spacer threads and cell walls vertical to the load direction characterises the beginning. As rigid foam usually has closed cells, trapped gas is additionally compressed. This also results in a linear-elastic increase of the curve (Figure 8). Progressive deflection of the spacer threads and buckling of the cell walls is also associated with rupturing of these. A slight drop in the curves and irreversible deformation results. The foam structure is subsequently crushed continuously in the manner described. Fluctuations in the curve around a constant value occur in this second phase because of the destruction. A plateau is formed, which is again higher compared to the corresponding quasi-static property (see CC40 in section Materials). The characteristic value is 800 kPa (25% higher) without and 1050 kPa (5% higher) with reinforcement. The difference becomes smaller when the material has a higher strength. This is because of the relative decrease in the influence of resistance caused by air compression. The third phase of densification was not reached in the case of rigid foam. The increasing impact energy therefore leads to greater compression but no increase in stress. Partial recovery during unloading is caused by the spacer threads and the elasticity of remaining, undestroyed cell walls.
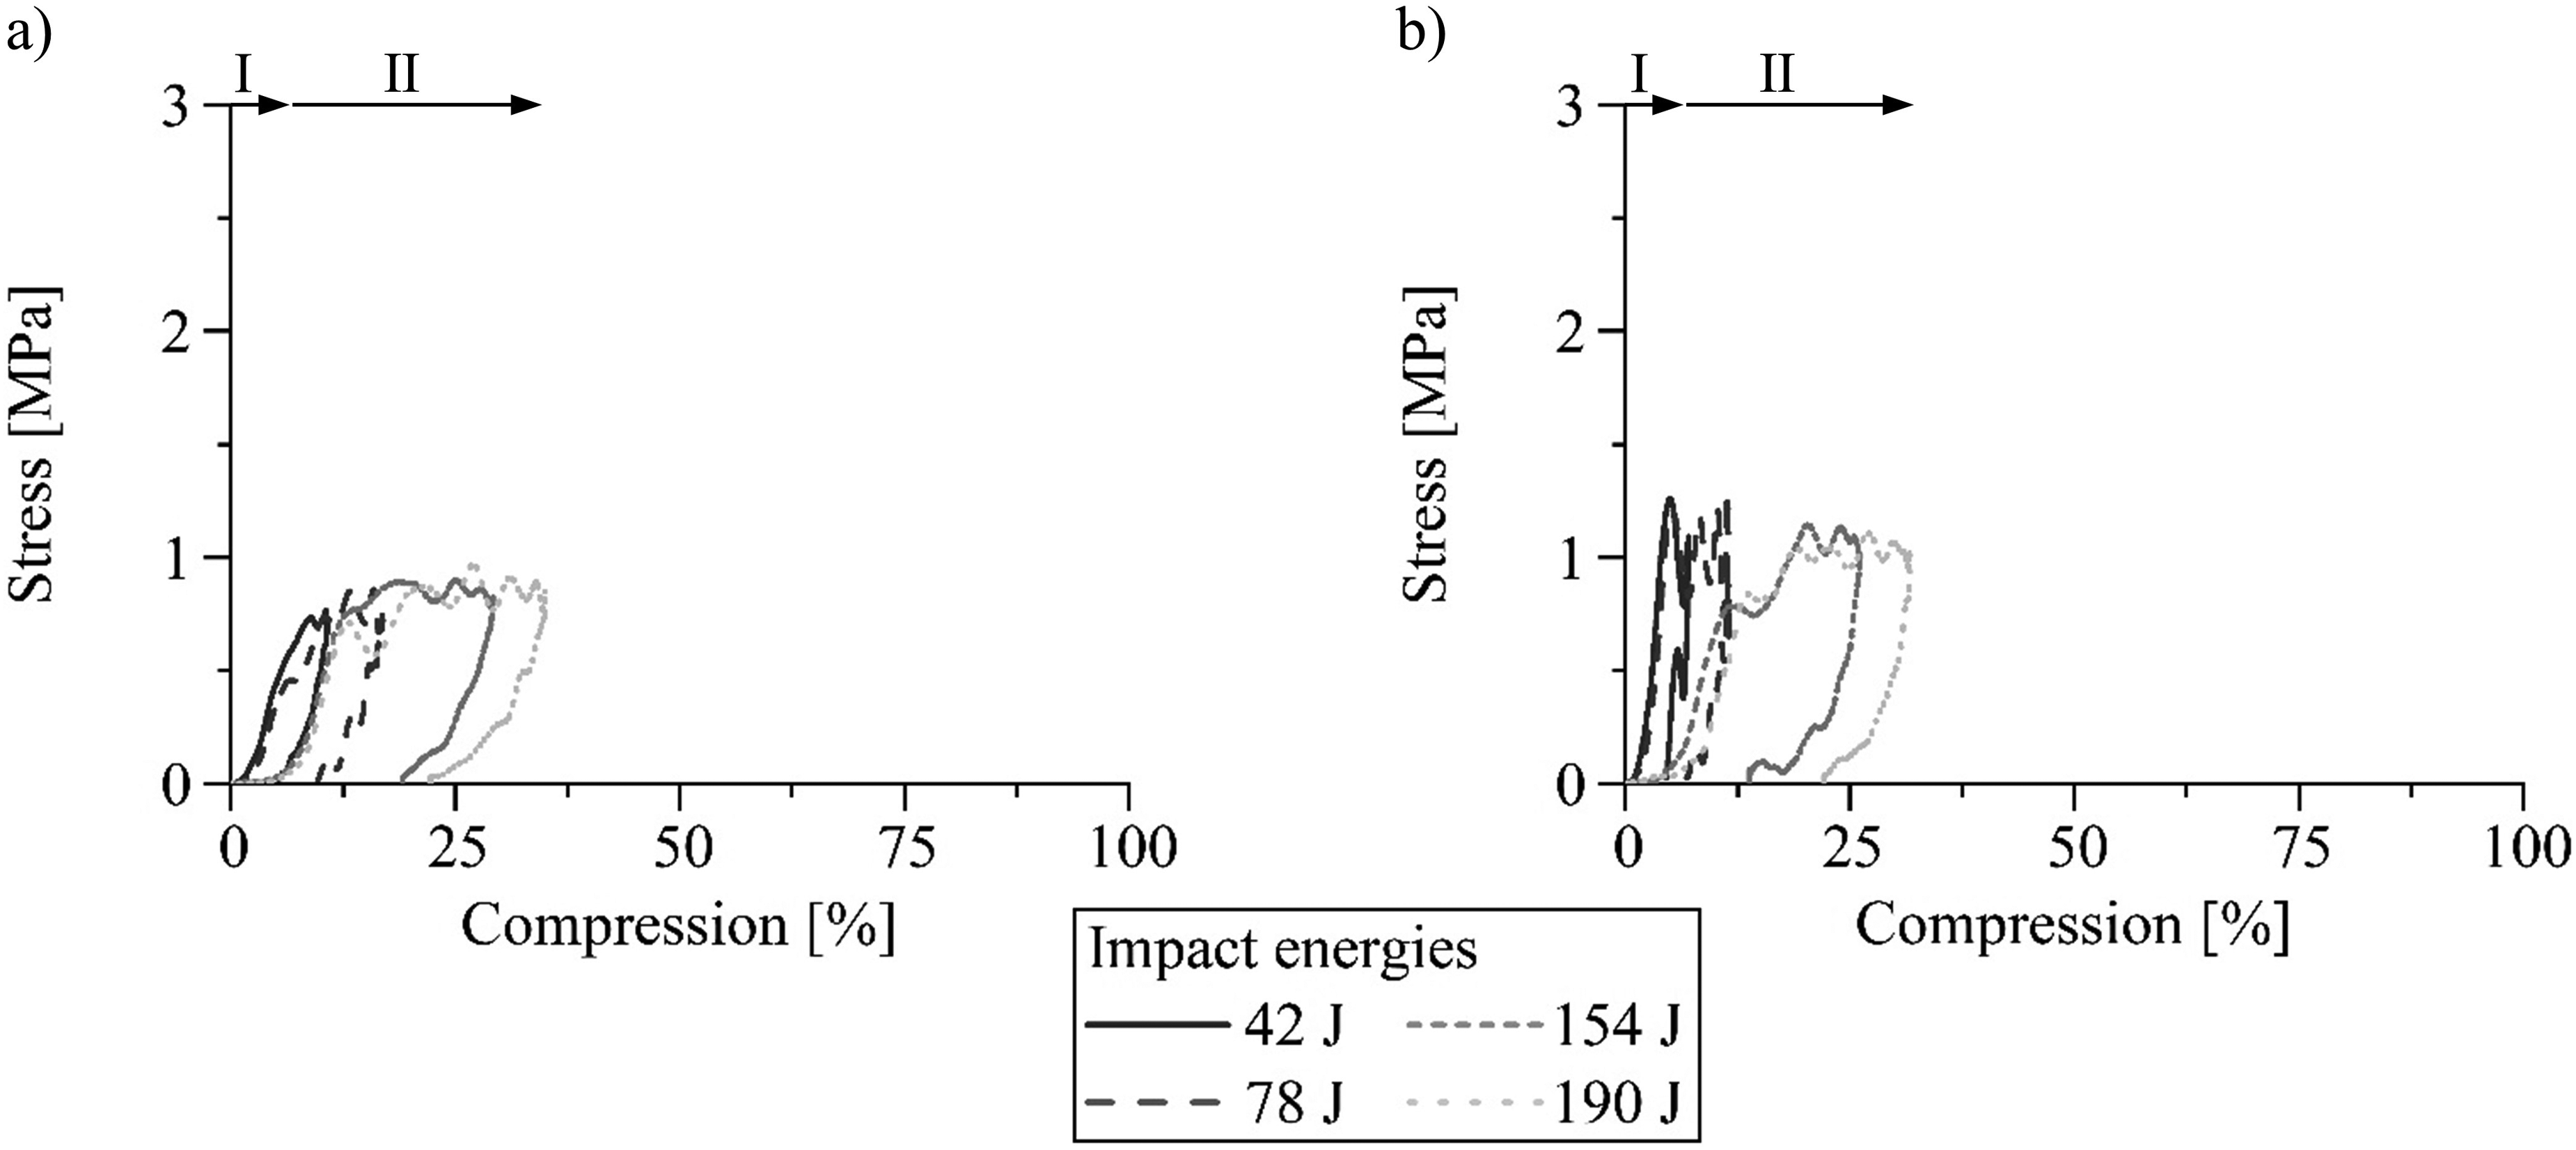
Exemplary stress-compression curves determined during the first impact of the test for the (a) unreinforced and (b) reinforced rigid polyurethane foam (deformation phases: I … bending of the cell walls and spacer threads, II … collapse).
Comparing the results of the three consecutive impacts in cushioning diagrams allows conclusions about the material behaviour when subjected to repeated loading. The flexible foam is already compressed to just over 75% at the lowest load level. Raising the impact energy from 42 J to 190 J increases the peak compression further by 20% (Figure 9). Compression modulus is also affected. The very low initial value of 0.2 MPa doubles. Higher resistance of the air inside the material with rising impact energy is again the reason for this. 23 There is sufficient time for the air to escape in the case of quasi-static loading. The characteristic value determined accordingly (see EC in section Materials) is therefore 15% lower compared to the result with the lowest impact energy.
Cushioning diagram for the peak compression and the compression modulus of the (a) unreinforced and (b) reinforced flexible polyurethane foam.
The reinforcement reduces the peak compression by 10% on average for the four impact energies analysed. The spacer threads oppose the impact and cause the reduction through their deformation. They additionally absorb the load like in a conventional fibre-reinforced plastic without porosity. This increases the compression modulus considerably. The characteristic value is 7 times higher at 42 J. Raising the impact energy leads in turn to a reduction. Halving results at 190 J, which is nevertheless 60% higher compared to the unreinforced foam. The spacer threads are more and more challenged with the absorption of the whole impact energy, causing easier bending of them. A decreased compression modulus with increasing peak compression results consequently in fibre-reinforced PUR foams (Figure 9). This relationship has already been demonstrated by Kim et al. 27 The quasi-static compression modulus (see EC in section Materials) corresponds to the mean value of the result for the four impact energies investigated, which is based on opposing effects. Sufficient time for the air to escape and the viscoelasticity of the thermoplastic fibres lead to a lower characteristic value. Overloading in the absorption process cannot occur in contrast.
The peak compression does not change noticeably in comparison of the three impacts. Both materials are repeatedly deformed to the same maximum value. With in contrast to without spacer fabric decreases the compression modulus however. The difference between the first and third impact amounts to 25%. The fibres have insufficient time to return and become therefore increasingly worse oriented against the load direction.
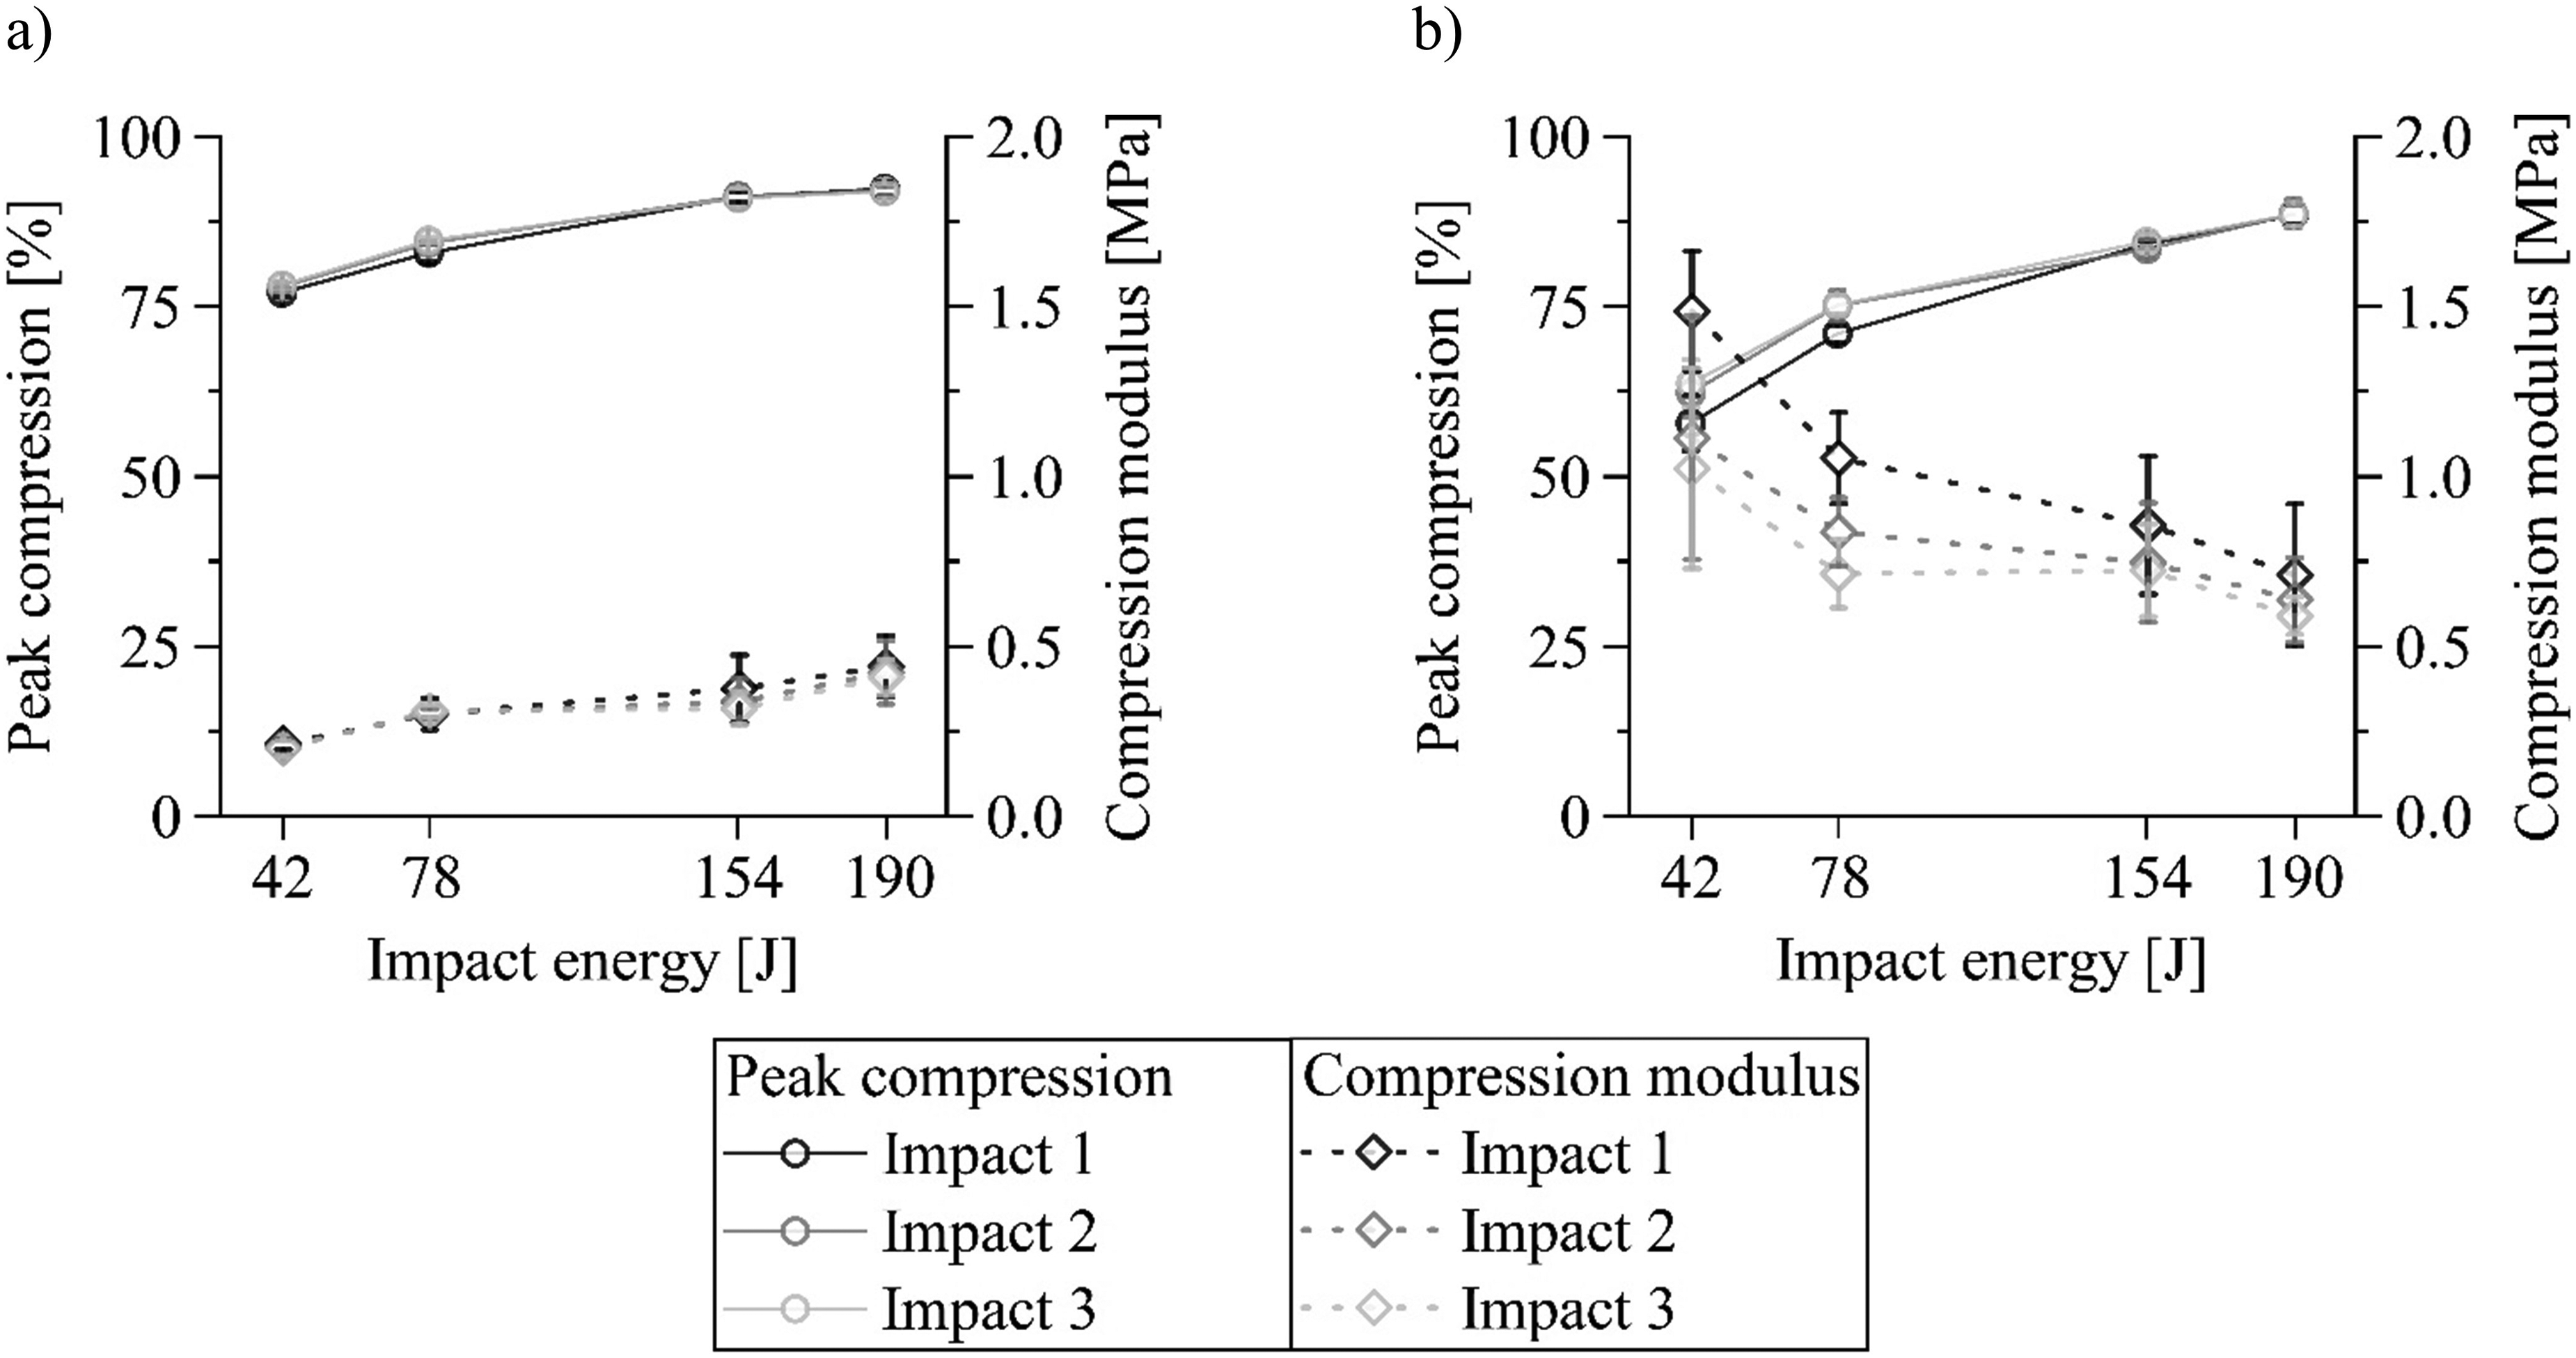
Increasing is the peak compression even in the case of unreinforced rigid foam, when the impact energy rises from 42 J to 190 J. The difference between the results of the lowest and highest load level is 20%. Constancy can be found in contrast for the compression modulus (Figure 10). This corresponds to the result of Mane et al. 26 The cell walls absorb the load almost alone in contrast to the flexible foam, because of the higher stiffness. A minor influencing factor is consequently the air in the material. Quasi-static loading leads to a 20% lower compression modulus (see EC in section Materials), as the air does not generate any contribution.
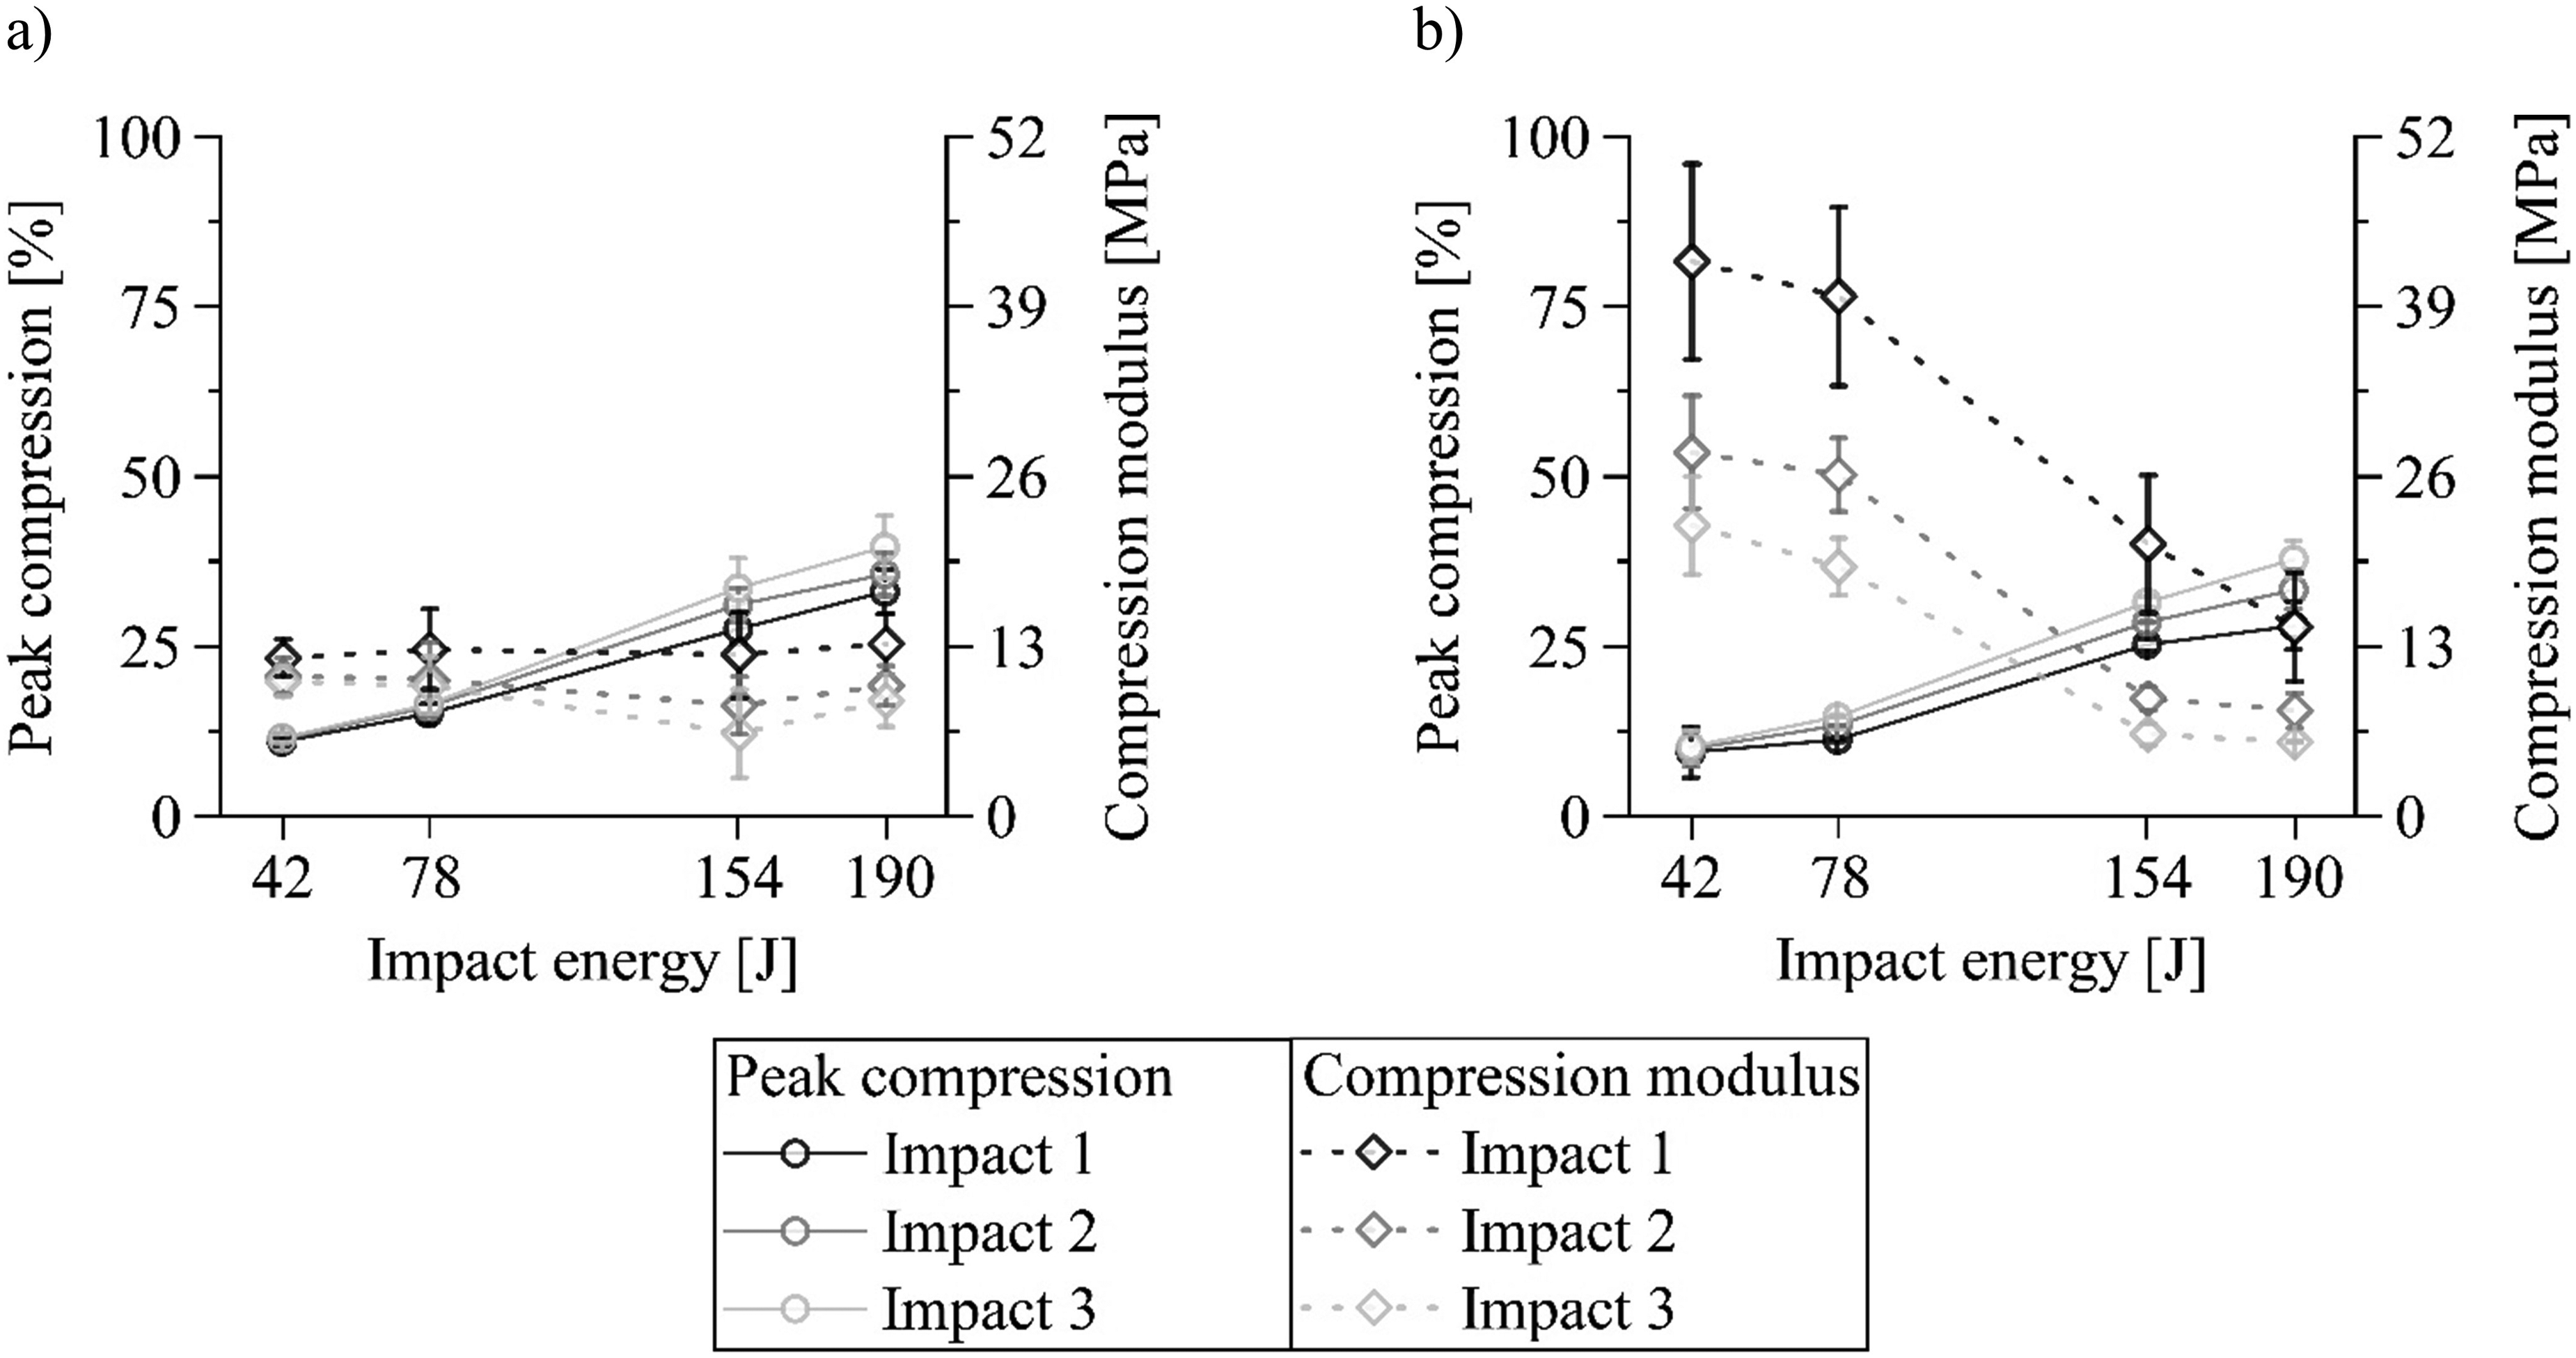
Cushioning diagram for the peak compression and the compression modulus of the (a) unreinforced and (b) reinforced rigid polyurethane foam.
The peak compression is reduced by 10% in the case of rigid foam through the integration of the spacer fabric, similar to the result with the flexible foam. A clear increase in the compression modulus is additionally demonstrated again. The characteristic value is 3.5 times higher at 42 J and decreases with increasing impact energy as well. The result at 190 J is a third, which is nevertheless 10% higher compared to the unreinforced rigid foam. Compression modulus determined quasi-statically (see EC in section Materials) corresponds again to the mean value of the results obtained with the four impact energies. The characteristic values change in the same way through the integration of the spacer fabric compared to the flexible foam, which is based on the same reasons.
Each of the three impacts leads to significant changes in the case of the rigid foam (Figure 10). The peak compression increases at 190 J by 20% without and by 35% with reinforcement. The compression modulus decreases averaged over all four impact energies by 30% without and 60% with spacer fabric. Accumulating plastic deformation and damage to the foam structure and fibres are the reasons for this. The high deformation recovery after the test is remarkable for the rigid foam with and without reinforcement. This amounts to 85% when peak compression (Figure 10) and plastic deformation (Figure 6) are compared on average for all impact energies investigated. The rigid foam offers compared to the flexible foam in the unreinforced and reinforced case a 75% lower peak compression and a 30 times higher compression modulus.
A high deceleration is often associated with a poor energy absorption. 23 This can be confirmed by the results obtained for the flexible variants. The two characteristic values are oppositely directed (Figure 11). Raising from 42 J to 190 J results in an immense increase in peak deceleration by a factor of 10 and an extreme decrease in energy absorption by 60%. The duration of an impact with loading and unloading reduced from around 30 ms for the low to around 17 ms for the high impact energies. It can be concluded based on these results that it is hard for the flexible variants to manage higher loads. The rebound of the applied impact energy was always 34 ± 5% without and 30 ± 2% with reinforcement. This difference is based on the lower porosity of the composite. A certain extent of the rebound is caused by the decompression of the gas inside the foam. 23 The spacer fabric also reduced the peak deceleration by 30% and increased the energy absorption by 50% on average for all impact energies investigated. These improvements are mainly caused by the deformation of the spacer threads. 36
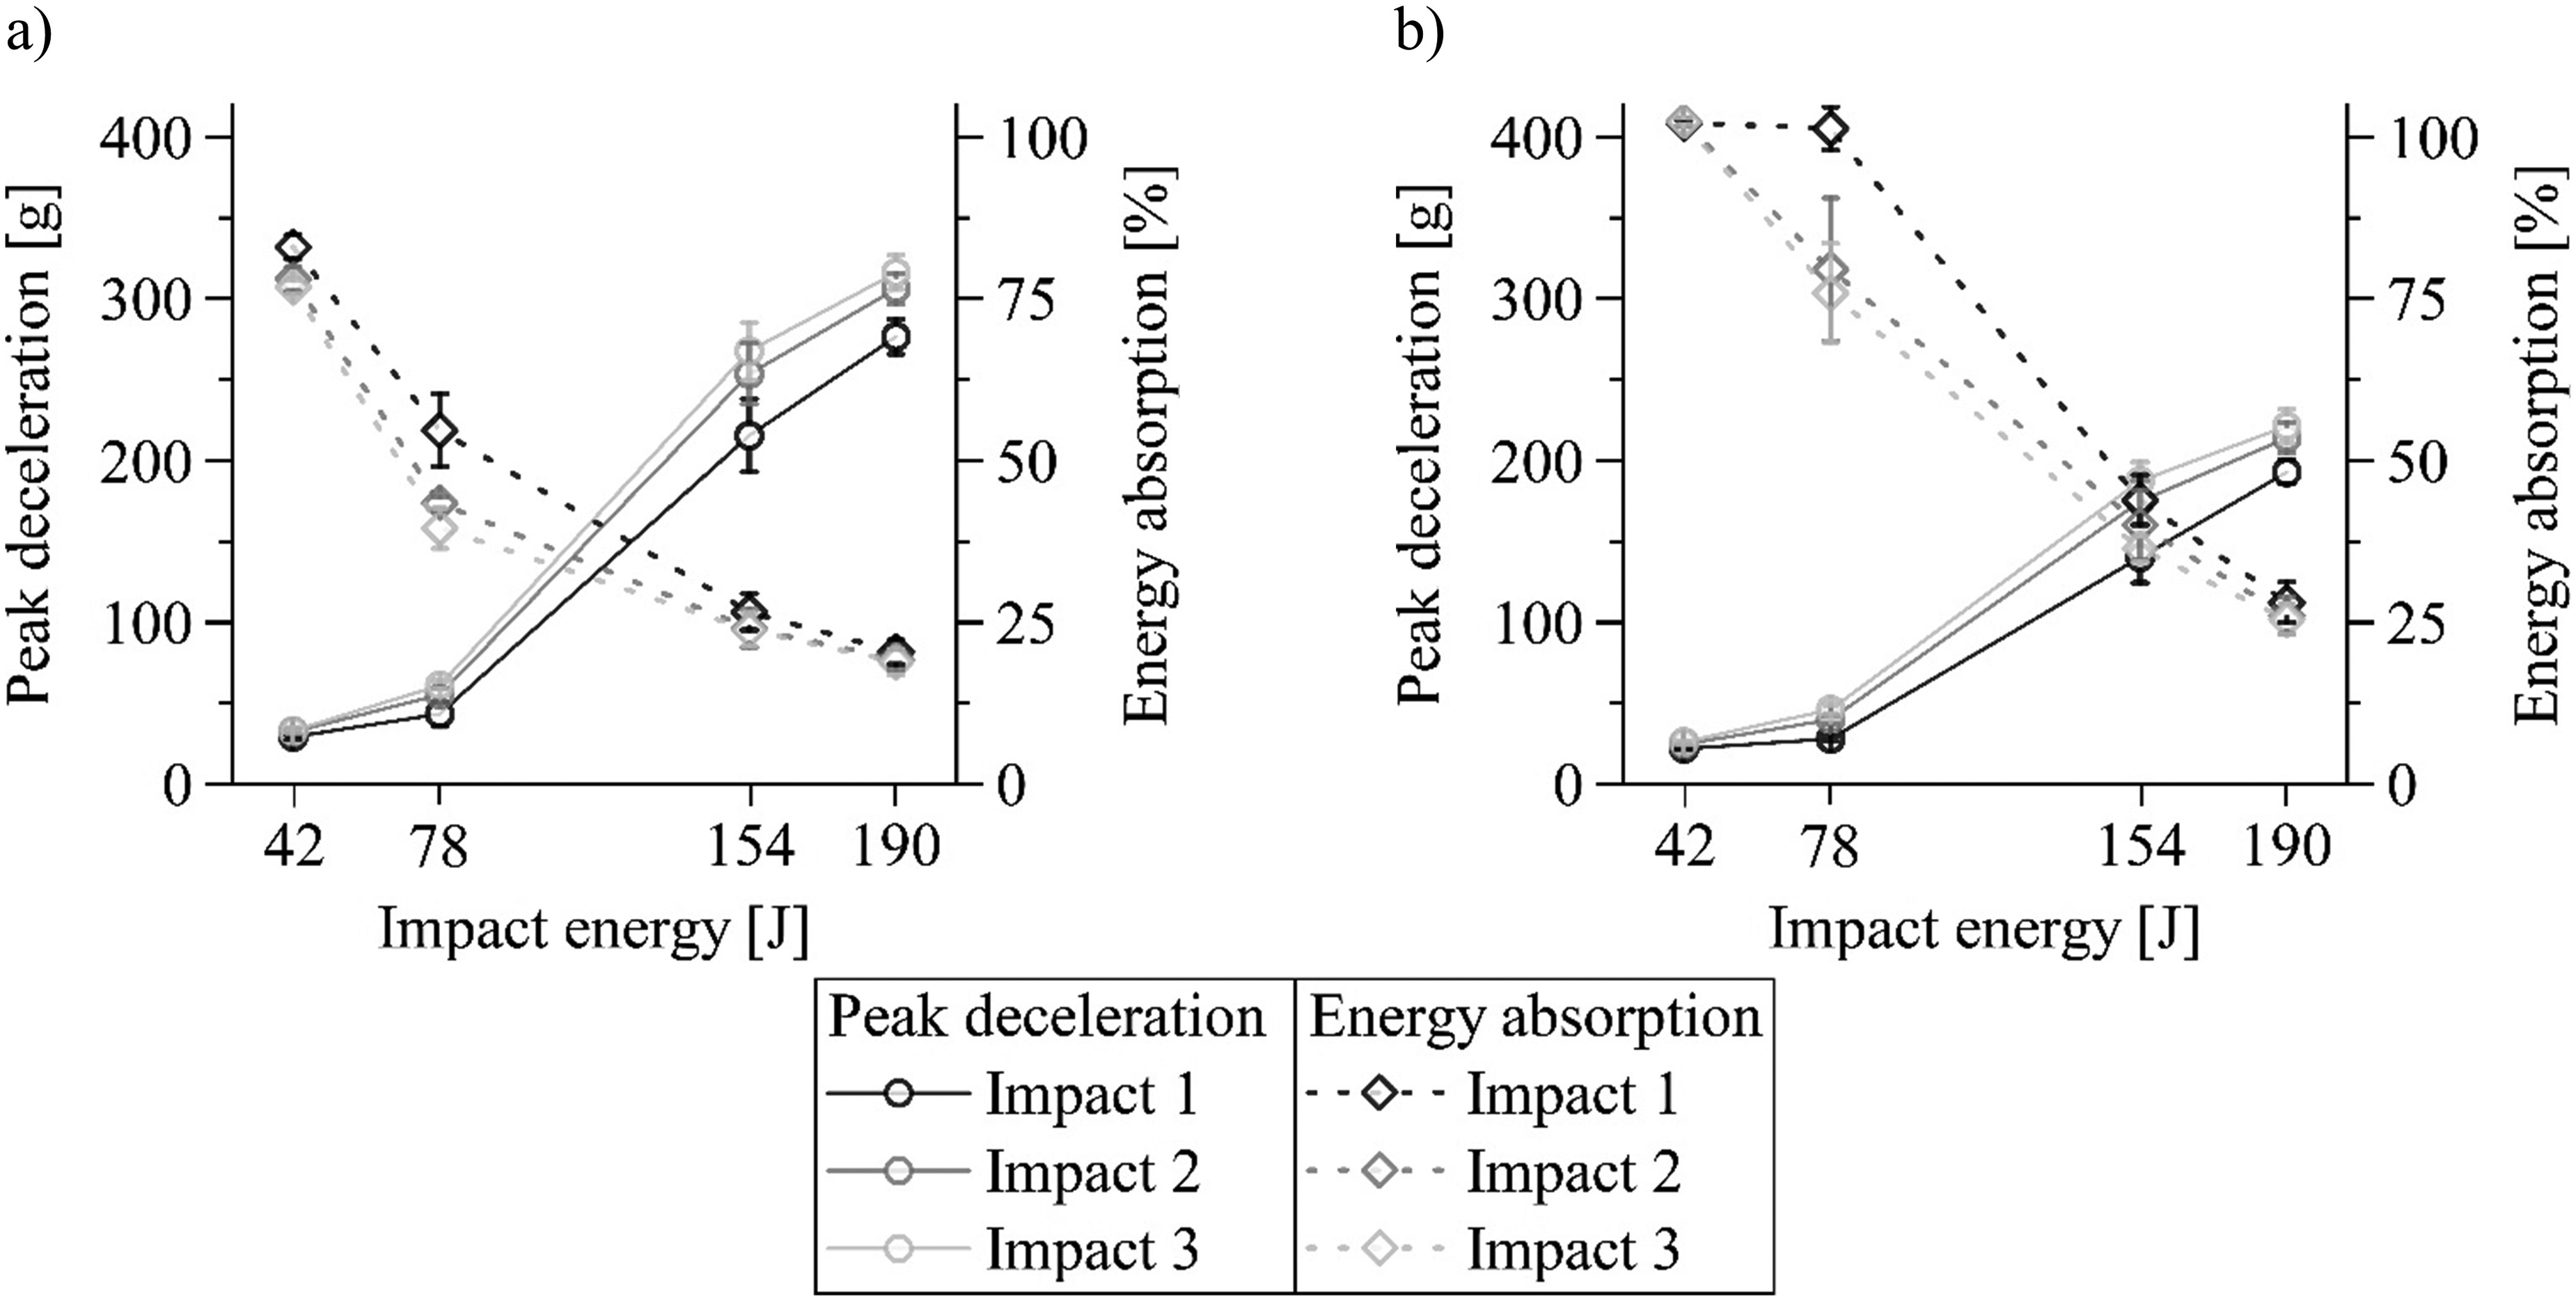
Cushioning diagram for the peak deceleration and the energy absorption of the (a) unreinforced and (b) reinforced flexible polyurethane foam.
Repeated loading with the three impacts leads to a slight increase (15% at 190 J) of the peak deceleration and marginal decrease of energy absorption (7% at 190 J). The reason for this is the short time interval of 60 s between the loads, which is not sufficient for a complete recovery. Subsequent impacts are always applied to a material with a lower thickness and porosity. Less displacement is therefore available to reduce the force. This leads also to an interesting change at 78 J for the reinforced foam. The first impact is always completely and the next two ones are only absorbed to about 75%.
The duration of loading and unloading was between 5 ms and 10 ms in the case of the two rigid variants. Both completely dissipated all impact energies (Figure 12). No clear trend can be seen for the peak deceleration, because of the dependency on the applied static load (e.g. kg/cm2). 23 But an increase is demonstrated by the integration of the spacer fabric, which amounts to 25% on average for all impact energies. The reason is the higher compressive modulus through the fibre reinforcement. A reduction of the rebound from 25 ± 6% to 19 ± 3% was also achieved, which is again based on the lower porosity of the composite. There is no change in peak deceleration and energy absorption in the sequence of the three impacts, which is remarkable. The performance of the two rigid variants is correspondingly constant, although significant plastic deformation associated with damage to the cell structure occurred during the test (Figure 6).
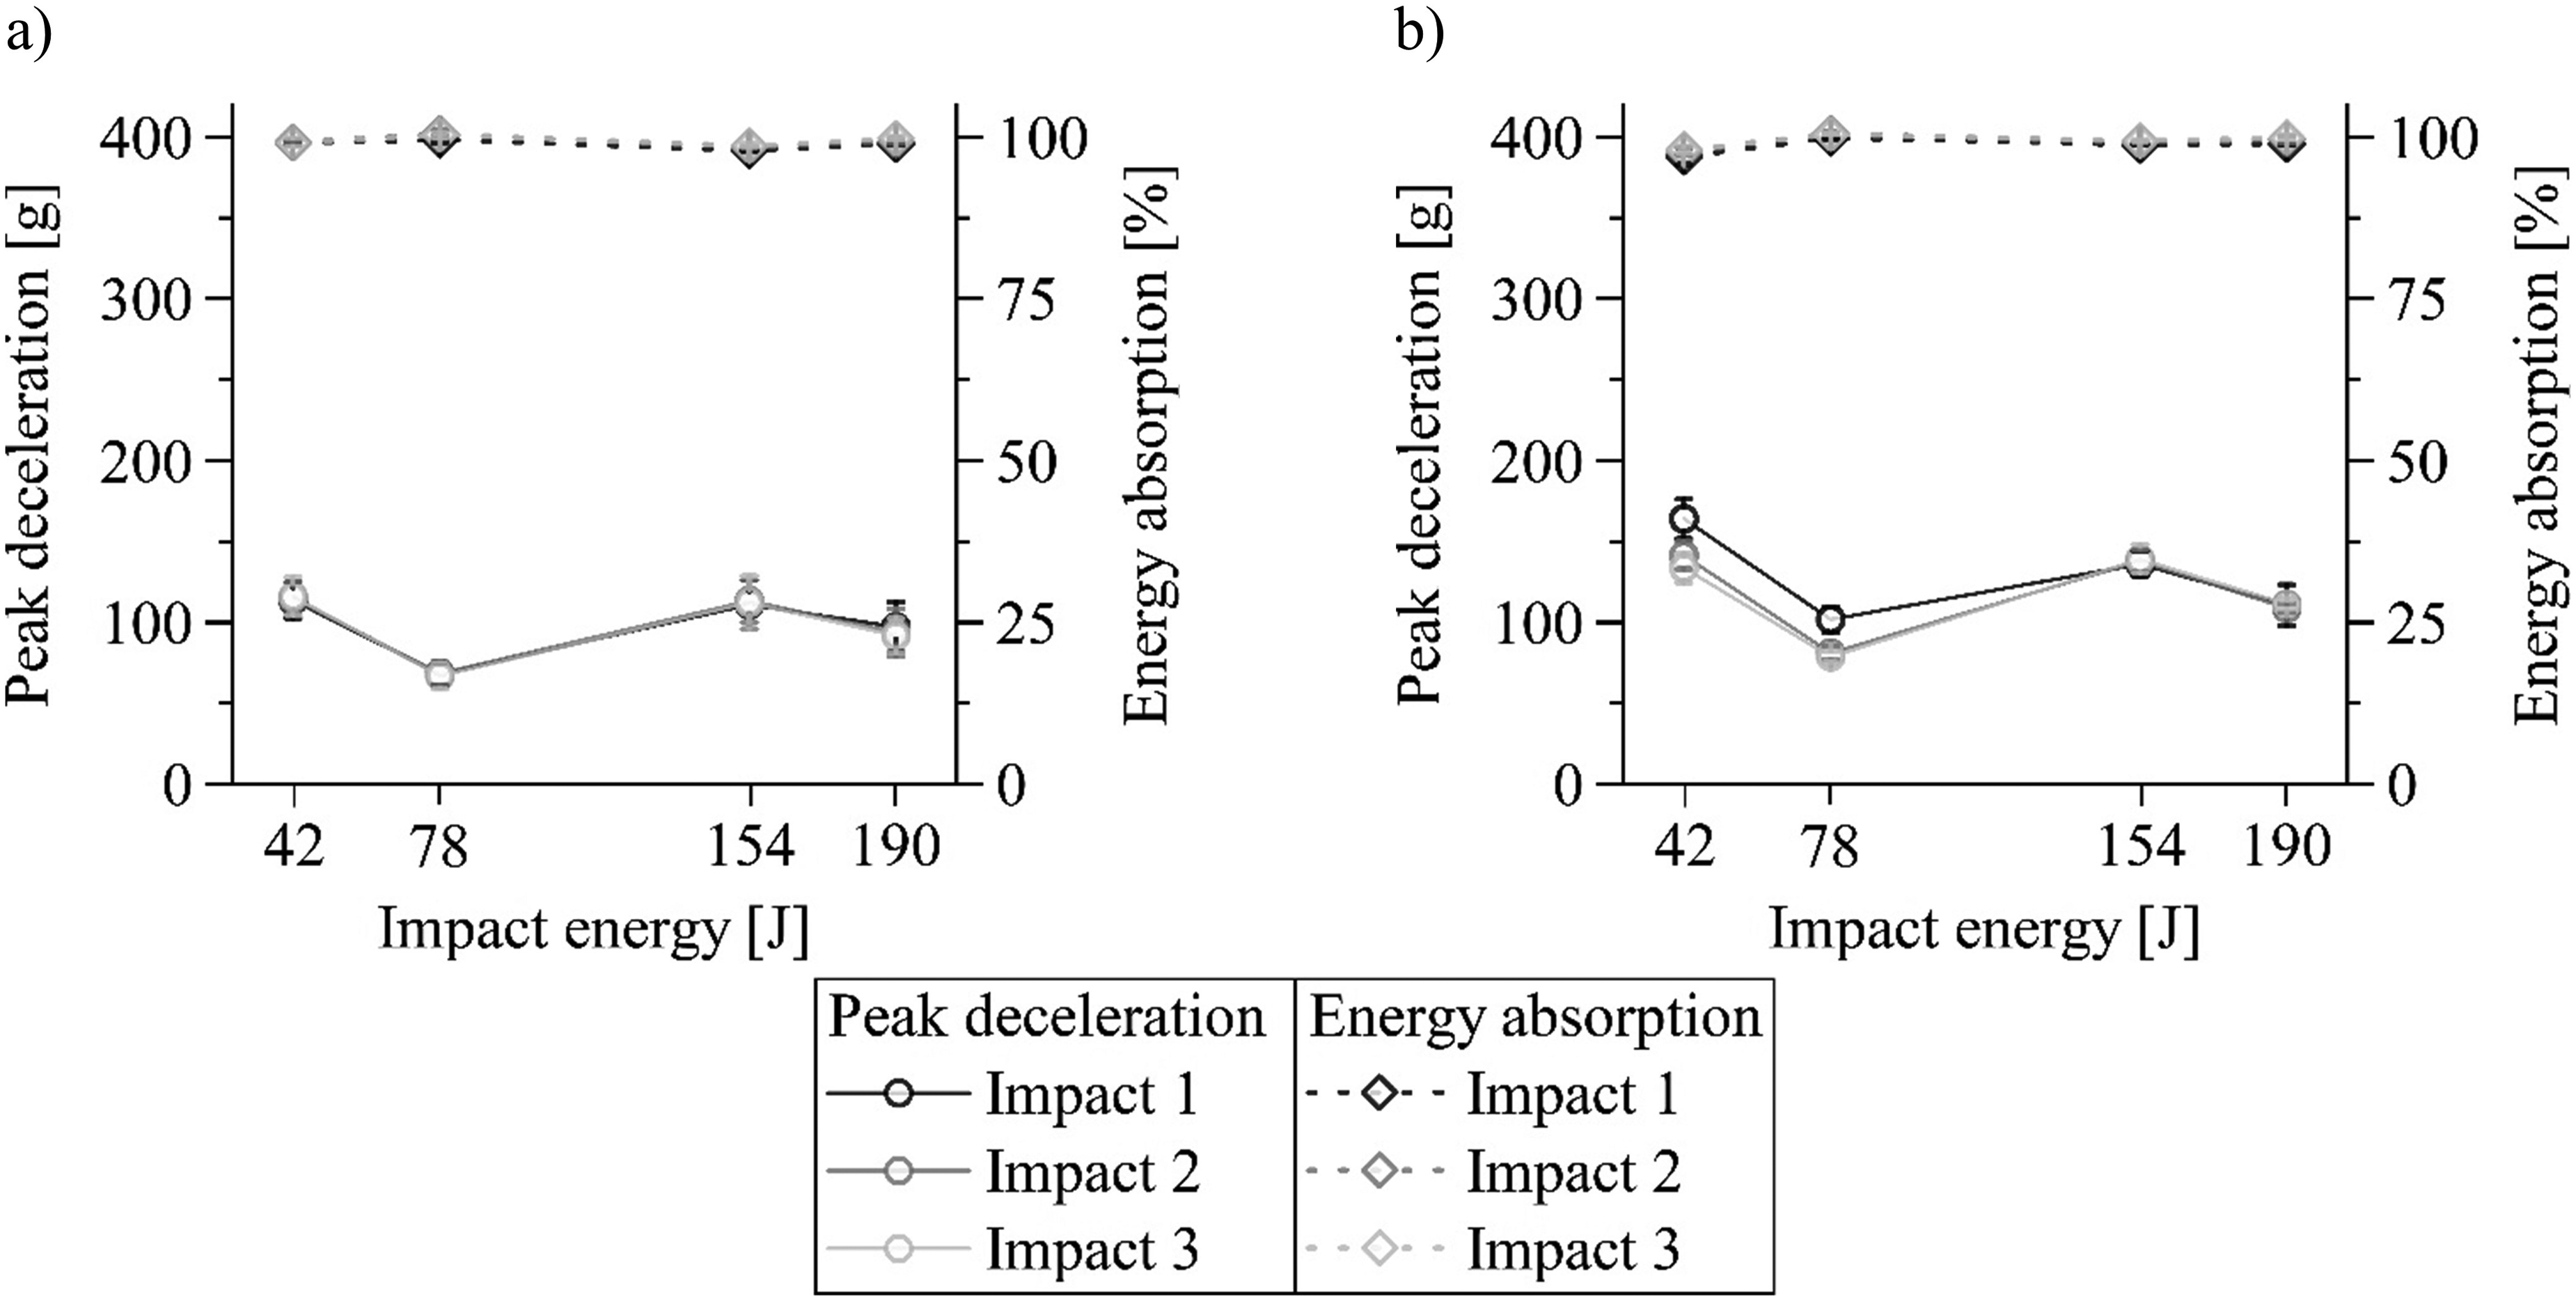
Cushioning diagram for the peak deceleration and the energy absorption of the (a) unreinforced and (b) reinforced rigid polyurethane foam.
The energy absorption of the rigid foam is in comparison to the flexible foam three times higher in the unreinforced case and twice higher in the reinforced case for the investigated impact energies. It results the same ranking of the four materials as for the plateau stress. The relationship between these two characteristic values has been published many times before.20,24,26,29,37 The rebound was always 10% lower. Dissipating a compressive impact is correspondingly more efficient with a PUR cell structure with a high strength. The peak deceleration of the rigid versus the flexible variant was 2.5 times higher without and 4.5 times higher with integrated spacer fabric at the lower impact energies. Smoother energy dissipation occurs accordingly in the case of flexible foam because of the easy deformability. The comparison for the high energies shows again the overloading of the flexible foam. The peak deceleration of the rigid foam is therefore 60% lower in the unreinforced case and 30% lower in the reinforced case.
The capacity for energy absorption is limited for each foam. 37 Full utilisation occurs for the unreinforced flexible variant already at the lowest load level. A constant SEA of 0.52 ± 0.05 J/g therefore results for all impact energies analysed (Figure 13). The peak stress increases linearly in contrast, as the rising load cannot be dissipated by the deformation of the material structure. Changing from 42 J to 190 J therefore increases the peak stress dramatically by a factor of 14. The reinforcement enhances the capacity for energy absorption. A constant SEA therefore sets in first at the second load level. But the value corresponds to the unreinforced variant (0.52 ± 0.11 J/g). Improvement was therefore not achieved in relation to the mass. The lower SEA of 0.34 ± 0.01 J/g before indicates that the capacity for energy absorption was not completely utilised. Decreasing peak stress caused by the fibre reinforcement was also found. This amounts to 30% on average of the four impact energies investigated. The spacer threads oppose the impact and contribute to the reduction of the force through their deformation, which is the reason for these improvements. The peak stress increases by 20% and the SEA decreases by 15% overall in the sequence of the three impacts on the flexible foam with and without reinforcement (Figure 13). The reason is again the lack of time for recovery, which reduces the thickness of the material.
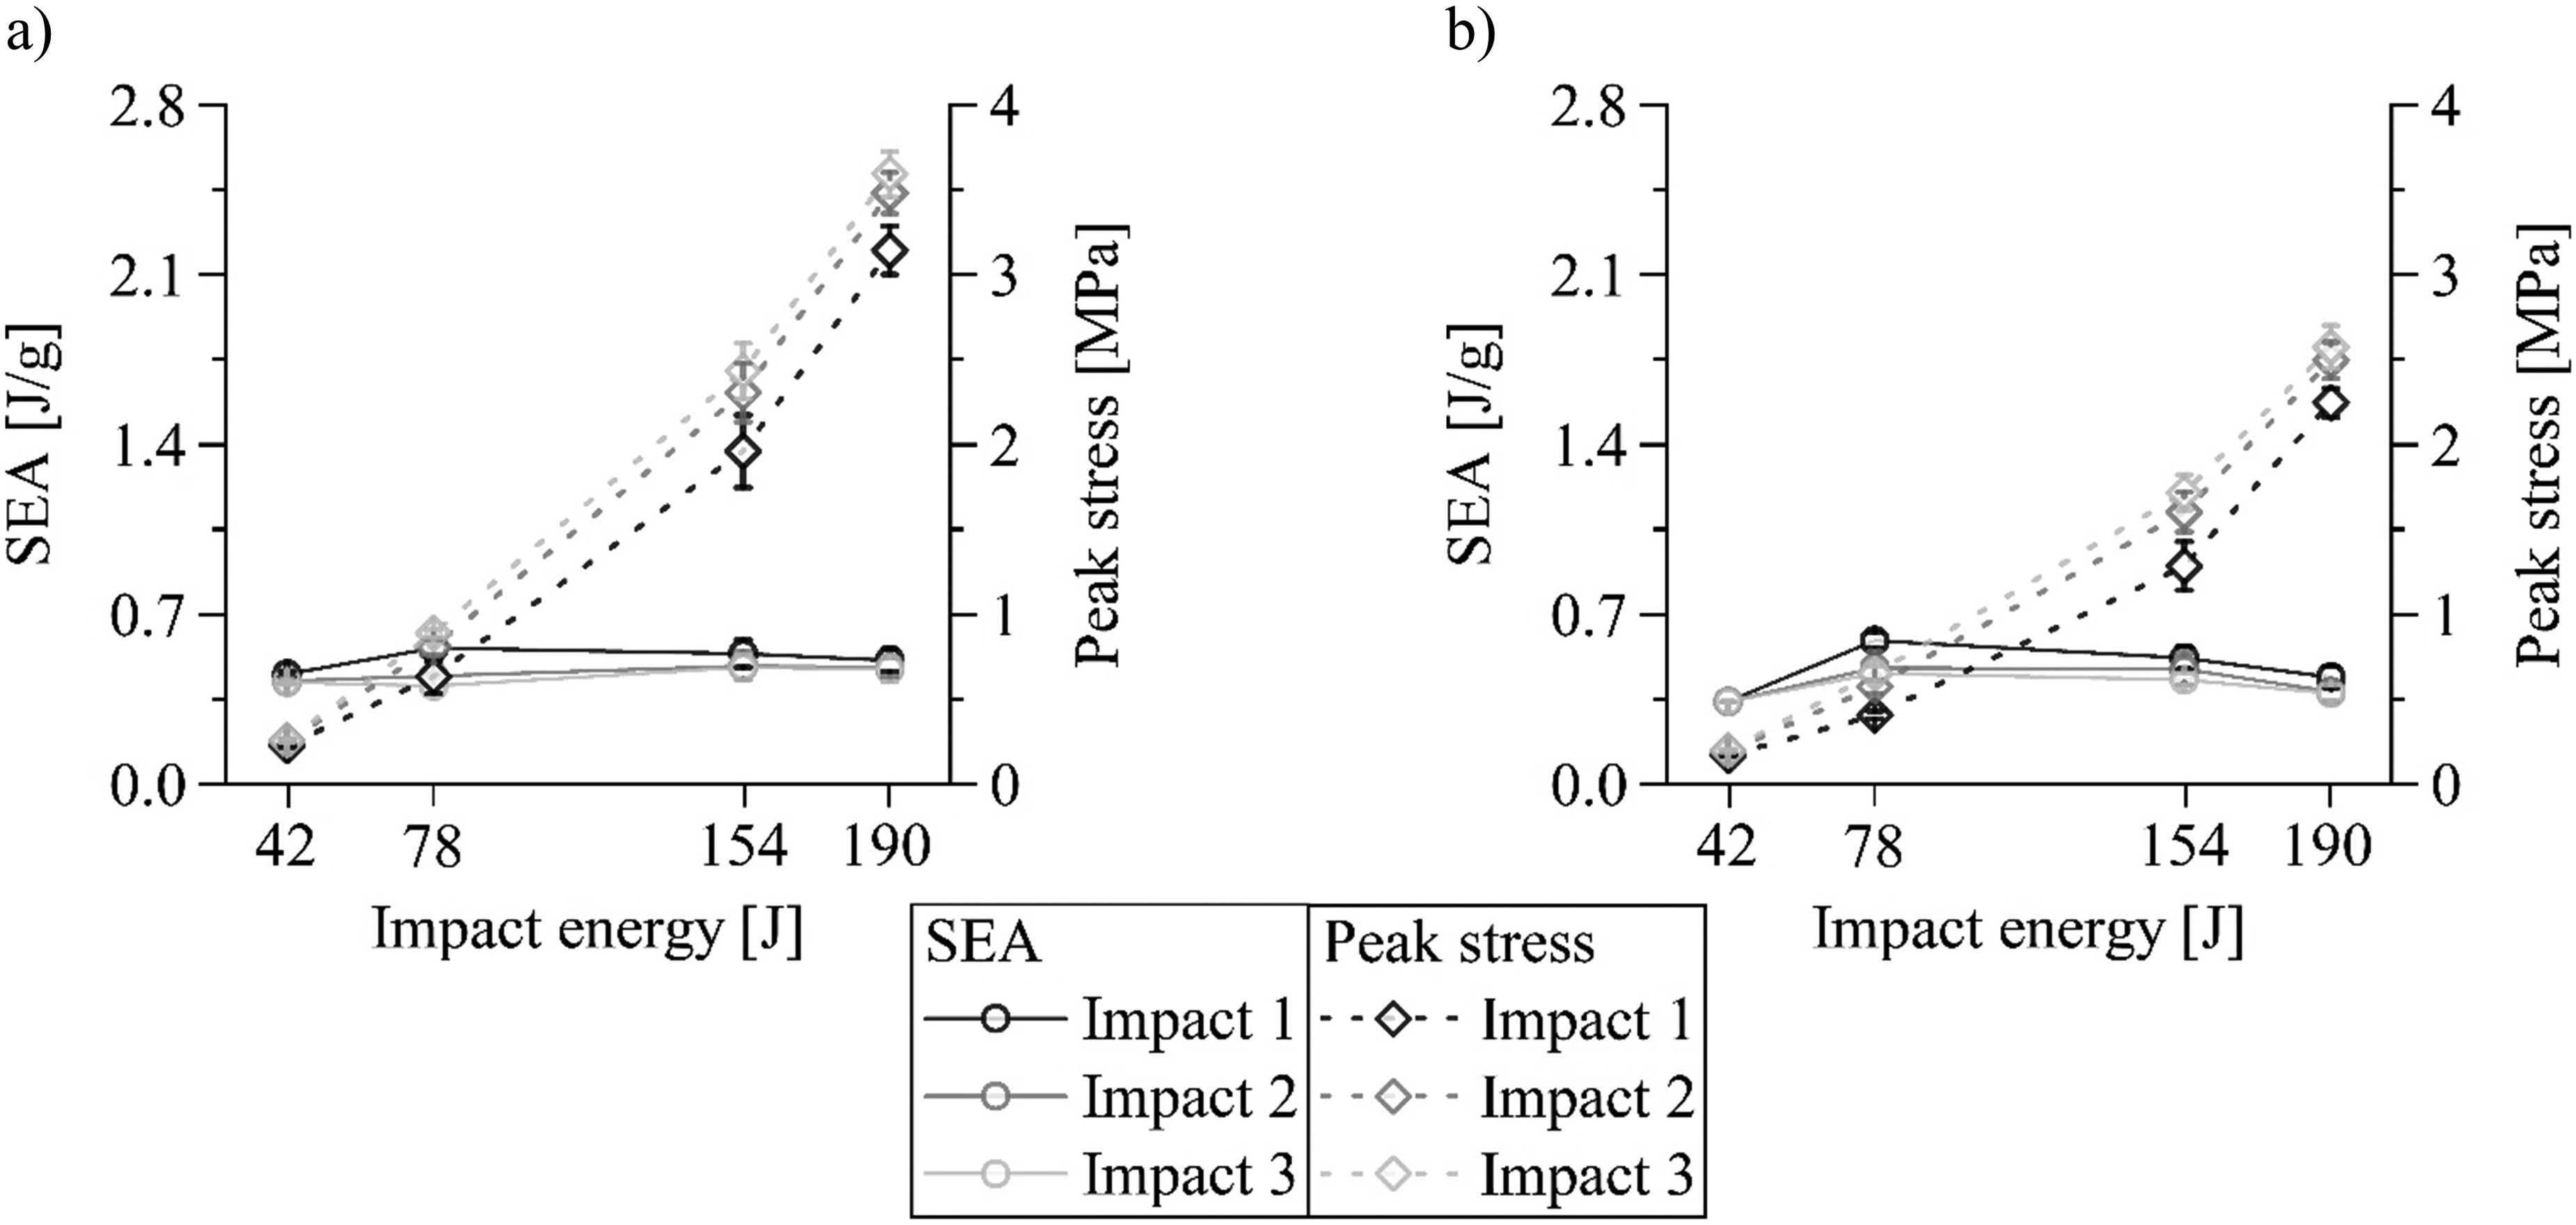
Cushioning diagram for the specific energy absorption (SEA) and the peak stress of the (a) unreinforced and (b) reinforced flexible polyurethane foam.
An increase in SEA occurs linearly for the unreinforced and reinforced rigid foam with rising impact energy (Figure 14). The potential for energy dissipation was therefore not fully utilised. Theoretical maximum values were in consequence calculated by extending the plateau to the theoretical end (see section Mechanical testing). This resulted in 520 J without and 550 J with spacer fabric, which corresponds to a reinforcing effect of 5%. The calculation of theoretical SEA from these values was carried out. The characteristic value without reinforcement was 6.8 J/g, which is close to the experimental result of Hwang et al. for rigid PUR foam tested at room temperature. 17 Three-fifths worse was the theoretical SEA of the composite (4.2 J/g). The performance with reinforcement is correspondingly worse in relation to the mass.
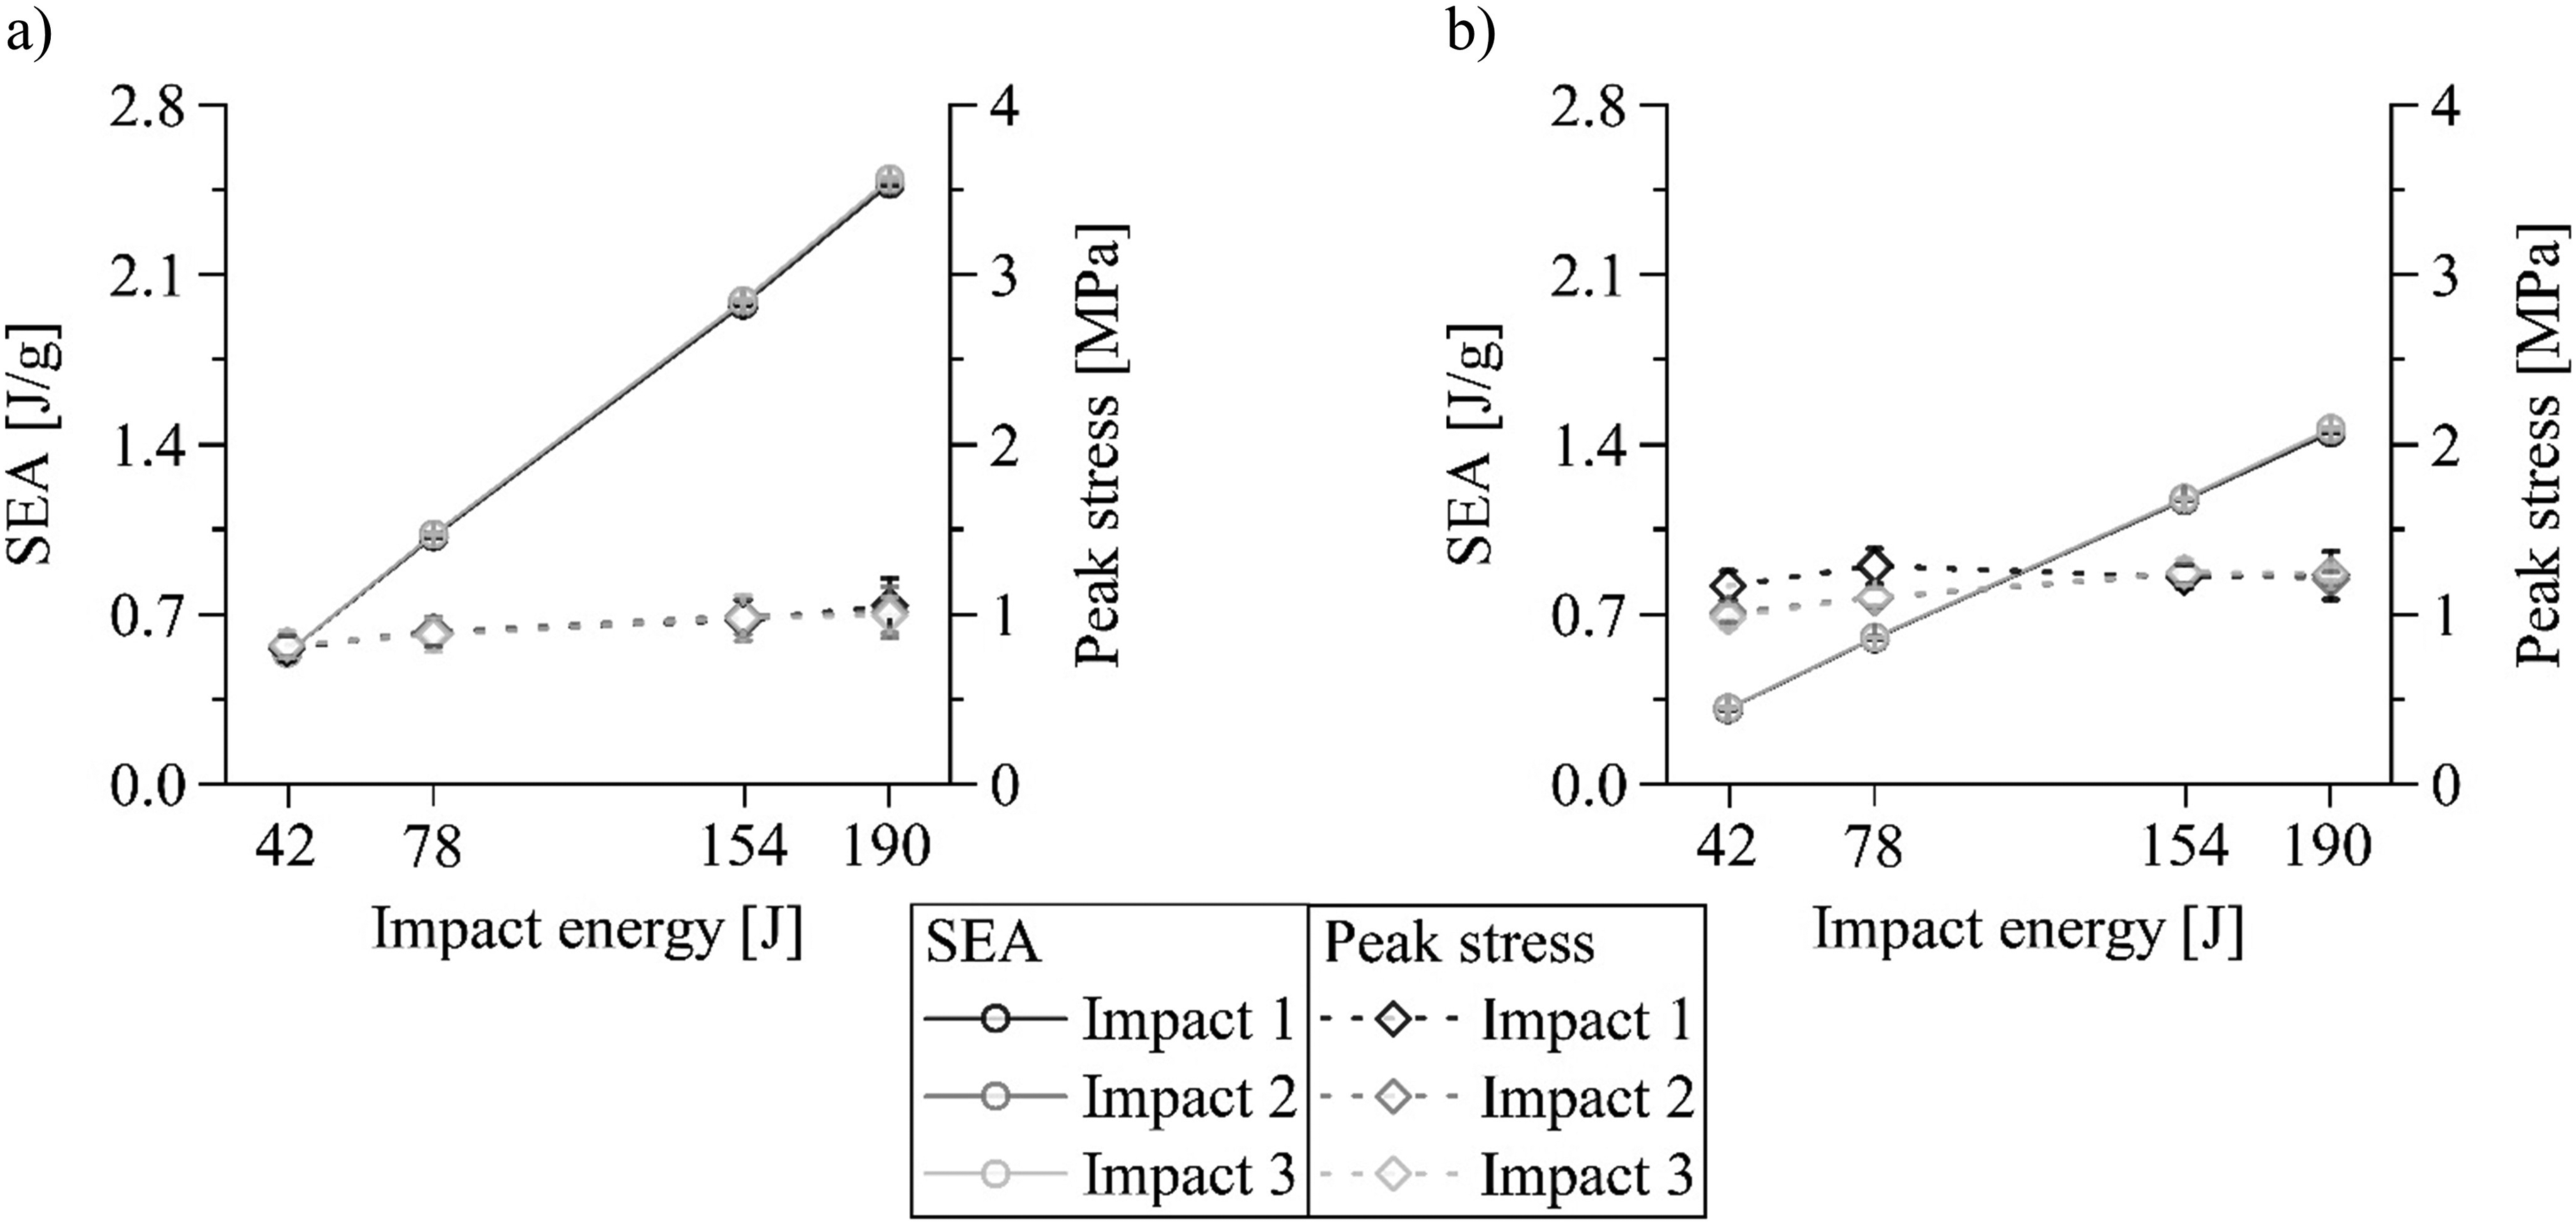
Cushioning diagram for the specific energy absorption (SEA) and the peak stress of the (a) unreinforced and (b) reinforced rigid polyurethane foam.
The peak stress remains constant when the SEA increases, as the load levels lead only to the plateau region. This is demonstrated by the results for the two rigid foam variants (Figure 14). Integrating the spacer fabric increases the peak stress by 25% on average for all investigated energies because of the reinforcing effect. The plateau region is raised to a higher level. More energy is therefore also required for deformation. Peak stress does not change in the sequence of the three impacts, although the rigid foam variants are compressed increasingly (Figure 10). The characteristic value does not change accordingly before densification.
The rigid foam has compared to the flexible foam without reinforcements at the lower energies a doubled but at the higher energies a 65% lower peak stress. The characteristic value is four times higher at the lower energies and 35% lower at the higher energies in the case of reinforced foams. Both flexible variants accordingly have better results at low loads, but cannot handle high loads. The SEA also supports the fact that rigid foam is better suited for energy dissipation. The result of the flexible foam is 13 times lower without and 8 times lower with reinforcement.
The individual spacer fabric cannot keep up with the investigated foam variants, demonstrated by the impact compressive properties determined at the lowest load level. Compression of the textile to block thickness occurred, resulting in the highest peak stress of 1.66 ± 0.05 MPa and the highest peak deceleration of 218 ± 5 g. Approximately comparable to the unreinforced flexible foam was at least the compression modulus (0.35 ± 0.12 MPa). But the energy absorption was only 12 ± 1% corresponding to a SEA of 0.10 ± 0.01 J/g followed by a rebound of 28 ± 1%. The reference in the Data Availability Statement also leads to exemplary high-speed videos of these measurements.
Conclusions
The findings lead to the following directive. Using rigid foam is necessary when high energy absorption is required. Flexible foam is suitable where comfort is important. The integration of warp-knitted spacer fabrics is an appropriate solution for optimising the properties of both types. None of the four materials investigated has to be favoured because of the rebound. Flexible and rigid foams with and without 3D continuous fibre reinforcement can be subjected to repeated impact loading without substantial loss of performance. The four materials can consequently be reused after an impact.
Summary
The impact compressive properties of flexible and rigid PUR foam with and without 3D continuous fibre reinforcement were investigated in this work to allow a selection according to the requirements of applications. Scientifically comparable series of sample plates were manufactured in the SRIM. The bulk density was 85 kg/m3 (porosity 93%) without and 145 kg/m3 (porosity 88%) with integrated warp-knitted spacer fabric. The characterisation was carried out using a drop weight tester according to a standardised method, which includes three impacts in direct sequence. Four impact energies were investigated, which led to uncritical as well as critical loads for each of the four materials. Measurements were accordingly conducted in all series where low compression and complete recovery occurred. Further tests compacted the flexible variants to block thickness and plastically deformed the rigid variants by considerably more than 5%. This allowed the comparison of the pros and cons of the four materials. The following findings were obtained in this way.
Stresses in the deformation of PUR foams are higher when subjected to impact compared to quasi-static loads, because of the compression of the gas in the cells. This confirms previous work. 26 Flexible compared to rigid variants have a much lower capacity for energy absorption. But they dissipate an impact with higher deformation and a longer impulse much more gently, which results in lower peak stresses and decelerations. They are additionally always completely elastic, whereby the rigid variant also showed a high recovery of 85% in the tests carried out. Rebound can cause injuries and therefore presents an important criterion in the selection of materials for applications with requirements to impact safety. 16 Rigid instead of flexible foam is therefore often used. 38 However, only a 10% lower value was found for the favoured material in all measurements of this work.
The 3D continuous fibre reinforcement leads to an anisotropic deformation behaviour. Complete elasticity is nevertheless retained in the flexible variant. The failure occurred for the rigid variant in the impact test near the warp-knitted fabric surfaces. This demonstrated that the composites act like a sandwich. The rigid variants were able to resist the three impacts without any damage if the load was below a critical level. This finding has also been published previously. 27 The principle progression of the stress-compression curve of PUR foams is not changed by the integration of a 3D continuous fibre reinforcement. But the absolute characteristic values are slightly improved in the case of rigid foam and greatly enhanced in the case of flexible foam. The deformation of the spacer threads contributes accordingly to reduce the impact load. But no increase in specific energy absorption was achieved in this work. The wide ranging possibilities for optimising the textile structure of warp-knitted spacer fabrics with regard to impact compressive load have to be exploited for this purpose. 39 This will result in improved characteristic values in relation to mass as well. But the individual textile has no potential to match the impact compressive properties of PUR foams in general.
Footnotes
Acknowledgments
The authors are grateful to Pavel Schulz for the manufacturing of the samples for the investigation as part of his bachelor thesis.
Data availability
The relevant data of this investigation are available in the article. Exemplary high-speed videos of the impact test are available at the online storage service Zenodo. 40
Declaration of conflicting interests
The authors declared no potential conflicts of interest with respect to the research, authorship, and/or publication of this article.
Funding
The authors disclosed receipt of the following financial support for the research, authorship, and/or publication of this article: This research was carried out within the project “SmartHouB” (proposal number: 100581056), which arose from the Call 2020 of the network M-ERA.NET. The funding was provided by the Sächsische Aufbaubank (SAB) using taxes from the Saxon budget.