
Abstract
This article discusses a methodological approach to the study of audio-visual content on platforms like TikTok. We argue that existing methodologies for the analysis of visual content based on the notions of the metapicture are not yet fully equipped to account for the multi-layered, dynamic, and information-rich nature of audio-visual material. To fill this gap, we propose an approach aimed at ‘enriching’ the metapicture with textual and other components, alongside visual ones, to critically and systematically analyse video collections. First, we explain how researchers can enrich the metapicture by following three main principles: metadating, disaggregation and reaggregation, and readability. To illustrate our approach, we present a case study based on data donations to explore the content and gender representations TikTok users are exposed to. The study is structured in three steps, each introducing a type of enriched metapicture: the megapicture, scene-by-scene timeline, and video stack.
Introduction
The popularity of TikTok, but also that of similarly visually oriented, mobile-first platforms like Snapchat and Instagram, prompts methodological challenges and questions. These platforms not only focus on visual content but increasingly often (and sometimes exclusively) on moving visual content, that is, video. This adds to the complexity of the data to be analysed and presents epistemological questions concerning the nature of the objects of study. Whereas text and images can be treated and compared as static objects that are at least ontologically equivalent, social media videos can differ greatly in terms of length, contain multiple ‘sub-videos’ cut together, and present more complex narratives than still images. This complicates the analysis and comparison of data sets consisting of such data and calls for methods attuned to its specificities.
With this article, we propose a methodological approach to analyse video content on TikTok and other social media platforms based on the idea of ‘enriching the metapicture’. Our work builds on the concept of the metapicture (Mitchell, 1995), a way of grouping and visually arranging images that allows for a critical reflection on them, which has proved helpful to visual analysis on social media (Rogers, 2021). By enriching the metapicture, we mean extending it to afford analysis of not only images but also textual, audio, and gestural components, in order to capture the dynamic, multimodal, and information-rich nature of video content. This article explains, first, how researchers can enrich the metapicture by following three main principles: metadating (the use of metadata like sounds, hashtags, stickers, etc. to select the modes of communication to include in the analysis and filter the data set accordingly); disaggregation and re-aggregation (the process of breaking down videos in their different components, for example, scenes or frames, and re-aggregate them into a visual arrangement that facilitates analysis); and readability (visualising video collections in such a way that researchers can make useful observations of the whole). This approach takes visual elements as the main focus and point of departure and explores how these elements interact with other modes of communication, including text and sound. Second, we present one case study aimed at understanding what type of content and, more specifically, gender representations, TikTok users are exposed to when navigating the platform. To do this, we rely on a data set representing users’ ‘media diets’, obtained via data donations. The case study is articulated in three steps, each representing an opportunity to showcase the enriching process and introduce three types of enriched metapicture: the megapicture, the scene-by-scene timeline, and the video stack.
We are not the first scholars to engage with methods for analysing visual (e.g. Manovich, 2012b; Niederer, 2018; Pearce et al., 2020) or audio-visual content (e.g. Geboers and Pilipets, 2024; Hautea et al., 2021). However, we propose a meso-level methodological approach, positioned between qualitative content analysis and in-depth video description and computational measurements and labelling. In this sense, our methodological outlook is ‘quali-quanti’ (Venturini and Latour, 2010) and in line with recent ‘holistic’ approaches to visual research (Özkula et al., 2024), as we propose an initial computationally-oriented filtering and compositing step to provide material for a more qualitative and interpretative second part of the analysis. One of our goals is to illustrate how the size of a data set affords particular types of analysis while precluding others. To this end, we present three examples for differently sized data sets – 1,000+, 100 or 10 TikTok videos. Our approach also serves as an opportunity to discuss how one can best think about visual analysis methods from the perspective of the data that is to be analysed – in other words, with attention to the ‘ontology of the case’ (Uprichard, 2013: 2), that is, the researcher’s understanding of what the objects in such a data set represent and what findings they are capable of helping emerge from an analysis.
While in this article we focus particularly on TikTok, none of the challenges of analysing video content are unique to TikTok in themselves. Snapchat and Instagram Stories are other examples of platforms that focus on highly visual and dynamic content (Burnell et al., 2022), while Douyin (TikTok’s Chinese counterpart) (Kaye et al., 2021) and YouTube Shorts centre on short video content. Our goal is not to present the methods discussed in this article as only suited to TikTok or as emerging from TikTok’s specific affordances; if they are useful for the study of other, similar platforms, all the better. But even if TikTok is not particularly unique in its features, its emphasis on algorithmic curation conversely de-emphasises the social graph that is so important to other social media platforms, instead foregrounding what the company itself describes as ‘the content graph’ (O’Brien, 2021). Arguably this makes TikTok attractive for propaganda purposes, the spread of misinformation, or generally the promotion of potentially problematic content, which can easily reach millions of people even if they are not explicitly following the author of said content (e.g. Ostrovsky and Chen, 2020; Weimann and Masri, 2023). The need to develop methods suitable to analyse content on this platform is therefore particularly urgent.
Researching audio-visual content: the state of the art
Existing research has so far offered various strategies to address the complexities of analysing audio-visual content on social media, addressing, among other things, short videos’ ephemerality, information richness, networkedness, and multimodality.
In contrast to the analysis of longer videos typically found on platforms like YouTube, scholars have examined short videos like Instagram Stories to underline the ephemerality of this content (Bainotti et al., 2021). Audio-visual content is available for a limited amount of time on Snapchat or Instagram, but in practice also transient on platforms like TikTok/Douyin, due to videos’ limited permanence on the FY page and their volatile visibility orchestrated by platforms’ algorithmic curation (Caliandro et al., 2024). TikTok’s specific affordances and features, such as its user-friendly interface, the emphasis on memetic behaviour, and the possibility to add sounds and filters, influence both its user demographics (which is skewed towards Gen Z users) and the type of content produced (see, for example, Zulli and Zulli, 2020). Unlike the polished aesthetics of Instagram, TikTok fosters the creation of more spontaneous and ‘raw’ content, which makes it also different from other forms of video content, such as YouTube videos. In addition, TikTok videos differ from traditional forms of film and storytelling in both form and function, as they prioritise brevity, fragmentation and open-endedness over conventional narrative structures (see, for example, Georgakopoulou, 2017), and their production adheres to the logic of algorithmic visibility and post-based virality (Abidin, 2021; Klug et al., 2021). These features encourage spontaneous and participatory performances, blurring the lines between ‘live performance, embodiedness, theatricality, and digital culture’ (Boffone, 2022: 42). Therefore, even if content on these platforms takes the shape of videos, these are a specific type of video and thus require a corresponding methodological approach, different from how the moving image has more traditionally been analysed in other fields, like film studies.
Another characteristic of video content is its information richness, attributed to the high level of detail in terms of content, visual elements (such as resolution and colours), as well as temporal dynamics like pacing, editing, and the sequencing and presentation of information over time and across multiple formats (or modes). To account for this richness, scholars like Manovich (2013) have used a combination of computational methods and visual arrangements of film frames to detect patterns in editing, composition, and movement in cinematic works. Along these lines, computer vision and machine learning are increasingly used to compute visual features (e.g. brightness, tempo, or video length) and classify video data (Chen et al., 2022; Nyhuis et al., 2021). Similar techniques have been adopted in the field of media studies, where established methods of computer vision labelling used for image analysis (Colombo et al., 2023; Geboers and Van De Wiele, 2020) are translated to the study of video content (Bainotti et al., 2022). Hybrid video analysis techniques that combine automated extraction of audio-visual features with manual content analysis are also emerging to understand the nuances in content and communication strategies (Lu and Shen, 2023).
Researchers also need to account for the networkedness of short-video content online which, like digital images, can be considered as nodes of a network composed of broader arrangements of users and platforms, connected by hashtags, comments, likes, shares, and algorithmic recommendations (Niederer, 2018). To this end, several research projects have adopted a Digital Methods (Rogers, 2013) approach to analyse the role-played by TikTok’s affordances, such as the ‘sound’ and ‘sound-linking’ features, in fostering the creation of soundscapes and participatory propaganda (Geboers and Pilipets, 2024), or to look at how practices of hashtagging and duetting contribute to the formation of gestural assemblages (Pilipets, 2023). Such approaches take the ‘methods of the medium’ (Rogers, 2013) as a starting point, considering the medium on which the object is published (e.g. TikTok, the social media platform) in addition to the medium of the object itself (e.g. video).
Furthermore, researching audio-visual content commonly grapples with addressing its multimodality. A multimodal approach requires considering the interplay of various modes of communication, rather than treating them as discrete and separate elements (Kress and Van Leeuwen, 2020 [2006]). Several contributions address the multimodality of TikTok from a semiotic perspective, analysing the entanglements of body movements, voice and sound (Ramati and Abeliovich, 2022) and the intertextual meanings embedded into TikTok videos (Han and Zappavigna, 2024). Research has also been using qualitative methods, and specifically multimodal content analysis, to understand various phenomena on TikTok/Douyin, including issues of invisibility in the creator economy (Jaramillo-Dent et al., 2022), the formation of affective publics around climate activism (Hautea et al., 2021), and the features of fact-checking videos (Lu and Shen, 2023). In light of these challenges, this article embraces the need for a networked and multimodal approach to the study of collections of videos and presents a methodological perspective that combines attention to integrated texts (Kress and Van Leeuwen, 2020 [2006]) with the relevance of analysing audio-visual content en group (Colombo, 2018). Despite the abundance of studies and approaches outlined above, a meso-level approach – positioned between qualitative content analysis and in-depth video description, and computational measurements and labelling – has only recently started to be systematically developed (e.g. Özkula et al., 2024).
To fill this gap, we aim to provide an approach that retains videos as such in the analysis as much as possible, rather than rendering them as data points, labels, or qualitative codes, and organises them in an ‘enriched’ version of the metapicture. Such an enrichment enables researchers to analyse video collections and focus on how visual content intersects with audio and textual elements. In what follows, we present our understanding of what the ‘metapicture’ and ‘enriching’ it means and, second, we provide three practical principles to orient the creation and interpretation of the enriched metapicture: metadating, aggregating and reaggregating, and readability.
Enriching the metapicture
The term ‘metapicture’ was coined by scholar W.J.T. Mitchell (1995) to refer to a picture that is ‘used to show what a picture is’ (p. 35). This concept brings forward the idea of using ‘pictures’, understood as both visual aids and figurative metaphors, to stimulate a meta reflection on what pictures are, how they function, and the context in which they are located (Mitchell, 1995). The metapicture has proved a useful heuristic to analyse visual content and visual social media (like Instagram), as it represents an instrument to group and visualise images in a way that enables critical reflection (Rogers, 2021). The metapicture thus has a dual nature, as it represents both an arrangement of visual elements and a critical process of interpretation, which can be called a ‘metapicturing’ process. As such, it is not the final outcome of the research, but a constitutive element of the analysis. Positioned between ‘qualitative visual analysis and interpretation’ and ‘quantitative knowledge visualization’ (Rogers, 2021: 1), the metapicture is helpful to analyse social media images in groups, rather than individually (Colombo, 2018), and allows researchers to study platform-specific vernaculars (Gibbs et al., 2015), as well as the circulation and remixing of visual content across forms, formats, and platforms (Colombo et al., 2023).
Despite its advantages, however, the heuristic of the metapicture has not yet been fully adapted to the study of video collections and used to account for the complexities of audio-visual content. Building on the dual nature of the metapicture, we present an approach aimed at enriching the metapicture and thereby producing what can be considered an enriched metapicture. In our understanding, ‘enriching’ means to enhance the metapicture in such a way that it allows researchers to (a) capture, display and interpret the dynamism and information richness of moving images; and (b) account for the multiple modes of communication and layers of meaning inherent to audio-visual content.
First, enriching the metapicture is a way of capturing and interpreting the complexities of dynamic video content, including sounds, gestures, and the ‘sequencing’ of content, in a way that allows investigation. In this sense, enriching the metapicture shares some similarities with other mechanisms of enriching data. 1 Among these, practices of transcription are often used in multimodal research to translate layered phenomena or texts (such as social interactions, films, or TV programmes) and ‘fix’ their transient elements, in a way that makes them accessible to the researcher (Bateman et al., 2017). This process enriches the data by providing additional contextual information and rendering transient and fleeting elements into a format suitable for analysis. Similarly, in film studies, transcriptions are used to create film protocols where the analysed film is dissected into shots, scenes or frames that are then organised into tables to highlight their main features (Baldry and Thibault, 2006). In these cases, which share similarities with Manovich’s (2013) work, video content is remediated from a dynamic and audiovisual canvas to a static, visuo-spatial one. Notably, each transcription is also an instance of transmodal translation, a process where content is converted from one mode to another and a text is rendered into a different format (e.g. translating video content into static images, or sound into text) (Bateman et al., 2017). Drawing on this literature, we can consider the enriched metapicture as a heuristic and visualisation technique that allows researchers to make dynamic, visual content intelligible and interpretable.
Second, enrichment is a process for simultaneously analysing multiple layers of a text and integrating visual elements with other modes of communication, thereby addressing the multimodality of audio-visual content. As Bateman et al. (2017) further note, a transcription is rarely ‘a simple transmodal reconstruction of the originating data, but represents instead a first step up on a level of analytic abstraction that is intended to support positively the search for meaning-bearing patterns’ (p. 148). Similarly, the enriched metapicture is a selection of elements and modalities from the original videos that are combined and rearranged to facilitate comparison, analysis, and reflection. Notably, multimodality is a dynamic and relational ensemble, where meaning arises not from isolated layers (visual, aural, textual, gestural) but from their interaction (Kress and Van Leeuwen, 2006). In this context, enriching the metapicture is not merely about adding analytical layers, but about understanding how these modes intersect to produce complex texts. This is especially true for moving images like TikTok videos, where meaning is often generated through the interplay of diverse elements and is conveyed through devices such as irony or metaphor.
Nevertheless, it is important to note that in processes of both transcoding and enriching, some elements and modalities of the original text get inevitably lost (Jewitt et al., 2016). While losing information and nuance in data is undoubtedly an issue, it is also true that to perform an effective multimodal analysis, the researcher should filter and focus on specific aspects to prevent an overflow of information that becomes difficult to analyse comprehensively. Therefore, enriching the metapicture also means choosing the communication modes most relevant to include in the metapicture, and to balance the level of detail with the breadth of the data included, so as to provide a meaningful answer to the research questions guiding the study, as we will address in the next section.
Three principles to enrich the metapicture
At a more practical level, the metapicture can be constructed and interpreted by following three main principles: metadating, aggregating and disaggregating, and readability, which can be applied to the creation of different types of enriched metapicture.
In the first phase, metadating, the researcher uses metadata, that is, data about data (Manovich, 2002). While metadata adds another layer and modality to the analysis of audio-visual content, it is also useful for orienting the construction of the metapicture. In fact, ‘ordering images alongside platform data [. . .] “stabilizes” images as their networked meaning and intent – for a given moment in time – can be “captured” and read’. (Geboers, 2022: 85). While existing research has already acknowledged the importance of using metadata (such as likes, play or share counts, or date) to sort, rank, and filter content for social media research (see, for example, Pearce et al., 2020; Pilipets, 2023), the metadating process becomes particularly relevant for the study of video content given the information-richness that come with the multimodality of video content. In this sense, the metadating phase is not only useful for sorting content but also for preliminarily selecting the various modes of communication to integrate into the enriched metapicture. Metadata provides relevant information about sounds (with data about music names, music authors, etc.), texts (with hashtags, captions or stickers), and other modes of communication specific to each platform and its affordances (such as stitches and duets for TikTok). The metadating process thus also prompts reflection on what enriching means: it does not necessarily mean only adding multiple layers of analysis, but also selecting and filtering the ones most relevant to answering the research question.
The second principle for enriching the metapicture is disaggregation and re-aggregation. To facilitate the analysis of video collections, it is helpful to break down video content into its main components (e.g. scenes or frames) and then reassemble them into a structure that can be systematically investigated. Like transmodal translation (Bateman et al., 2017), this process facilitates the analysis of video content by ‘translating’ moving images into a static format. Depending on the research question and the size of the data, the researcher can decide to select and visualise specific frames (see Step 1) or display a collection of videos as a montage of their various scenes (we call this metapicture a ‘scene-by-scene’ timeline, see Step 2). It is also possible to ‘stack’ a subset of videos with the same background sound on top of each other to foreground the relation between visual patterns and sounds (see Step 3). Thanks to the process of disaggregation and re-aggregation, it is possible to create enriched metapictures that showcase how visual, textual and audio elements interact in meaning production.
Finally, we position the enriched metapicture explicitly as an object to be read by a human observer; the goal is for it to be a re-aggregation of a data set that is amenable to interpretation and observation. As such, an important quality of such an enriched metapicture is that it is ‘readable’ (Schoffelen et al., 2015) or, to borrow a term from user experience design, ‘glanceable’. In UX design, increasing ‘glanceability’ is making an interface’s functionality obvious ‘at a glance’ by ‘reducing detail and extracting essential content’ (Matthews, 2007: 14). We would not want to promise or expect a method that can magically turn a complex data set into a visualisation that requires but a single glance to understand its essence. The goal of the approach presented here is however to re-aggregate a visual data set in such a way that it is at least more readable and easier to understand than the original one, which consists of many separate visual objects, would be.
These principles can be combined to create various types of enriched metapictures, as explained in what follows. By relying on an empirical study of TikTok users’ ‘media diets’ we illustrate how, in practice, the process of enriching the metapicture works, and present three different variations of the enriched metapicture: the megapicture, the scene-by-scene timeline, and the video stack.
Exploring TikTok users’ media diets with enriched metapictures
We present these steps through examples from a case study that aims at investigating what type of content TikTok users consume on the platform, with a specific interest in the various forms of gender representations they are exposed to. Given the abundance of trends that centre around girlhood and content created by and for girls (Chen and Zeng, 2023), we are particularly interested in investigating representations of femininity and on their potential influence on young users in terms of beauty surveillance on one hand (Elias and Gill, 2018), and body acceptance and body positivity on the other (Sastre, 2014).
Research with TikTok data donations is still scarce, but offers relevant opportunities for analysing the content and themes that users actually encounter when navigating the platform (Jurg et al., 2024). Our starting point is a data set containing a sample of TikTok users’ ‘diets’. The dataset was created by asking six high school-age donors to donate their data, acquired by performing a ‘data request’ of TikTok which (among other things) contains a list of all videos they had watched (Espinoza et al., 2022). 2 For the six donors, this added up to roughly 225,000 distinct, publicly available TikTok posts that they had seen during their usage of the app, of which we then acquired the metadata and video files that were available publicly. This provided us with a very large and heterogeneous dataset, suitable for testing and showcasing the process of enriching the metapicture and the resulting visualisations.
The analysis proceeds as follows: first, we introduce the megapicture, a visualisation useful to create a more readable version of the data set and identify trends and thematic clusters. Second, we showcase how, through metadating, we identified relevant perspectives and communication modes for analysis, progressively reducing the size of the data set and increasing the level of detail. We used keywords contained in captions and stickers to create a medium-size data set for the analysis of visual patterns and pattern deviations using scene-by-scene timelines. Finally, sounds were used as an entry point to study audio-visual vernaculars with the video stack techniques.
With this case study, we aim to illustrate how the methodological approach of the enriched metapicture can be applied to empirical research. The three techniques and visualisations presented here demonstrate how to analyse large (~1,000 +), medium (~100), and small (~10) video collections and can be considered sequential steps in the analysis, or used in different combinations, depending on the research question.
The data was managed and analysed with 4CAT (Peeters and Hagen, 2022). While this tool is open source and can be used for replicating the approach discussed below, our methods are not tool-dependent: various types of data collection or processing software could be used to achieve the same outcome, and in some cases, a simple video editing application can be sufficient.
Throughout the research, we paid attention to how to treat data in an ethically sound manner, 3 especially because visual content showcasing users’ bodies and faces is involved. We do not discuss specific users that occur in our data sets and have blurred images in which people might be recognised or else obscured users’ identifiable details, including usernames.
Step 1. Identifying visual clusters in large data sets
In the first step of the analysis, we aim to get a broad overview of the video collection visually, to be able to assess which parts of the data set might be relevant to our research interest and could be further analysed with more qualitative methods. At this stage, we opted to capture a single frame per video, to reduce the amount of visual information one needs to take in at once. Here there is a trade-off between capturing the visual content comprehensively and keeping the amount of visual content manageable. While capturing a frame per scene would more comprehensively reflect the visual styles of the video, by capturing a single frame we greatly reduce the amount of content to be visualised, keeping the resulting metapicture more readable. This raises the question which frame is to be captured. Multiple techniques are available here; one may computationally derive which of all of the video’s frames is the most ‘average’, that is, visually similar to the other frames in the video, the so-called key frame (Truong and Venkatesh, 2007). TikTok also makes it possible for creators to choose a custom image as a ‘cover’ that people see, when, for example, scrolling through a profile page or search results. Such a cover could also be considered a representative image and analysed as either a proxy of the video, or as an object of analysis in itself. We opted for a different approach and used the first frame of the video, with the rationale that we cannot a priori know for how long the donors would have watched each video, but that they would at least have seen the first frame when encountering the video in their feed. We assume this is the interface element through which most TikTok posts are viewed, and thus this most accurately reflects the type of content they were exposed to. Depending on the case and research interest other strategies may be preferable; but it is important to notice that this is a choice that should be informed by the case rather than by what is technically the most convenient.
Having captured these frames, the video data set has been disaggregated into a set of roughly 80,000 images. Given our research focus, we decided to arrange the images into what we call a megapicture, a visualisation similar to a collage (Colombo, 2018) which is useful to provide an overview of the content encountered by TikTok users visually – provided that the collage is sufficiently readable. This way, we aim to ‘map the territory’, visualising the whole into a coherent projection (see, for example, Manovich, 2012a). While such a map will generally still require some interaction to be useful for a researcher – for example by zooming in and out to inspect details or understand the position of an interesting part in the broader picture – such a mapping exercise is one way to increase the ‘readability’ of a data set.
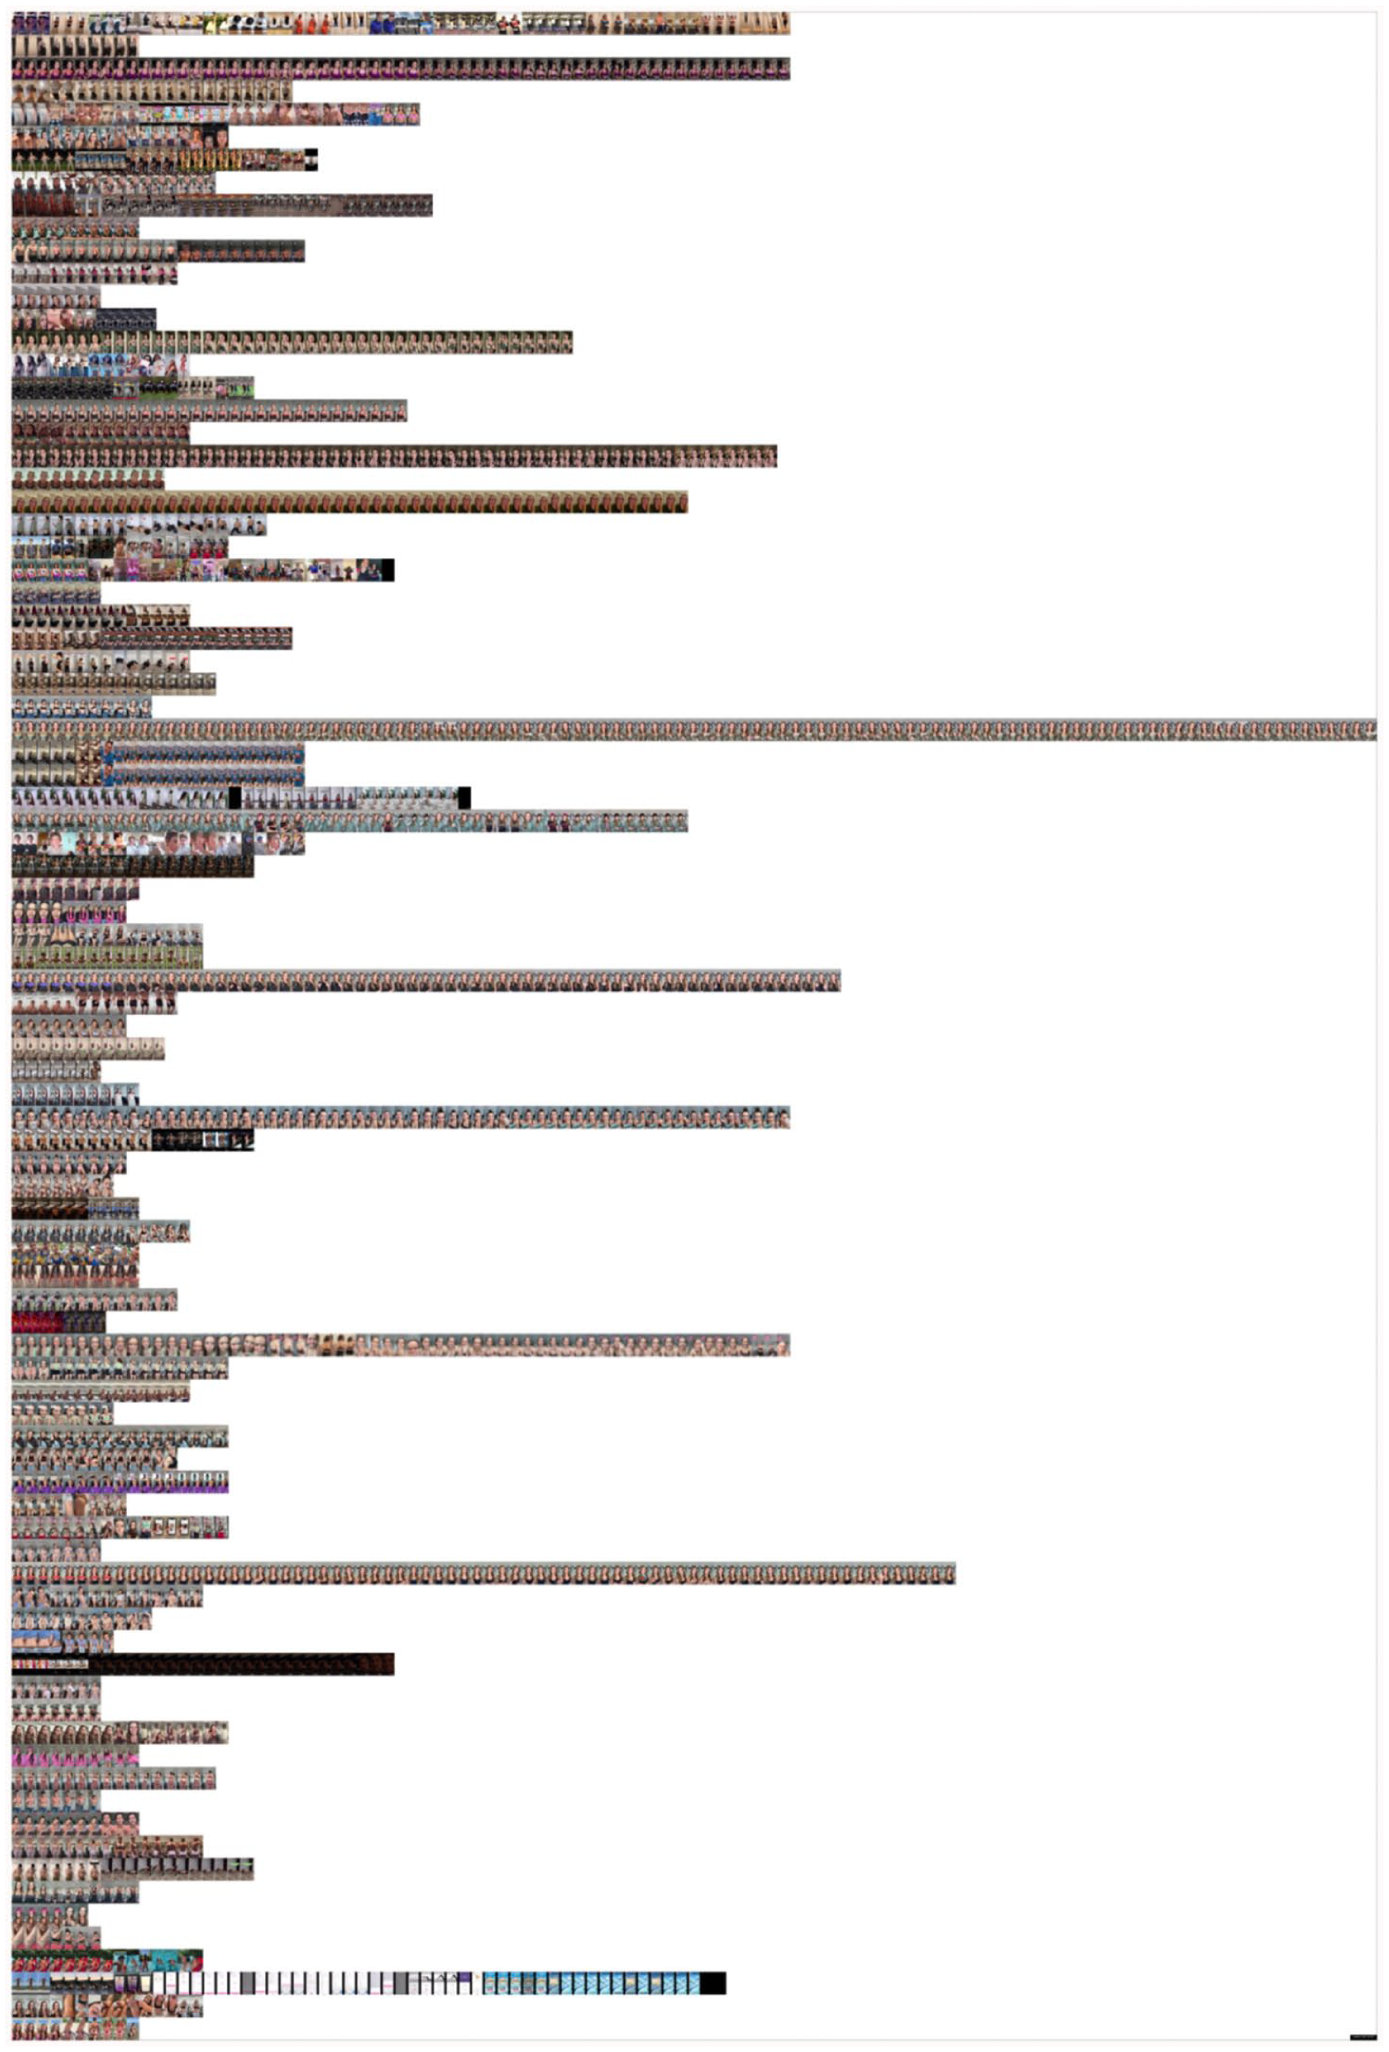
Unlike geographical maps, however, such a map ‘cannot rely on a predefined set of projection rules’ (Venturini et al., 2015: 2) where each city, country or landmark has a physically determined combination of cartesian coordinates which we simply project on a 2D plane in the most convenient way. Rather, and similarly to network visualisation, we can choose a suitable method of ascribing certain coordinates to each item to produce the most readable map possible. In our case, we used PixPlot (Duhaime, 2017), a software package that uses computer vision (specifically, version 3 of the Inception architecture, Szegedy et al., 2015) to determine the prevalence of a given set of pre-trained ‘features’ in a given image. The resulting data can then be plotted in two dimensions according to not just the images’ quantitative similarity but also, for example, the type of objects they contain. In the resulting megapicture (Figure 1), all video first frames are plotted on a 2D canvas based on their feature annotation, allowing for a further interpretation via cluster analysis, with an interest in how frames aggregate in groupings of similar content or, conversely, form ‘structural holes’ (Venturini et al., 2021) that can in themselves be significant.
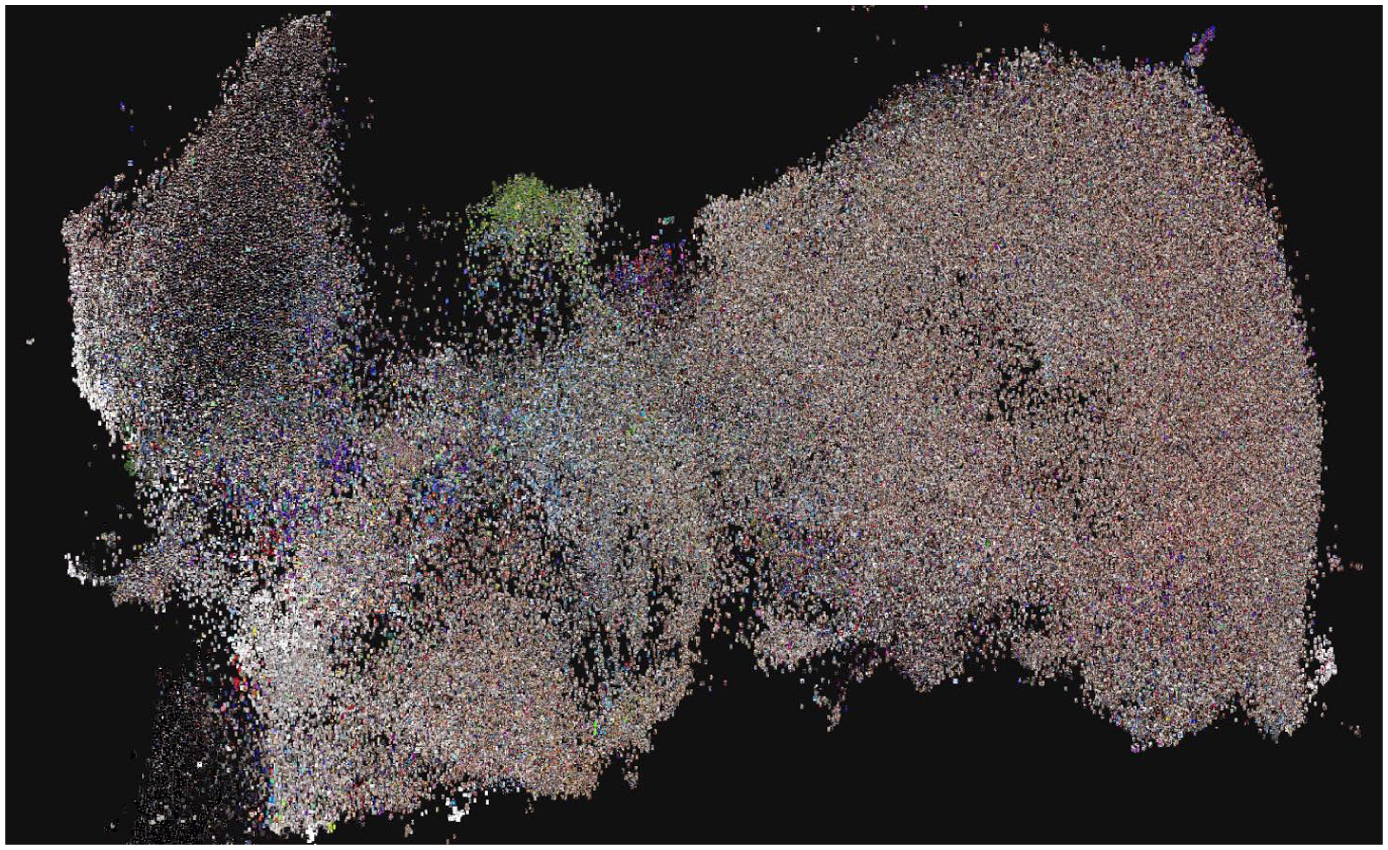
Still frames of TikTok videos from the donated data set, plotted in 2D space as a megapicture using PixPlot.
In this enriched version of the metapicture, clusters are apparent and on closer inspection comprise the same kind of content, providing an idea of what kind of videos the TikTok users in the study are exposed to. For example, we can clearly see clusters of still frames depicting football fields (Figure 2) and black-and-white line art (Figure 3).
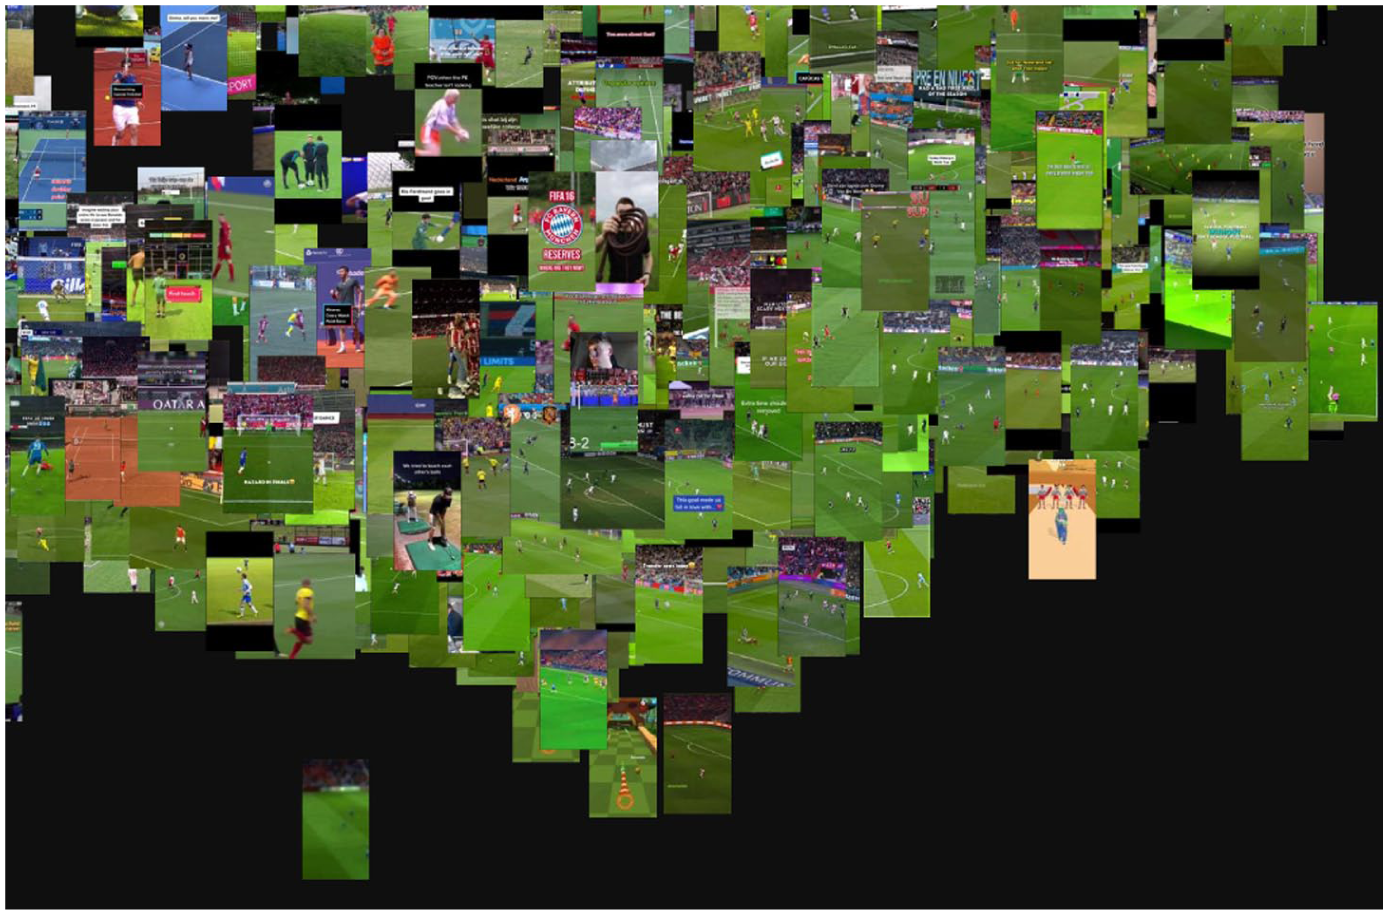
Green images and football fields cluster, close up.
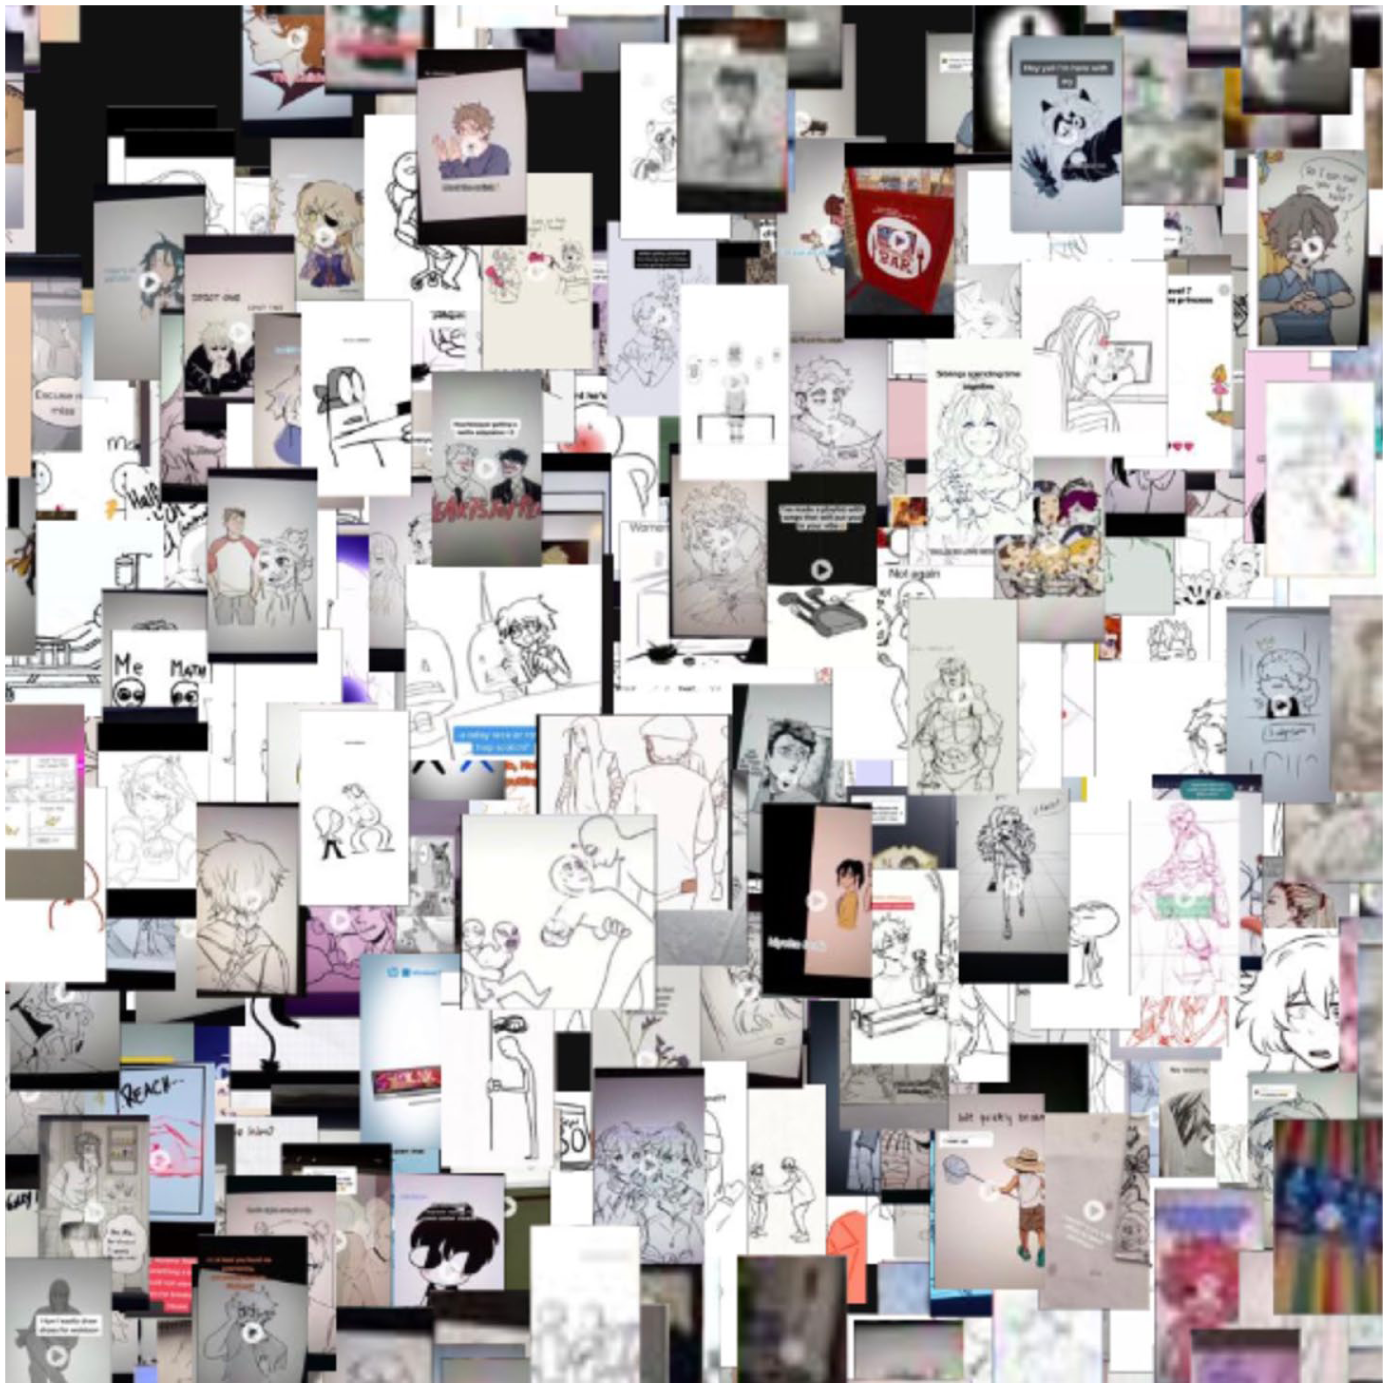
Line art cluster, close up.
The size of the data set requires (inter)active engagement with the visualisation in this case rather than really being able to interpret the data set visually ‘at a glance’. Nevertheless, as with a geographic map, zooming and panning allows one to first get a sense of how content is visually clustered and then zoom in on the relevant clusters to interpret them more specifically. Individual frames can further be annotated with metadata that may be queried by (in PixPlot) clicking the image, further enriching the possibilities for cross-referencing content and correlating it to other structural trends that may be observed through, for example, a co-hashtag analysis. For this specific data set, an analysis of the hashtags therein indeed shows that tags such as ‘art’, ‘animation’, or ‘drawing’ are popular, which matches the prominence of line art in the visualisation.
More interestingly, visual inspection of the megapicture reveals a relatively large cluster of images depicting young women who appear to be particularly thin or who zoomed in on their bellies or arms (Figure 4). On closer analysis, many of these concern weight loss or dieting tips aimed at a young audience, as indicated by the metadata used later to demarcate this subset of the initial data set (see Step 2). However, starting with a visual inspection of the data allows us to find nuance beyond generalised metadata (such as hashtags and keywords) relating to the general practice of dieting. In other words, the visual analysis revealed the gendered and embodied nature whereas a metadata-based hashtag analysis did not readily foreground this aspect of the data set, as the video frames relatively uniformly – and literally – zoom in on thin, young, predominantly female bodies. On TikTok specifically, hashtags are more often used for manipulation of its recommendation algorithm than to accurately describe a video’s content (Klug et al., 2021), making such metadata less suitable for interpretation of data sets.
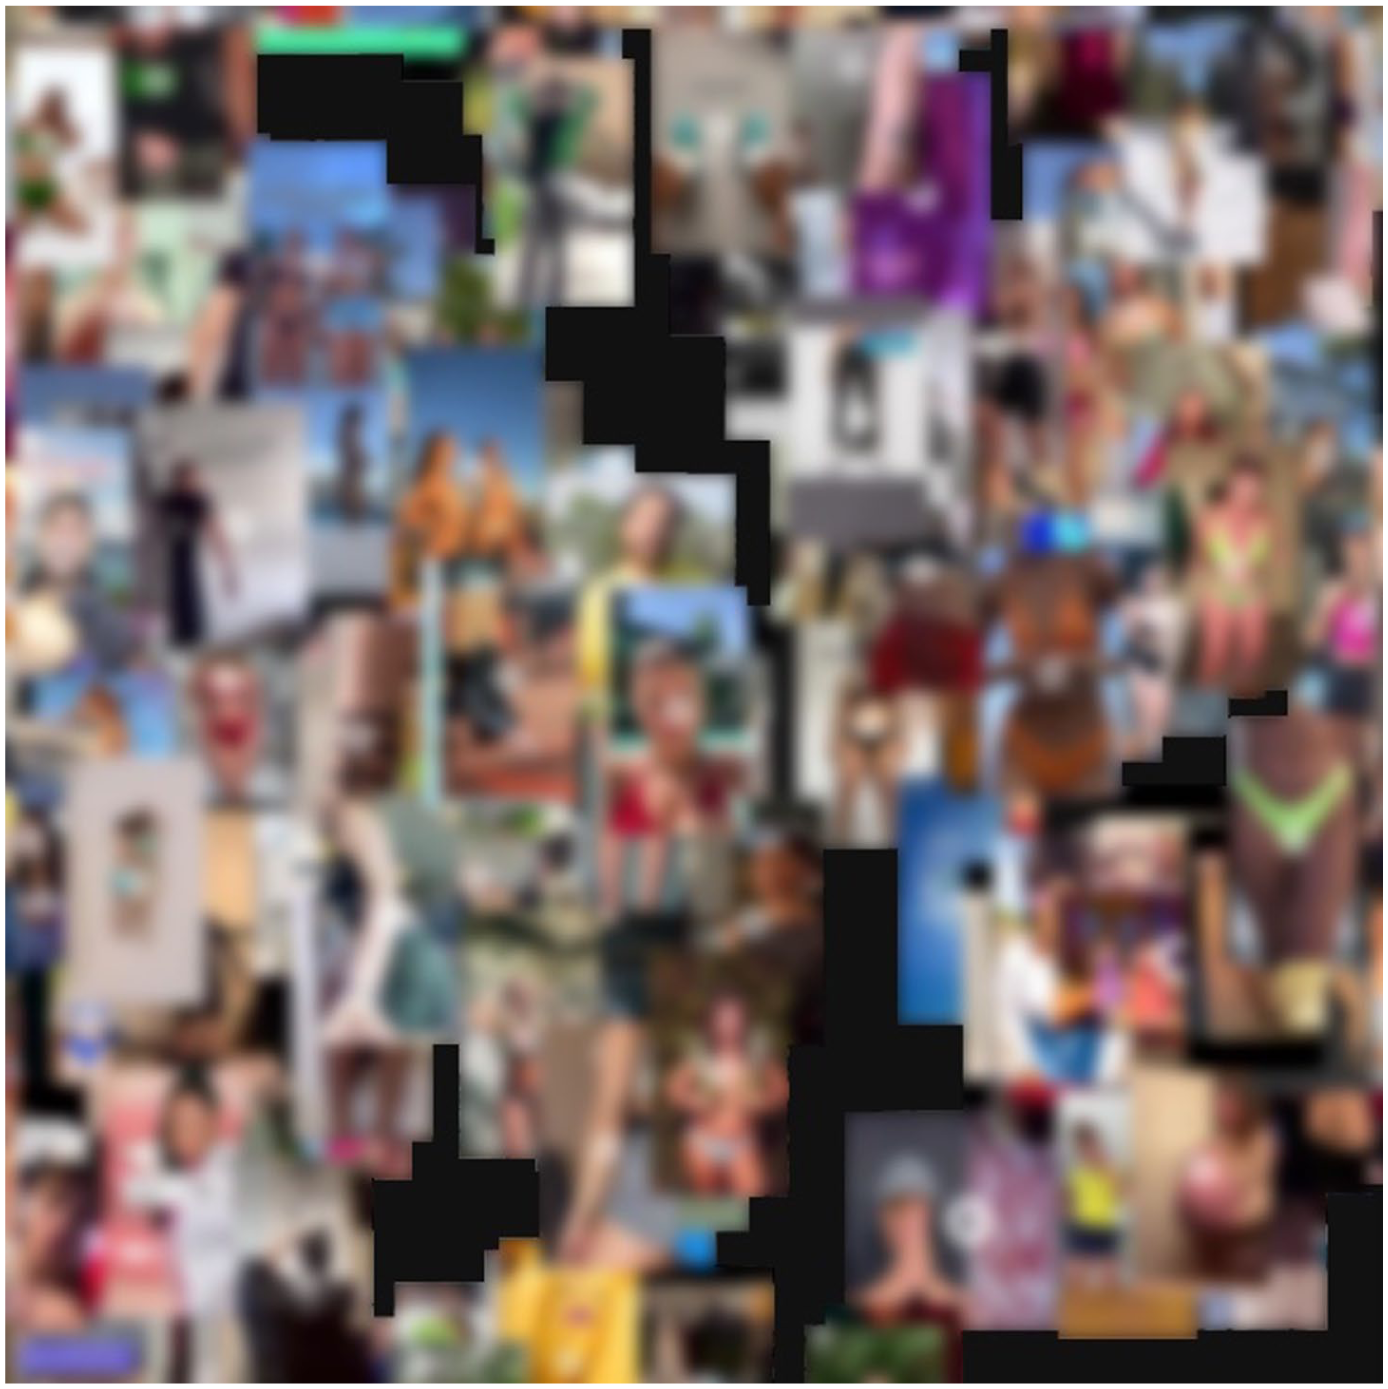
Female bodies cluster, close up.
This is an interesting finding because it touches upon several debates concerning TikTok’s moderation and its efficacy (which is perceived to be lacking; Zeng and Kaye, 2022); the influence of social media on young people’s body image (e.g. Griffiths et al., 2018); and the prevalence of such content in users’ media diets. The visual analysis then also affords an exploration of the data set, next to simply answering a research question, and can be a useful initial exploratory step to discover which analytical directions the data set affords.
Step 2. Analysing visual patterns and pattern deviations with scene-by-scene timelines
After the identification of visual clusters, we decided to further focus on the videos representing female bodies (which correspond to a data set of 14,739 posts), to understand the gender representations users encounter on TikTok and investigate the gender models and stereotypes fostered by this type of content. To do so, we used scene-by-scene timelines, a metapicture that organises and displays a set of videos as a montage of their various scenes. The process of disaggregation and reaggregation clearly emerges here, as visual content is first dissected into scenes and then recomposed as a horizontal collage of selected frames. The metapicture is enriched as it enables the researcher to account for short videos’ visual elements more comprehensively (and not exclusively by considering one selected frame, as shown before) by transposing content from a dynamic to a static format.
For this reason, scene-by-scene timelines are suitable for analysing patterns in (visual) content, as well as deviations from them. More specifically, and along the lines of issue mapping and visual media analysis (Rogers, 2021), one could analyse the dominant visual discourses emerging from the data set as well as what remains marginal or stands out as peculiar compared to the rest of the corpus. Moreover, researchers could analyse the presence and variation of specific visual templates, that is, how different sets of norms and conventions characterising audio-visual content (Leaver et al., 2020) are replicated, modified, or altered by different users, or over time (Caliandro et al., 2024). Finally, scene-by-scene timelines can be used to study intertextuality, understood as the use and remix of pre-existing texts to create TikTok content (see, for example, Han and Zappavigna, 2024). The visual rendering provided by the timelines offers the opportunity to visualise and interpret how various resources, cultural products and memes are transformed and assembled into new texts, and thus highlight a distinctive feature of TikTok content.
Practically speaking, scene-by-scene timelines can conveniently be used with a corpus of around 100 videos – a number that allows for the emergence of patterns in content and visual elements without compromising the readability and interpretation of the metapicture.
In our case study, we started with the metadating process by filtering the data based on keywords identified from our preliminary exploration of captions, hashtags, and building on the results derived from the megapicture. We selected the keywords ‘bodyimage’, ‘fitness’, ‘loss’ and ‘weight’ because these were the most commonly associated with representations of female bodies, which we aimed to investigate further. Building on the principles of query design (Rogers, 2013), we selected qualitatively relevant keywords, instead of the most recurrent ones or the most popular hashtags, as they would have allowed us to answer our research question. This approach addresses the need for accessing content that remains marginal, deviates from peak events (Pilipets, 2023), or is not labelled with popular hashtags, thereby enabling the analysis of otherwise overlooked material, in line with our research question and preliminary findings. Moreover, by focusing on keywords rather than exclusively on hashtags, it is possible to access content starting from a broader range of textual elements surrounding audio-visual content (e.g. captions and stickers), thus accounting for the multimodal nature of TikTok content. By filtering our data using the above-mentioned keywords (found in hashtags, captions and stickers), we obtained a data set of 86 posts. We then proceeded with disaggregating the videos into scenes and re-aggregating them into scene-by-scene timelines (Figure 5).
Scene-by-scene timelines.
By closely reading the enriched metapicture, we can identify three main thematic features of gender representations on TikTok, each of which presents specific patterns in visual elements: body acceptance; body transformation; and body display. Most of the videos in the data set highlight societal expectations and beauty standards and convey messages of self-acceptance and confidence in line with body positivity discourses. This type of ‘body acceptance’ content is visually identifiable by looking at the so-called ‘flaws’ that TikTok users showcase in their posts (hairy arms, cellulitis, or, in users’ words, a ‘full belly’, or ‘these small b00bs’, Figure 6[a]). As such, the videos offer a space for reaffirming one’s confidence and sharing insecurities about body and physical appearance. A recurring theme among these representations is the integration of intertextual elements such as magazine covers or social media representations to showcase the pervasiveness of beauty standards (Figure 6[b]). By stitching their content with these polished and unrealistic images, TikTok users reaffirm their uniqueness despite conventional understandings of femininity.
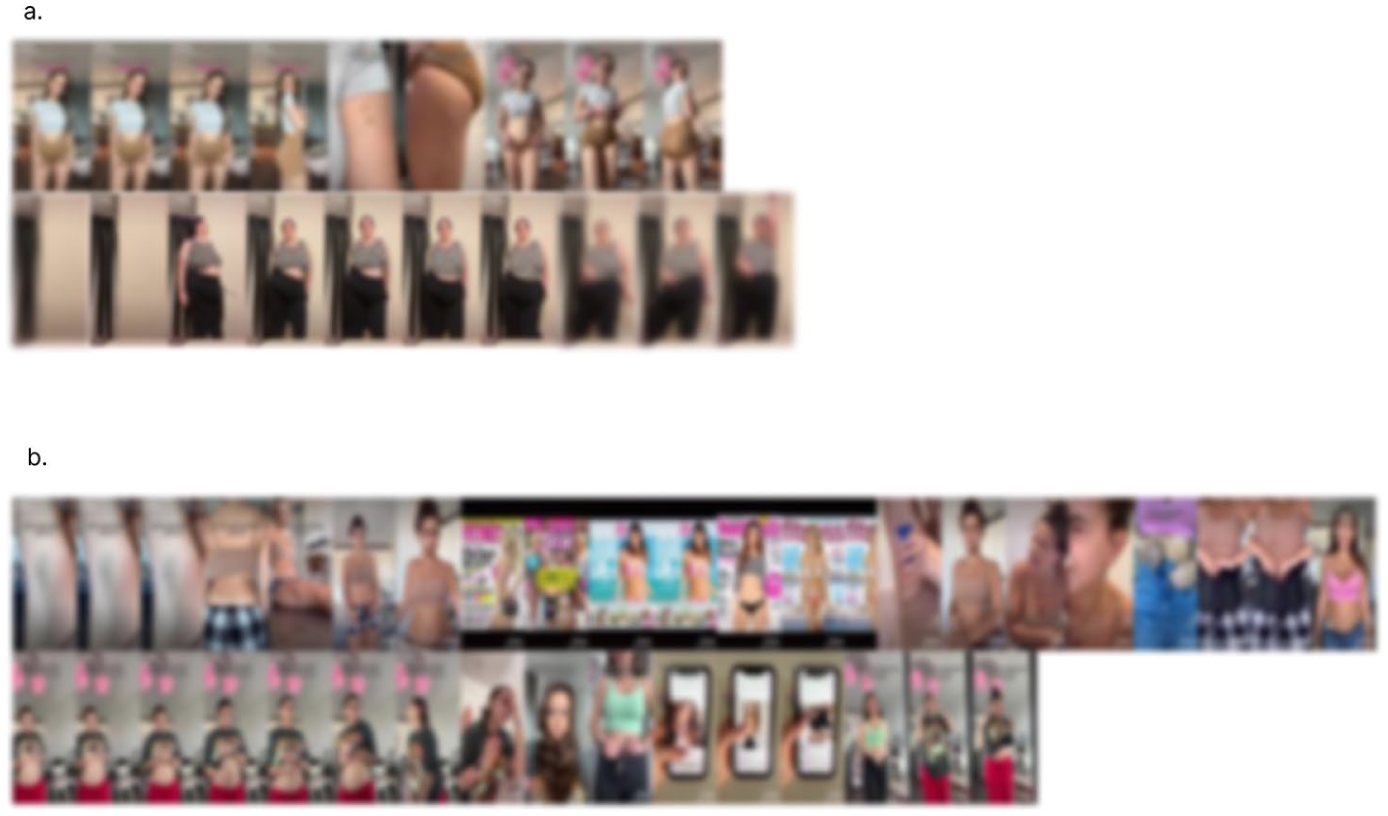
Body acceptance content, close up. Figure 6a shows examples of how users discuss and engage with features typically considered bodily “flaws.” Figure 6b shows how users address and critique the pervasiveness of beauty standards in contemporary culture.
A second pattern is related to ‘body transformation’ content, which, in line with the queries used for selecting the data set, reflects discourses around weight and weight loss. These videos typically feature before-and-after comparisons, showcasing the initial state of the transformation, documenting the process undertaken to achieve their goal, and sharing the related progress or outcome (Figure 7). In our sample, users frame their body transformations in terms of improving health and well-being, as well as within the context of fitness culture.
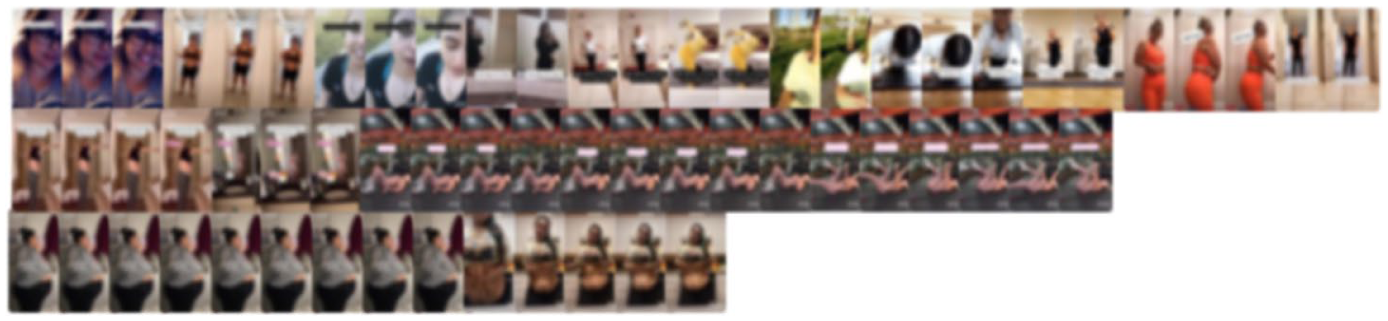
Body transformation content, close up.
Not surprisingly, the display of the body in the context of fitness culture is the third, most common visual pattern emerging from the data. ‘Body display’ content involves the visual representation of individuals in fitness attire, exercising, or at the gym (Figure 8). What was less expected, instead, is the presence of bodies identifiable as male (Figure 8[a]). This insight was facilitated by the format of the scene-by-scene timeline, which proved useful in identifying variations in a data set predominantly featuring female bodies. This way, we were able to gain a broader understanding of gender representations on TikTok, including how specific performances of masculinity are enacted and showcased in the context of fitness and gym culture, particularly through the nurturing and display of muscled bodies.
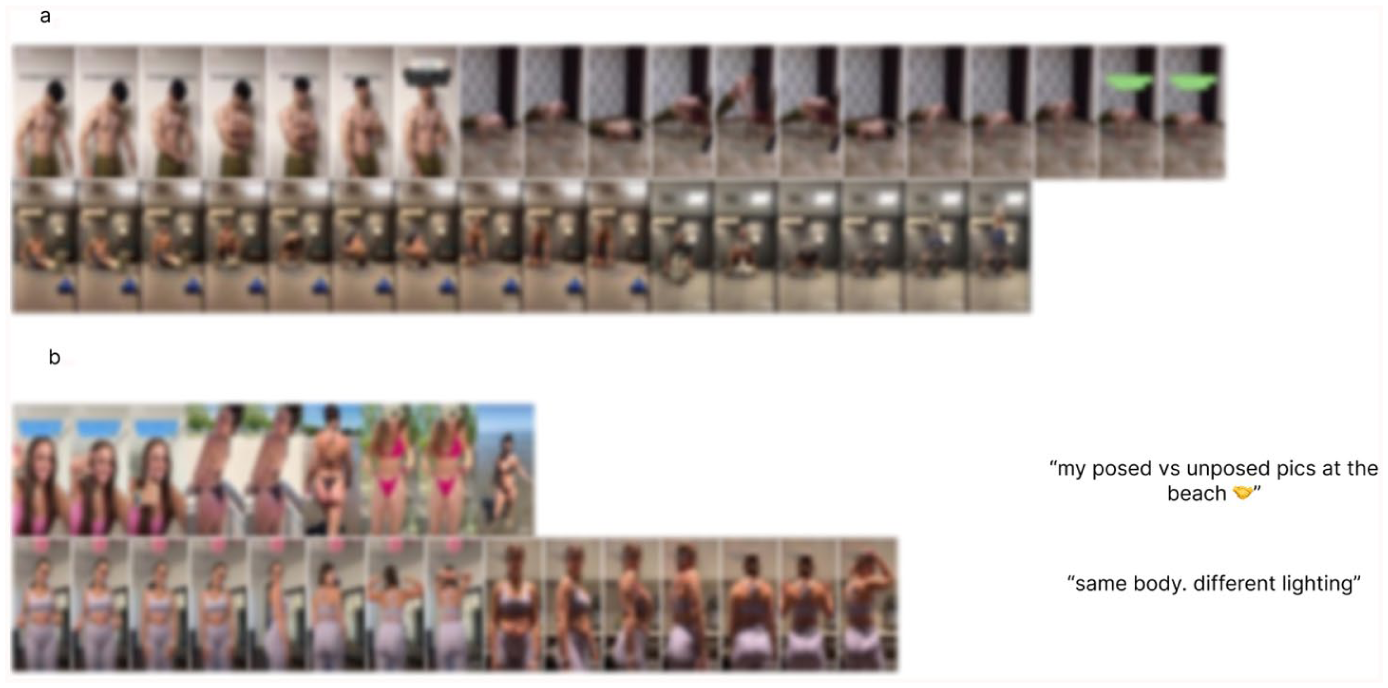
Body display content, close up. Figure 8a illustrates gendered types of body display found in the dataset. Figure 8b shows how users reappropriate the display of their bodies through the use of TikTok stickers.
We also encountered a few videos where the display of the body was aimed at critiquing the beauty standards and rigid expectations imposed on women’s bodies by social media platforms. We would not have been able to get these insights by looking exclusively at visual features, without considering the textual elements users overimpose on their videos in the form of stickers. While existing research has largely leveraged on textual elements, such as captions and hashtags, to make sense of visual content (see, for example, Gibbs et al., 2015), less attention has been paid to textual elements like stickers, which are a peculiar aspect of TikTok’s platform vernacular. It is precisely by combining visual elements and TikTok stickers that we were able to identify ironic discourses, where visual and textual modalities merge to signal users’ reappropriation of their own bodies. Figure 8(b) is an example of how to enrich the metapicture by incorporating stickers, which also shows how users rely on the multimodality allowed by the medium to convey their messages.
The use of scene-by-scene timelines was instrumental in investigating the visual patterns in our data, as well as the emergence of some deviations to these patterns. While we observed a variety of body shapes and a strong focus on (mostly) female insecurities, we did not identify representations related to individuals from the queer community, nor did we find variety in ethnic representations. This suggests that the patterns in TikTok content that users are exposed to are anchored to a predominantly white and binary understanding of gender. In addition, the videos we encountered were not explicitly linked to ‘thinspiration’ content. This may be due to our use of keywords to filter the data, a technique that might not capture subtler practices that navigate the grey areas of TikTok moderation usually put in practice within pro-ana and thinspiration communities (as highlighted by Gerrard, 2018). Scene-by-scene timelines help ‘freeze’ dynamic content in a way that allows for interpretation. While certain elements, such as the dynamic nature of gestures, are lost in these static representations, it is still possible to account for communicative nuances like irony. This can be achieved by combining the analysis of visual elements with accompanying text such as stickers, as our results show.
Step 3. Studying audio-visual vernaculars with video stacks
In the last step, we focused on how TikTok sounds structure the creation of content, and what this can tell us about gender representations, by arranging content in video stacks. This enriched metapicture is inspired by the technique of the image stack, a composite image used to synthesise small sets of visual content by overlaying images on top of each other (Colombo, 2018; Pearce et al., 2020). The video stack follows the same principle, but instead of stacking images, different videos all using the same audio are overlaid on top of each other. The result is an enriched metapicture that captures and displays the dynamism of audio-visual content.
The video stack represents an audio-visual summary of a selection of content, useful for analysing how visual, aural, and textual elements (like stickers), are combined to generate specific platform vernaculars (Abidin and Kaye, 2021; Pearce et al., 2020). Thanks to the possibility of layering of content, stacks are helpful to analyse the memetic aspects of a trend, challenge, or sound and how they are replicated with minor or major variations by the platform’s users. By superimposing videos, it is also possible to analyse motion and gestures, thus putting at the centre of the investigation the gestural dimension of TikTok content and users’ embodied memetic practices (Pilipets, 2023). Finally, video stacks could be used to analyse the duration, pace, and rhythm of TikTok short videos, and how these elements structure the production of content on the platform. Thanks to the audio-visual summary they offer, video stacks allow researchers to visualise and analyse the emergence of similarities and differences in memetic components, gestures, audios, video duration, pace and rhythm in a way that wouldn’t be possible if analysing videos one by one.
In our case study, we used sounds as a second and additional entry point to access another layer of content within the data set and how it intersects with visual content. Particular attention was paid to the emergence of audio-memes and platform vernacular in relation to gender representations. Starting from the cluster of body representations previously identified with the megapicture, we proceeded with a two-step metadating phase to create video stacks. First, we examined the ‘sound names’ metadata to identify recurring sounds within the data set. This initial review allowed us to pinpoint the most popular sounds and, among these, to identify the ones we deemed most closely related to gender and gender representations. Given its explicit reference to girlhood, we decided to focus on the sound ‘Material Girl’, based on Madonna’s song released in 1985 and recently indexed on the platform. By filtering our data for this sound, we created a small data set of 37 posts. We focused on this recurring, yet less popular sound due to its specific relevance to the goal of our study. Again, the number of occurrences does not always equate to greater significance. In fact, most of the popular sounds we found in the data set are used either as background music or as a device to increase the visibility of one’s content (similar to the use of attention-grabbing hashtags).
Once we chose the sound, we sorted our data by play count and selected the top 10 viewed videos, to access the material that reached more people and therefore might resonate the most among the audience. Limiting our focus to 10 videos was driven by our goal to create an enriched metapicture that is at the same time significant and readable. After this process, we created the video stack with 4CAT and applied a colour filter using a video editing application to further protect users’ privacy (Supplemental Video 1.)
By means of the video stack, we can understand how gender representations are shaped and constructed around TikTok trends and challenges. The video showcases that the content associated with the sound differs from the common understanding of the material girl – a person interested in flaunting wealth and displaying a lifestyle rooted in consumption. Instead, the trend offers a playful representation of femininity through a dialogue between past, present, and future versions of the self, and, occasionally, by fostering an intergenerational dialogue. In both cases, stickers play a pivotal role in contextualising users’ self-presentation and narrating their stories, as seen in examples like ‘Pov: you saw your teenage picture and remember your teenage life’ or ‘Grandma! Your old camera . . . Does it still work?’, which appears visible at the beginning of the videos (see Figure 9). The dynamic nature of the stack allows us to grasp the transitions from an ‘imagined present’, where users portray themselves as old or pretend to talk about their grandparents, to an ‘imagined flashback’ through which they share pictures of their young and attractive selves. These transitions underscore an idealised view of femininity centred around youth and physical attractiveness, while also anticipating nostalgic emotions associated with ageing. The results also highlight the role-played by the platform’s affordances to orient the presentation of the self in a memetic way and in fostering specific platform vernaculars, combining stickers, video clips, and pictures with the use of filters.
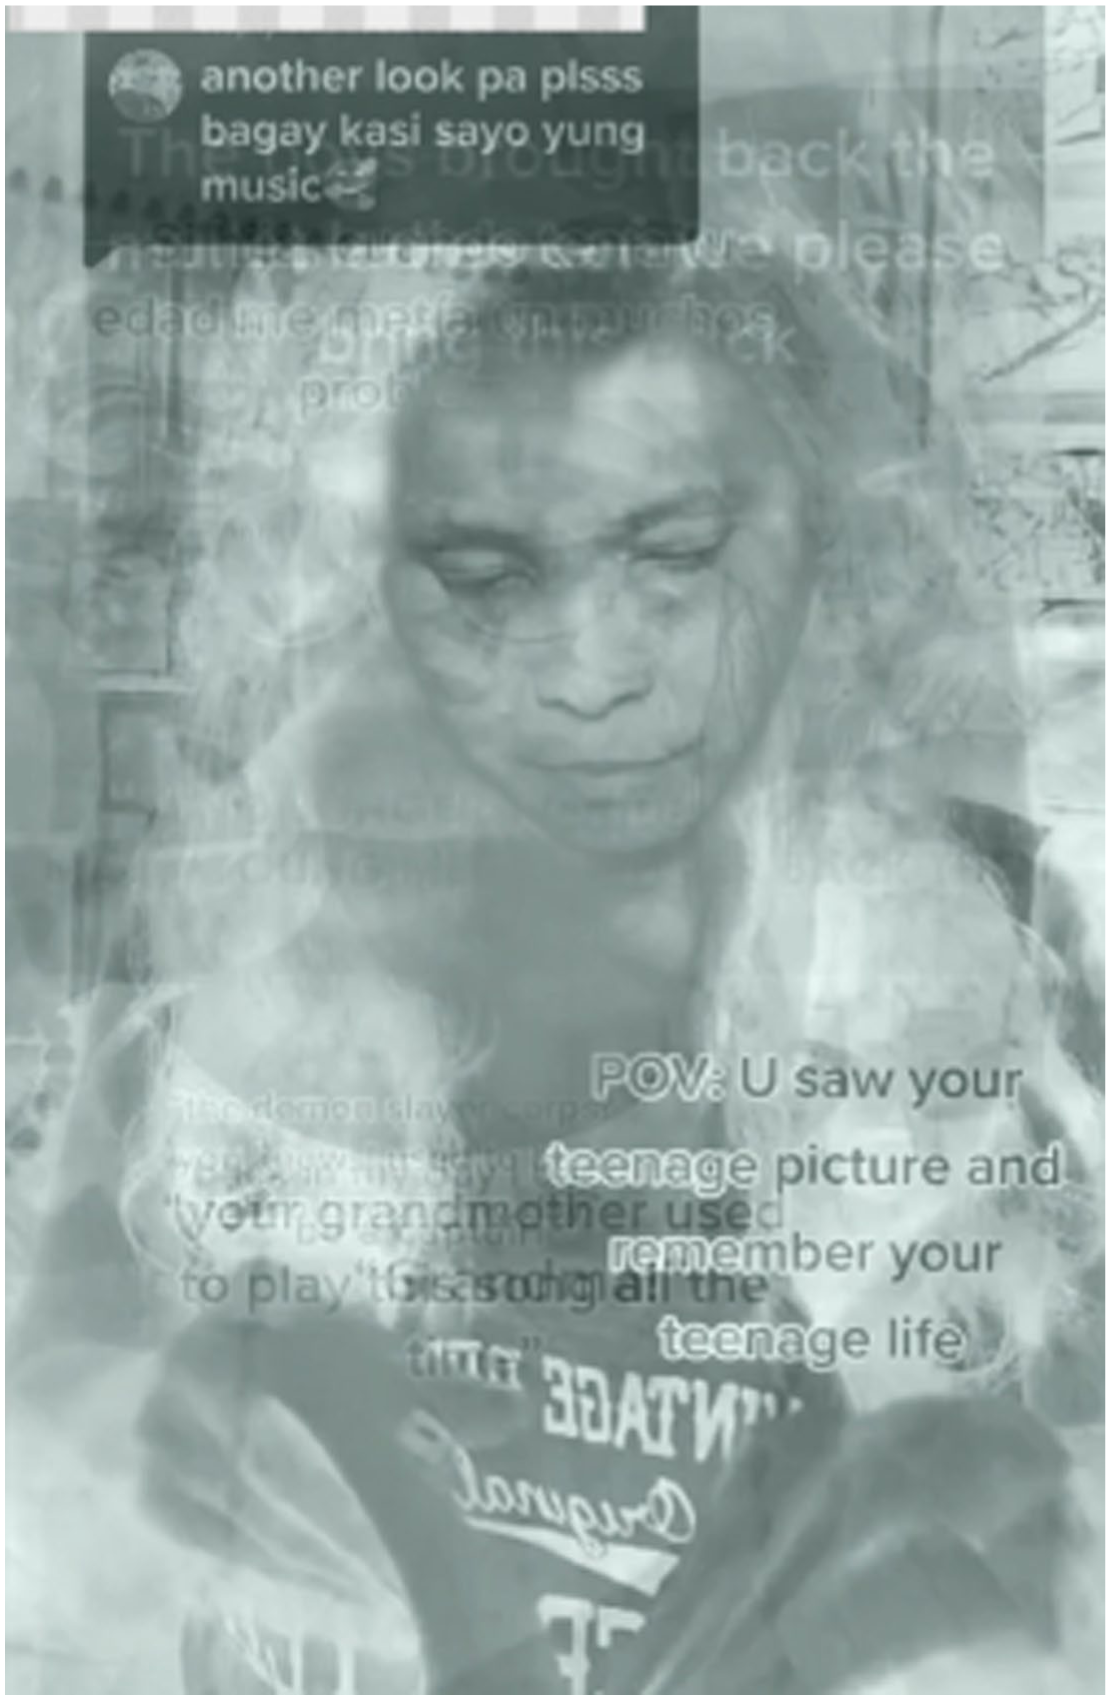
Material girl video stack, first frame.
This empirical application showcases that video stacks are valuable tools for analysing how TikTok audio-visual content is produced and organised around trends and challenges, and, in particular, to highlight how visual and memetic content intersects with audio and gestural elements of video collections. More specifically, this technique enables researchers to examine how the visual, audio, and gestural aspects of video content interact in the process of meaning formation, while also presenting the results in a dynamic format that preserves the medium’s specificity and repurposes it for research. By overimposing video content, this type of metapicture builds on the analytical possibilities offered by analysing visual content en group (Colombo, 2018) and accounts for how TikTok videos are networked through shared sounds and vernaculars (Niederer, 2018). While limited to a small number of videos, video stacks complement our investigation by accounting for the dynamic, multimodal nature of video content and the networked nature of video collections – something that individual video analysis alone couldn’t achieve. In our case study, we created video stacks using videos with the same indexed sound (‘Material Girl’), but it is also possible to stack videos with different sounds, depending on the type of questions and design of the study. In this latter case, video stacks can be primarily used as visual summaries of the selected video collection, since analysing the audio element could potentially lead to confusion and may not be relevant.
Conclusion
In this article, we introduced a methodological approach based on the process of enriching the metapicture, which allows researchers to analyse short video collections by retaining videos as such in the analysis and organising them in an enriched version of the metapicture to address the complexities of (audio-)visual content shared on platforms like TikTok. According to this approach, an enriched metapicture is constructed, first, by using metadata to filter and sort content and, second, by disaggregating and re-aggregating moving images into visual assemblages that allow for their interpretation. This way, and third, it is possible to render a data set of visual material in a manner that is more readable and easier to understand. The article then explored how the enriching process can be applied to empirical research by presenting a case study on what type of content TikTok users consume on the platform, with a specific interest in the various forms of gender representations they are exposed to. Each step of the analysis focused on a particular type of enriched metapicture: the megapicture, the scene-by-scene timeline, and the video stacks, which are primarily useful to account for, respectively, large, medium, and small data sets. These three different approaches can be seen as sequential steps in the analysis, or used in various combinations, depending on the research question.
The main purpose of this contribution is, first, to provide a set of principles that could then be applied in a variety of ways, to different types of short video content, and a multitude of digital platforms. The three types of metapictures, and the rationale behind their creation, can be applied to study audio-visual content on Douyin, YouTube (especially for the analysis of YouTube Shorts), and Instagram, among other platforms. Further, they can be particularly useful for cross-platform analysis, to expand research on how specific platform affordances and vernaculars orient the creation of video content.
Furthermore, the metapictures presented here are only some examples of how video content can be arranged and interpreted starting from a visual dimension and then adding various modes and layers of communication for deeper understanding. Future research, for example, could focus more specifically on aspects that were only marginally addressed in this article, such as the aural dimension of audio-visual material, or other specific platform affordances like TikTok Duets. The methods proposed above can also be useful to advance research on content moderation, particularly given the challenges in moderating moving images and harmful content that is subtly conveyed through gestures or by combining various modes of communication afforded by the platform.
One limitation of the proposed approach lies in its reduced effectiveness for the analysis of long-form video content. In this case, a single frame (as in the case of the megapicture) often fails to account for the complexity or evolving nature of the entire video. In addition, dissecting longer videos into frames and then arranging them into scene-by-scene timelines poses further methodological challenges concerning, for instance, how many frames to select and according to what criteria. Such metapicturing always involves a trade-off between its visual completeness or richness, and its suitability for visual analysis through observation; in larger data sets, using, for example, a single frame as a proxy can be a way to keep the amount of information in the metapicture reasonable, whereas smaller data sets afford richer metapictures.
Second, our goal was to present an approach that facilitates human interpretation of audiovisual data sets of various sizes. It is not our intention to position this approach as inherently superior to, for example, computer-assisted annotation or filtering, methods that have become increasingly popular over the past few years for analysis of this type of data. Rather, the two approaches – human-centric and computer-centric – may be used side-by-side and combined in various ways. For instance, computer vision techniques could provide additional metadata to further filter and arrange audio-video content and image labels and/or web entities detected with Google Vision API could be used to orient processes of disaggregation and reaggregation by selecting all scenes with some particular visual objects instead of others (e.g. filtering and disaggregating all the scenes of a short video representing ‘celebrities’ or ‘Donald Trump’). Therefore, this article contributes to ongoing debates on the need for holistic approaches to visual research that integrate both qualitative and quantitative methods, promoting an understanding of visual data that accounts for their comprehensive, multi-layered, and contextualised nature (Özkula et al., 2024).
Ultimately, with this article, we aimed at illustrating that even with complex and large data sets of audiovisual data, there are methods that allow us to analyse them visually from a birds-eye view without losing sight of the nuances of the content.
Footnotes
Acknowledgements
The authors thank Luuk Ex, Inge de Wolf and Tom Stolp for facilitating access to the data set; the participants of the DMI Winter School 2022 project ‘Tracing the genealogy and change of TikTok audio memes’; and Marloes Geboers and Natalia Sánchez Querubín for their comments on an earlier version of the manuscript.
Funding
The authors disclosed receipt of the following financial support for the research, authorship, and/or publication of this article: The research is supported by SoBigData-PlusPlus, funded by the European Union’s Horizon 2020 research and innovation programme under grant agreement no. 871042, and by the Platform Digitale Infrastructuur Social Science and Humanities (PDI-SSH) through the CAT4SMR project.
Supplemental material
Supplemental material for this article is available online.
Notes
Author biographies
References
Supplementary Material
Please find the following supplemental material available below.
For Open Access articles published under a Creative Commons License, all supplemental material carries the same license as the article it is associated with.
For non-Open Access articles published, all supplemental material carries a non-exclusive license, and permission requests for re-use of supplemental material or any part of supplemental material shall be sent directly to the copyright owner as specified in the copyright notice associated with the article.