
Abstract
Tunnel environments exacerbate the acoustic discomfort of high-speed train passengers, yet traditional evaluation methods fall short in capturing passengers’ true perceptual responses. This study proposes a novel approach integrating electroencephalogram (EEG) signals with subjective annoyance ratings to assess acoustic comfort in tunnel scenarios. A total of 114 noise samples—recorded from real-world high-speed rail operations at speeds ranging from 160–300 km/h under both tunnel and open-line conditions—were replayed to 20 participants in a semi-anechoic chamber. EEG signals were collected using dry electrodes and analyzed through wavelet-based preprocessing, rhythm decomposition, and feature extraction (relative power and sample entropy). Statistical analyses revealed that tunnel noise significantly increases subjective annoyance scores (mean = 7.67 vs. 4.39 in open-line, paired t-test, p < 0.01), which correlated with annoyance across stimuli (Pearson r = 0.79 for β relative power; r = 0.73 for β sample entropy), indicating heightened cognitive stress and emotional agitation. The findings demonstrate that β-rhythm activity serves as a robust indicator of acoustic discomfort, and EEG-based metrics offer objective insights into passenger experience, surpassing traditional sound level assessments. This work provides a foundation for neuro-informed railway noise control strategies and opens new directions for evaluating complex acoustic environments.
1. Introduction
High-speed trains, representing cutting-edge transportation technology, are vital for connecting urban centers in China’s mountainous western regions, where tunnel networks constitute over 50% of rail lines. By 2023, China’s high-speed rail spanned tens of thousands of kilometers, yet tunnel environments exacerbate acoustic challenges, increasing interior noise by 8-10 dB(A) compared to open sections. Acoustic comfort was operationally defined based on two complementary dimensions: (1) a psychoacoustic dimension, characterized by objective metrics such as loudness, sharpness, and roughness; and (2) a subjective dimension, evaluated using an 11-point annoyance scale (0 = perfect comfort, 10 = extreme annoyance), in accordance with ISO/TS 15666:2021. 1 Studies by Livia et al. 2 demonstrate noise’s significant influence on human happiness. Researchers usually improve the acoustic comfort of passengers by controlling the noise in the interior environment and optimizing the noise source and its propagation path that can affect human comfort. In addition, research on high-speed railway noise also shows the importance of effective noise control in high-speed train environment. 3 Yet, traditional metrics like the equivalent continuous A-weighted sound pressure level (LAeq) are deemed insufficient by researchers like Hardy 4 and Letourneaux et al. 5 for capturing passengers’ subjective tolerance of noise, underscoring the need for a more comprehensive approach.
In recent years, electroencephalography (EEG) has been increasingly adopted in neuroscience and environmental‐psychology research to provide objective, physiological measures of human responses to environmental stimuli. For example, Astuti et al. 6 summarized 30 experimental EEG studies on noise-induced cognitive changes and identified consistent alterations in theta and beta bands during exposure to continuous and intermittent noise, highlighting the growing role of EEG in workplace and transportation neuroergonomics. Mohammadi et al. 7 investigated dynamic EEG changes elicited by noise with varying loudness and sharpness, revealing how psychoacoustic parameters modulate time-domain EEG features. Zhang et al. 8 combined EEG and other physiological measures to examine the psychophysiological effects of road traffic noise on college students, confirming strong associations between noise exposure and alterations in α- and β-band power. Ke et al. 9 further demonstrated that both the content and level of construction noise negatively affect attentional load and risk perception, as revealed by EEG metrics such as theta/beta power ratio and frontal asymmetry. Likewise, Low et al. 10 found that broadband transport noise (75 dBA) induces elevated theta activity and subjective fatigue during sustained driving, underscoring the role of theta as a biomarker for environmental-induced drowsiness and attentional lapses. Lashgari et al. 11 recorded EEG from tractor operators under different engine‐noise conditions and found that increasing noise levels significantly raised the fractal complexity of α and β bands, indicating heightened cognitive and emotional stress. Beyond construction and road traffic studies, Peng et al. 12 applied EEG to assess passengers’ overall comfort in actual high-speed trains, revealing that discomfort correlates with beta-band activation in Brodmann areas related to emotional and somatosensory processing. This work supports the feasibility of using EEG as a neural indicator of comfort degradation in real-world railway scenarios. Chen et al. 13 proposed an EEG‐based psychoacoustic‐annoyance index for high‐speed-rail cabins, demonstrating initial correlations between cabin noise and neural activity.
Tunnel environments exhibit unique acoustic phenomena—multiple reflections and standing waves—that render tunnel noise more complex than open‐track noise and potentially induce greater subjective annoyance and cognitive load. While Xing et al. 14 developed a combined physiological-EEG model to assess annoyance among shield-tunneling machine operators, and Mir et al. 15 used EEG to study emotional responses to construction noise, none have directly evaluated passenger EEG responses to real high-speed-rail tunnel noise. Likewise, Astuti et al. employed EEG to link noise exposure with cognitive performance, but their work was confined to simulated environments that do not replicate tunnel acoustics. Frescura et al. 16 showed that neighbour noise in high-rise timber buildings alters EEG α-activity, underscoring the need to explore neural responses in enclosed, reverberant spaces.
Despite established EEG-noise links, the neurophysiological impact of high-speed rail tunnel noise remains unquantified. We will elaborate on its unique acoustic properties (e.g., reverberation, low-frequency emphasis) and hypothesize how these may provoke stronger neural stress than open-air noise, justifying an EEG-based investigation. The novelty of our approach—using real operational noise recordings combined with EEG-entropy analysis—will be clearly positioned to objectively decode passenger experience in this specific, high-stakes environment.
In light of these considerations, this study embarks on an innovative journey to explore the acoustic comfort of high-speed trains within tunnel environments, an under-researched domain. We introduce EEG signals to concurrently gauge the subjective and physiological reactions of passengers to the acoustic milieu of the tunnel. Through meticulous field tests on a Chinese high-speed train, encompassing varied speeds and positions, we collected in-vehicle noise data under both open-line and tunnel conditions. Section 2 details the experimental methodology, including noise recording protocols, participant selection criteria, EEG acquisition procedures, and signal preprocessing techniques. Section 3 presents the results of subjective annoyance evaluations and EEG feature analysis, revealing significant correlations between β-band activity and tunnel-induced cognitive stress. Section 4 critically discusses these findings in the context of existing literature, highlighting the dominance of β-rhythm as a neural marker of acoustic discomfort and addressing limitations such as sample size constraints. Finally, Section 5 synthesizes key conclusions, emphasizing the dual value of EEG biomarkers and psychoacoustic metrics for advancing high-speed rail noise control strategies.
2. Material & methods
To improve clarity and reproducibility, Section 2 describes the complete experimental and analytical pipeline used in this study. Figure 1 provides an overview of the workflow, from in-situ noise acquisition and stimulus preparation to EEG measurement, feature extraction, and statistical validation. The workflow consists of four modules: (1) Noise sample acquisition and preprocessing, where interior noise of a high-speed train is recorded in real operations, followed by sample screening, segmentation/cropping, and the generation of stimulus audio for the listening test; (2) EEG experiment and data collection, including participant recruitment and screening, eyes-open resting-state baseline recording, and synchronized collection of EEG signals and subjective annoyance ratings during stimulus presentation in a semi-anechoic room; (3) EEG signal processing, comprising down-sampling, band-pass/notch filtering and artifact rejection, wavelet-based denoising, rhythm decomposition into δ, θ, α, β, and γ bands, and feature extraction (relative power and sample entropy); and (4) Data analysis and validation, including inter-subject consistency checking of subjective ratings and statistical analyses such as paired comparisons between tunnel and open-line conditions and correlation analysis between EEG indicators and annoyance. Overall workflow of the proposed acoustic comfort evaluation framework.
2.1. Stimuli: Interior noise recordings
According to the provisions of ISO 3381-2021,
17
the measurement points of interior noise were arranged at different positions of the first, third and fifth vehicles respectively, as shown in Figure 2. The symbol “ Interior noise measurement points layout diagram.
2.2. Subjects
Passengers serve as the primary subjects and ultimate evaluators of noise perception in high-speed train cabins. Noise research should focus on ordinary passengers, integrating their auditory and psychological experiences for comprehensive evaluation. The experiment selected 20 non-professional participants (15 males, 5 females), aged 23–30, who were required to meet the following criteria: no hearing impairments, good physical health, stable mental state prior to testing, and frequent high-speed train travel experience. Recent EEG-based studies11,18 on noise and annoyance have used 16 to 24 participants, demonstrating that such sample sizes are sufficient to yield stable and statistically valid results.
Participants were aged 23–30 years, with a monthly high-speed rail (HSR) ridership of ≥2 trips, and all were right-handed. Exclusion criteria included a history of otologic disorders, occupational noise exposure (≥85 dB LAeq,8h), and psychoactive medication use. Neurological screening revealed normal resting-state EEG baselines (5-minute eyes-closed recording) and a Pittsburgh Sleep Quality Index (PSQI) score of ≤5 (indicating normal sleep quality). Demographic data showed a mean pure-tone average (PTA4) of 18.0 ± 3.0 dB HL, confirming normal hearing in all participants.
2.3. Equipment and procedure
Electroencephalography (EEG) provides an objective measure of cortical electrophysiological activity, which is known to correlate with cognitive and affective states such as alertness, fatigue, and irritability. Compared to subjective evaluations that are susceptible to non-acoustic biases, EEG offers a direct window into the neurophysiological responses elicited by acoustic environments. Therefore, we employed EEG to complement subjective annoyance ratings in assessing the acoustic comfort of high-speed train passengers.
2.3.1. Equipment
The subjective assessment of the environment requires as much quiet as possible to reduce the influence of other factors. At the same time, the temperature and humidity are suitable, and there is no irritating odor in the air and other factors that may disturb the subject. The test site for this subjective evaluation was selected in the semi-anechoic chamber. Sound playback equipment uses Sennheiser HD650 HI-FI headphones and B&K ZE0769 sound power amplifier to play back sound samples in high fidelity. EEG signals were acquired using a BIOPAC MP160 system (Goleta, CA) with a BN-ELAT-2 dry electrode headset. The bipolar montage followed the 10-20 system (Fp1 and Fp2 referenced to linked mastoids, ground at Oz). The amplifier features a high input impedance (typically in the range of 1-10 MΩ), a high resolution (16-bit or higher), and configurable gain settings suitable for capturing low-amplitude EEG signals. The electrode montage uses dry electrodes with the positive electrode placed on the temporal lobe for signal collection, the negative electrode on the mastoid behind the ear serving as the reference, and the ground electrode attached to the back of the neck. Dry electrodes were selected to minimize participant discomfort during prolonged testing; their validity for beta-band analysis was confirmed via baseline SNR (>20 dB) and artifact rejection rates (18.7%) comparable to wet electrode standards.19,20 Data were sampled at 1000 Hz. Additionally, a low-pass filter (cutoff frequency set at 100 Hz) was applied to remove high-frequency noise, along with a notch filter at 50 Hz to eliminate power-line interference. The dry electrodes were positioned with the positive electrode over the temporal lobe (approximating the T7/T8 locations of the 10-20 system) and the reference on the ipsilateral mastoid. This montage was selected for three primary reasons: (1) the temporal lobe houses the primary auditory cortex, ensuring direct capture of early cortical responses to acoustic stimuli; (2) its connections to limbic structures (e.g., amygdala) facilitate the concurrent monitoring of emotional processing relevant to noise-induced annoyance, a focus supported by prior studies in traffic noise [Lashgari 11 and Chen 13 ], and (3) the design of the dry-electrode headset prioritizes comfortable and stable coverage of fronto-temporal regions, making this configuration optimal for balancing signal quality, ecological validity (participant comfort during extended testing), and research objectives.
2.3.2. Test duration
Prolonged exposure to a noisy environment increases the irritability of participants, which in turn reduces the accuracy of their evaluations. Consequently, this study strictly controls each participant’s test duration to within 30 minutes (excluding preparation time).
Participants were required to evaluate 114 sound samples, each lasting 5 seconds, totaling 570 seconds (approximately 9.5 minutes). All samples were presented in a randomized order to mitigate order effects. The experiment was divided into three sessions, each containing 38 samples. After each session, participants were given a 5-minute break. The entire experiment was designed to be completed within 30 minutes to minimize fatigue and maintain the accuracy and reliability of the evaluation results.
This study complied with the Declaration of Helsinki and China’s Ethical Review Measures for Biomedical Research Involving Humans (2023), approved by SWJTU Rail Transit Human Factors Ethics Committee (Ref: SWJTU-23011-NSFC(130)). Written informed consent included data anonymization and voluntary withdrawal rights.
2.3.3. Test process
The experiment was conducted in a semi-anechoic chamber to minimize external interference. EEG signals were acquired using a BIOPAC multi-channel physiological system (1,000 Hz sampling rate) with dry electrodes: the positive electrode on the temporal lobe, the reference on the mastoid, and the ground on the back of the neck. Prior to testing, electrode sites were cleaned with alcohol swabs to ensure optimal signal quality. Participants refrained from alcohol and neuroactive substances for 24 hours.
The procedure began with a 5-minute rest to establish baseline physiological states, followed by a 3-minute baseline EEG recording under silent conditions. Researchers explained the protocol thoroughly before testing. During the exposure phase, 114 acoustic samples were played in randomized order across three sessions (38 per session), each lasting 5 minutes. Participants were instructed to maintain a stable posture, avoid excessive head/jaw movement, and minimize blinking during each trial. 5-minute breaks were provided after each block to reduce fatigue-related motion.
After all subjective evaluations, an additional 5-minute stabilization was followed by post-exposure EEG recording, including a 30-second directional acoustic stimulus to assess attentional modulation.
Signal quality was continuously monitored via VIN+/VIN− and GND channels to track environmental interference. Participants maintained a natural sitting posture to reduce motion artifacts. Rest intervals were strictly enforced before each EEG cycle and between sessions. Real-time signal checks enabled immediate correction of anomalies, ensuring high data integrity (Figure 3). EEG testing protocol under noise stimulation.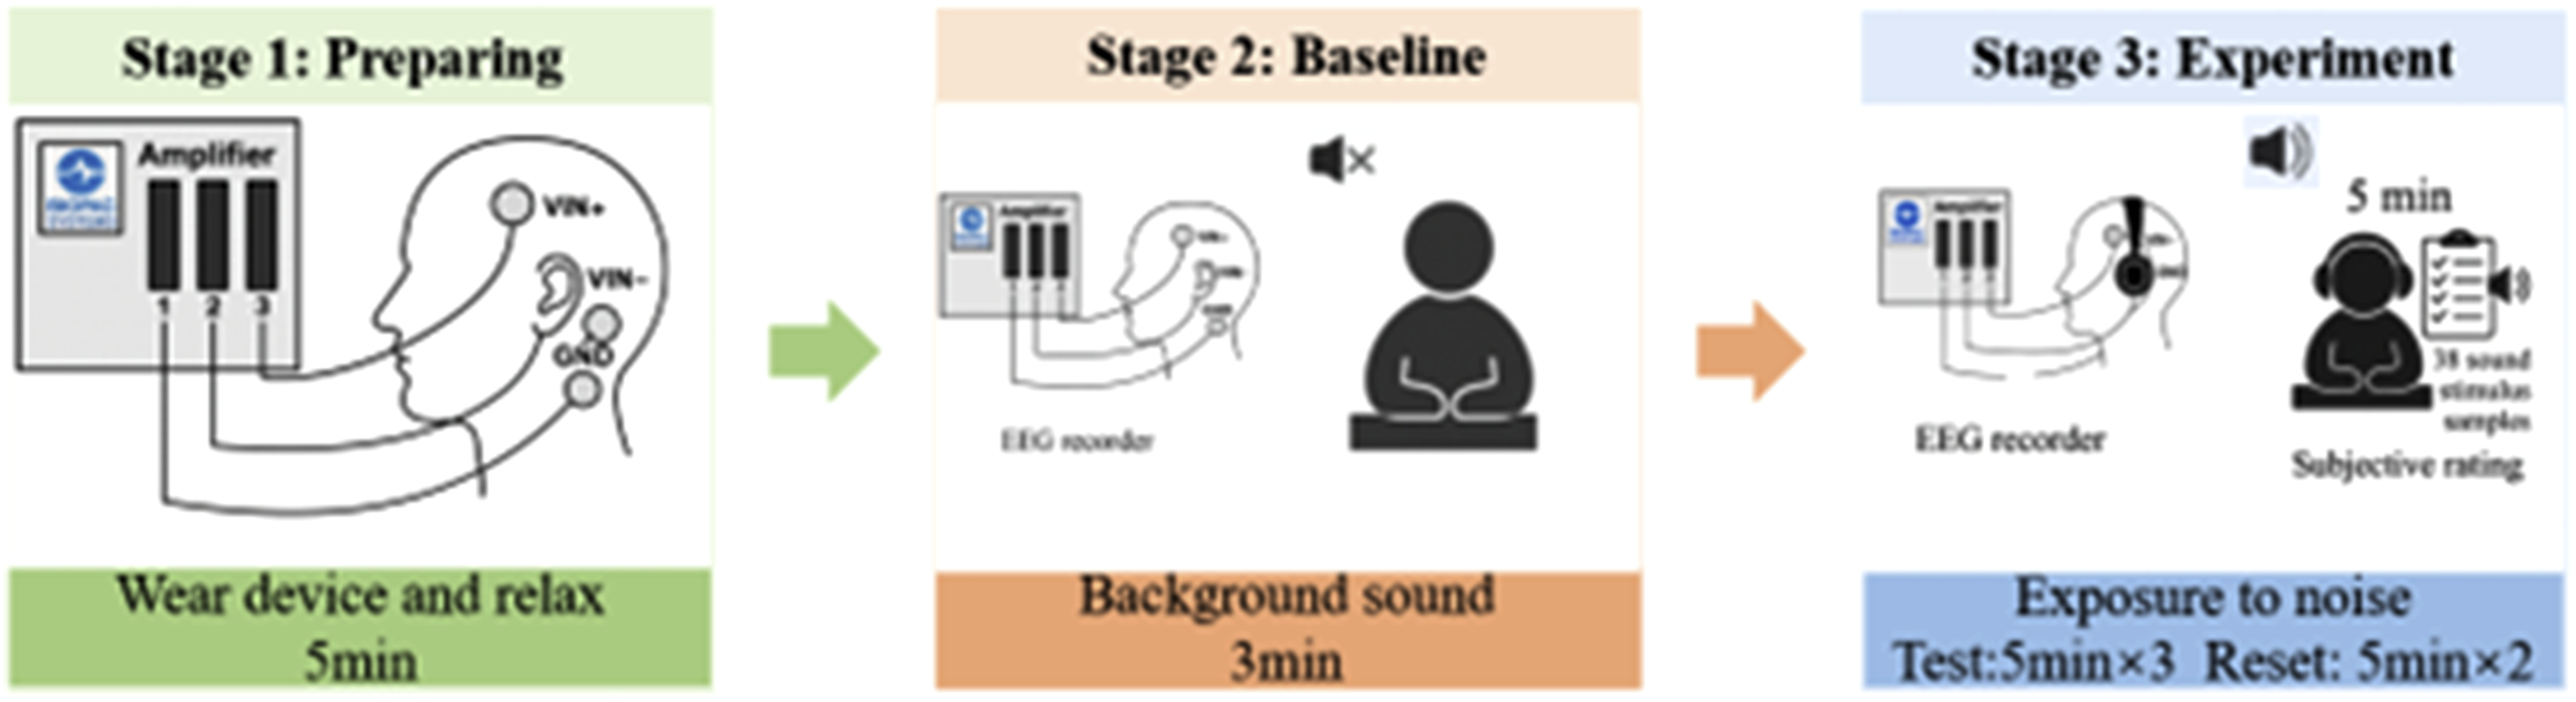
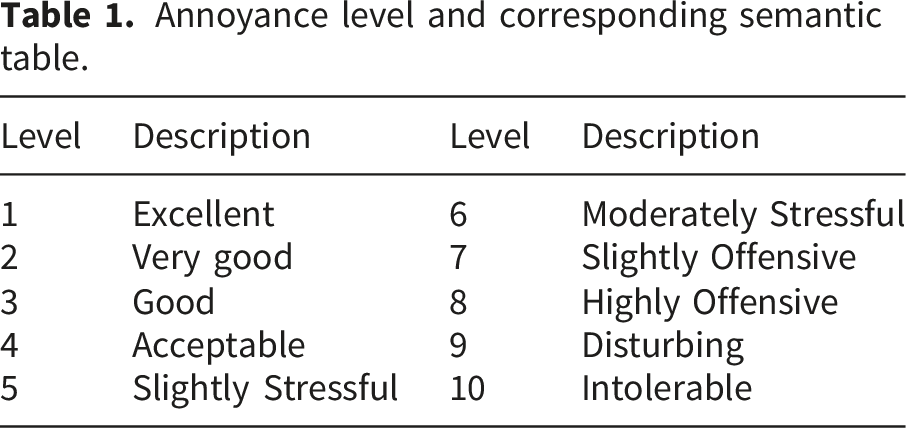
2.4. Data preprocessing
The acquired EEG signals were processed to extract features indicative of acoustic discomfort. The pipeline comprised: (1) signal preprocessing and denoising to enhance data quality; (2) decomposition of the signal into standard frequency rhythms (δ, θ, α, β, γ); (3) extraction of both linear (relative power) and non-linear (sample entropy) features from each rhythm; and (4) time-frequency analysis to examine transient responses. These extracted neural features were then subjected to statistical correlation and regression analysis against the concurrently obtained subjective annoyance scores to identify robust electrophysiological markers.
Annoyance level and corresponding semantic table.
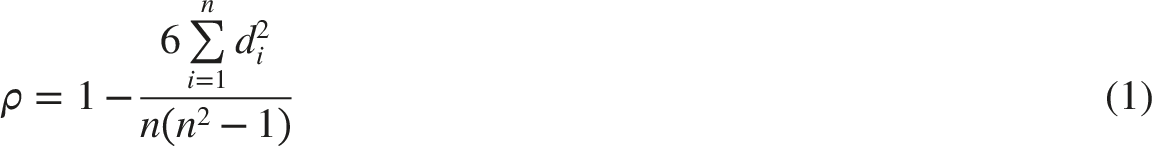
After obtaining the annoyance score of 20 subjects, correlation analysis should be carried out on the evaluation results, Spearman correlation coefficient of each subject and all other subjects was calculated, and the arithmetic average was calculated to be the correlation coefficient of this subject. The calculation formula of Spearman correlation coefficient is as follows.
21
The EEG signals were first down sampled to 512 Hz and then filtered to remove frequency components outside the EEG band of interest using a low-pass/band-pass filter. Power-line contamination was further suppressed using a notch filter.
Motion-related artifacts were mitigated using a multi-stage procedure: (i) standardized participant instructions and experimental design (short trials with regular breaks), (ii) amplitude-based epoch rejection using a ±100 μV criterion, and (iii) ICA-based component removal to suppress residual ocular/motion-related artifacts.
To further suppress broadband/high-frequency noise while preserving rhythm-related activity, we applied a threshold-based stationary wavelet transform (SWT), which omits the decimation step and provides level-dependent coefficients suitable for robust denoising. The parameters for wavelet-based denoising were selected to optimally separate neurophysiological signals from noise. The Daubechies 7-tap wavelet (db7) was chosen as the mother wavelet due to its orthogonal properties, compact support, and its established efficacy in representing the mixed rhythmic and transient features characteristic of EEG signals. An 8-level decomposition depth was applied to align with the dyadic frequency bands of the Discrete Wavelet Transform, ensuring complete and isolated coverage of the standard EEG frequency rhythms (Delta, Theta, Alpha, Beta) for subsequent feature extraction, given our sampling rate. For the thresholding operation, a hard thresholding method was employed, as it is effective for removing additive noise while preserving the amplitude of salient neural events. Detail coefficients at each level were thresholded using hard thresholding with level-dependent thresholds. The noise level and threshold definition, including the robust MAD-based estimation procedure for each level, are provided in Appendix A.
If significant baseline drift was present, a fourth-order polynomial was fitted and removed to detrend the signal prior to feature extraction. Figure 4 presents an example of the denoising pipeline and a comparison between the raw EEG and the denoised EEG. Comparison of EEG signal before and after denoising.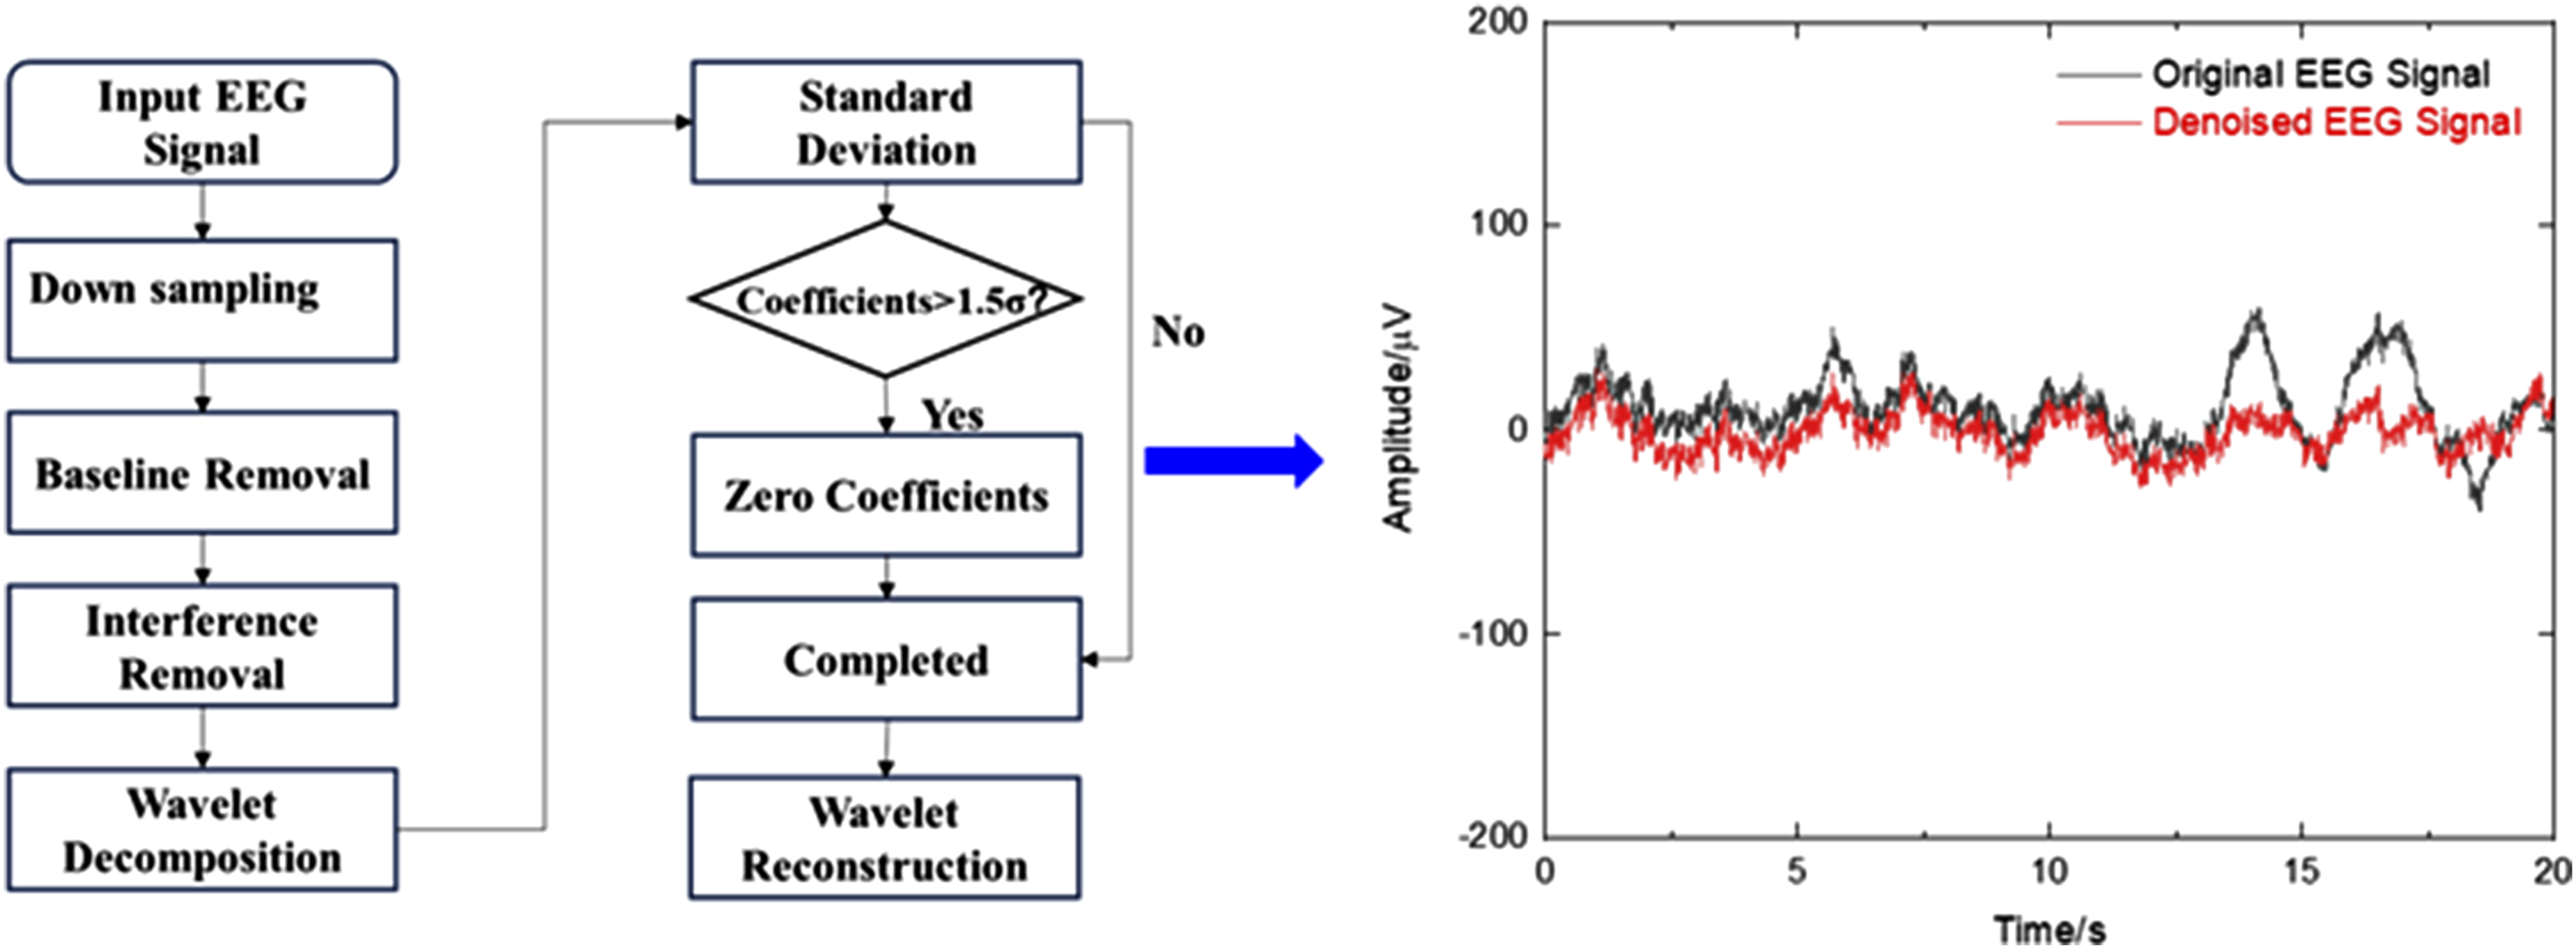
As can be seen from Figure 4, smooth wavelet transform denoising removes physiological noise with large amplitude on the basis of retaining more EEG details and has a good denoising effect.
After the pure EEG signal is obtained by de-noising the original EEG signal, the feature extraction can begin. The feature selection is related to the accuracy of the following algorithm. The features extracted for analysis—relative power and sample entropy (SampEn) for each EEG rhythm (δ, θ, α, β, γ)—were selected for their complementary ability to characterize the neurophysiological impact of noise. Relative power (calculated as the power of a specific band divided by the total power across all bands) was chosen as a primary metric because it mitigates inter-individual differences in absolute signal amplitude and provides a direct measure of shifts in oscillatory brain activity. For example, increased beta-band relative power is a well-documented correlate of cognitive load, vigilance, and stress, making it highly relevant to the assessment of noise-induced annoyance. Sample entropy was selected to quantify the complexity and predictability of the EEG time series. This non-linear metric captures aspects of neural signal organization that are independent of spectral power. A change in SampEn may reflect altered neural efficiency or stability under sensory stress; for instance, increased entropy can indicate neural desynchronization or information-processing overload. By combining the oscillatory intensity information from relative power with the signal-complexity information from SampEn, we aimed to obtain a more comprehensive and robust electrophysiological profile of passenger discomfort in high-speed rail environments.
Before feature extraction, EEG signals must be decomposed to separate out δ, θ, α, β and γ rhythm. In this study, wavelet packet decomposition is used to complete the decomposition according to the frequency characteristics of different rhythms.
Wavelet packet decomposition was performed using Matlab programming, the number of decomposition layers was set to 6, and five kinds of EEG rhythms were reconstructed according to the frequency range.
The power is the average power of the input signal. The calculation method is the square of the 2 norm of the input digital signal divided by the length of the digital signal. The bandpower function of Matlab is used to calculate the power. In this paper, the relative power of EEG is used to characterize the change of EEG rhythm. Taking alpha wave as an example, the calculation formula of relative power is shown in equation (4).
Sample entropy is a measure of time series complexity proposed by Richman and Moorman. Its calculation steps are as follows: I. The time series x(n) composed of N data is organized into a vector with dimension m by serial number. II. Define the distance between III. Given the threshold r, calculate the IV. Define V. Increase the dimension to m+1 and calculate the number of distances between


Definition: VI. Sample entropy is defined as


3. Results
3.1. Acoustic characteristics of stimuli
The acoustic stimuli for the experiment were derived from field recordings. After selecting samples with stable signals and low interference, each recording was segmented into 5-second clips, yielding a total of 114 samples for playback (representative waveform shown in Figure 5(a)). Measured typical acoustic stimuli (tunnel vs. open-line). (a) Example time-domain waveform, (b) A-weighted sound pressure level versus speed, (c) Loudness and (d) sharpness versus speed, (e) 1/3-octave spectra at 190, 250, 300 km/h.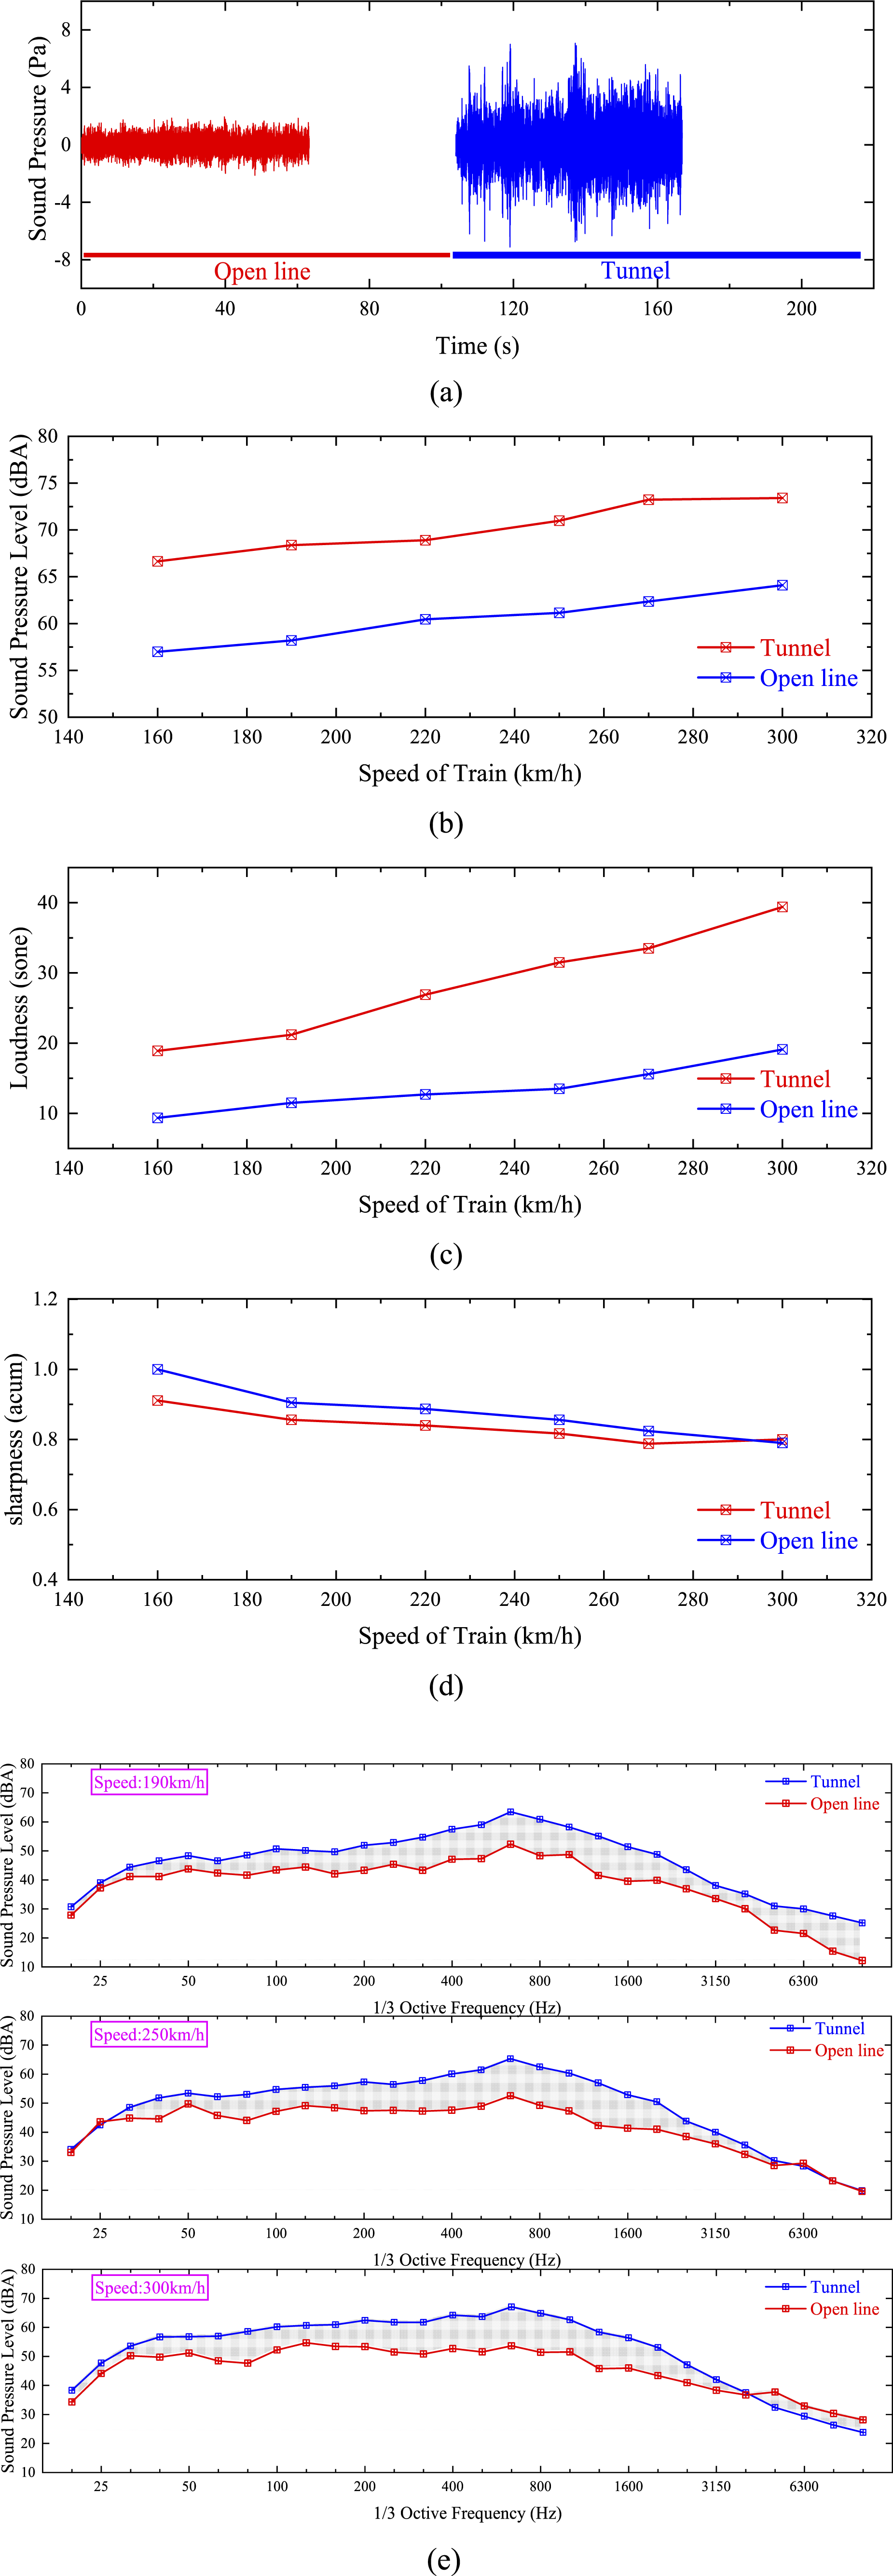
The acoustic difference between tunnel and open-track conditions was quantified using multiple metrics. Figure 5(b) presents the A-weighted equivalent sound pressure level (LAeq), confirming that tunnel noise is consistently louder across all tested speeds. A more detailed spectral analysis (Figure 5(e)) reveals that this increase is particularly pronounced in the 250–1250 Hz frequency band, which aligns with the region of high human auditory sensitivity.
Beyond simple sound level, psychoacoustic analyses provide insights into perceptual attributes. Loudness (Figure 5(c)) follows a similar trend, with tunnel noise being 9.5–20.3 sone higher than open-track noise at the same speed. Notably, at speeds above 250 km/h, tunnel noise loudness exceeds 25 sone, entering ranges perceptually categorized as “moderately” to “highly annoying”. 22 Conversely, sharpness (Figure 5(d)) is slightly lower in tunnels (by 0.039–0.089 acum), The concurrent observation of elevated loudness (exceeding annoyance thresholds) and altered sharpness points to a distinct and potentially more intrusive perceptual quality of the tunnel soundscape, the physical basis of which is evident in its amplified spectrum within the critical 250-1250 Hz band (Figure 5(e)).
3.2. Subjective evaluation
Subject correlation test.
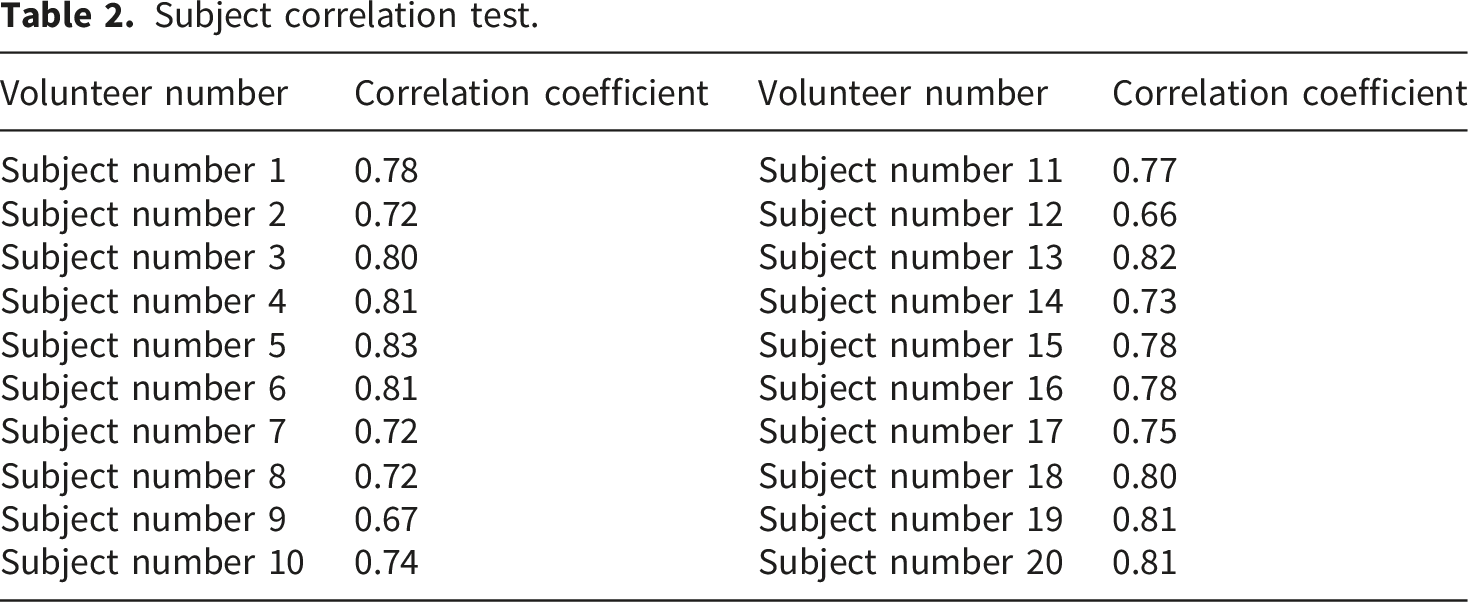
To ensure the reliability of both subjective and physiological datasets, participants were excluded based on two pre-defined, objective quality-control criteria applied prior to group-level analysis: (1) Subjective Rating Consistency: A Spearman’s correlation coefficient (ρ) of less than 0.70 between an individual’s annoyance ratings and the group average vector, indicating inconsistent subjective evaluation; and (2) EEG Data Quality: An epoch rejection rate exceeding 20% after automated and visual artifact detection, indicating poor signal quality likely to confound feature extraction. As summarized in Table 2, Subjects #9 (ρ = 0.67) and #12 (ρ = 0.66) showed the lowest inter-rater consistency. Furthermore, their EEG data exhibited the highest artifact rejection rates (22.6% and 24.1%, respectively). As they were the only participants who met both exclusion criteria, their data were omitted from all subsequent integrated analyses (i.e., correlations between EEG features and subjective scores). This conservative approach prioritizes data integrity and the validity of the reported neuro-behavioral correlations. A sensitivity analysis confirmed that including these subjects did not alter the significance or direction of the primary findings (e.g., tunnel-related beta power increase: p = 0.002 with full dataset vs. p < 0.001 with main dataset), supporting the robustness of the results. This threshold has been adopted in prior perceptual and ERP literature to justify exclusion of unreliable ratings (e.g., Tomarken et al. 19 ; Allen et al. 23 ).
Annoyance ratings correlate with train speed and position within the train. Figure 6(a) illustrates the relationship between train velocity and the subjective perception of annoyance, demonstrating how increased speed correlates with heightened levels of passenger discomfort. Figure 6(b) presents the subjective annoyance scores under tunnel and open-line noise at 300 km/h, showing a significant increase in perceived discomfort during tunnel sections (p < 0.01). Subjective annoyance scores under tunnel and open line conditions across speeds and individuals. (a) Annoyance scores across train speeds (160–300 km/h) in tunnel and open-line conditions. (b) Subjective annoyance scores under tunnel and open-line noise at 300 km/h.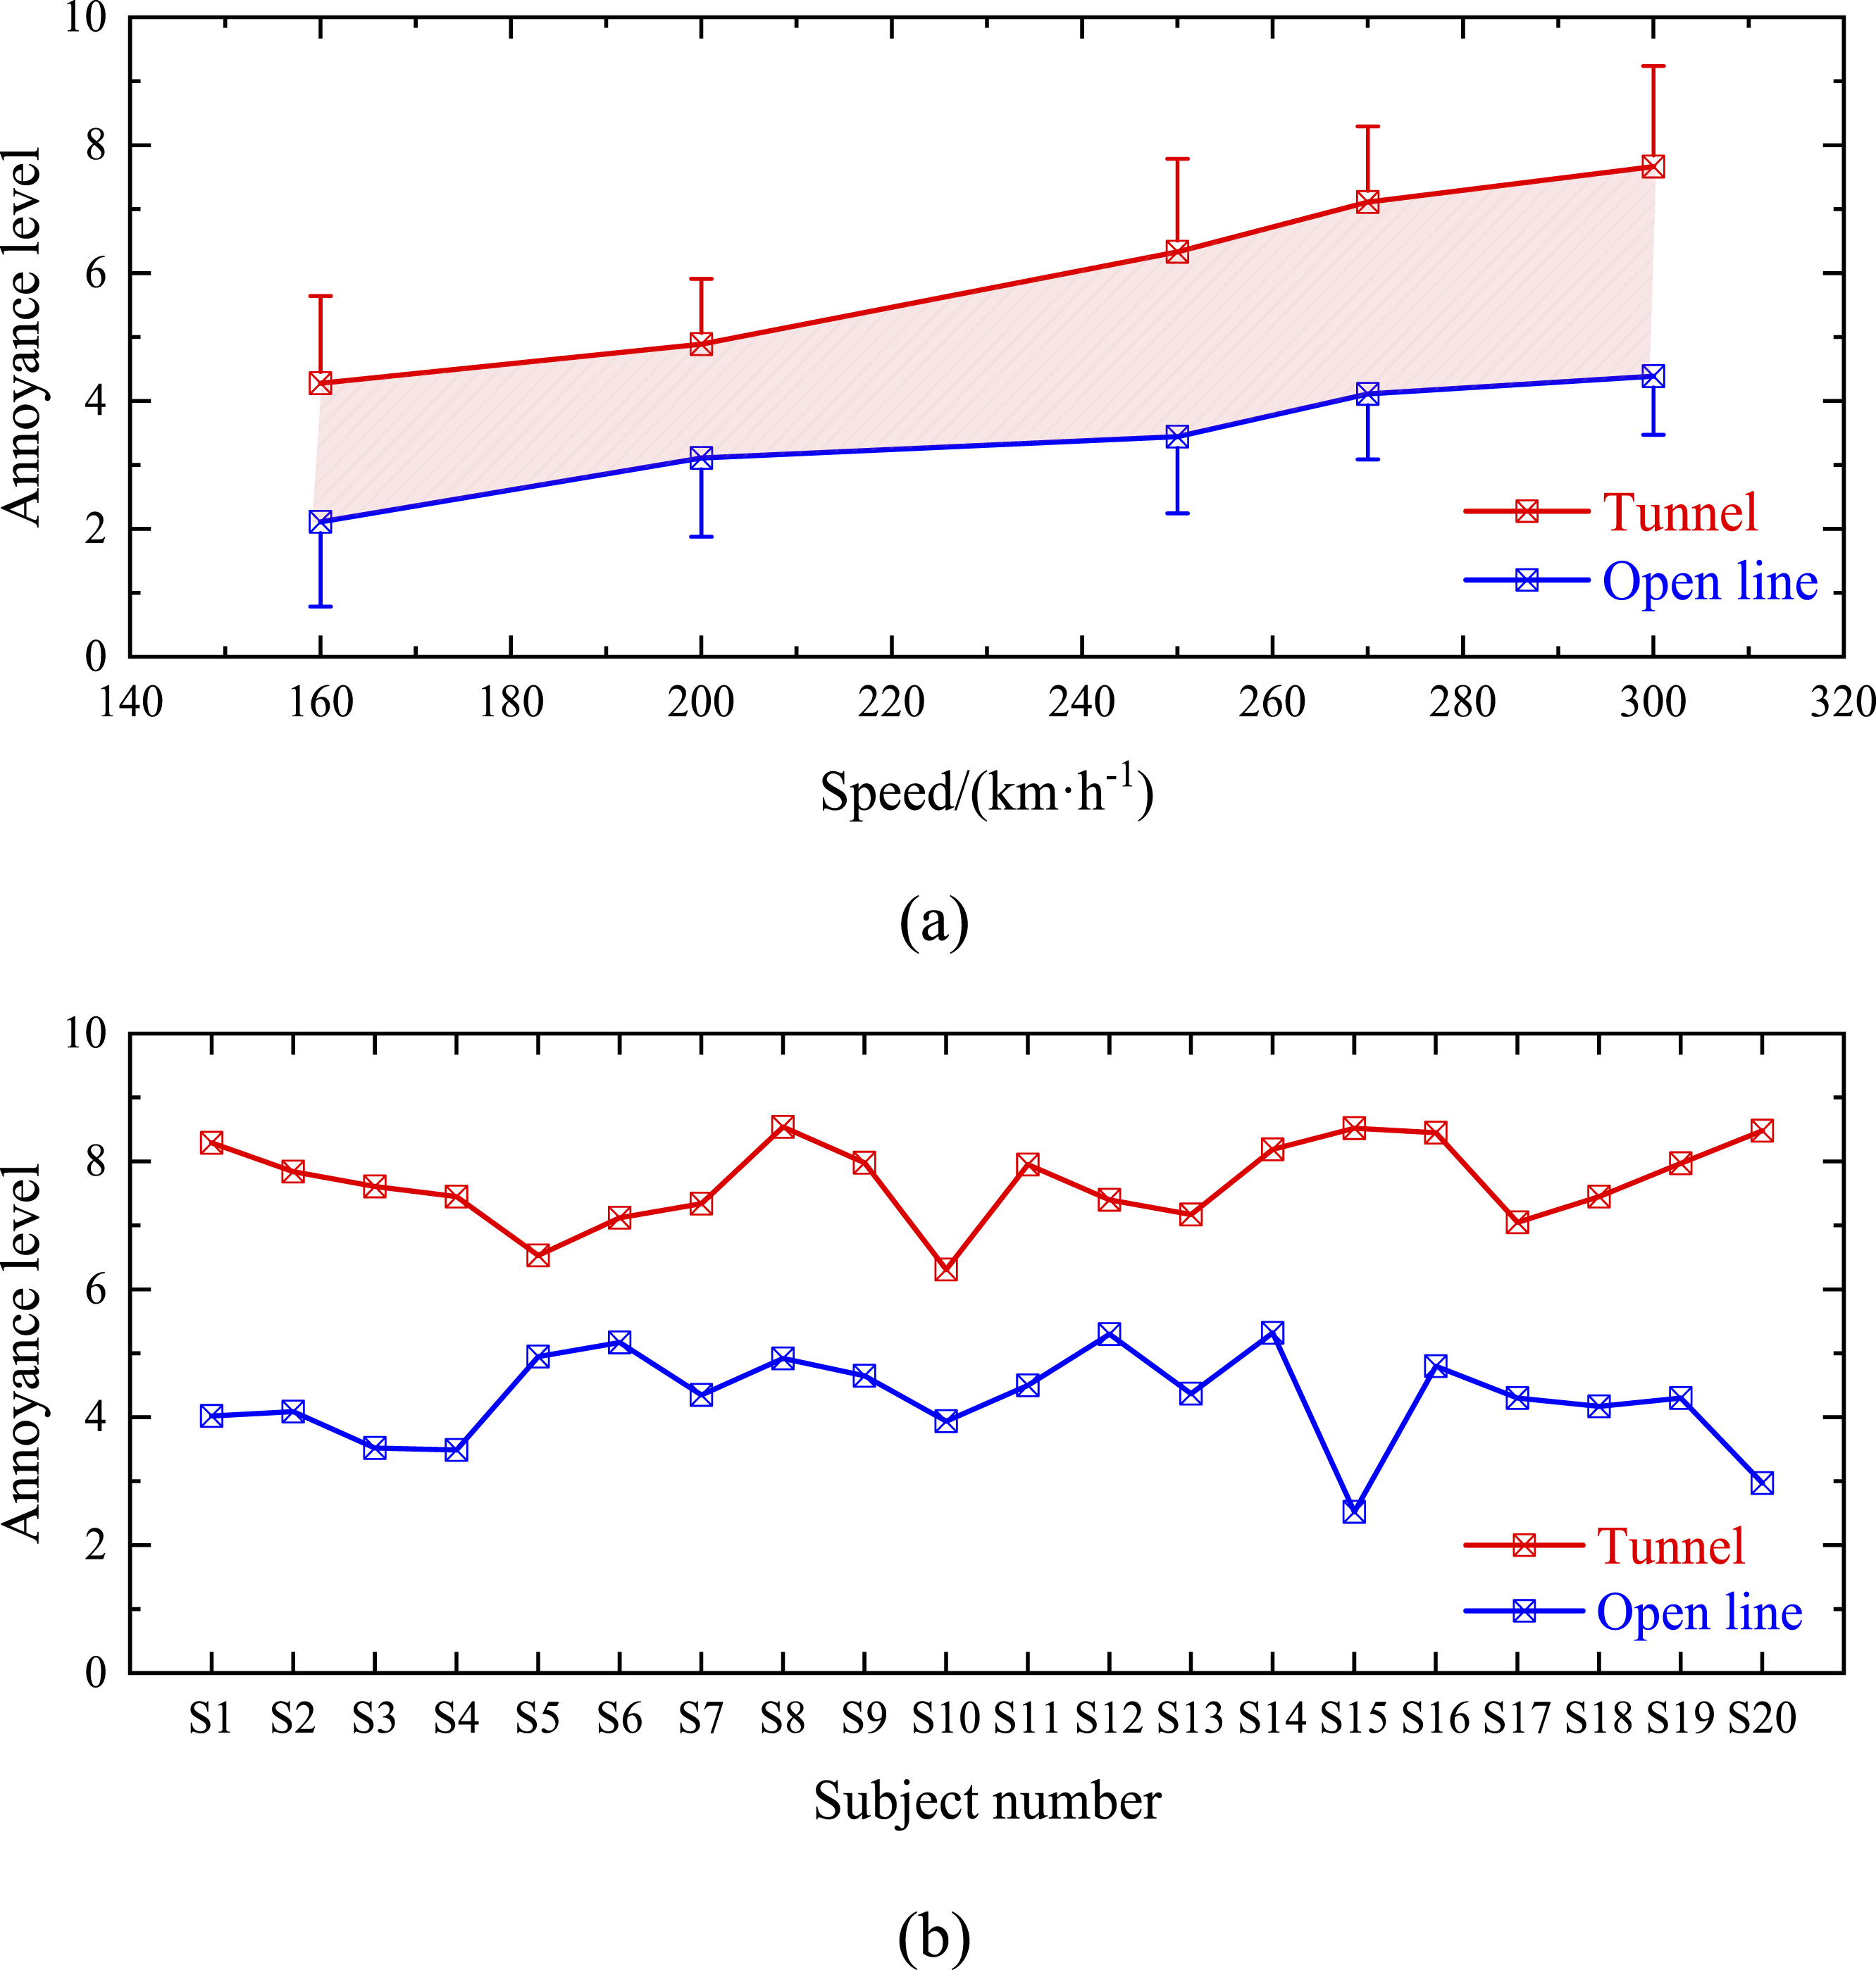
As can be seen from Figure 6(a), the subjective annoyance degree increases with the increase of speed. Under the same speed class, the subjective annoyance degree in the tunnel section is 1.7 - 3.3 larger than that in the open line section, and the acoustic comfort of human body when the train runs in the tunnel section is significantly worse than that in the open line. The evaluation of passengers on the sound samples exceeds 7 and is close to 8, indicating that passengers are very disgusted with the sound environment in the car at this time, which seriously affects the riding comfort of passengers.
As can be seen from Figure 6(b), Point plot with 95% confidence intervals. Participants consistently reported higher annoyance under tunnel noise exposure (p < 0.01, paired t-test), confirming the subjective discomfort associated with acoustic load.
3.3. EEG recordings
All EEG parameters were tested for normality using the Shapiro–Wilk test in SPSS. The majority of features returned p-values > 0.05, indicating approximate normal distribution. Therefore, paired-sample t-tests were used for group comparisons. For multiple frequency band comparisons, we applied the Benjamini–Hochberg procedure to control the false discovery rate (FDR = 0.05). Several EEG features remained significant after correction. Power analysis was performed using G*Power with α = 0.05, assumed medium effect size (Cohen’s d = 0.65), and sample size n = 20. The resulting power was 0.82, suggesting that the study had adequate statistical sensitivity.
In this study, the disturbance correlation analysis was carried out for the power and sample entropy of each band of EEG signals, in which the relative EEG power reflected the proportion of different EEG frequency bands (such as δ, θ, α, β waves) in the overall brain electrical activity. These bands are closely associated with different functional states of the brain, such as alpha waves associated with relaxed states and beta waves associated with mental tension or cognitive activity.
All EEG band features (delta, theta, alpha, beta, and gamma) and subjective scores, the Shapiro–Wilk test returned p-values above 0.05, indicating that the data did not significantly deviate from normality. For instance: Beta relative power: W = 0.974, p = 0.51; Alpha sample entropy: W = 0.962, p = 0.28; Annoyance scores: W = 0.981, p = 0.60. These results justify the use of parametric tests (e.g., paired-sample t-tests and Pearson correlation) for subsequent statistical analyses.
In order to visually compare the correlation between EEG characteristics and subjective evaluation results, Figure 7 heat map showing Pearson correlation coefficients between EEG characteristics (relative power and sample entropy) and subjective annoyance scores. EEG rhythms (δ, θ, α, β, γ) are shown on the x-axis. Rows represent relative power and sample entropy respectively. Strong positive correlations are observed for β-band features, highlighting their role as indicators of discomfort. Correlation heat map (EEG features vs. Subjective annoyance).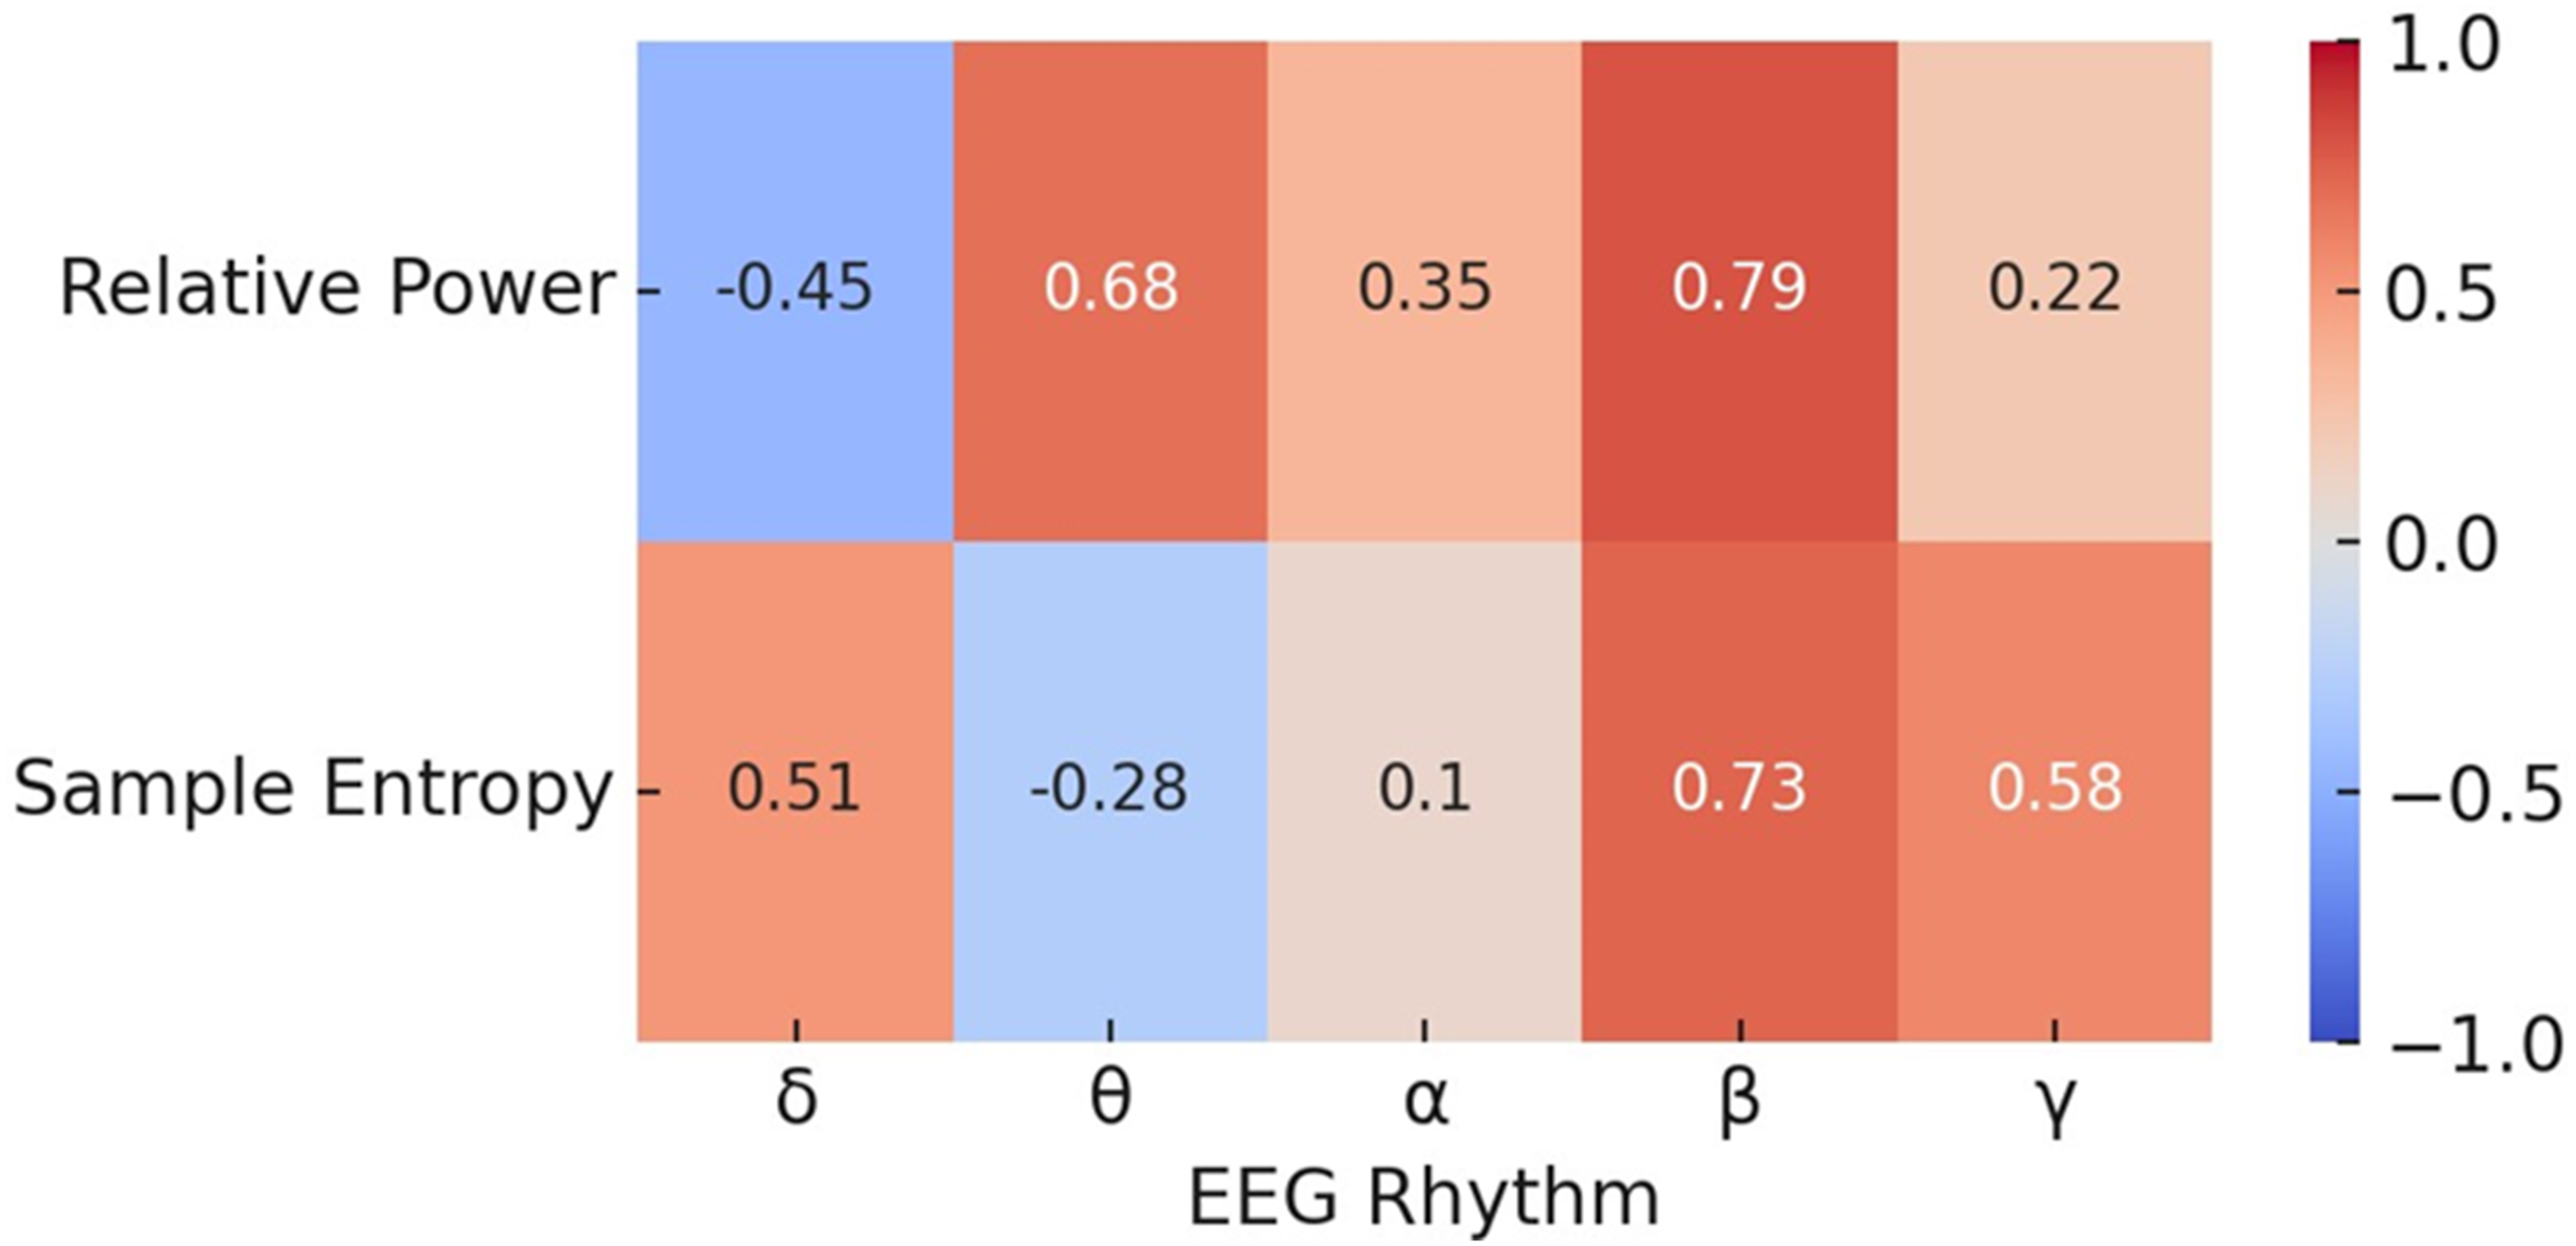
EEG characteristic values and annoyance level in open line and tunnel.
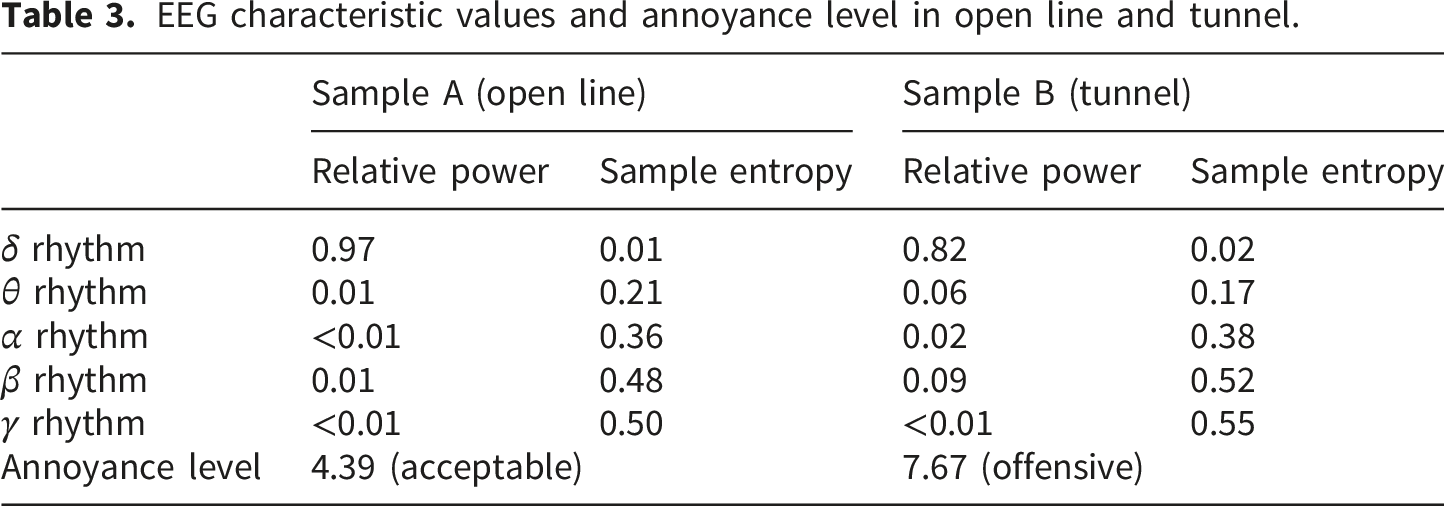
Table 3 shows the relationship between EEG eigenvalues (relative power and sample entropy) and subjective annoyance under both open line and tunnel environments. When trains operate in open environments, the subjective annoyance score is 4.39 (“acceptable”), but this rises sharply to 7.67 (“offensive”) in tunnel environments. EEG analysis reveals distinct brainwave changes in tunnels: delta waves decrease (suggesting reduced relaxation), theta waves increase (linked to emotional responses or discomfort), alpha waves rise slightly (mild alertness), and beta waves surge significantly (indicating cognitive stress or agitation). Gamma waves show a minor, non-significant increase. Sample entropy also increases across all bands, reflecting more complex brain activity in tunnels. These EEG shifts align with higher annoyance levels, likely caused by psychological stress from tunnel noise. Reduced relaxation and heightened cognitive/emotional activity in tunnels correlate directly with the rise in subjective annoyance.
4. Discussion
This study investigated the neurophysiological correlates of acoustic discomfort experienced by high-speed rail passengers under tunnel noise conditions. This study advances the field not by introducing novel EEG metrics, but by leveraging established electrophysiological measures within a novel and ecologically rigorous context to address a specific, operationally critical problem. Our framework differs fundamentally in its experimental design and integrated interpretation. By integrating subjective annoyance ratings with EEG signal features—including relative power and sample entropy—we explored how specific neural patterns vary across acoustic environments and relate to perceived sound-induced distress.
The experimental design is specifically tailored to isolate the effect of tunnel acoustics. Unlike studies using synthetic or generic noise stimuli, we employed authentic binaural recordings from operational high-speed trains under matched tunnel and open-line conditions, ensuring high ecological validity. The key findings indicate that beta-band activity and entropy significantly increased during tunnel exposure, compared to open-line conditions. These changes were statistically significant (p < 0.01) and showed robust correlations with subjective annoyance scores (r > 0.7), suggesting that beta-related neural activation plays a crucial role in encoding noise-induced discomfort. These findings were further supported by individual paired-response plots and normality-validated t-tests, which confirmed consistent within-subject differences. Together, the EEG and behavioral data provide strong evidence that tunnel noise elicits both perceptual and physiological responses that differ meaningfully from open line conditions.
Furthermore, the integrated application and interpretation of established features—relative power and sample entropy (SampEn)—within this specific context. While these metrics are individually common, their concurrent application here reveals a coherent neural signature of tunnel-induced discomfort: elevated β-band power, indicative of increased cognitive arousal or load, co-occurs with increased β-band SampEn, suggesting heightened neural irregularity or processing unpredictability. This combined pattern, emerging consistently under the complex, reverberant tunnel soundscape but not under open line noise, provides a more nuanced electrophysiological profile than either metric alone. It is the context-driven synthesis of these standard measures that yields new insight.
Despite these meaningful results, this study has limitations. The relatively small sample size (n = 20) and the cohort’s restricted age range (23–30 years) and handedness (all right-handed) may limit the statistical power and generalizability of the findings. Caution is therefore warranted when extending the present conclusions to broader populations, as EEG spectral characteristics are known to vary with age and individual factors. Additionally, while we identified EEG features correlated with annoyance, we did not construct a predictive model in this work. However, the present results lay a strong foundation for future modeling efforts, including regression or machine learning approaches, using features such as beta power, entropy, or time–frequency metrics to estimate perceived annoyance in real time. Because EEG spectral characteristics are known to vary with age and individual factors, the present findings should be generalized with caution beyond the tested cohort. Future studies will expand the sample to older age groups and different handedness to evaluate the stability of tunnel-related β-band markers.
In summary, this study demonstrates that EEG-based acoustic evaluation is a promising tool for quantifying subjective discomfort in complex transport noise environments. These findings may inform future design of cabin acoustic environments, enabling more targeted and neuro-informed noise control strategies for enhancing passenger well-being in high-speed rail systems.
5. Conclusion
This study integrates electroencephalogram (EEG) signals with psychological acoustic annoyance metrics to evaluate the acoustic comfort of passengers in high-speed trains operating within tunnel environments. Through subjective evaluations and EEG signal analysis involving 20 participants, we found that tunnel noise significantly impacts physiological responses and subjective annoyance levels. Specifically, an increase in β-band power and sample entropy indicates heightened cognitive stress and anxiety, while δ, θ, and α bands show varying trends. These findings provide new insights into understanding the impact of train interior noise on passengers and offer scientific evidence for enhancing passenger experience.
5.1. Specific conclusions
5.1.1. Significant changes in β-band
In tunnel environments, there is a significant increase in β-band (13–30 Hz) power and sample entropy, closely correlating with higher subjective annoyance levels (7.67 in tunnels vs. 4.39 in open-line conditions). This suggests that β-band activity can serve as a crucial indicator of cognitive stress and anxiety induced by tunnel noise. In practice, β-band EEG indicators can be used as objective outcome measures in neuro-informed acoustic design: candidate tunnel-noise mitigation strategies (e.g., aerodynamic optimization, tunnel entrance treatments, cabin insulation/absorption) can be compared by quantifying their ability to reduce tunnel-induced β activation under controlled playback, alongside psychoacoustic metrics (ISO loudness, DIN sharpness, roughness). This complements conventional level-based criteria by directly reflecting passenger neurophysiological stress responses.
5.1.2. Effectiveness of EEG signals
Compared to traditional subjective evaluation methods, EEG signals provide a more objective reflection of passengers’ physiological responses to high-noise environments. EEG not only captures immediate physiological changes but also offers insights into long-term exposure effects.
5.1.3. Future research directions
This study demonstrates the potential of using EEG signals to assess the impact of transportation noise on passengers. Future research could further explore other physiological signals (e.g., heart rate variability) in relation to acoustic comfort and develop more comprehensive assessment models to enhance overall passenger experience.24,25
Footnotes
Funding
The authors disclosed receipt of the following financial support for the research, authorship, and/or publication of this article: This study was supported by National Nature Science Foundation of China (U1934203), R&d Fund of China Academy of Railway Sciences Group Co., LTD (2021YJ306), and China National Railway Group Limited research program (N2023J070), R&d Fund of China Academy of Railway Sciences Group Co., LTD (2024YJ346).
Declaration of conflicting interests
The authors declared no potential conflicts of interest with respect to the research, authorship, and/or publication of this article.