
Abstract
Outdoor environmental noise is a major source of annoyance in urban areas and exposure to it can increase the risk of severe health issues. Consequently, it has been the focus of research for decades. Even though people spend the majority of their time indoors, most studies use outdoor noise levels and do not include indoor noise measurements to estimate real exposure levels. This study conducted simultaneous indoor and outdoor noise measurements for 24 h in four multi-unit residential buildings to identify the levels and sources of outdoor noise heard indoors and quantify the effects of outdoor noise on indoor levels. The measurements were conducted in unoccupied suites that are most exposed to traffic and other outdoor noise sources. Surveys were administered following building occupancy to collect information regarding perceived acoustic comfort levels due to outdoor noise. The indoor LAeq,24h in three of the study buildings were above 40 dB(A) and exceeded WHO’s noise level limits. Regression analysis showed that outdoor noise only explains 14%–58% of the variability in indoor noise levels. This is mainly because of heating, ventilation, and air conditioning (HVAC) system noise which resulted in consistently high indoor noise levels despite variations in outdoor noise. Analysis of the survey showed a poor correlation between reported annoyance and measured noise levels. But annoyance strongly depended on other factors such as suite location and noise sensitivity. The findings show that outdoor noise measurements alone may not be good predictors of exposure levels and the effects of outdoor noise on occupants.
Introduction
Exposure to outdoor environmental noise, such as transportation, construction, and neighborhood noise, can be harmful to people. In the short-term, noise exposure can cause annoyance, sleep disturbance, and can result in reduced cognitive performance.1–4 Continued exposure to outdoor noise can also increase the risk of severe long-term health issues, such as mental health issues, cardiovascular diseases, diabetes, obesity, and dementia.5–9 Environmental noise has also been linked to an increased risk of birth defects and lower birth weights in infants, and impaired cognitive development and learning impairment in children.10–12 In 2011, a World Health Organization (WHO) 13 report estimated the healthy life years lost due to environmental noise in Western European countries (population of 420.5 million). The report stated that the disability-adjusted life years lost (which is the number of years lost due to premature death or disability) due to environmental noise, mainly traffic noise, range from 1 to 1.6 million. To minimize serious annoyance and sleep disturbance, WHO recommends that the outdoor A-weighted equivalent sound pressure level (LAeq) in residential areas should be kept below 55 dB(A) during daytime (7:00–23:00) and 45 dB(A) during nighttime (23:00–7:00), and indoor levels should be kept below 35 dB(A) during daytime and 30 dB(A) during nighttime. 14 However, the increasing number of people living in cities and the growth in rail, road, and air traffic have made it challenging for many urban areas to keep environmental noise below the recommended levels. For instance, in 2017, an estimated 113 million people in European Union countries were exposed to traffic noise above the levels recommended by WHO. 15 Many other urban areas also experience high outdoor noise levels. 16 For example, studies conducted in the three biggest cities in Canada report that at least 90% of the study population in Toronto, 17 Vancouver, 18 and Montreal 19 are exposed to outdoor noise levels exceeding those recommended by WHO.
Due to the increasing exposure to environmental noise and the resulting public concern, studies aimed at quantifying the effects of environmental noise and identifying exposure thresholds have been increasing. 20 A common method used in these studies involves measuring free-field outdoor noise levels where the microphone is placed outdoors away from any reflecting surfaces, or modeling noise levels using indicators such as traffic volume and vehicle speed.20–22 Another method is to use noise levels from one noise source (typically traffic noise) to predict annoyance due to other noise sources, such as aircraft and wind turbine noise, without measuring the noise from these other noise sources. 23 While outdoor noise measurement is important to understand exposure levels outdoors, understanding indoor noise levels is necessary to estimate the true exposure levels and related effects on people. This is crucial considering that people spend most of their time indoors. Studying indoor noise exposure is particularly important in residential buildings, especially those located in dense urban areas where high outdoor noise levels can cause a disturbance to activities such as sleep. When estimating indoor noise levels due to outdoor noise sources, the most common technique used is measuring outdoor free-field noise levels and applying a certain noise reduction factor due to the façade (typically around 25 dB for closed windows). 13 However, sound reduction due to a façade depends on a variety of factors, such as window glazing type, room size, airtightness, and reverberation time. 24 The sound reduction level also strongly depends on the type of noise source and its frequency components. 24 Factors affecting outdoor-indoor sound transmission levels might also vary depending on the opening size of the window. For instance, Locher et al. 24 found that the material of the window frame, number of windows and outdoor sound level are the most important factors that determine indoor-outdoor transmission levels, while for tilted or open windows, the orientation of the window, size of the room, and the age of the building were found to be important factors. Thus, estimations of indoor noise exposure and noise-induced effects on people inside buildings solely based on outdoor levels might not be reliable.
Very few studies perform indoor noise measurements to understand the actual noise exposure levels due to outdoor noise and the related effects on occupants.20,22 Most of these studies only tend to focus on a single noise source. For instance, Quehl et al. 25 measured noise levels inside the bedrooms of residential buildings located near an airport to study the effects of nighttime aircraft noise on annoyance. Similarly, Nassur et al. 26 measured indoor nighttime aircraft noise levels for 1 week to estimate the effects of aircraft noise on sleep. Licitra et al. 27 included a short-term indoor measurement of railway noise and estimated occupants’ annoyance using surveys. Graham et al. 28 and Pirrera et al. 29 measured nighttime noise levels to estimate the indoor exposure levels due to traffic noise. Naim et al. 30 measured indoor noise levels due to aircraft, road and railway traffic for 3 days per building. They found a weak correlation between indoor and outdoor noise which they indicate is mainly due to the lack of suitable locations to place the indoor and outdoor noise monitoring stations in occupied buildings. Their study, however, did not include an assessment of the effect of noise on occupants. Dahlan et al. 31 performed 1-h indoor noise measurements in student hostels and correlated them with occupants’ perceptions. Their study was not directed at any specific outdoor noise source. However, they kept the windows open during their measurements and no estimation of noise levels with the windows closed was made. Lai et al. 32 measured indoor noise levels for 15 min with the windows closed but made no distinction between indoor and outdoor noise sources. Similarly, Pujol et al. 33 performed indoor noise measurements for 1 week to quantify the effects of noise exposure on children. But they did not identify which indoor and outdoor noise sources contributed to the overall indoor levels. Other studies that have performed indoor noise measurements focus on indoor noise sources only. For instance, Park et al. 34 measured indoor noise levels for 24 h in empty apartments to identify indoor airborne and impact noise from neighbors. There remains a lack of evidence that supports the understanding of indoor exposure levels due to various outdoor noise sources and the related effects on occupants.
The goal of the current study is to determine the levels and sources of outdoor noise heard inside residential buildings, quantify the effects of outdoor noise on indoor levels, and assess the effects of exposure on occupants. In this study, outdoor noise refers to environmental noise originating from outside buildings including traffic noise, construction noise and noise from other outdoor neighborhood activities. The study is performed in multi-unit residential buildings (MURBs) which are buildings that have three or more separate suites that share an entrance, spaces and some amenities inside the building.35,36 MURBs are likely to be found in highly dense areas with high noise levels due to high traffic volume and other noise sources compared to single-family homes. Outdoor noise exposure in MURBs can also be complicated by the presence of additional noise sources from inside the building, such as noise from neighbors and building systems, and can affect how occupants respond to outdoor noise. Thus, the study aims to investigate both direct (outdoor noise sources and levels) and indirect factors (exposure to noise originating from inside buildings) that affect occupants’ perception of outdoor noise. Understanding the effects of the indirect factors can help promote policies that focus on additional ways to minimize the effects of outdoor noise on occupants especially since the increase in urbanization and transportation makes reducing outdoor noise levels challenging. The effects of building characteristics which include glazing type, floor level, and proximity to a major road on the indoor noise exposure levels of outdoor noise are also investigated.
Methodology
This study involves monitoring indoor and outdoor noise levels continuously for 24 h in unoccupied buildings/suites and recording audio indoors to identify the levels and types of outdoor noise sources heard indoors. Surveys are used to evaluate the effects of outdoor noise on occupants. Details about the study buildings, the monitoring procedure, occupant survey and data analysis are presented in this section.
Study buildings
Four buildings located in the Province of Ontario, Canada were selected for the study. Table 1 presents a summary of relevant information about the buildings. All buildings have operable windows. All buildings, except Building D, face major roads with three or more lanes. Buildings A and B are also located next to light rail tracks. Buildings A and B are student dormitory buildings and the monitoring in these buildings was conducted in August 2021 when only a small percentage of the units (8.5% in Building A and 7.6% in Building B) were occupied. Corner units that are far from the occupied units were selected in these buildings to minimize the effects of any noise that might originate from the occupants. Buildings C and D have affordable housing units for women and children, and seniors, respectively. The monitoring in these two buildings was conducted in September 2021 after the construction/retrofit was completed, and while the buildings were still completely unoccupied.
Summary of the study buildings’ characteristics.
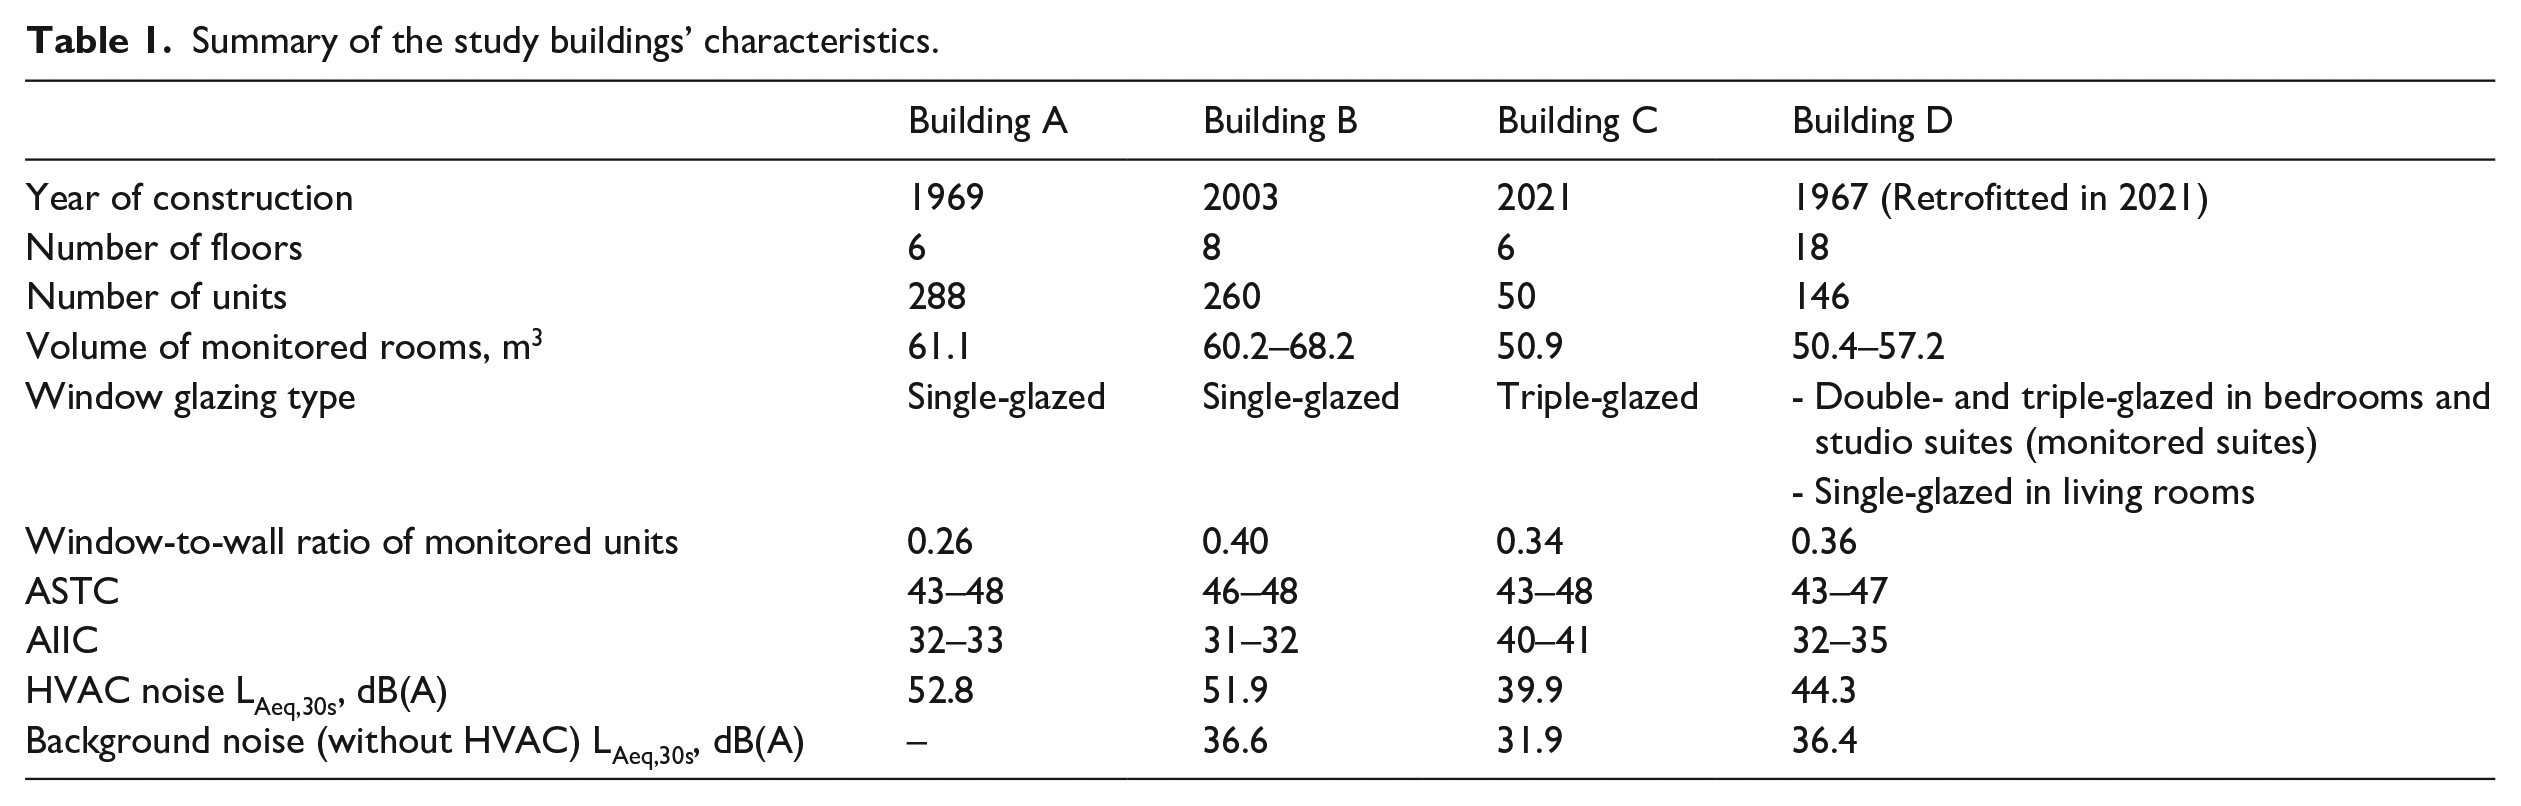
The airborne sound insulation levels of interior partition walls and the impact sound insulation of floors were measured in the buildings as part of a larger study that aims to evaluate the effects of indoor airborne and impact noise on acoustic comfort. The results of the measurements are included here to assess any correlation between outdoor noise perception and exposure to indoor noise sources. Three to five interior partition walls and floors were tested in each building. ASTM E336 37 and ASTM E413 38 standards were used to determine the apparent sound transmission class (ASTC) which is a single-number metric used to describe the airborne sound attenuation ability of wall partitions. ASTM E989 39 and ASTM E1007 40 procedures were used to determine the apparent impact insulation class (AIIC) which is a single-number metric used to describe the impact sound attenuation abilities of floor assemblies and adjoining elements. High ASTC and AIIC values indicate better sound insulation performance. The minimum and maximum ASTC and AIIC ratings of the study buildings are presented in Table 1.
In addition, the heating, ventilation and air conditioning (HVAC) noise was measured in each building to evaluate any effects it might have on occupants’ perception of outdoor noise. HVAC systems refer to systems that generate noise (e.g. fans, pumps) and the systems that transmit noise (e.g. ducts). The measurement was conducted for 30 s in one suite in each building which was considered to represent the HVAC noise sufficiently. The HVAC was in cooling mode during this period. A class 1 microphone (XL2 analyzer with M2230 microphone, NTi Audio AG) placed at the central part of a room at least 1 m away from reflecting elements was used for this measurement. The A-weighted equivalent sound pressure level (LAeq,30s) calculated from this measurement as well as background noise with the HVAC turned off are presented in Table 1. The background noise measurement was not conducted in Building A because there were no in-suite HVAC controls, and the HVAC was always on during the field monitoring period.
Noise monitoring
The monitoring was conducted continuously for 24 h in each building. One or two measurements were conducted in unoccupied suites located on the fifth floor of Building A, second and sixth floors of Building B, fifth floor of Building C, and fourth and 15th floors of Building D. Suites that are facing a major roadway were selected. This conservative approach is used to represent exposure levels for occupants most exposed to outdoor noise. A sound level meter was placed at the central part of the suite, at least 1 m away from the façade and partition walls. The microphone (XL2 analyzer with M2230 microphone, NTi Audio AG) was placed on a tripod 1.3 m above the floor. If a suite has one or more bedrooms, the equipment was placed in the central part of the living room, and if the suite was a studio, the equipment was placed in the central part of the living area. All windows and interior doors were kept closed during the monitoring period. Figure 1 shows a sample indoor monitoring setup. Outdoor noise reaching the façade was monitored simultaneously using a microphone attached to the outside of the glass of a window in a suite adjacent to the main test suite where indoor noise was being monitored. The same microphone model as the indoor one but fitted with a weather protection kit was used for the outdoor monitoring. A sample image of the outdoor monitoring setup is shown in Figure 2. Before each monitoring period, the microphones were calibrated and the time on the two sound level meters was synchronized. The monitoring was completed on weekdays in Buildings A, B, and C. In Building D, the monitoring took place over the weekend (from 23:00 on Friday till 23:00 on Saturday) to avoid the effects of noise that might originate from trade work that was being carried out during weekdays in the building.
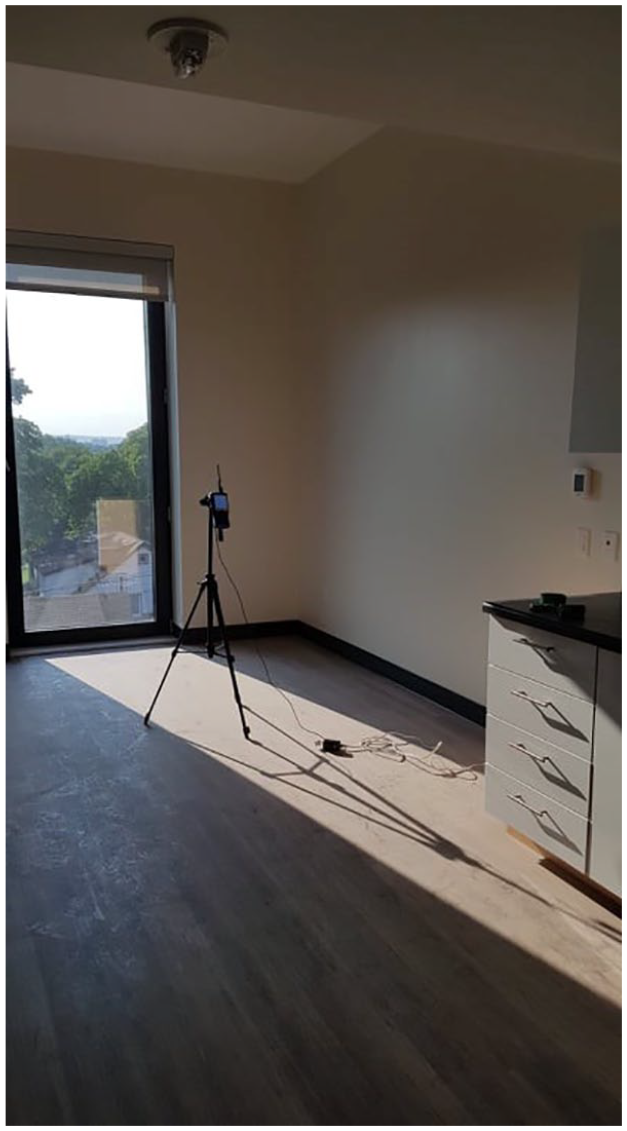
Sample indoor monitoring setup showing a sound level meter attached to a tripod placed inside a room.
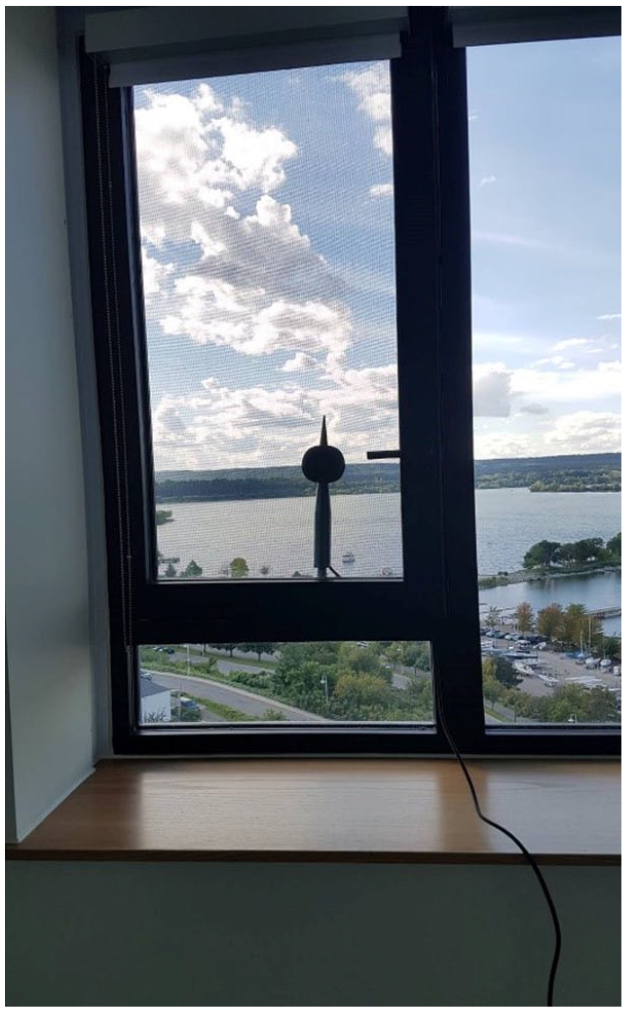
Sample outdoor monitoring setup showing a microphone inside a weather protector attached to the outside of the glass of a window.
Occupant survey
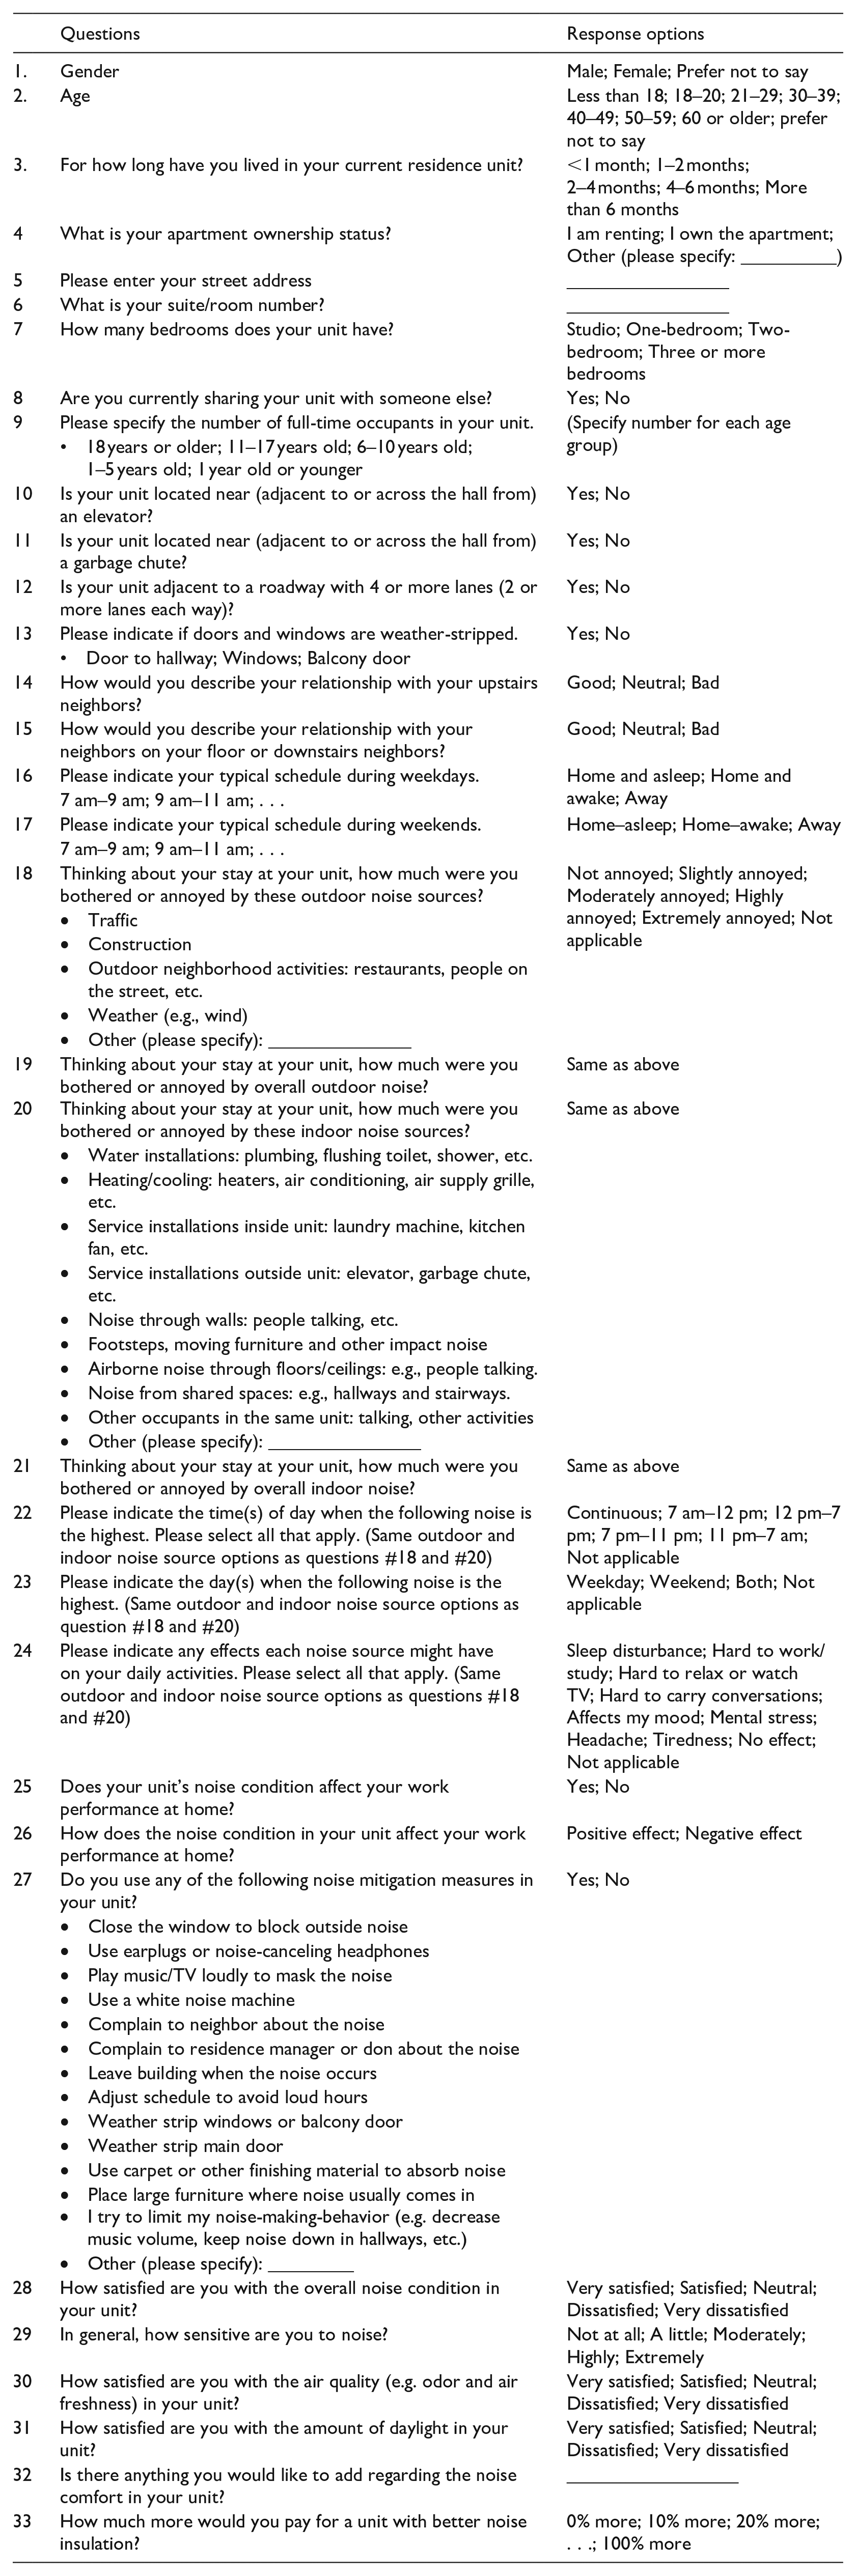
An online survey was used to collect subjective acoustic comfort assessments from the occupants using Qualtrics survey platform. The survey, which was approved by the Research Ethics Board at the University of Toronto, can be found in the Appendix. It included questions that asked participants to rate their annoyance level (not annoyed, slightly annoyed, moderately annoyed, highly annoyed, and extremely annoyed) with noise from traffic, construction, other outdoor neighborhood activities, and overall outdoor noise. In addition to annoyance, participants were asked to indicate if each noise source affects their sleep, mood, mental stress, tiredness, headache, work performance at home, and other activities such as communication and relaxation in their suites. The survey was administered during the Fall 2021 in Buildings A and B (approximately 2 months after the noise was monitored in the buildings) and Spring 2022 in Building C and D (approximately 7 months after the noise was monitored in the buildings). We asked the building management team in each building to advertise the survey through emails and flyers. For Buildings A and B, the survey was administered after full or near full (90%) occupancy. In Buildings C and D, the occupancy level was only at 66% and 46%, respectively, when the survey was administered. To ensure that participants from these buildings were exposed to noise conditions similar to a fully occupied building, only occupants who have an upstairs neighbor and at least one next-door neighbor were recruited. Occupants on the top floor who would not have upstairs neighbors even if the building was fully occupied were also invited to participate in the survey. A total of 104 survey responses were collected from Buildings A (17% response rate), B (18% response rate), and C (27% response rate). Only six responses were collected (9% response rate) from Building D. This sample size is considered low thus survey data from Building D is excluded from the data analysis.
Data analysis
The sound pressure level data obtained from the sound level meters included A-weighted equivalent sound pressure levels (LAeq) and A-weighted maximum sound pressure level with fast-time weighting (LAFmax) sampled every second for 24 h as well as 24-h audio recordings. The LAeq for 24 h as well as for daytime (7:00–19:00), evening (19:00–23:00), and nighttime (23:00–7:00) were calculated. In addition, the noise levels exceeded 10% (L10), 50% (L50), and 90% (L90) of the time were calculated. In addition, Lden (day-evening-night weighted sound pressure level) was calculated following guidelines specified in ISO 1996-1 41 to assess noise exposure over a 24-h period with penalties applied for evening and night. Linear regression analysis was carried out to investigate the relationship between indoor and outdoor noise levels. The measured noise levels were compared with the reported annoyance levels in the survey. Wilcoxon rank-sum tests and Kruskal-Wallis tests were used to compare the difference in annoyance ratings between groups.
The WHO recommends that the indoor LAFmax for single noise events not exceed 45 dB(A) during nighttime to avoid sleep disturbance. 14 In this study, the number of hours that the LAFmax exceeded 45 dB(A) during nighttime were calculated for the indoor measurements to assess potential correlation with reported sleep disturbances. The LAFmax was also used to identify outdoor noise sources that are heard indoors from the audio files obtained from the indoor sound level meters. Since the WHO does not provide a guideline for indoor LAFmax levels during the daytime, 45 dB(A) was used as a threshold for daytime, evening and nighttime in this study. Periods where the indoor LAFmax exceeded 45 dB(A) were identified and matched with the audio portions that correspond to those periods to determine when to start and finish listening to the specific portion of the audio. The noise sources were then identified by listening to those audio portions. A sample sheet showing this noise source identification process is presented in Figure 3. One 24-h audio recording in each building (recordings from the fifth floor of Building A, sixth floor of Building B, fifth floor of Building C, and fourth floor of Building D) was selected for this analysis. Three researchers that have self-reported normal hearing abilities performed the listening activities. The researchers listened to all portions of the audio recordings where the LAFmax was above 45 dB(A). If more than one noise source was heard, the source that is perceived as louder than other sources was selected. The LAFmax values of these noise sources were obtained from the sound level data and compared with reported annoyance levels on the survey. The number of events for each noise source was also recorded.
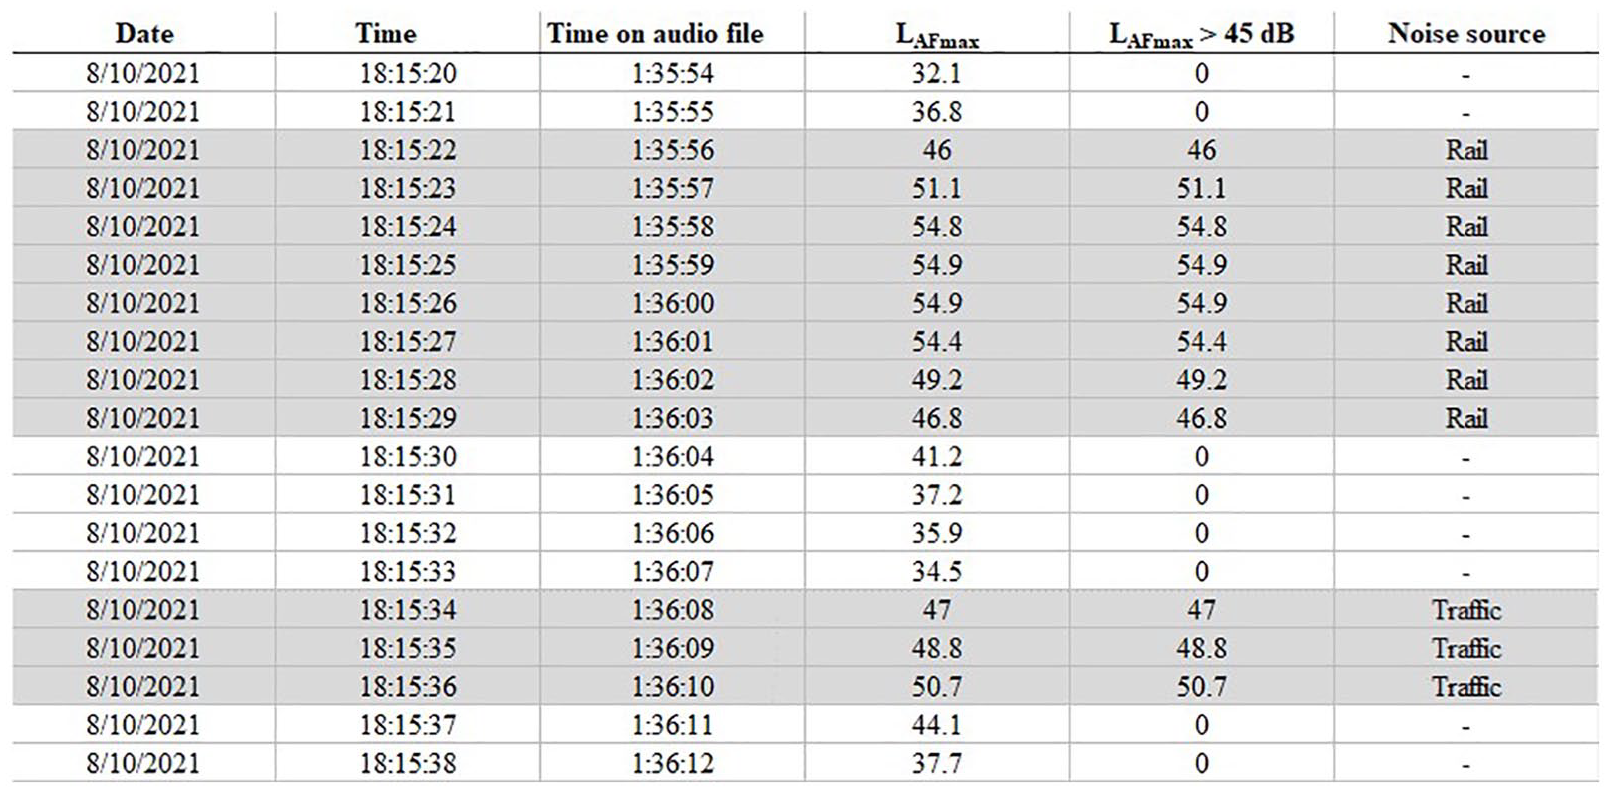
Noise source identification process: shaded rows represent the LAFmax values that are above 45 dB and the corresponding time on the audio files that are used to indicate the start and finish time of the listening process.
Results and discussion
Indoor noise levels and noise sources
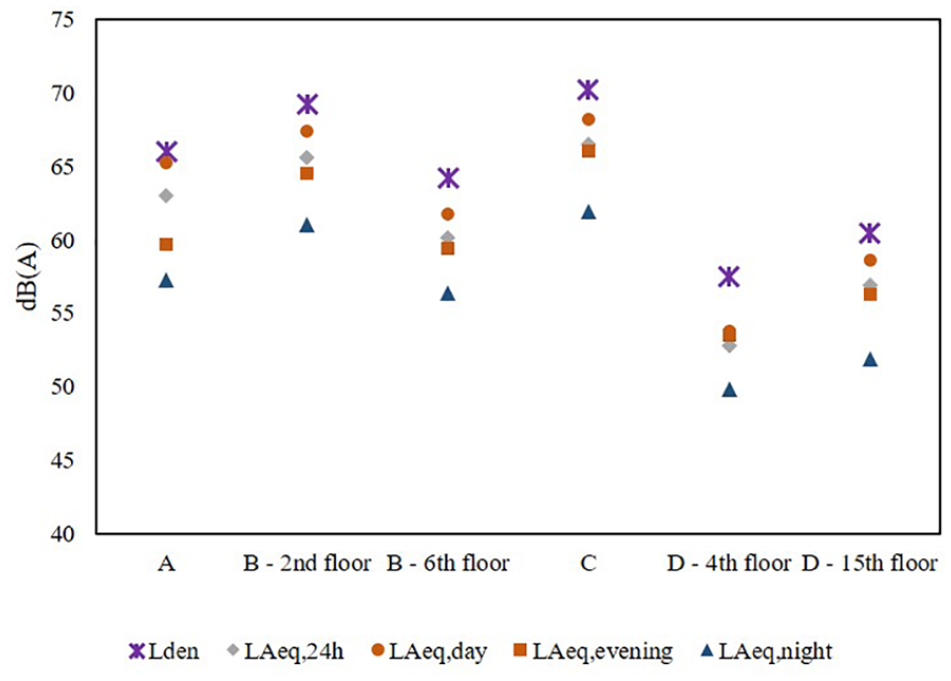
The indoor LAeq values for 24-h, daytime, evening and nighttime as well as Lden values are presented in Figure 4. The indoor L10, L50, and L90 values for both the indoor and outdoor measurements are shown in Figure 5. All LAeq values in all buildings, except the LAeq,evening on the 15th floor of building D, exceeded the recommended indoor LAeq values by WHO for daytime (35 dB(A)) and nighttime (30 dB(A)). The highest LAeq values are observed in Buildings A, C, and the fourth floor of building D where the indoor levels were above 40 dB(A). Looking at the differences in LAeq between the different times of the day, a slight decrease is observed between daytime and evening, and evening and nighttime levels for most buildings except Building D. The nighttime LAeq values for Building D were higher than daytime and evening levels. A closer inspection of the nighttime noise levels and audio recording in this building showed that the HVAC was off during daytime and evening but on during nighttime and was the main source of noise during this period.
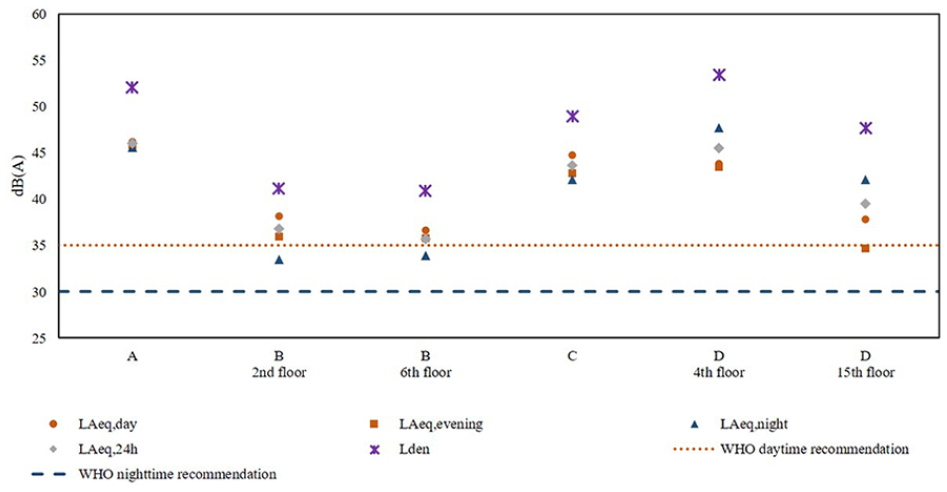
Indoor LAeq values for 24 h, daytime, evening and nighttime, and Lden.
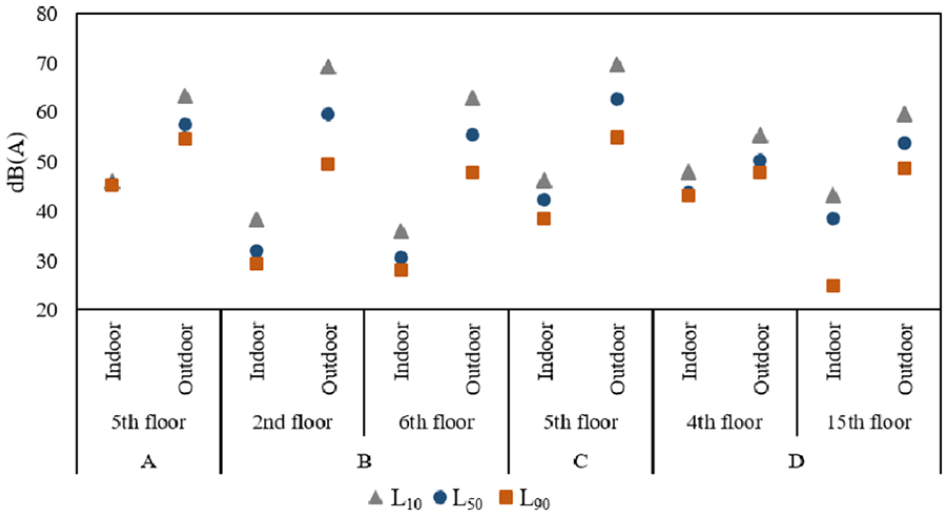
Indoor and outdoor L10, L50, and L90 values calculated for noise monitored continuously for 24 h in one suite per floor.
Unlike the findings of Locher et al., 24 glazing area, number of window panes and outdoor noise level were not found to have significant effects on the indoor noise level. For instance, building B has the highest window-to-wall ratio and the highest outdoor noise levels. However, the indoor noise level in this building is the lowest. Building A has the lowest window-to-wall ratio and low outdoor noise level compared to Building B and C. However, the indoor noise levels in Building A are higher than Buildings B and C. The main reason for this is the HVAC noise in Building A. The HVAC system was on for the entire monitoring period, and it was consistently high dominating the outdoor noise which resulted in the very small fluctuation observed in the building. As shown in Figure 4, the difference between daytime and evening levels, and evening and nighttime levels were only 0.4 and 0.2 dB, respectively, in this building. L n values presented in Figure 5 also confirm this. There is only a 0.7 dB difference between the indoor L10 and L90 values for Building A even though there is an 8.8 dB difference in the corresponding outdoor levels. Locher et al. conducted their measurements for only 3 min per measurement period/location. This would have allowed them to avoid periods where HVAC or other indoor noise sources could contribute to the indoor noise level. In the current study, the HVAC noise also contributed to the high LAFmax noise recorded in Buildings A and the fourth floor of Building D. The LAFmax values in these two buildings were above 45 dB(A) for the entire 8 h during nighttime. In other buildings, the LAFmax was only above 45 dB(A) for no more than 1.5 h during nighttime.
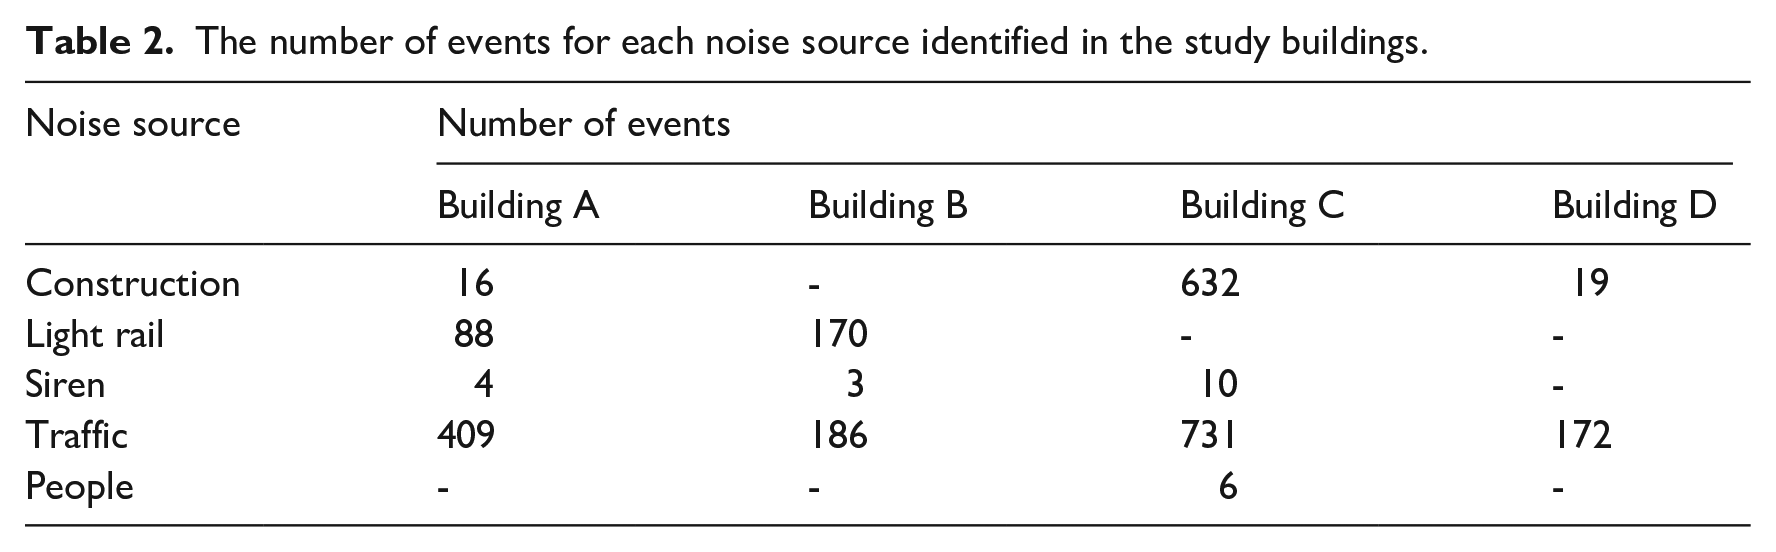
Results of the noise source identification are presented in Figure 6 and the number of events for the noise sources in each building are presented in Table 2. Light rail noise was only identified in Buildings A and B. Construction noise, mainly hammering and drilling sounds, was identified in Buildings A, C, and D, and was primarily heard during the daytime. People’s voices were only heard in Building C. Siren noise, typically louder than other noise types with median LAFmax values ranging from 47.6 to 52.3 dB(A), was heard in Buildings A, B, and C. Building C had the most number of events for siren noise (n = 10) compared to Buildings A (n = 4) and B (n = 3). However, the median LAFmax for siren noise in Building C was lower than the other buildings. Road traffic noise was heard in all buildings and had the lowest median LAFmax value ranging from 46.9 to 48.9 dB(A). Similar to siren noise, Building C had the most number of traffic noise events (n = 731). However, the median LAFmax for traffic noise in Building C was lower than Buildings B and D.
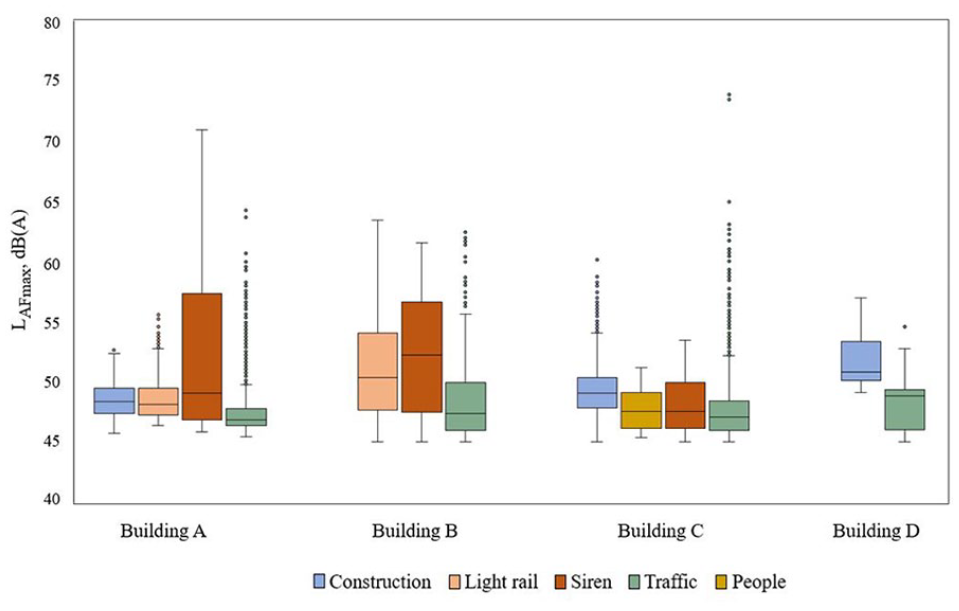
Indoor LAFmax values of the various noise sources heard in the test buildings. The middle lines represent the median value.
The number of events for each noise source identified in the study buildings.
Outdoor noise levels
The outdoor LAeq values for 24-h, daytime, evening and nighttime as well as Lden values are presented in Figure 7. The outdoor LAeq values ranged from 53.8 to 68.2 dB(A) for daytime, 53.5 to 66.0 dB(A) for evening, and 49.8 to 61.9 dB(A) for nighttime. The outdoor LAeq,24h values in Building D were 3.2–13.7 dB(A) lower than in other buildings. This could be because the building is not near major roads, which reduces exposure to traffic noise. Unlike the other buildings, the monitoring in Building D was conducted during the weekend when noise levels, specifically traffic noise, might be lower than during the weekdays. Indoor noise levels in this building, however, were not the lowest compared to other buildings due to the HVAC noise discussed previously. A comparison of the indoor levels at different floors in Buildings B and D shows that higher floors have lower indoor LAeq. The outdoor levels for Building B follow a similar trend with the LAeq,24 h on the sixth floor 5.5 dB lower than the second floor. For Building D, however, the outdoor LAeq,24h on the 15th floor was 4.1 dB higher than on the fourth floor. The monitoring on the two floors was conducted on different days and the outdoor noise levels were likely higher when the noise was monitored on the 15th floor compared to the fourth floor. Despite having higher outdoor noise levels compared to the fourth floor, the indoor noise levels on the 15th floor are lower than on the fourth floor. This suggests that the low indoor noise level on the 15th floor was not because of the reduction of outdoor noise exposure but might have been due to lower HVAC noise compared to that of the fourth floor.
Outdoor LAeq values for 24 h, daytime, evening and nighttime, and Lden.
Relationship between indoor and outdoor noise
The outdoor measurements in this study are conducted using a microphone attached to a window. In Section 4 of the WHO Guidelines for Community Noise, it is suggested that outdoor noise measurements be conducted at 1 m away from the façade of a building. 14 This, the measured values cannot be compared directly to the levels recommended by WHO. The outdoor measurements are, however, used in assessing the effectiveness of the façade in attenuating outdoor noise. A regression analysis was performed to investigate the relationship between indoor and outdoor noise levels. The results (Figure 8) show a weak correlation between indoor and outdoor LAeq. The outdoor noise level in Buildings A and B explains 45%–58% of the variability in indoor noise level. The time series data (presented in Figure 9) shows that indoor noise levels in Building A are mostly unaffected by outdoor noise levels due to the high HVAC noise level in the building. In Building C, outdoor noise explains only 22% of the variability in indoor noise. The higher effect sizes observed in the regression models developed for Buildings A and B are likely due to their single-glazed windows which do not provide much attenuation of outdoor noise compared to the triple-glazed windows in Building C.
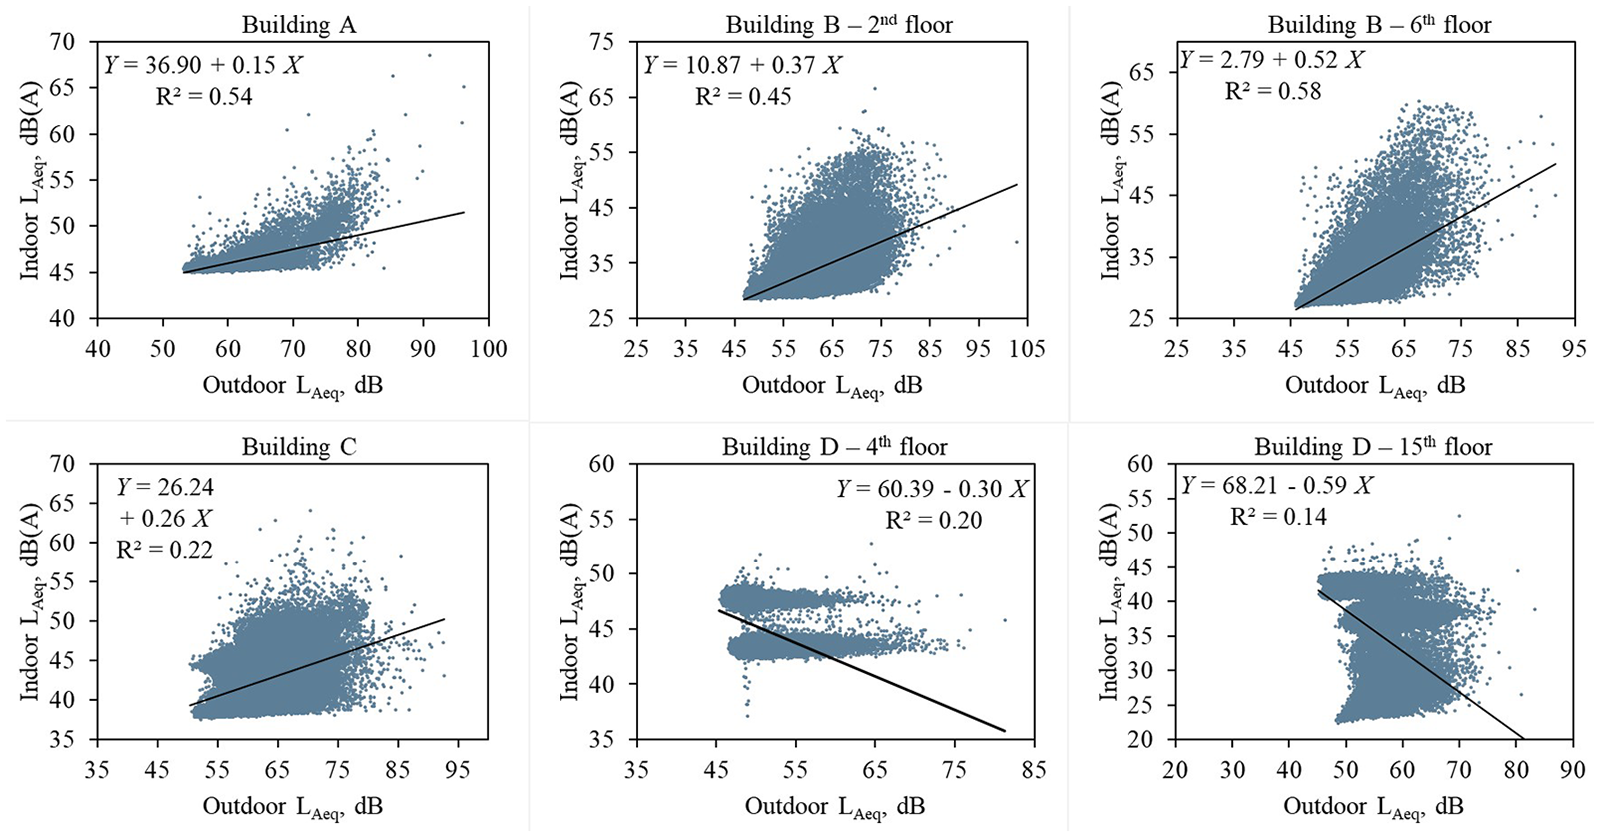
Results of linear regression analysis evaluating the relationship between indoor and outdoor LAeq in the study buildings.
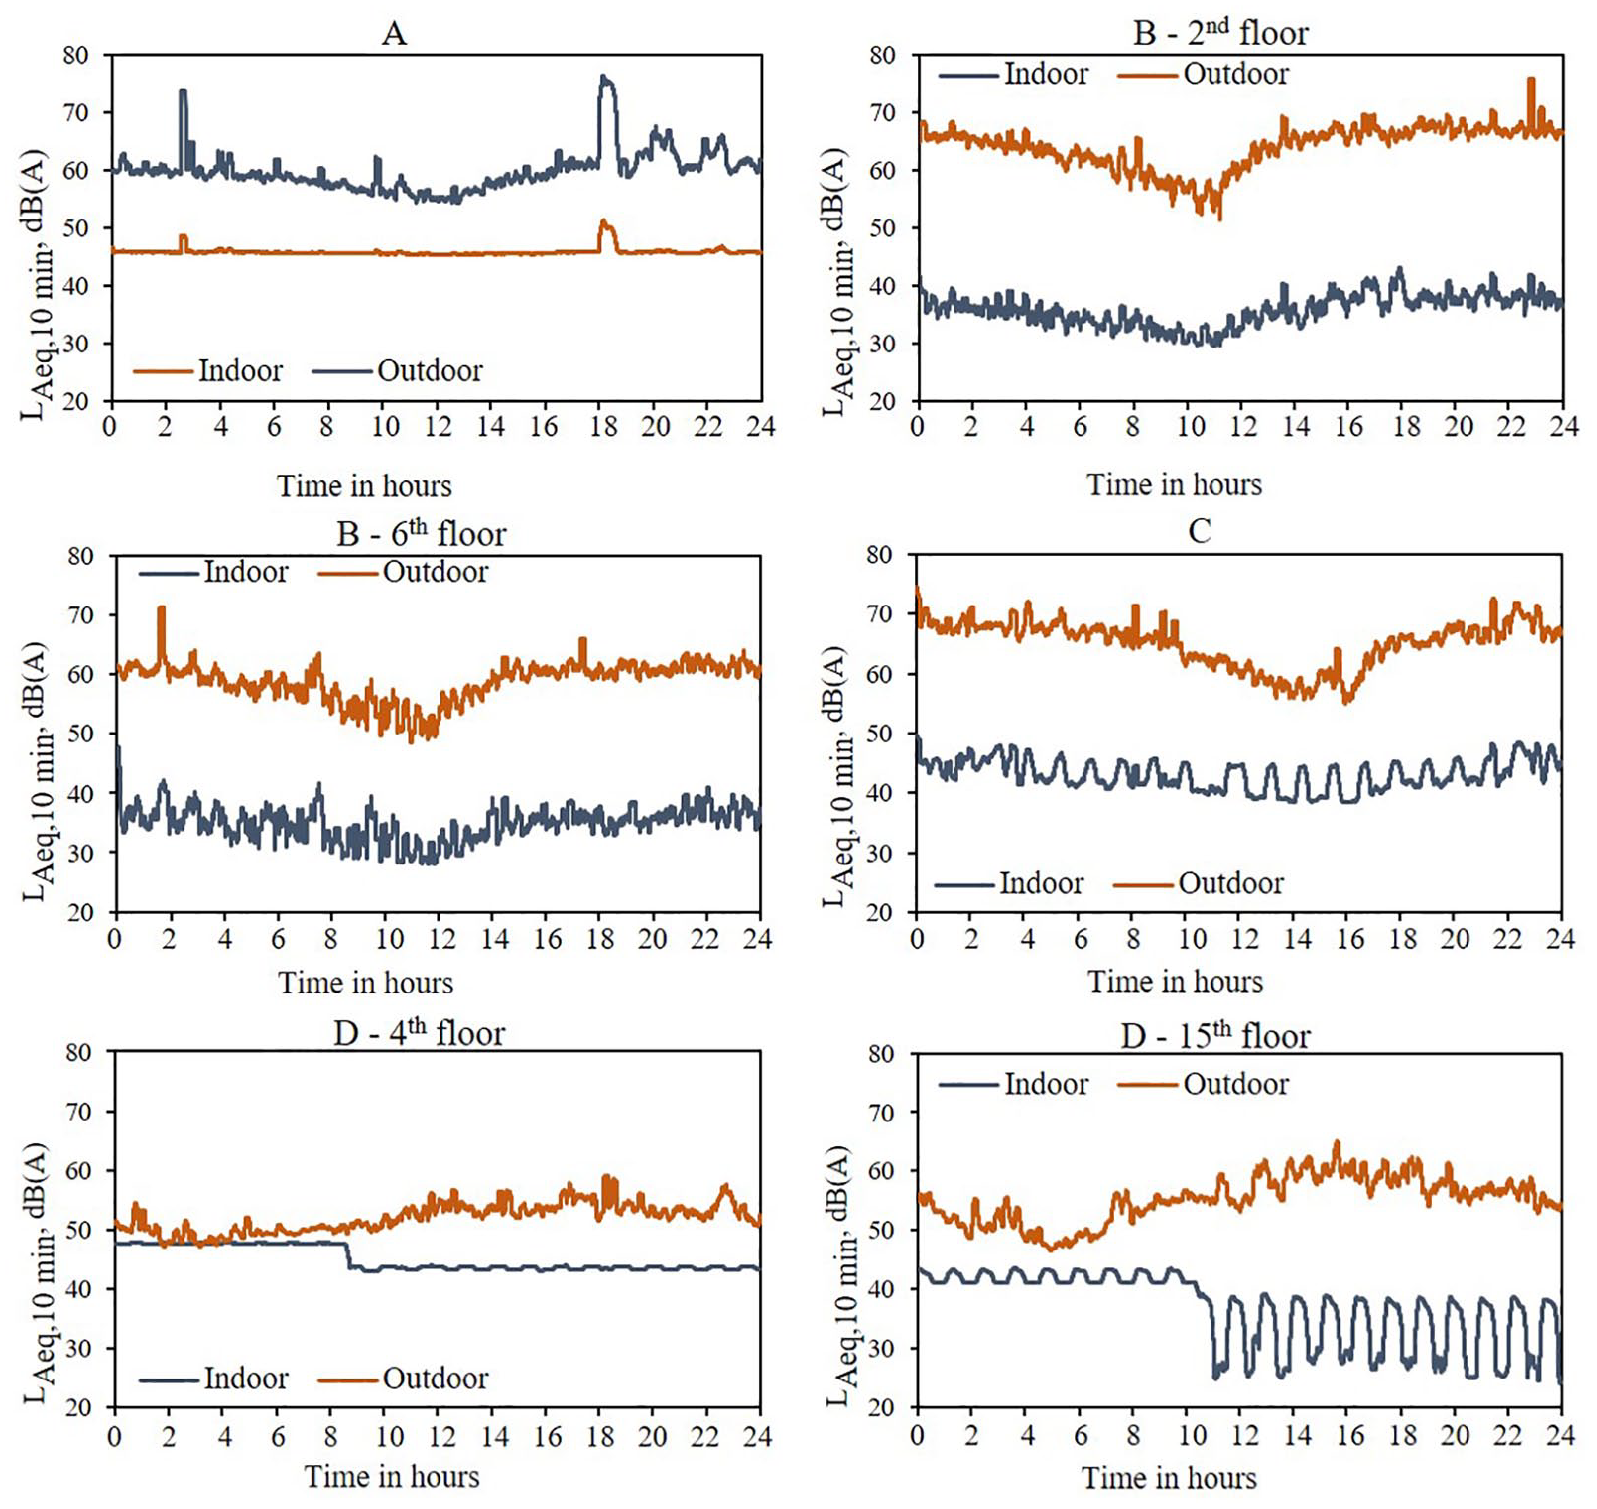
LAeq,10min for indoor and outdoor measurements recorded for 24 h in each study building.
For Building D, the regression coefficients were negative which suggests that, contrary to the expectation, indoor noise decreases with the increase in outdoor noise. But the R2 values are low (14% and 20%) which implies the strength of the relationship is very weak. Looking at Figure 9, indoor noise levels are largely unaffected by outdoor noise levels in Building D. As discussed previously, the HVAC was on during nighttime when the outdoor noise level was relatively low which can explain the negative correlation. Our findings suggest that outdoor noise levels alone do not sufficiently indicate indoor exposure levels. The weak correlation between the indoor and outdoor noise observed in this study agrees with the findings of other studies that also found weak associations between indoor and outdoor noise.29–31 These studies, however, were conducted in occupied suites and indoor noise was likely affected by noise generated from occupants’ activities. In the current study, measurements were conducted in unoccupied suites and noise from the HVAC systems is identified as the main reason for the weak correlation.
Survey responses
A summary of survey respondents’ demographic and suite characteristics is presented in Table 3. The suite numbers provided by the respondents were used to determine if a suite is facing a major roadway, or a courtyard/minor roadway. Most of the participants in Buildings A (96%) and C (78%) are in suites facing a courtyard or minor roadway with one or two lanes. In Building B, however, only 53% of the respondents are in suites facing a courtyard or a minor roadway.
Summary of key demographic and suite characteristics of survey participants.
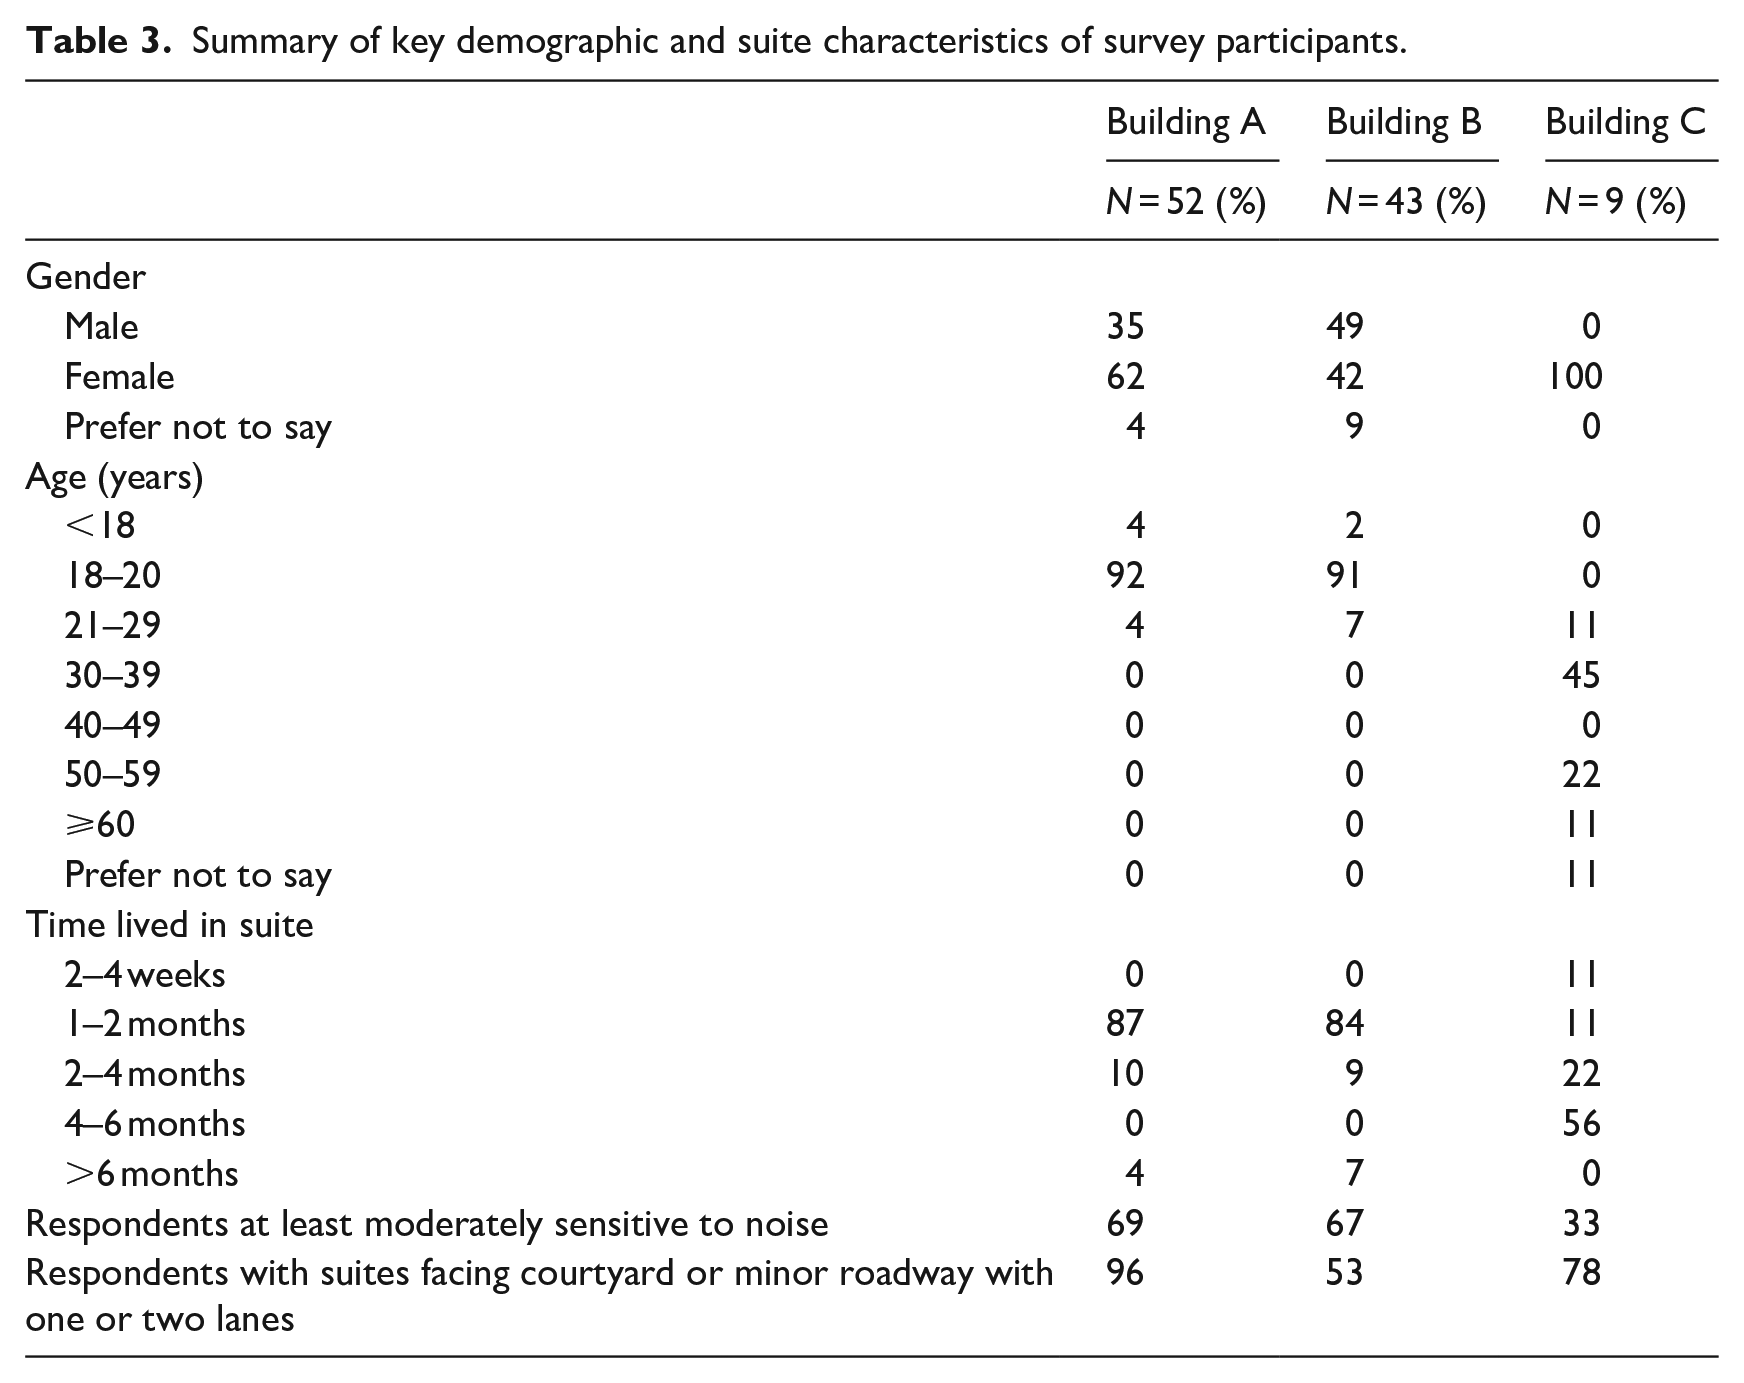
Figure 10 shows the percentage of respondents that reported some level of annoyance rating due to traffic, construction, outdoor neighborhood activities and overall outdoor noise for Buildings A, B, and C. For Building D, except for one respondent who indicated a slight level of annoyance due to traffic noise, all respondents indicated that they are not annoyed by outdoor noise. However, as indicated in Section 2.3, survey data from this building is excluded from the analysis. Occupants reported higher annoyance levels due to construction noise compared to traffic noise and noise from outdoor neighborhood activities. Approximately 90% of the respondents in building B and 68% in Building A reported that they are at least slightly annoyed by construction noise. Similarly, more respondents reported effects on daily activities, mental health and fatigue due to construction compared to other outdoor noise sources (Figure 11). Approximately 67% in Building B and 48% in Building A reported that construction noise affects their work or study. Even though construction noise was not identified in the audio recorded in Building B, the median construction LAFmax values in other buildings are generally higher than traffic noise (Figure 6). Construction noise was also mainly heard during the daytime which can cause interference to work or study performed at home and increased annoyance as a result.
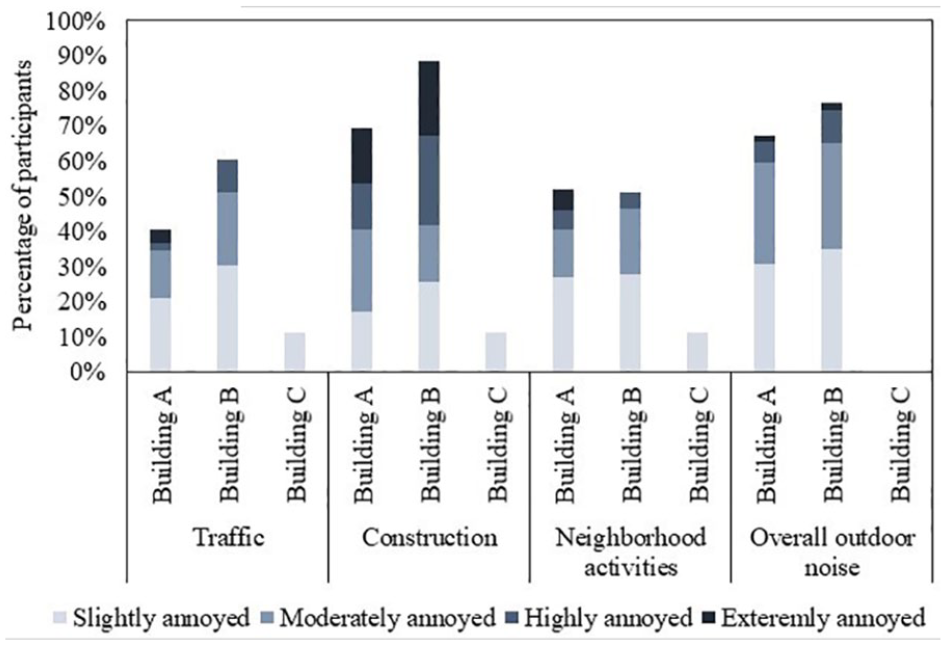
Reported annoyance levels with various outdoor noise sources.
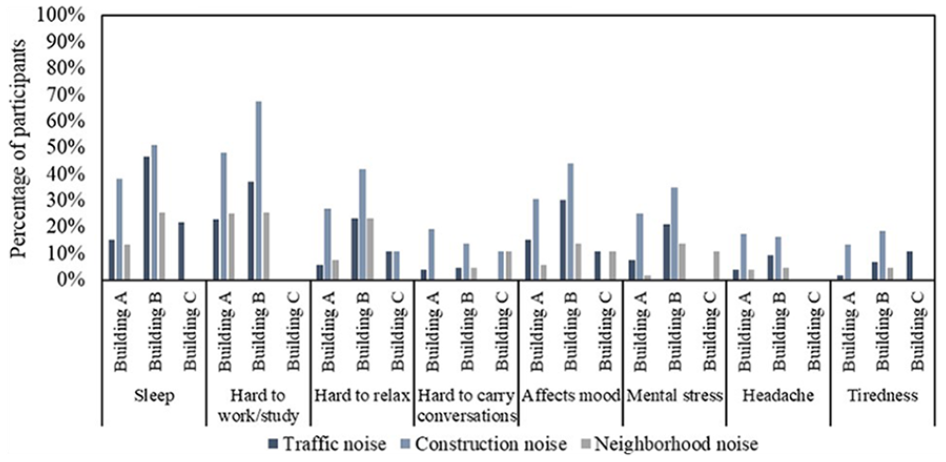
Percentage of respondents reporting effects of outdoor noise on daily activities, mental health and fatigue.
Since Building B has the lowest indoor noise levels, it was expected that its occupants would report lower annoyance levels compared to other buildings. However, the respondents in Building B reported the highest annoyance levels. It was also hypothesized that the high HVAC noise level and relatively lower indoor sound insulation levels in Buildings A and B would increase exposure to noise generated from inside buildings and have a masking effect on outdoor noise. But this was not observed in this study. Park and Lee 42 suggest that, instead of providing a masking effect, exposure to additional noise sources can increase noise sensitivity and worsen occupants’ perception of their building’s noise condition. Another explanation for the high annoyance levels in Building B is suite location. More respondents in Building B are in suites facing a major roadway compared to respondents in Buildings A and C. Wilcoxon rank-sum tests showed that respondents in suites facing a major roadway report significantly higher annoyance with traffic noise than other respondents (Wilcoxon W = 1363, p < 0.000). As expected, there was no significant difference in annoyance levels with construction noise (Wilcoxon W = 1061.5, p = 0.367), noise from neighborhood activities (Wilcoxon W = 828, p = 0.268) and overall outdoor noise (Wilcoxon W = 987, p = 0.831) based on suite location indicating that suite location affects exposure to and annoyance with only traffic noise. The findings are in line with other studies that also found that those at the most exposed façade report significantly higher annoyance levels than those on the quiet side.43,44 However, if traffic noise is very high, exposure at the quiet side might also be high. 45 The noise monitoring in the current study was only conducted at the most exposed façade thus it cannot be said with certainty that the low annoyance level is due to a reduction in traffic noise. Monitoring of both the most exposed and the quiet side is needed to confirm if there is a significant difference in the noise level.
Despite having the highest outdoor noise level and a relatively high indoor noise level, a Kruskal-Wallis test with post-hoc tests showed that Building C has a significantly lower annoyance rating for overall outdoor noise compared to Building A (p = 0.001) and Building B (p < 0.000). An explanation for the low annoyance rating in this building is the low self-reported noise sensitivity. Only 33% of the respondents reported at least a moderate sensitivity to noise compared to 69% in Building A and 67% in Building B. A Spearman rank-order correlation shows that there is a weak but significant correlation between overall outdoor noise annoyance and noise sensitivity (Spearman’s rho = 0.27, p = 0.005). Another reason is that, unlike Buildings A and B, occupants in Building C are not exposed to light rail noise which has a higher median LAFmax compared to traffic noise (Figure 6). This can result in lower annoyance with overall outdoor noise compared to the other buildings.
The lack of a strong correlation between the measured noise levels and reported annoyance ratings found in this study suggests that caution should be taken when relying solely on noise level measurements to determine effects on occupants. Factors such as noise sensitivity, the type and level of specific outdoor noise sources, suite location and exposure to indoor noise can be used to better understand occupants’ responses to outdoor noise. It should be noted that, since the monitoring was conducted when the buildings were unoccupied or only partially occupied, the noise monitoring and the survey were not conducted concurrently. Respondents were likely exposed to different noise conditions than those identified in the noise monitoring which may also be a reason for the weak relationship observed between measured noise levels and annoyance ratings. However, it is assumed that this only affected noise from construction and other sources that may vary significantly over time and that there was not a significant difference in traffic noise and noise from stationary sources.
Conclusion
In the present study, outdoor and indoor noise levels were monitored for 24 h in unoccupied suites in four MURBs. The levels and sources of outdoor environmental noise heard indoors were identified and the relationship between outdoor and indoor noise levels was evaluated. A survey was conducted after the buildings were occupied to collect information regarding occupants’ perception of outdoor noise and the potential effects of the noise on occupants’ daily activities. The noise level in the study buildings exceeded the limits recommended by WHO. The relationship between indoor and outdoor noise and the effects of glazing type were generally weak. Heating, ventilation, and air conditioning (HVAC) system noise was identified as the main reason for this weak relationship. The survey results identified construction noise as the most annoying noise source, and disturbance of sleep and work due to construction noise was more frequently reported than other outdoor noise sources. A weak relationship was found between measured noise levels and reported effects on occupants. The results highlight that outdoor and indoor noise level measurements alone may not be useful in evaluating occupants’ exposure to and perception of outdoor noise. The effects of other factors, such as the type of noise sources and suite location, should be considered.
Footnotes
Appendix
| Questions | Response options | |
|---|---|---|
| 1. | Gender | Male; Female; Prefer not to say |
| 2. | Age | Less than 18; 18–20; 21–29; 30–39; 40–49; 50–59; 60 or older; prefer not to say |
| 3. | For how long have you lived in your current residence unit? | <1 month; 1–2 months; 2–4 months; 4–6 months; More than 6 months |
| 4 | What is your apartment ownership status? | I am renting; I own the apartment; Other (please specify: __________) |
| 5 | Please enter your street address | _________________ |
| 6 | What is your suite/room number? | _________________ |
| 7 | How many bedrooms does your unit have? | Studio; One-bedroom; Two-bedroom; Three or more bedrooms |
| 8 | Are you currently sharing your unit with someone else? | Yes; No |
| 9 | Please specify the number of full-time occupants in your unit. | (Specify number for each age group) |
| • 18 years or older; 11–17 years old; 6–10 years old; 1–5 years old; 1 year old or younger | ||
| 10 | Is your unit located near (adjacent to or across the hall from) an elevator? | Yes; No |
| 11 | Is your unit located near (adjacent to or across the hall from) a garbage chute? | Yes; No |
| 12 | Is your unit adjacent to a roadway with 4 or more lanes (2 or more lanes each way)? | Yes; No |
| 13 | Please indicate if doors and windows are weather-stripped. | Yes; No |
| • Door to hallway; Windows; Balcony door | ||
| 14 | How would you describe your relationship with your upstairs neighbors? | Good; Neutral; Bad |
| 15 | How would you describe your relationship with your neighbors on your floor or downstairs neighbors? | Good; Neutral; Bad |
| 16 | Please indicate your typical schedule during weekdays. | Home and asleep; Home and awake; Away |
| 7 am–9 am; 9 am–11 am; . . . | ||
| 17 | Please indicate your typical schedule during weekends. | Home–asleep; Home–awake; Away |
| 7 am–9 am; 9 am–11 am; . . . | ||
| 18 | Thinking about your stay at your unit, how much were you bothered or annoyed by these outdoor noise sources? | Not annoyed; Slightly annoyed; Moderately annoyed; Highly annoyed; Extremely annoyed; Not applicable |
| • Traffic | ||
| • Construction | ||
| • Outdoor neighborhood activities: restaurants, people on the street, etc. | ||
| • Weather (e.g., wind) | ||
| • Other (please specify): _______________ | ||
| 19 | Thinking about your stay at your unit, how much were you bothered or annoyed by overall outdoor noise? | Same as above |
| 20 | Thinking about your stay at your unit, how much were you bothered or annoyed by these indoor noise sources? | Same as above |
| • Water installations: plumbing, flushing toilet, shower, etc. | ||
| • Heating/cooling: heaters, air conditioning, air supply grille, etc. | ||
| • Service installations inside unit: laundry machine, kitchen fan, etc. | ||
| • Service installations outside unit: elevator, garbage chute, etc. | ||
| • Noise through walls: people talking, etc. | ||
| • Footsteps, moving furniture and other impact noise | ||
| • Airborne noise through floors/ceilings: e.g., people talking. | ||
| • Noise from shared spaces: e.g., hallways and stairways. | ||
| • Other occupants in the same unit: talking, other activities | ||
| • Other (please specify): ________________ | ||
| 21 | Thinking about your stay at your unit, how much were you bothered or annoyed by overall indoor noise? | Same as above |
| 22 | Please indicate the time(s) of day when the following noise is the highest. Please select all that apply. (Same outdoor and indoor noise source options as questions #18 and #20) | Continuous; 7 am–12 pm; 12 pm–7 pm; 7 pm–11 pm; 11 pm–7 am; Not applicable |
| 23 | Please indicate the day(s) when the following noise is the highest. (Same outdoor and indoor noise source options as question #18 and #20) | Weekday; Weekend; Both; Not applicable |
| 24 | Please indicate any effects each noise source might have on your daily activities. Please select all that apply. (Same outdoor and indoor noise source options as questions #18 and #20) | Sleep disturbance; Hard to work/study; Hard to relax or watch TV; Hard to carry conversations; Affects my mood; Mental stress; Headache; Tiredness; No effect; Not applicable |
| 25 | Does your unit’s noise condition affect your work performance at home? | Yes; No |
| 26 | How does the noise condition in your unit affect your work performance at home? | Positive effect; Negative effect |
| 27 | Do you use any of the following noise mitigation measures in your unit? | Yes; No |
| • Close the window to block outside noise | ||
| • Use earplugs or noise-canceling headphones | ||
| • Play music/TV loudly to mask the noise | ||
| • Use a white noise machine | ||
| • Complain to neighbor about the noise | ||
| • Complain to residence manager or don about the noise | ||
| • Leave building when the noise occurs | ||
| • Adjust schedule to avoid loud hours | ||
| • Weather strip windows or balcony door | ||
| • Weather strip main door | ||
| • Use carpet or other finishing material to absorb noise | ||
| • Place large furniture where noise usually comes in | ||
| • I try to limit my noise-making-behavior (e.g. decrease music volume, keep noise down in hallways, etc.) | ||
| • Other (please specify): _________ | ||
| 28 | How satisfied are you with the overall noise condition in your unit? | Very satisfied; Satisfied; Neutral; Dissatisfied; Very dissatisfied |
| 29 | In general, how sensitive are you to noise? | Not at all; A little; Moderately; Highly; Extremely |
| 30 | How satisfied are you with the air quality (e.g. odor and air freshness) in your unit? | Very satisfied; Satisfied; Neutral; Dissatisfied; Very dissatisfied |
| 31 | How satisfied are you with the amount of daylight in your unit? | Very satisfied; Satisfied; Neutral; Dissatisfied; Very dissatisfied |
| 32 | Is there anything you would like to add regarding the noise comfort in your unit? | __________________ |
| 33 | How much more would you pay for a unit with better noise insulation? | 0% more; 10% more; 20% more; . . .; 100% more |
Declaration of conflicting interests
The author(s) declared no potential conflicts of interest with respect to the research, authorship, and/or publication of this article.
Funding
The author(s) disclosed receipt of the following financial support for the research, authorship, and/or publication of this article: Funding was received from the National Research Council of Canada, William O’Brien’s Ontario Early Researcher Award and Marianne Touchie’s Faculty of Applied Science and Engineering Dean’s Spark Professorship.