
Abstract
The high-speed trains designed and constructed in Indonesia will use Aluminum alloy Al 6061-T6 as a structural material. Aluminum alloys are prone to fatigue failure due to the absence of endurance limit of the material, hence fatigue life prediction has to be carried out. Fatigue cracks could initiate at the defects of welded joints. Analyzing the fatigue load spectrum of critical locations in the train structures is crucial to predicting fatigue life. These critical locations are selected from areas with high static stress and stress concentration. The loads are analyzed using the multibody dynamic with rigid body assumptions and track roughness following UIC Standard Code 518. The finite element method is used to calculate the stresses from the loads generated by the multibody dynamic. The load sequence is further analyzed with rainflow counting method, and the load exceedance curve can be constructed. Finally, the Miner Linear Cumulative Damage Model is used to predict fatigue life.
Introduction
The Indonesian government plans to build a high-speed train (HST) network, including, among others, the Trans-Sulawesi Railway, which commences with the route from Makassar to Pare-pare for a distance of 140 km. The maximum speed of the train is 220 km/hour. The structure of the carbody of the Indonesian HST uses Aluminum alloys with welding as the primary joining method. Since defects in the welded joint can become the initiation sites of fatigue cracks, fatigue analysis has to be performed for the carbody of HST. Four main methods can be used to assess the fatigue life of welded structures where three methods are based on S-N data, and the fourth is using the fracture mechanics approach [8]. To carry out the fatigue analysis for life assessment, the load spectra, which describe the in-service fatigue loads of the carbody, have to be developed. The load spectra have to include all the anticipated load occurring during the operation of the HST, i.e., dynamic forces due to acceleration, deceleration and turning, aerodynamic forces when the train enters tunnels, and aerodynamic forces when the trains pass each other and dynamic forces due to track irregularities. The dynamic forces in the carbody can be calculated using multibody dynamics, where the structures can be considered rigid bodies or flexible bodies. The analysis has to take into account track irregularity which indicate the geometrical deviations from an ideal track alignment that causes dynamic interaction in the train-track system [13]. Track irregularity, which is random in nature, causes the most important load amplification in the train-track system [5].
In the design phase of the current HST, it is assumed that it will be used for the route from Makassar to Pare-Pare only, with the assigned path and operational conditions. Some assumptions have to be made, i.e., for parameters which generate dynamic forces, i.e., track turns and number of stops. Track irregularity, which causes load amplification, is usually assumed based on the standards used [3], e.g., the European Standard EN13848, which is referred to other standards, e.g., International Union of Railway’s (UIC) in UIC Code 518 [4], Swedish Standard BVF 587.03 [2], Danish Standard Banenorm BN1-38-3 [1].
Track irregularity creates stochastic loading on the train. One method that can be used to model track irregularity is to describe the stochastic process in the frequency domain is the Power Spectral Density (PSD). Zhu et al. [12] modeled track irregularity, which includes data of vertical and alignment profiles as Gaussian random fields. PSD is calculated, analyzed, and fitted into typical PSD functions. The level crossing and peak statistics are applied here to calculate the number of zeros and peaks. The model is then treated as the input for the multi-body dynamic model of the train running on the track. Comparison with measurements showed that the estimated number of zeros is close to the observed, but the results for estimated peak numbers could be more satisfying.
Rennert [10] suggested a method to generate design load for rail vehicle carbodies, i.e., for trams, regional trains, and high-speed trains based on measured data. The final goal of the investigation is to improve the standard procedure for fatigue strength assessment of carbody of rail vehicles. The algorithm for generating combined operational load sequences was proposed, and recommended loading parameters were given for the fatigue strength assessment based on the cumulative damage approach in the design phase of the railway vehicle. For HST, the recommended acceleration in the longitudinal direction is 1.5, for the lateral direction 1.2, and for the vertical direction 0.25.
Lu et al. [7] performed a modal analysis of the carbody by combining the track irregularity spectrum function of the Chinese ballastless track with the carbody dynamics model. From the modal displacement response, the stress response, i.e., the stress history at the location of interest, is obtained. Fatigue analysis was carried out using the cumulative damage theory or Miner rule, where the damage contribution of each load level of the load spectrum is computed and added, from which the fatigue life can be obtained.
In the present work, the fatigue load spectrum for the Indonesian HST to be used for the route from Makassar to Pare-Pare is generated. The train is assumed to be used only for this specific route so that the load spectrum to be predicted consists of only loads in one trip. If in the future, the train is used for another route, the additional load can be added to the load spectrum. The route from Makassar to Pare-pare defines the distance to be traveled, the number of stations to be visited, accelerations and decelerations, the number of turns, and the length of straight paths. From the route information, including the assumed condition of the track and the train structure, the multibody dynamic analysis is performed. The results of the multibody dynamic analysis are acceleration as a function of time which is then used as input for finite element analysis (FEA) to obtain stresses. The FEA is performed at a small interval of acceleration data. A total number of more than 12000 data points of acceleration vs. time were calculated using the FEA. The sequences of stresses at critical fatigue areas are then processed with rainflow counting method. The Linear Cumulative Damage Model is used to predict the fatigue crack initiation life at critical fatigue locations. This research is dedicated to the development of a numerical procedure for analyzing the fatigue life of an Indonesian high-speed train. Following the construction of the train prototype, an experimental validation will be undertaken in the future.
Trip profile
The load spectrum of the current HST is developed specifically for the trip from Makassar to Pare-Pare, with a distance of 140 km having seven stations in between. The trip is dominated by a straight/tangent track interspersed with a curved track of various lengths with a radius mostly between 2000 m and 2500 m. The quality of the track for numerical simulation is defined based on the International Union of Railways (UIC) described as Good and Bad. Figure 1 shows the irregularity in UIC Standard Code 518 for Good and Bad condition in 1000 m.
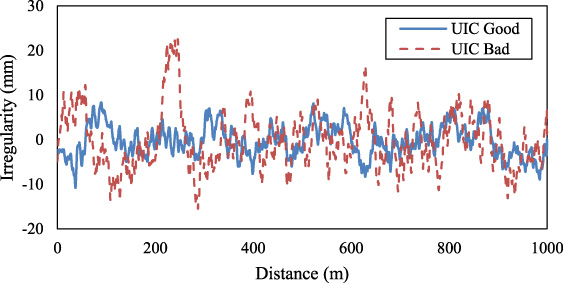
Quality of the track according to UIC Standard Code 518.
Load cases for load spectrum generation
To simulate the load spectrum for the trip, 12 load cases are considered, as shown in Table 1. Load cases 1-6 are for UIC standard good condition, while load cases 7-12 are for UIC Standard bad condition. The speeds considered for the straight/tangent track are 110 km/h and 250 km/h. The load spectrum will be generated from each load case separately and then combined to generate the load spectrum for one trip.
The multibody dynamic (MBD) analysis is used to study the dynamic behavior of the train and to investigate the forces due to dynamic motion in the train components, such as the bogie. The train will be modeled as a rigid body, and the bogie will be modeled as suspension and damper. For the simulation, one carbody is represented with two bogie frames and four wheelsets; see Fig. 2 [9].
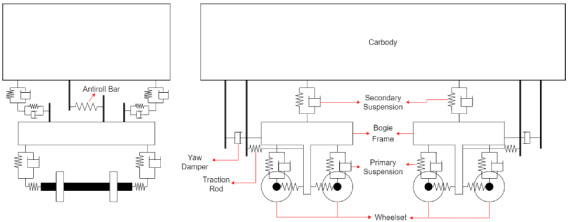
Multibody dynamic model of the carbody with bogie frame and wheelset [9].
Each wheel in the wheelset is attached to the primary suspension, which is then attached to the bogie frame. The secondary suspension is then connected to the bogie frame of the carbody. The hierarchy of the model is shown in Fig. 3 [9].
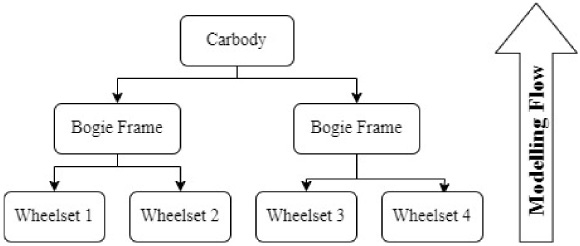
Hierarchy in multibody dynamic modeling of the carbody [9].
The result of the multibody dynamic modeling is the excitation load with respect to time in terms of ΔG for each bogie [9]. Combining the 12 load cases for each trip (see Table 1) with four wheelsets will result in 48 sets of data. Figure 4 shows an example of the data at one bogie showing variation in the vertical direction as a function of time at one wheel using UIC Bad and Good Standard.
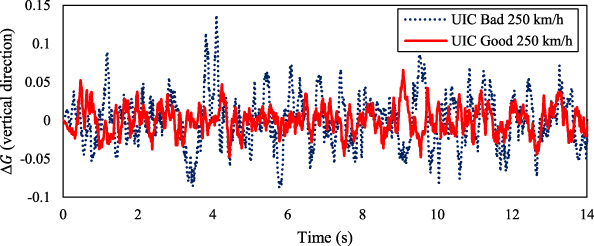
ΔG vs time in vertical (Z) direction [9].
The values of ΔG at a certain interval are then used to calculate the stress distribution in the carbody using finite element method, in this case, the Abaqus. For some fatigue critical locations, the stress time history is extracted to generate the stress spectrum of the area.
2D-quadrilateral shell elements are used in the finite element model. The model is generated from the 3D CAD of the train, which is transformed to 2D CAD, which is then meshed and provided with boundary conditions in Abaqus/CAE. The acceleration ΔG in x, y, and z directions are applied at the four bogies depending on the load case, and weight forces are applied at the carbody based on weight distribution. The element size varies from a relatively fine mesh of 25 mm to a coarse mesh of 75 mm. The number of elements generated is 479644 elements, while the number of nodals generated is 400768.
Generation of load spectra
The trip from Makassar to Pare-pare is constructed by combining the load cases in Table 1. The combination gives a total of 12 load cases for a complete trip. The multi-body dynamics simulation gives the variation of ΔG as a function of time for the complete trip, for the purpose of finite element analysis (FEA) the ΔG history is discretized at a certain time interval. The number of ΔG data for one trip is 313380. The values of ΔG at four bogies of the carbody are then used as an applied load to the train, together with the weight of payloads and other weights located at different locations. The influence of the track irregularity on the carbody is already included in the multi-body dynamic load cases given in Table 1. The results of the FEA for all ΔG data in one trip give the stress history at any location of the carbody. Furthermore, an example of a stress–time history graph is obtained using the numerical simulation shown in Fig. 5. Figure 5 is the result of one of the tangent track cases with UIC Bad with a speed of 250 km/h. If combined with the results from all cases (Table 1), an exceedance curve will be obtained, as shown in Fig. 6.
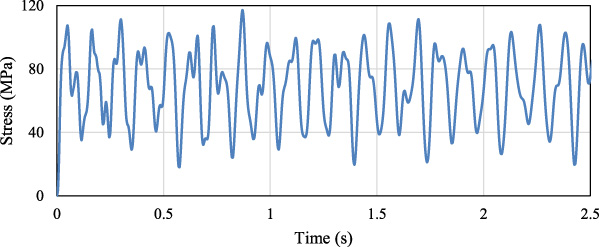
Stress–time history of one critical location of tangent track case.
Critical locations for fatigue are determined by inspecting the area with high stresses, in this case, the maximum principal stress and area having stress concentration. The stress history of the critical location is then processed with the rainflow cycle counting, giving the stress range of each load cycle. The results of the rainflow counting are plotted as an exceedance curve, which shows the number of cycles exceeding a certain stress level. Stress amplitude lower than the endurance is omitted because it does not contribute to fatigue damage. Figure 6 shows an example of rainflow counting for one critical location.
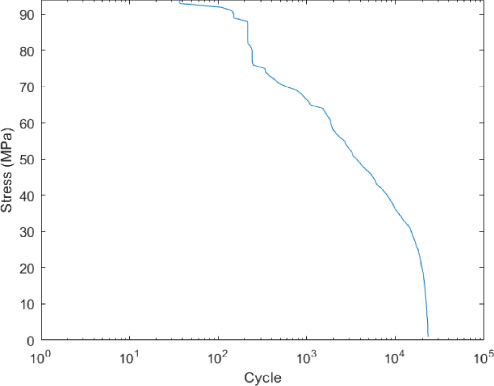
Rainflow counting for one critical location at HST.
To analyze where the high stress data comes from, a normal mode analysis is performed to determine the natural frequency of the structure. The illustration of the deformation shape of each natural frequency is shown in Fig. 7. Figure 7a shows the critical mode, which is the first bending mode of the carbody that occurred at 9.3 Hz. Figures 7b and 7c show the torsional mode of the carbody at 12.175 Hz and 14.03 Hz.
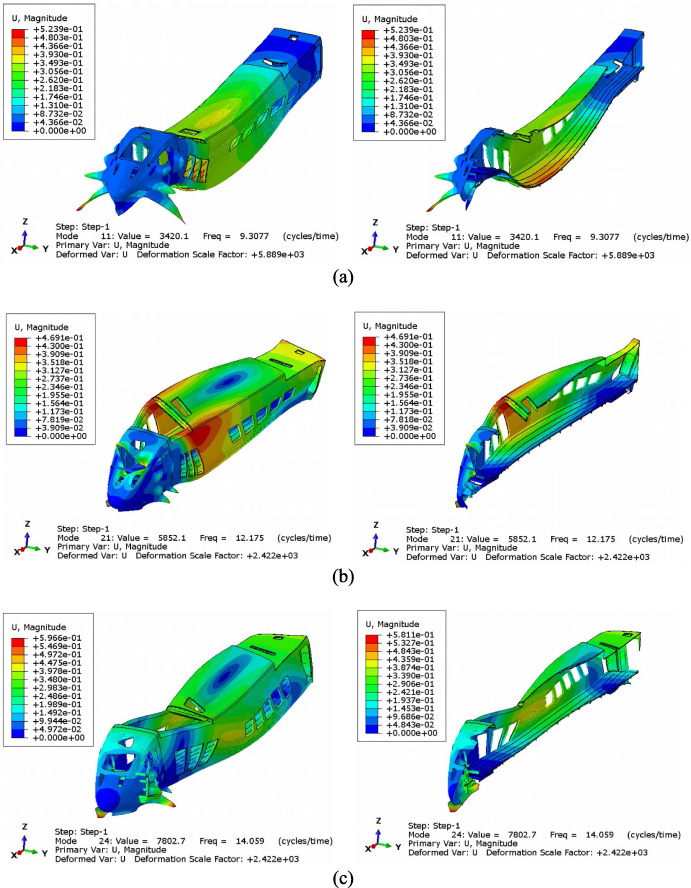
Deformation shape of each natural frequency: (a) first mode (9.31 Hz), (b) second mode (12.18 Hz), (c) third mode (14.06 Hz).
Fast Fourier Transform (FFT) analysis is performed on the input ΔG with the results shown in Fig. 8 to determine which mode dominates. Figure 8 shows that the load that occurs the most has a frequency of 2 Hz. However, loads with a frequency of around 9 Hz still often occur. This is feared to trigger a resonance in the carbody structure according to the mode in Fig. 7a. To support the previous hypothesis, FFT analysis will be carried out on the stress response of the structure at one of the critical points, with the results shown in Fig. 9. From these results, it is obtained that the stress response of the structure has the most frequency, around 9 Hz, which indicates that the mode in Fig. 7a completely dominates the response of the structure. Based on regulation, the structure is required to have a natural frequency for the first bending mode above 12 Hz [11]. Hence, it is necessary to strengthen the structure to increase rigidity and comply with regulatory requirements.
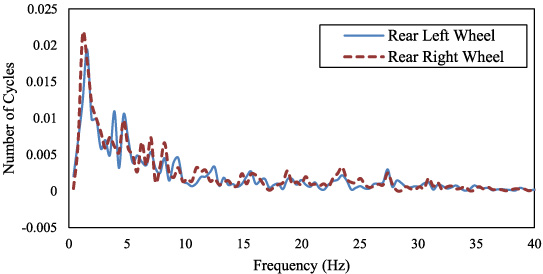
FFT results of ΔG input.
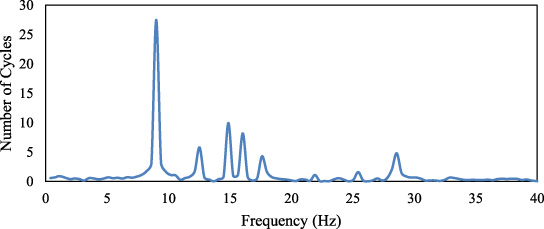
FFT results of stress response of the structure.
The fatigue load spectrum of Indonesia HST for the route from Makassar to Pare-pare is generated based on the realistic trip profile with the number of turns, straight path, stations, and track roughness adopted from UIC standards. The multibody dynamic modeling for the HST is then used to calculate the acceleration at four points in the train. The accelerations are then used to calculate stress history as critical fatigue points.
In generating the load spectrum, the rainflow counting results in load cycle data which only gives the stress range, which is common practice in constructing the load exceedance curve. This data does not consider the effect of the mean stress of the cycle on the predicted life of the structures. It should be noted that mean stress reduces fatigue life, i.e., crack initiation and propagation life. Especially for crack propagation, the crack opening will be larger at higher mean stress, which means the crack growth rate will be faster. In the meantime, the rainflow cycle counting is suggested to be modified by adding other dimensions in the record of the loads, which can be the mean stress or recording the maximum and minimum stress, which has embedded mean stress data.
From the observations of the ΔG history for one trip, the variations of the values are quite small in the order of 0.1. In contrast, the maximum values of maximum stresses in the stress history can be 50% of the yield strength of the material. A study of the natural frequency is carried out to investigate the discrepancy in the magnitude of the stress level. Figure 9 shows that at frequencies 8–10 Hz, a significant increase that could cause the stress levels to reach a high value, in this case, around 50% of the yield strength of the material.
For generating the load spectrum, the UIC track roughness is adopted. It is suggested that the track roughness for the trip from Makassar to Pare-Pare is measured to obtain the realistic values of ΔG history and stress history to calculate the fatigue life of the train. The workmanship partly generates the track roughness during the construction of the track. Thus, it is necessary to carry out the measurement, which can be used in the future as a database for HST train design in Indonesia.
The current fatigue life prediction is based on the Miner Linear Cumulative Damage rule, which predicts the crack initiation life. Since aluminum is used as the material for the structure of the HST, it is suggested that in the future, the crack growth life is also predicted using the fracture mechanics approach. The approach can adopt the methodology used to predict the crack growth life of aircraft structures, i.e., the damage tolerance methods. In the method, the initial manufacturing damage, in the case of the HST, is the welding defect, which has to be determined. The values of the initial manufacturing damage could be adopted from the regulations used for aircraft structures, especially for welding used in aircraft engine mounting. It should be noted that the values of initial welding defects in the engine mount of aircraft are much smaller than in the defects in train structures due to the more stringent requirements for engine mount structures. This difference will lead to longer crack propagation life. However, a first approximation can be adopted. At the same time, data for initial welding defects of train structures have to be compiled, especially the defects resulting from the manufacturing of welded joints by the train manufacturer. Another important note in predicting crack propagation life is the availability of crack growth data at constant amplitude loading for the aluminum alloys used, and the fatigue crack growth at welded joints. It is also suggested that a fatigue test is carried out for specific welded joints to validate the prediction.
The results of the fatigue life predictions using the Miner Linear Cumulative Damage Model show that some critical areas have an infinite crack initiation, which means that fatigue damage is expected not to occur in the areas. For areas where life is relatively short, the life can be extended by reducing the stress in the area by adding thickness or reinforcement of the area. Some structural modifications can be suggested in the areas.
Conclusions
The results of the present investigation show that the crack initiation life of The Indonesian HST for the trip from Makassar to Pare-Pare has to be modified in some structural areas to increase the crack initiation life. Further investigation on the fatigue life has to include crack propagation life using the fracture mechanics approach or damage tolerance analysis of the HST structure. If, in the future, the train will be used for other routes in the Trans Sulawesi Railway, the fatigue load spectrum has to be modified, and the fatigue life prediction has to be carried out for the new load spectrum.
Footnotes
Acknowledgements
The research reported in this publication was funded by Indonesia’s Ministry of Education Culture, Research and Technology (Kemdikbudristek) under the 2022 Kedaireka Matching Fund scheme.
Conflict of interest
None to report.