
Abstract
Reliable assessment of airborne infrasound emitted by natural and technical sources has been gaining importance, while technology is limited and regulations are not sufficient in the infrasound frequency range. This paper provides a comparison of measurement microphones and microbarometers used for infrasound measurements in the field near wind power plants. Simultaneous measurements with both sensor systems were conducted at multiple sites in the vicinity of a wind park. Based on these measurements, it was shown that wind-induced noise is a major concern when measuring infrasound in the field. For this reason, additional experiments were conducted in an aeroacoustic wind tunnel to further investigate the sensitivity to wind of the sensors used. A combination of field measurements and laboratory experiments was applied to determine the influence of wind-induced noise in a real-life situation and multiple strategies are discussed for establishing quality criteria and controlling the influence of wind on such measurements.
Introduction
The transition of energy production from CO2-emitting technology to renewable sources poses many technical challenges. In particular, the construction of new wind power plants often induces concerns about noise emission and its impact on citizens living in the vicinity of these wind parks. While sufficient technology and regulations exist to measure and assess this noise in the audible frequency range, there are only limited measurement capabilities and experience that cover the infrasound frequency range below 20 Hz. In practice, the established normative regulations for sound level meters cannot be applied at frequencies below 10 Hz, so no approved devices for sound level measurements in that frequency range are available. Furthermore, it has to date not been possible to realize traceability for microphones below 2 Hz, because the calibration capabilities worldwide for this frequency range are still in the experimental stages. There moreover exists little knowledge about the behavior and the properties of various acoustic sensor types when used in the infrasound frequency range. This limits the reliability of measurements conducted in this range using equipment that was basically engineered for the audible frequency range.
Measurements of sound emission represent the basis of the sound assessment methodology applied to analyze the exposure situation at particular sites, and such measurements are required for an investigation of infrasound emission at wind parks. This is particularly relevant with respect to the ongoing discussion about the impact of infrasound on humans, a discussion which should be supported by objective knowledge. 1 For this reason, the research project Infra-AUV “Metrology for low-frequency sound and vibration,” 2 working within the European Metrology Program for Innovation and Research (EMPIR), addresses the issue of reliable and traceable measurements of airborne sound, underwater sound, and vibration in the infrasound range. This work includes the development of calibration facilities and testing methods 3 as well as the testing and development of measurement methods for efficiently and appropriately determining noise exposure levels at low and infrasound frequencies.
To date, various attempts have been made to determine noise levels at audible and infrasound frequencies. Blumendeller et al. 4 used measurement microphones with two windscreen configurations, one conforming to IEC 61400-11 5 and a second using a windscreen box buried flush to the ground surface. Additionally, meteorological data were recorded near the measurement site. Keith et al. 6 also used measurement microphones with multiple windscreen configurations. As a quality metric, the visibility of peaks in the frequency domain originating from the blade passing harmonic of wind turbines was used. In a sequel publication, 7 the same group used microbarometers to measure infrasound at large distances from the wind park. They investigated the correlation between sound pressure level and distance and found a strong dependence on weather and environmental conditions. By comparing windscreen setups conventionally used, respectively, for microphones and microbarometers, a wind noise criterion was deduced and applied for data quality assessment. Hansen et al. 8 compared measurements from multiple windscreen configurations and used the level differences between the configurations as the quality metric. Møller and Pedersen 9 also applied a windscreen setup conforming with IEC 61400-11 and evaluated principal characteristics of wind park noise emission. They were able to show that noise emission increases with the electrical power of the machines, and that the low-frequency noise content also becomes more prominent the larger a turbine is. Turnbull et al. 10 placed the microphones below the ground surface in an earth chamber to reduce wind noise and other disturbances and obtained highly consistent results. Marcillo et al. 11 used microbarometer array stations to detect signals from a wind farm over long distances. Using elaborate beamforming techniques, they were able to detect signatures from the blade passing harmonics of the wind turbines in distances up to 90 km.
In general, microphones and (in fewer studies) microbarometers have to date been employed for the study of low-frequency sound fields near wind energy systems, even though the frequency application ranges of these two technologies are quite disjunct. Measurement microphones are traditionally used at higher, audible frequencies, although there are also types available that are specially designed for low frequencies. 12 Microbarometers were specifically engineered for very low frequency applications below 2 Hz and are used, for example, in the International Monitoring System (IMS) run by the Preparatory Commission for the Comprehensive Nuclear-Test-Ban Treaty Organization (CTBTO). 13
In this paper, the performance of both sensor types is compared in order to evaluate the quality of the data which can be obtained near wind power plants. Special focus is placed on the impact of environmental factors on measurements. Wind in particular is a main deteriorating factor that influences both sensor systems, albeit in very different ways. To investigate this issue, measurements were carried out at low frequencies in the vicinity of a wind park near Gagel in the state of Saxony-Anhalt, Germany. The microphone measurements followed the standard procedure of IEC 61400-11 5 extended by a second microphone setup used in parallel to detect the effect of wind. These measurements were accompanied by the deployment of microbarometers. This enabled a direct comparison of the performance of the two measurement systems in a real-life application. To obtain reference values for the level of noise produced by the wind, measurements of wind noise were conducted in an aeroacoustic wind tunnel with known wind speed settings. Based on the values determined from the wind tunnel measurements and the comparison with the microbarometer measurements, it was possible to derive a preliminary criterion for classifying microphone results so that measurements excessively disturbed by wind could be identified and discarded.
Measurement setup and data analysis
In July and August of 2021, the Bundesanstalt für Geowissenschaften und Rohstoffe (BGR) carried out continuous measurements of infrasound near the Gagel wind park located in Altmärkische Höhe, Saxony-Anhalt, Germany. 14 Seven measurement stations equipped with microbarometers of types MB2000, MB2005, and MB3d were set up at locations of increasing distance from the wind park. These microbarometers were designed by the French Alternative Energies and Atomic Energy Commission (CEA) and manufactured by Martec and Seismo Wave, respectively. The MB2005 microbarometer consists of an aneroid capsule with one side attached to the frame of the microbarometer. The other side of the aneroid capsule can move freely and is deflected by pressure changes. This displacement is detected by a Linear Variable Differential Transformer (LVDT), which converts the absolute position of the mobile face of the aneroid capsule to a voltage. 15 This measurement principle has no inherent lower frequency limit and is generally suitable for measurements of static pressure as well as infrasound. The sensitivity of these microbarometers exhibits a bandpass behavior with lower and upper cutoff frequency (-3 dB) of 0.01 Hz and 27 Hz, respectively. The stations were located on ground areas covered primarily with trees and dense bushes to shield them from wind and thus mitigate wind-induced noise. To further dampen wind-induced noise, an inlet system consisting of a porous tube laid out in a circle with a diameter of approximately 2 m was mounted on the air inlets of the microbarometer. It should be noted that the frequency response specified by the manufacturer does not include the inlet system, which likely influences the frequency response of the microbarometer system. 16 The electrical output signals of the microbarometers were digitized with a sample rate of 100 Hz using an analog-to-digital converter of type Quanterra Q330s+ and directly transferred via a cellular link to the BGR data center. 17 These stations continuously recorded the infrasound signals in the environment generated by any source. Measurement data were acquired continuously over a timeframe of 7 weeks. The raw data are available online via the FDSN Web Services run by the International Federation of Digital Seismograph Networks. 18
Along with these measurements, additional microphone measurements were conducted by the Physikalisch-Technische Bundesanstalt (PTB) at three of the stations. The details of the measurement setup, the obtained data, and the basic analysis were published in an open-access data repository.
19
Here only the most important facts concerning the setup are repeated and supplemented by further investigations and evaluations. The microphone measurements were carried out as short-time measurements performed under observation with a recording length of approximately 45 min. For these short-time measurements, two identical microphone sets were used, each consisting of a Brüel & Kjær 4964 1/2′′ infrasound microphone capsule, a GRAS 26AK-S1 low-frequency preamplifier and a GRAS 12AD power module. These microphone sets exhibit a high pass behavior with a lower cutoff frequency (-3 dB) of 0.2 Hz. One of the microphones was equipped with a spherical windscreen with a diameter of 90 mm and mounted approximately one meter above ground, a setup referred to here as “microphone on tripod.” The other microphone, here referred to as “microphone on plywood base,” was equipped with a hemispherical windscreen with a diameter of 90 mm and mounted under a secondary windscreen with a diameter of 470 mm on a plywood base at ground level according to IEC 61400-11.
5
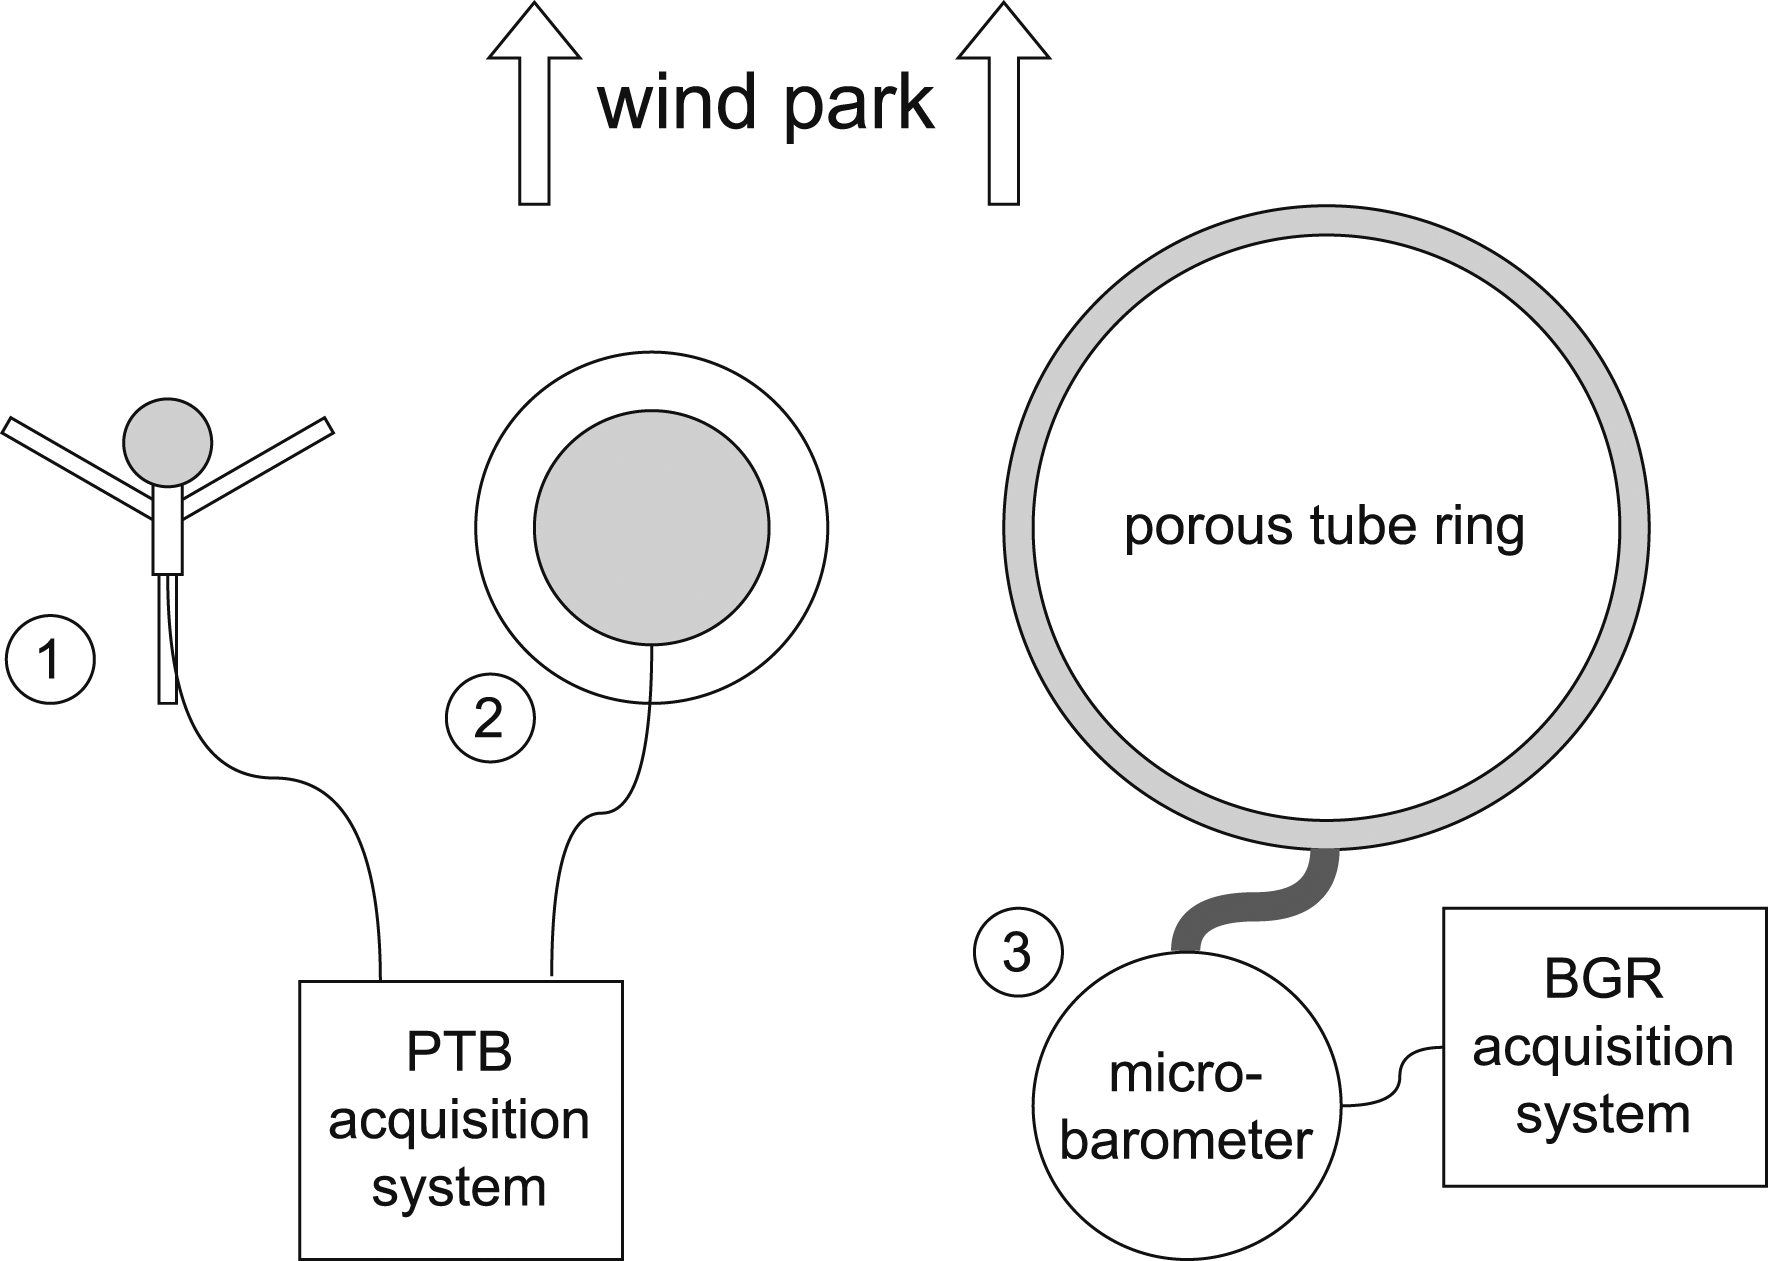
Such a windscreen setup is usually used without further wind shielding by vegetation to measure low-frequency emissions from wind turbines. A sketch of this setup is shown in Figure 1. The whole setup in the field containing these measurement sensors is depicted in Figure 2. Note that the sketch is not to scale. The diameter of the porous tube ring was 2 m, while the distance between the ring and the microphones amounted to about 5 m. Microphone setup “microphone on plywood base” consisting of a 1/2′′measurement microphone equipped with a hemispherical windscreen with a diameter of 90 mm mounted on a plywood base. For extra shielding against wind noise, the plywood base is equipped with a secondary windscreen with a diameter of 470 mm. This setup conforms to IEC 61400-11.
5
Top view on the setup of the microphones and microbarometer in the field. Measurement microphone on the tripod with spherical 90 mm windscreen (1), measurement microphone on the plywood base with secondary 470 mm windscreen (2), and microbarometer with circular porous tube as inlet system (3).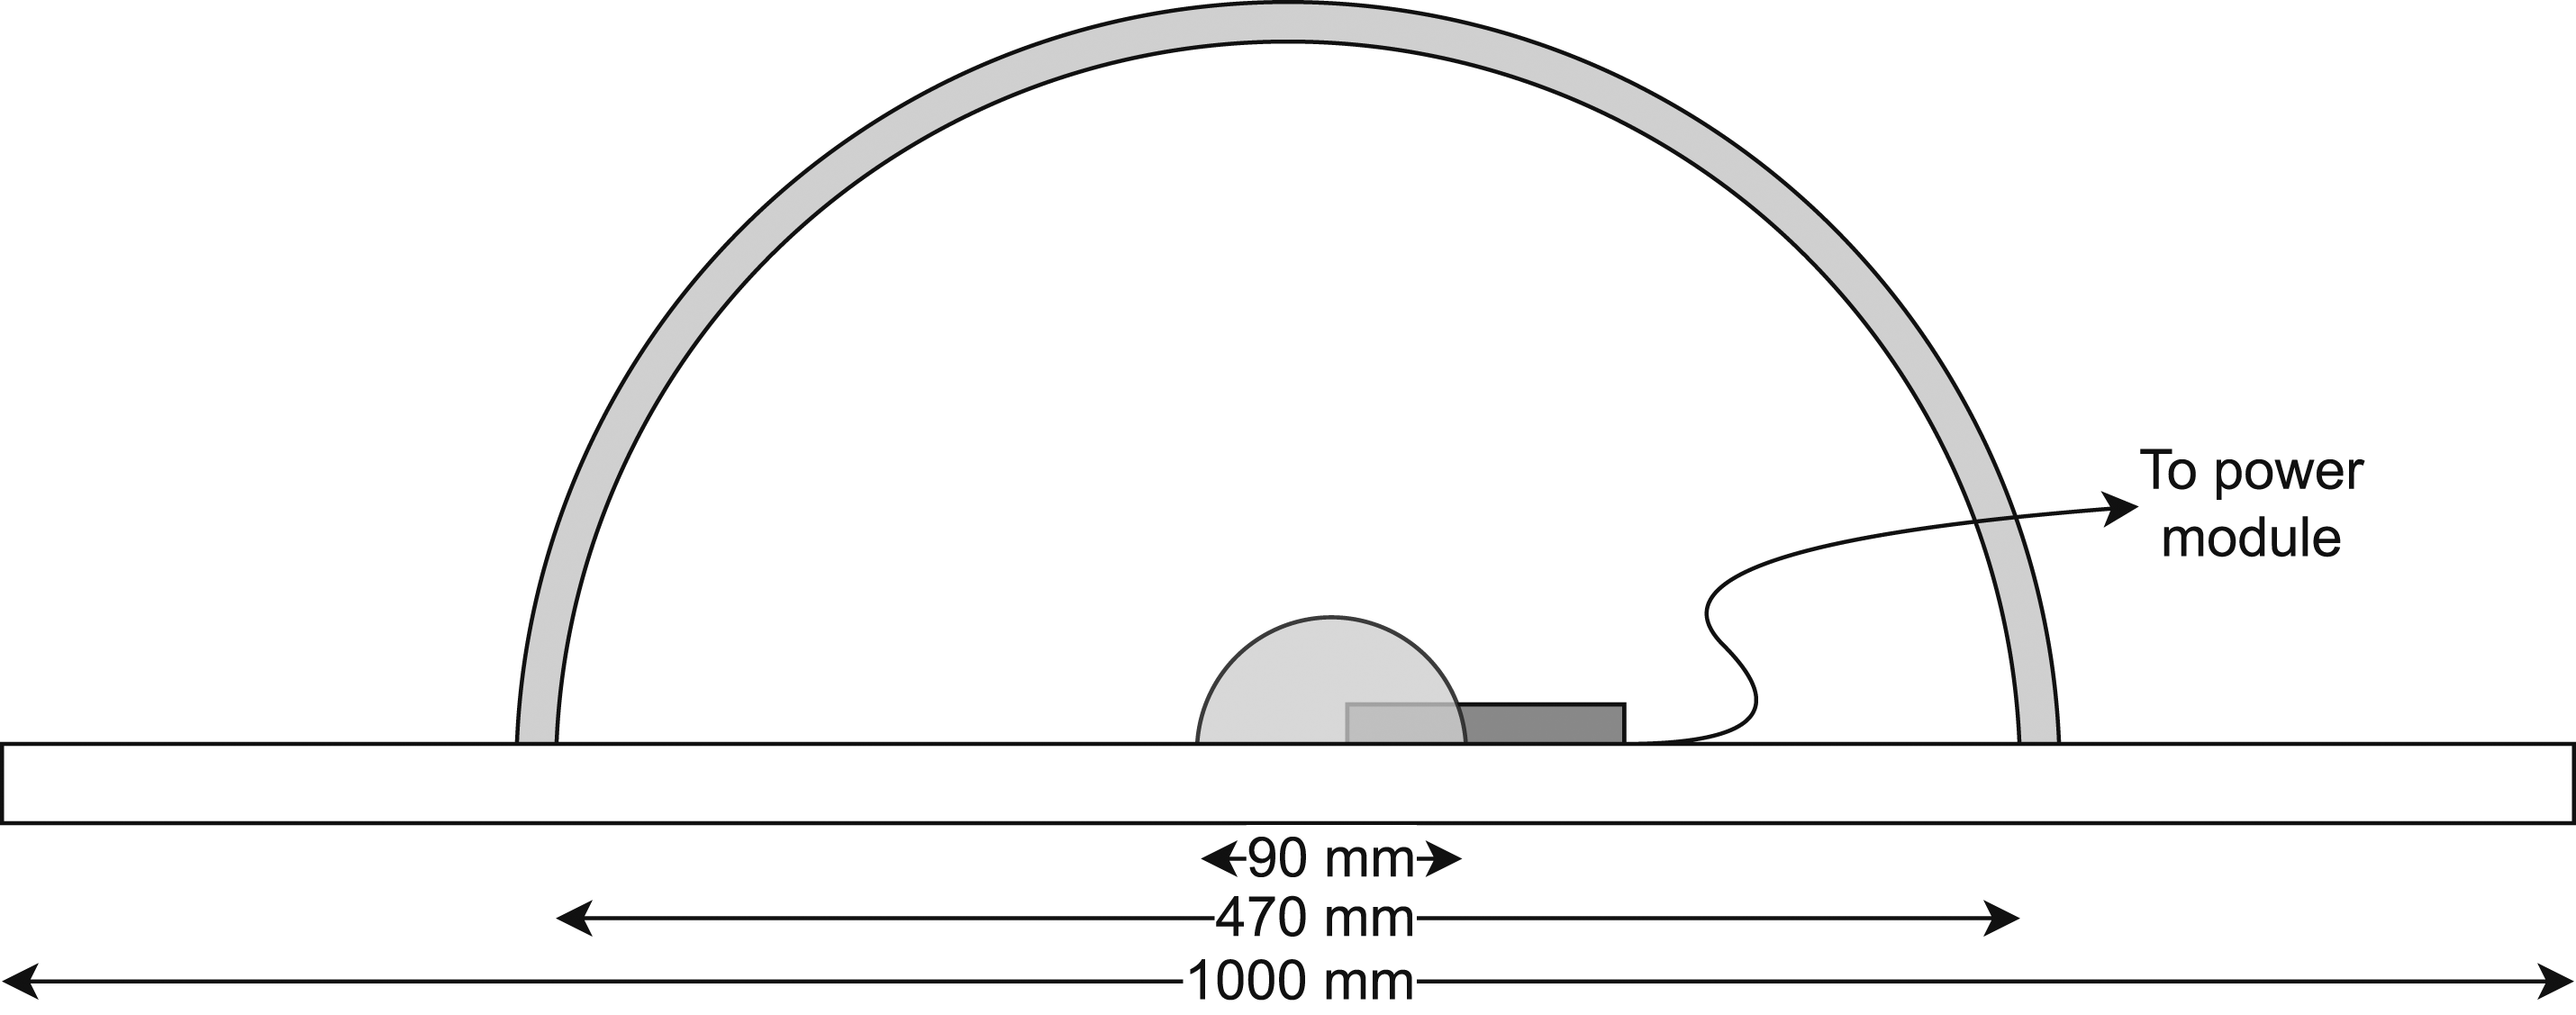
Both microphone sets were calibrated in-house in a frequency range from 0.5 Hz to 100 Hz. The calibration was conducted as a comparison in a closed calibration chamber where the device under test (DUT) and a reference microphone with known sensitivity were simultaneously subjected to sinusoidal sound pressure signals. The sensitivity of the DUT was determined by comparing the output levels of the reference microphone and the DUT. As reference an LS1 microphone of type Brüel & Kjær 4160 was used, which has been calibrated using the pressure reciprocity method. This method is a primary calibration method and establishes traceability to national standards. The lowest frequency of the primary calibration was 2 Hz, limiting the traceability established by the secondary calibration to this frequency. Nevertheless, the calibration was carried out down to 0.5 Hz using reference data which have been shown to be reliable. The reference microphone was mounted inside the calibration chamber with its vent not exposed to the sound field. This is the configuration in which the pressure reciprocity calibration of the reference microphone was conducted. The microphone sets used for the field study were mounted inside the calibration chamber with their vents exposed to the sound field. Whether the equalization vent of a microphone is subjected to the sound field or shielded from it greatly influences its low-frequency sensitivity. 20
The analog voltage signals of both microphones were simultaneously captured using an analog-to-digital converter of type Data Translation DT9857E and saved as. wav files for offline evaluation. For this evaluation, the raw data were inspected and disturbances from starting and stopping the measurement as well as clear environmental disturbances were removed. After this procedure, several 30-min long segments of undisturbed data remained for analysis.
For every segment of microphone data, the corresponding raw data acquired by the respective microbarometer station were taken from the dataset published by BGR. 18 The microbarometer data were synchronized to the microphone data via the timestamps of the two time courses. To provide a direct comparison between the three measurement configurations (microphone on tripod, microphone on plywood base, microbarometer), all raw data segments from the two microphones and the corresponding microbarometer were evaluated using an evaluation software developed at PTB. The raw data segments of 30 min length were transformed into the frequency domain by means of fast Fourier transform using using 11 hann windows of 5 min length with 50 % overlap. In a second step, third-octave levels conforming to IEC 61260-1 21 were computed using raised-cosine filters on the frequency domain data to provide an absolute and comparable measure for the sound pressure levels acquired at the measurement site.
A major source of disturbance for outdoor infrasound measurements is wind-induced noise. The operational data of the wind turbines were available, including mean values obtained every 10 min for the wind speed at the nacelle, the nacelle direction, and the rotation speed for each wind turbine. At the time of preparation of this measurement campaign it was not anticipated that despite the passive shielding employed by windscreens and surrounding vegetation wind noise would be the dominating issue. For this reason, a direct measurement of the wind speed at the measurement location was not carried out. To assess the influence of wind noise on the microphone measurements afterward, the microphone configurations used in the wind park measurements were also set up in the Aeroacoustic Wind Tunnel Braunschweig operated by the German Aerospace Center.
22
The goal of this measurement was to obtain reference values for the wind noise measured by the microphones in relation to a known and fixed wind speed. The wind tunnel consists of an inlet nozzle with a width of 80 cm and a height of 120 cm and provides a free airflow of up to 60 m/s while emitting only low background noise. Both the microphone on the tripod and the microphone on the plywood base were mounted directly inside the airflow. The plywood base was mounted flush to a table positioned at the bottom of the air stream, while the tripod was positioned in the center of the air stream. Both microphones were directed towards the air flow. Figure 3 shows the setup in the wind tunnel. A third microphone was placed inside the wind tunnel chamber but outside of the wind stream to measure the noise emitted from the turbine. This way it was possible to distinguish the wind-induced noise from the background noise. Side view (not to scale) on the setup of the used measurement microphones in the Aeroacoustic Wind Tunnel Braunschweig. The microphone on the plywood base was mounted flush to a table at the bottom of the nozzle, while the microphone on the tripod was placed above the table with the legs of the tripod placed outside of the wind stream. Not shown here: microphone outside of the wind stream for background noise measurement.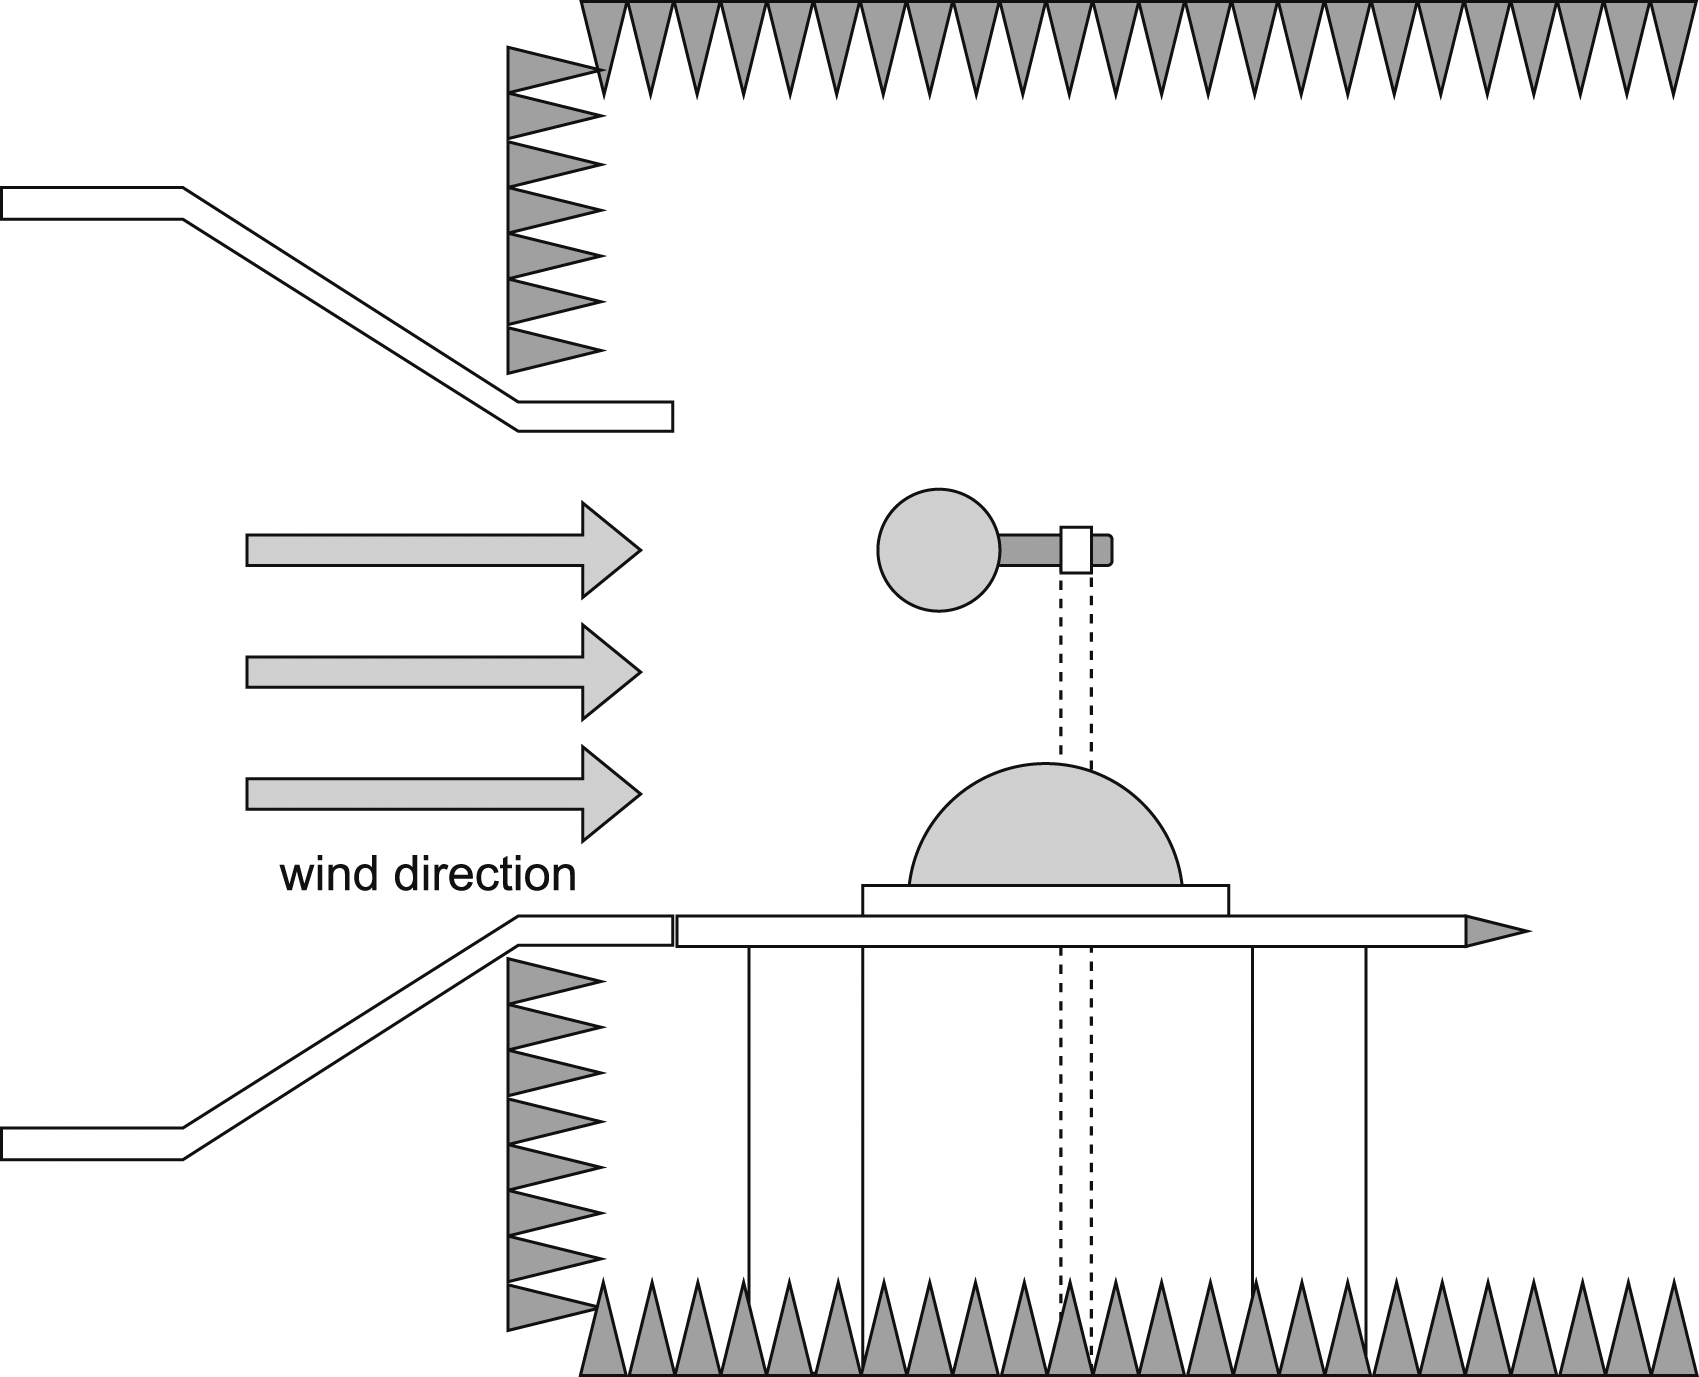
An important source of measurement uncertainty is the self-noise of the equipment used. The self-noise can be treated as a signal uncorrelated to the actual incoming sound. The level of the self-noise of the measurement system should be well below the signal to provide a sufficient signal-to-noise level (SNR). In the presence of noise, the measured sound pressure level for a given third-octave band increases compared to the level without noise. For a given SNR, the resulting increase of the measured signal in a particular third-octave band is determined by the sum of the energies in the signal and in the noise band. The self-noise of the used devices was investigated by placing the microphones inside a quiet anechoic chamber, where a 30-min measurement was made analogously to the application in the field. The raw data from this measurement were processed using the same analysis software as was used for the field measurements to ensure comparable results. As the anechoic chamber used is not ideally shielded from outside noise in the infrasound range, some residual outside noise may have reached the microphones, so this measurement only yields an upper limit for the self-noise of the deployed microphones. It could, however, be shown that the signal-to-noise ratio for every measurement was better than 20 dB at all frequencies covered.
Measuring the self-noise of the MB2005 microbarometer proved to be rather difficult, since these devices are very sensitive to vibration disturbances. 23 For this reason, an attempt to measure the self-noise as was done for the microphones did not yield reliable results because the measurement position in the anechoic chamber was not specifically protected against vibrations. As an alternative, a second self-noise measurement of the MB2005 was conducted in the closed calibration chamber mounted on anti-vibration feet which was also used to calibrate the measurement microphones for this campaign. All self-noise measurements were conducted at night when disturbances were as low as possible.
Results
The microphone measurements conducted allow a direct comparison of the three measurement methods—“microphone on tripod,” “microphone on plywood base,” and “microbarometer with inlet system” —in a real measurement scenario. These measurements can be categorized into three groups according to wind conditions at the wind turbine nacelles: low wind speed, medium wind speed, and high wind speed. The wind speeds used for categorization were taken from the operational data of the wind park since the wind speed at the measurement locations was not measured directly. Additionally, the wind shielding effect of the vegetation at the measurement site was taken into consideration, as the different sites were shielded very differently against wind by ground level bushes.
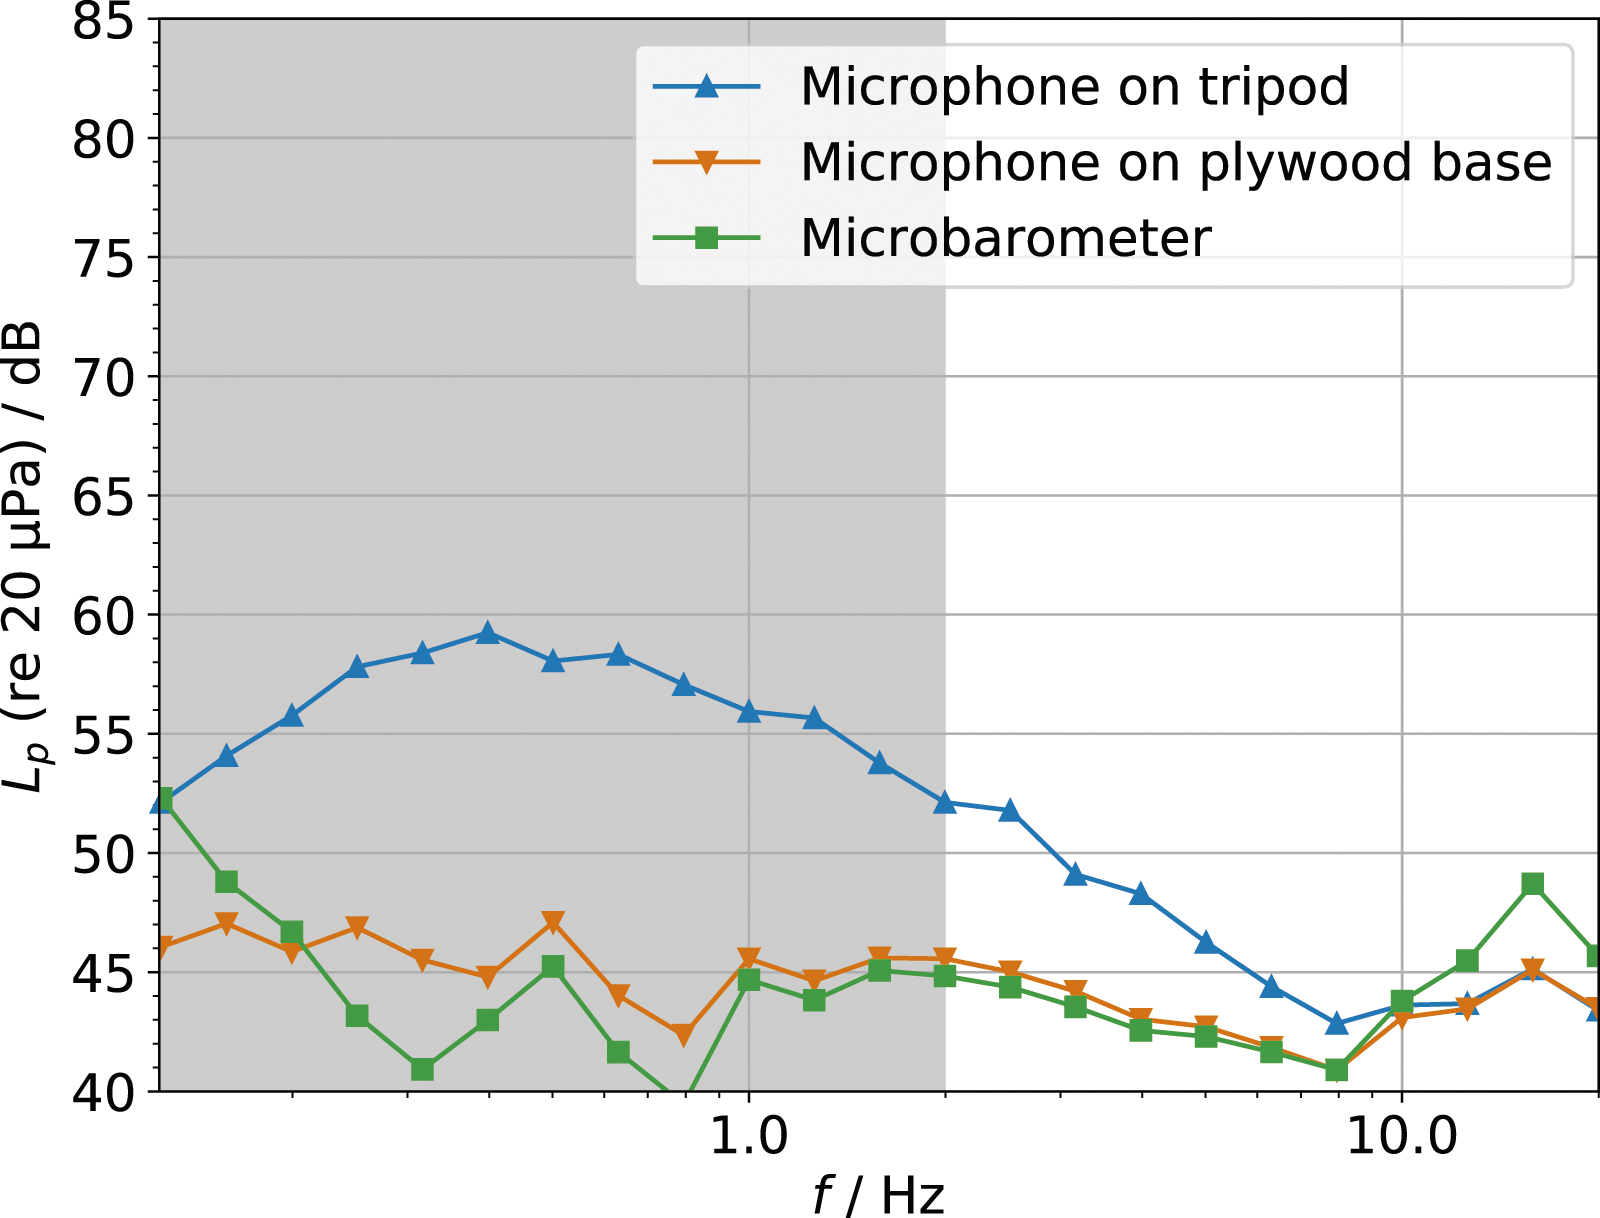
Figures 4–6 show one typical measurement for each wind speed category as an example. In low wind conditions, the levels measured by the microphone on the tripod and the microphone on the plywood base agree with less than 0.2 dB discrepancy. The levels recorded by the microbarometer, on the other hand, show deviations from those of the microphones. In this example, the level detected by the microbarometer is comparatively lower in the frequency range below 5 Hz and higher in the frequency range between 5 Hz and 14 Hz. Above 14 Hz, the level measured by the microbarometer at this particular station exhibits a roll off. The maximum deviation at frequencies below 14 Hz is about 2.5 dB at 10 Hz. Third-octave levels measured in the field in low-wind conditions (wind speeds ranging from 3.5 m/s to 5.5 m/s at the wind turbine nacelles, very good shielding against wind from vegetation). The gray area marks frequencies which are not traceable to national standards. Third-octave levels measured in the field in medium-wind conditions (wind speeds ranging from 4.5 m/s to 7 m/s at the wind turbine nacelles, only little shielding against wind from vegetation). The gray area marks frequencies which are not traceable to national standards. Third-octave levels measured in the field in high-wind conditions (wind speeds ranging from 8.5 m/s to 12 m/s at the wind turbine nacelles, only little shielding against wind from vegetation). The gray area marks frequencies which are not traceable to national standards.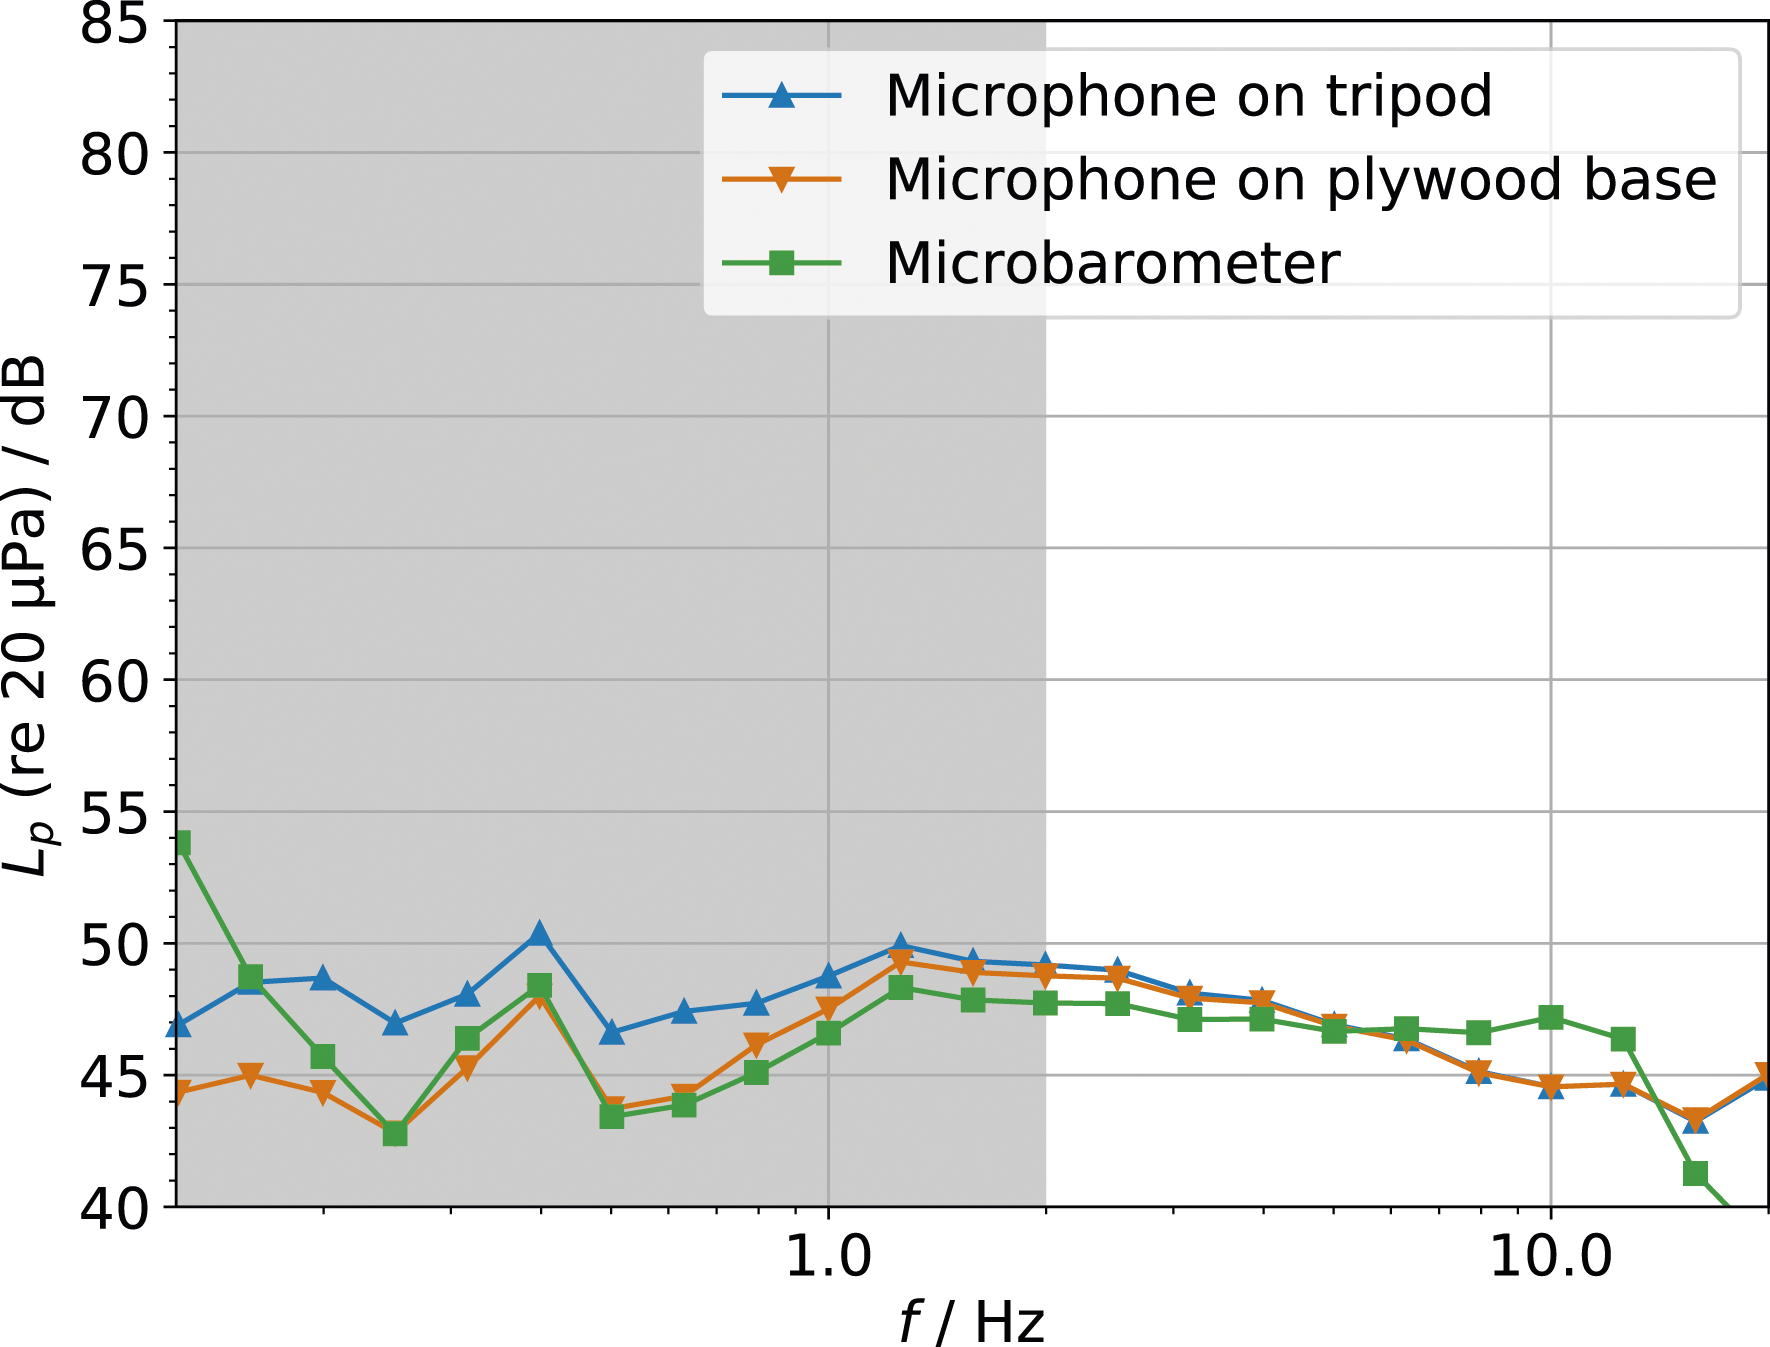
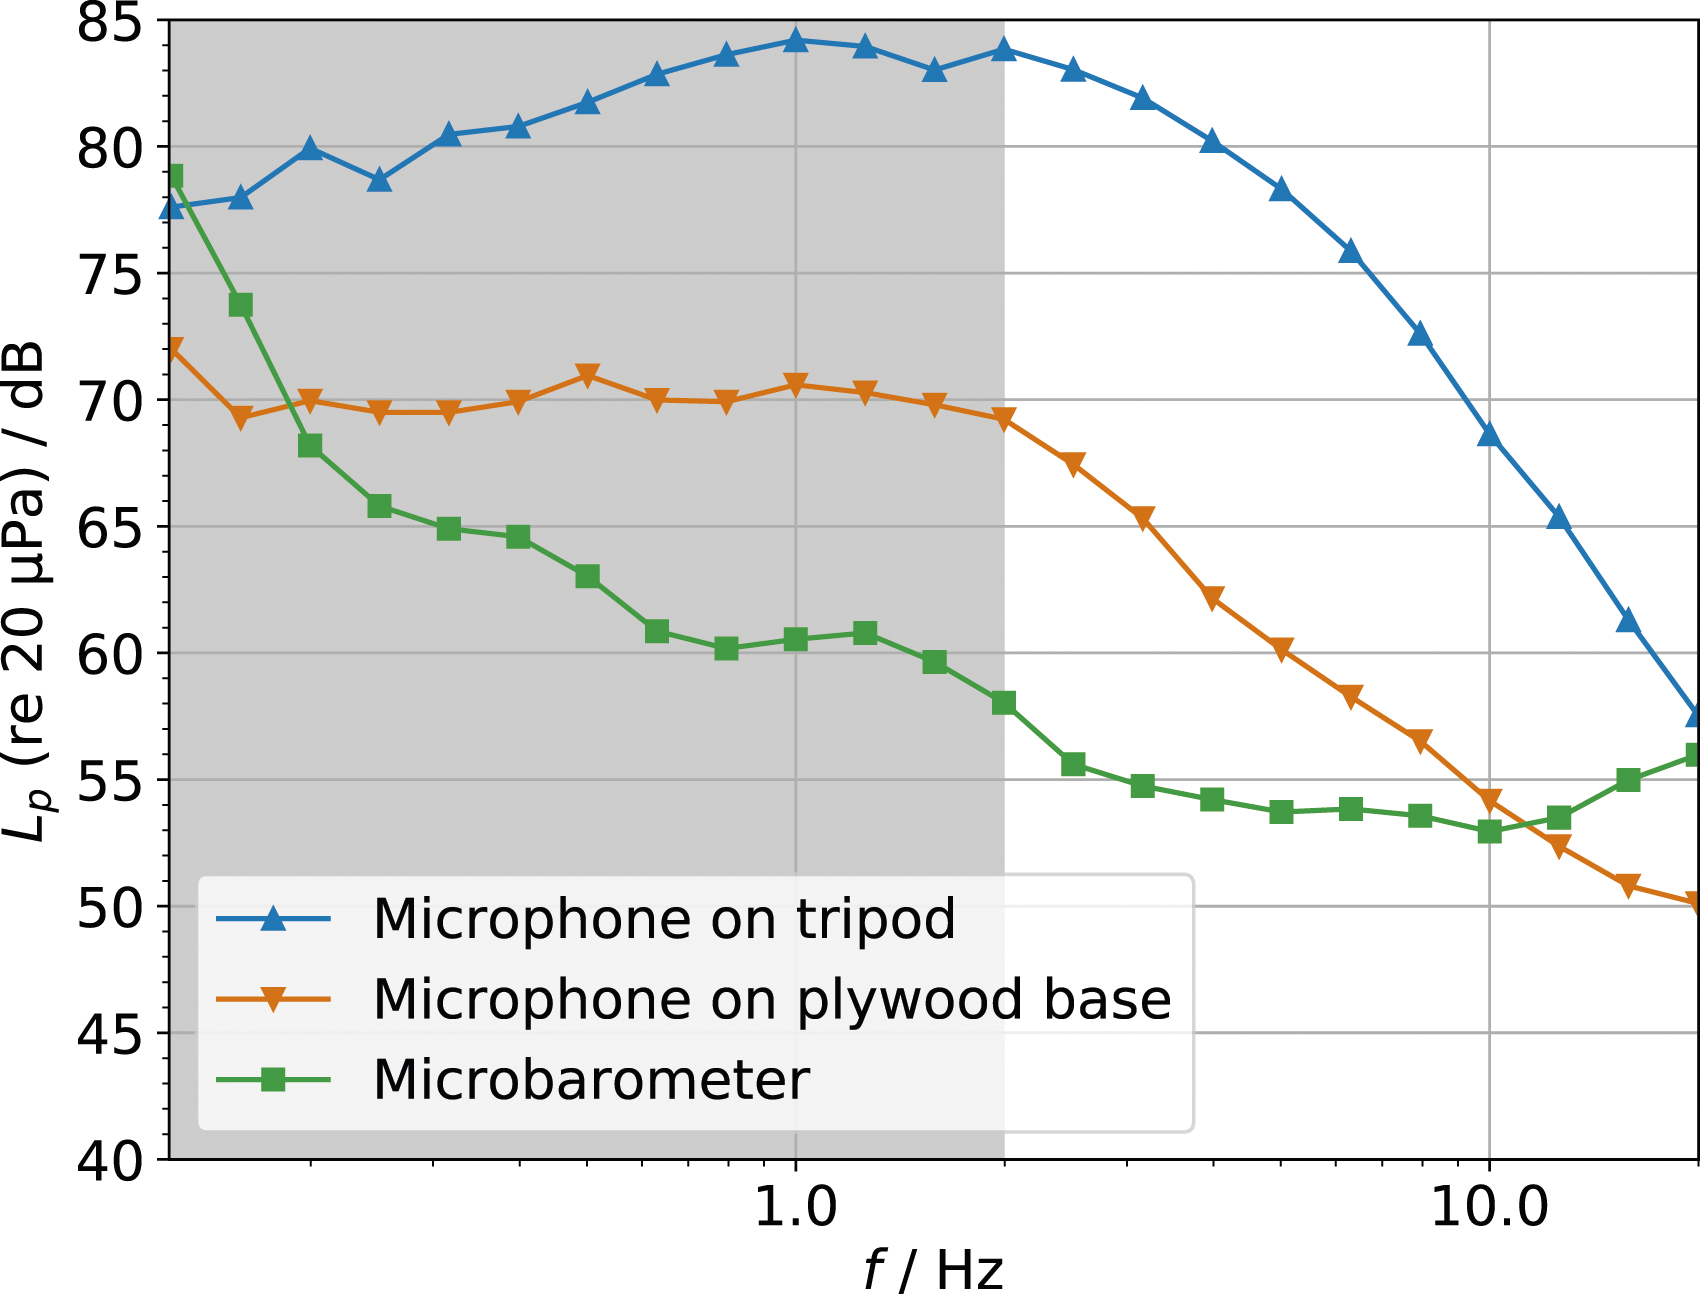
In medium wind speed conditions, the microbarometer and the microphone on the plywood base still show deviations of less than 2.5 dB at frequencies below 10 Hz, but the microphone on the tripod exhibits an increased signal level, especially at frequencies below 5 Hz. For even higher wind speeds, the microphone on the plywood base also shows an increased signal level at very low frequencies compared to the microbarometer.
The investigation of the wind-induced noise in the Aeroacoustic Wind Tunnel Braunschweig provided data about the generated wind noise for the two microphone setups. Figure 7 shows the levels of the 10 Hz third-octave fraction for both setups at different wind speeds. This specific third-octave band was chosen because the background noise of the Aeroacoustic Wind Tunnel was low in this frequency range. In this laboratory setup, the microphone on the tripod also yielded a higher sound pressure level than the microphone on the plywood base when both were subjected to the same wind speed. At wind speeds above 5 m/s, the difference increased to more than 10 dB. Above 9 m/s the noise versus wind speed slope flattened for the microphone on the tripod, while it remained unchanged for the microphone on the plywood base. This effect lessened the differences seen between the microphone on the tripod and the microphone on the plywood base. Sound pressure levels of wind-induced noise in the 10 Hz third-octave bands against wind speed for the used measurement microphones. The measurements were conducted in the Aeroacoustic Wind Tunnel Braunschweig (AWB). The background noise of the wind tunnel was determined by a microphone standing in the measurement chamber but outside of the wind stream.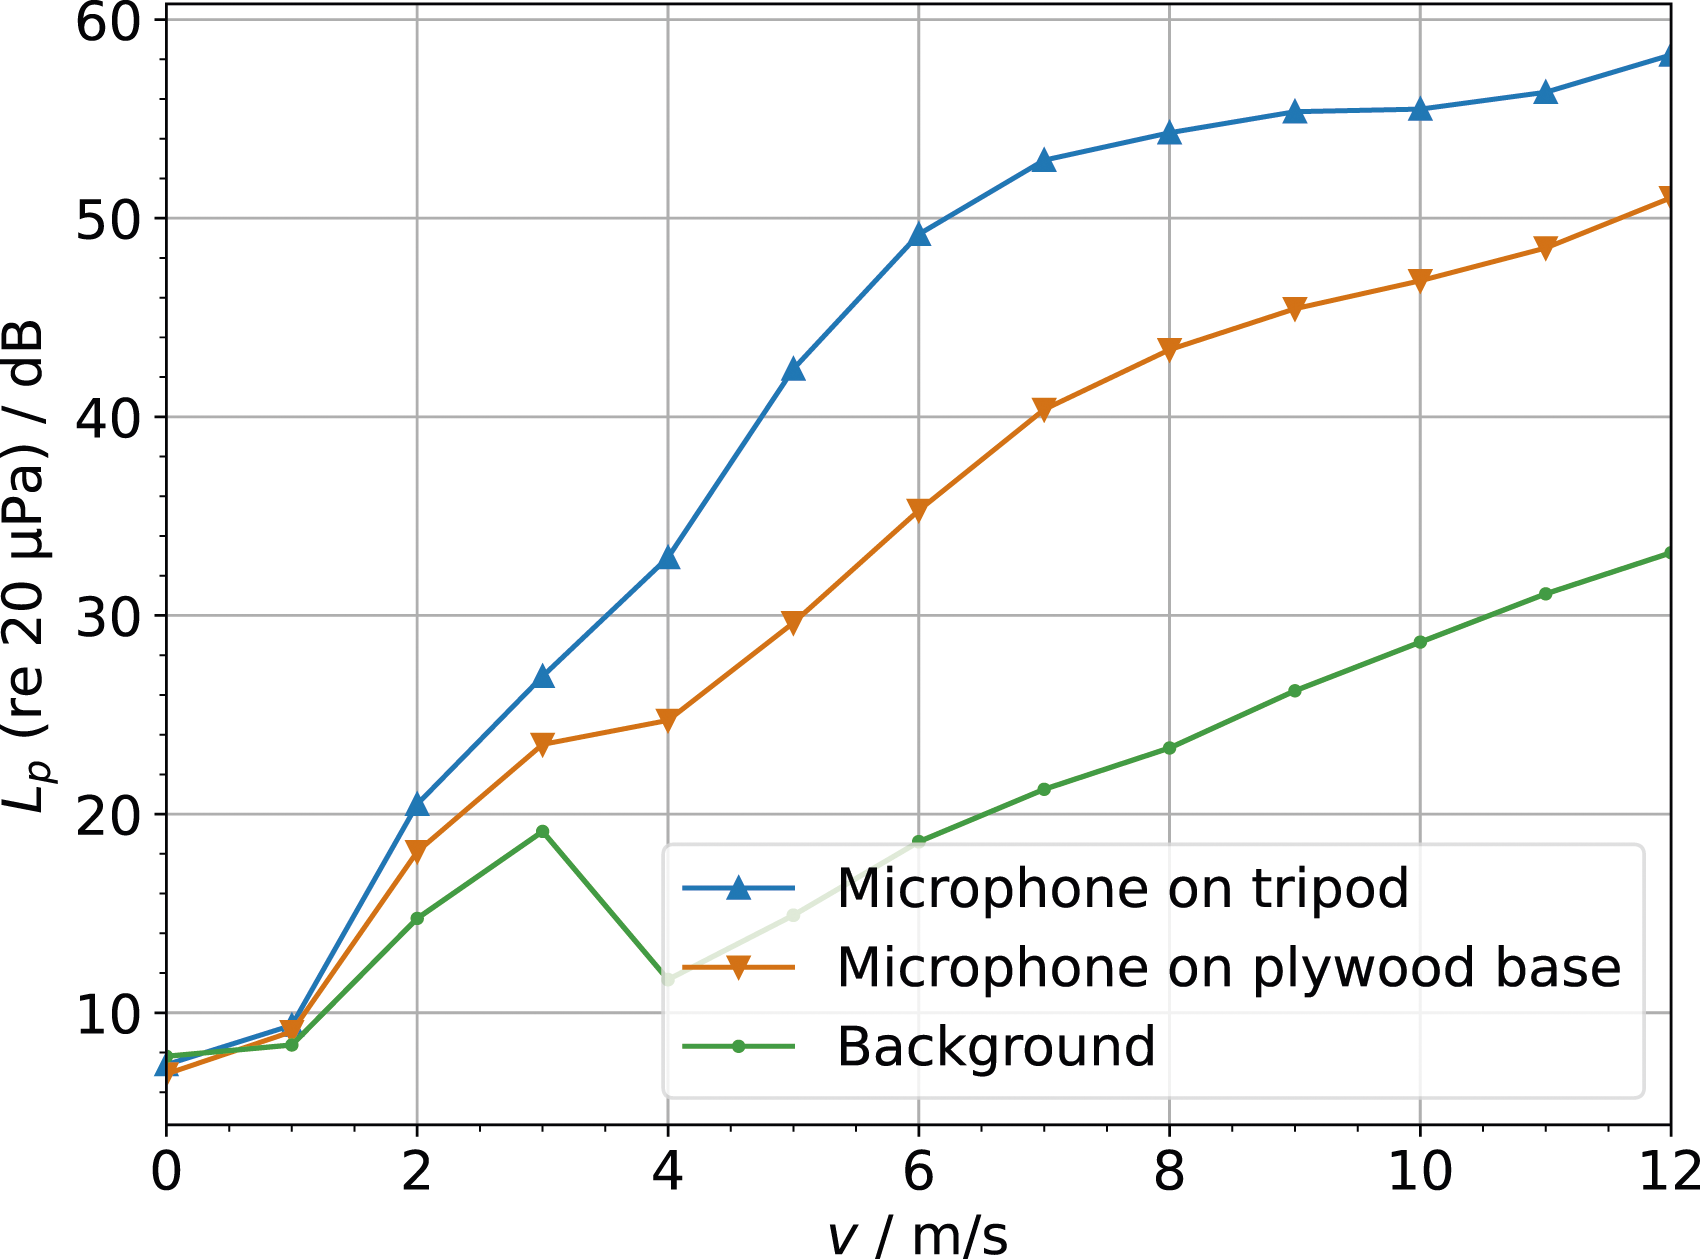
The measurements of the noise floor, conducted in an anechoic chamber for the microphones and a calibration chamber for the microbarometer, yielded an upper self-noise limit of the deployed microphones and microbarometers for every third-octave band. Figure 8 shows these upper bounds in comparison to the lowest sound pressure levels measured in the field at the Gagel wind park on a quiet day. At frequencies above 1.5 Hz, the noise level of the microphones is at least 20 dB below the measured signal level. Below that frequency the level measured in the anechoic chamber rises steeply and even exceeds the levels measured in the field. This effect, however, seems to be caused by the limited suppression of low frequency noise in the anechoic chamber, which was not specially designed for this frequency range. Further self-noise measurements were conducted on the microphones in the calibration chamber on particularly quiet days in order to investigate the self-noise levels at frequencies below 1.5 Hz. The quietest of these measurements yielded third-octave levels of less than 33 dB for the 0.5 Hz to 1.5 Hz frequency range, meaning that the noise level in this frequency range is at least 9 dB below the quietest level measured in the field. (Color online) Upper bounds for the self-noise of the deployed microphones and microbarometers compared to the lowest sound pressure levels measured in the field (third-octave levels). The gray area marks frequencies which are not traceable to national standards.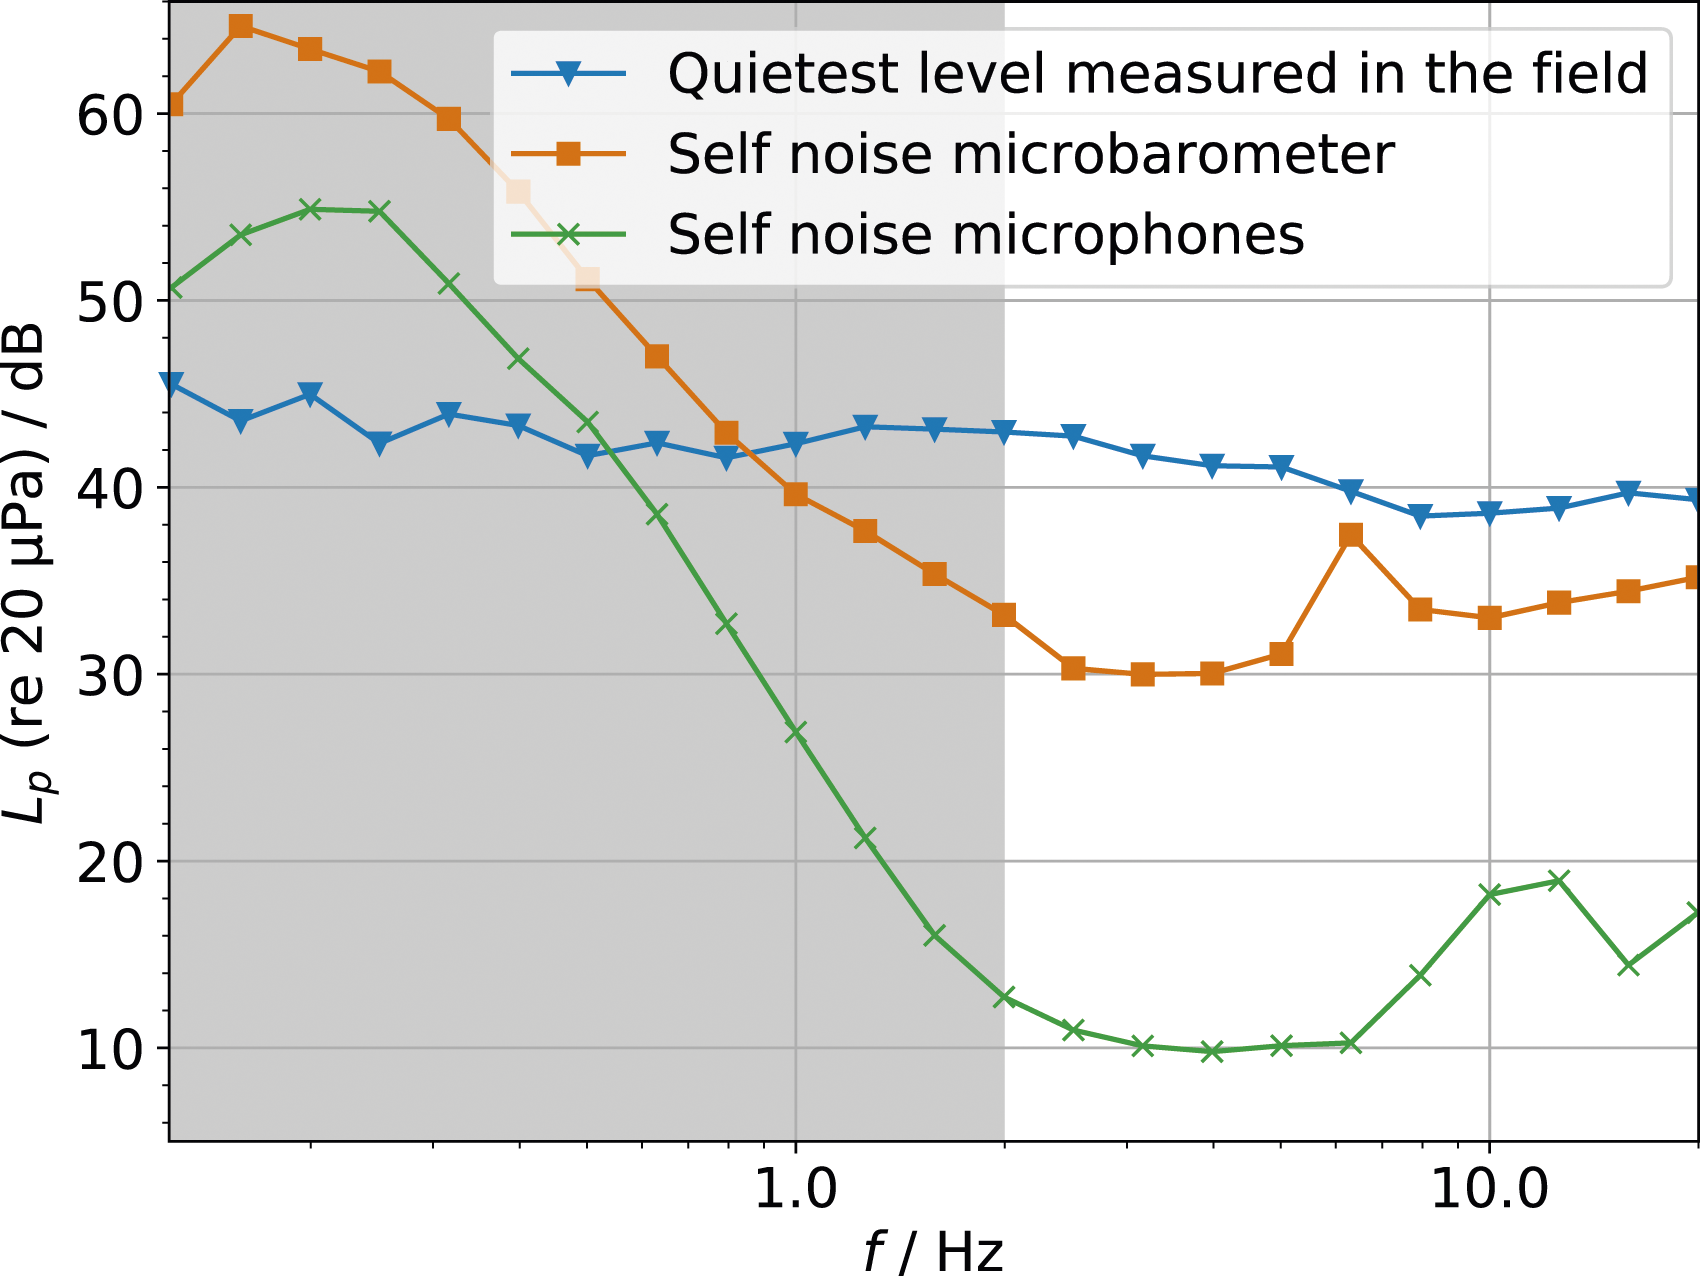
For the MB2005 microbarometer, the measured noise level is only 6 dB to 10 dB below the quietest levels measured in the field. The measured noise levels match the noise levels determined by Reference 24, except for a visible peak at 6.3 Hz in the measurements conducted at PTB. This peak was most likely caused by outside vibrations and seems to correspond to the resonance frequency of the measurement chamber on anti-vibration feet.
Discussion
Sound field measurements in the vicinity of wind parks were carried out on the basis of two different sensor principles. An evaluation routine developed at PTB was used to assess all raw data segments in order to ensure comparability. In general, good and reasonable agreements between the results were ascertainable, but differences in details were found. These details can be used to evaluate and compare the performance of microphones and microbarometers as infrasound measurement devices.
Note that the determination of third-octave levels allows a direct comparison of the sound pressure values to a perception threshold. Although several thresholds are in use (see 19), all pressure values obtained in this study are at least 30 dB below every perception threshold for frequencies of 10 Hz and lower. This difference increases with decreasing frequency to 60 dB at 2 Hz.
The measurements conducted during low wind speeds revealed an acceptable agreement between microphones and microbarometers. The deviations seen in the microbarometer results compared to those of the microphones were most likely caused by the inlet system used to reduce the wind noise effect. This part of the sensor system was not covered by the calibration procedure, where the microbarometers were treated as stand-alone systems. It was furthermore not possible to calibrate the deployed microbarometers immediately before the measurement campaign, so only earlier calibration data were available. In general, all sensors used in field measurements should be individually calibrated in preparation for the measurement campaign. Whenever possible, this calibration should include all accessories, such as windscreens or inlet systems, as these often influence the frequency response of the sensor system.
During medium wind speeds, the results obtained from the microphone on the plywood plate and from the microbarometer continued to agree within the described limits, while the microphone on the tripod was already affected by wind. This shows that both the microphone on the plywood plate and the microbarometer still yield realistic results in these conditions, while the microphone on the tripod does not deliver trustworthy results. The microphone on the tripod, however, could be used as an indicator of wind disturbances during a field measurement. The level differences are an indicator of the effect of wind on the measurements and can be used as a quality criterion for microphone measurements. Using two microphones, one protected from the wind and another one subjected to it, the difference between the results can be compared to a predefined threshold. Any measurement taken when the level difference exceeds this threshold should be discarded. This represents a simple method to assess the quality of a microphone measurement in front of a wind turbine or other environmental infrasound sources.
To further investigate this level difference and to determine the discard threshold, the measurements conducted in the Aeroacoustic Wind Tunnel were used as reference measurements. In the field, a level difference of 10 dB between the microphone on the tripod and the microphone on the plywood base was determined to be a critical threshold. Above this threshold, the level difference between the microphone on the plywood plate and the microbarometer started to surpass 2 dB, with the microphone showing the higher sound pressure level. This suggests that the microphone on the plywood base is affected by wind noise. For this reason, measurements in which the level difference between the microphones exceeded 10 dB in third-octave levels above 2 Hz were considered disturbed by wind and excluded from evaluation. The value of 10 dB of the threshold is specific to the measurement equipment used in this measurement campaign.
The measurements in the Aeroacoustic Wind Tunnel showed that a level difference of 10 dB between the microphone on the tripod and the microphone on the plywood plate was reached at a wind speed of 5 m/s (see Figure 7). Although the wind stream conditions in the wind tunnel were different to the conditions in the field—the airflow in the wind tunnel was laminar and of constant speed and there was no additional shielding from vegetation—these measurements still provided a valuable connection between the relative level differences of the two microphones and the absolute level of the wind speed. The wind speed of 5 m/s can therefore be considered the critical wind speed at the measurement location for the particular measurement microphone setup used in this study.
In the field, using the level difference between two microphones in different windscreen configurations as a quality criterion is a viable method for wind noise control, as presented here. Alternatively, the wind speed at the measurement location can be determined directly using an anemometer, for example. This enables a direct estimation of the wind-induced noise using the measurement results from the wind tunnel measurements given in Figure 7. Measurements can then be discarded when the measured levels are too close to the estimated disturbances caused by wind. Both techniques should, however, be refined by further measurement series comparing different measurement microphone sets and windscreen configurations, as the values determined in this study are valid only for the equipment used in this study. Nevertheless, they in principle show the usage of a comparison of microphone measurements for an estimation of wind influence.
Regardless of the method used to estimate the influence of wind, it is advisable to position the measurement systems in a typically calm area, such as a forest, whenever possible. Otherwise, the measurements will likely be disturbed by wind, as the critical wind speed of 5 m/s is easily reached in open areas. Where placement in a naturally calm environment is not possible, large-scale wind fences are an alternative.25,26 While they require more effort to set up, such fences have the advantage of providing greater flexibility.
A careful investigation was made to ensure that the measurements at the wind parks were carried out with a sufficient signal-to-noise ratio. Considering the self-noise measurements conducted in the anechoic chamber with all of the microphones used, the levels measured in the field were at least 20 dB above the noise floor at frequencies above 1.5 Hz. For lower frequencies, the employed anechoic chamber was most likely not well shielded against outside noise, but the additional measurements conducted in the calibration chamber on a quiet day ensure a signal-to-noise ratio of at least 9 dB for frequencies between 0.5 Hz and 1.5 Hz. Because of the limitations of the self-noise measurements a general comparison of the noise performance between microphones and microbarometers seems to be difficult and should be addressed in a further investigation dedicated to this issue.
Main contributions to the measurement uncertainties for the measurement microphones and microbarometers used.
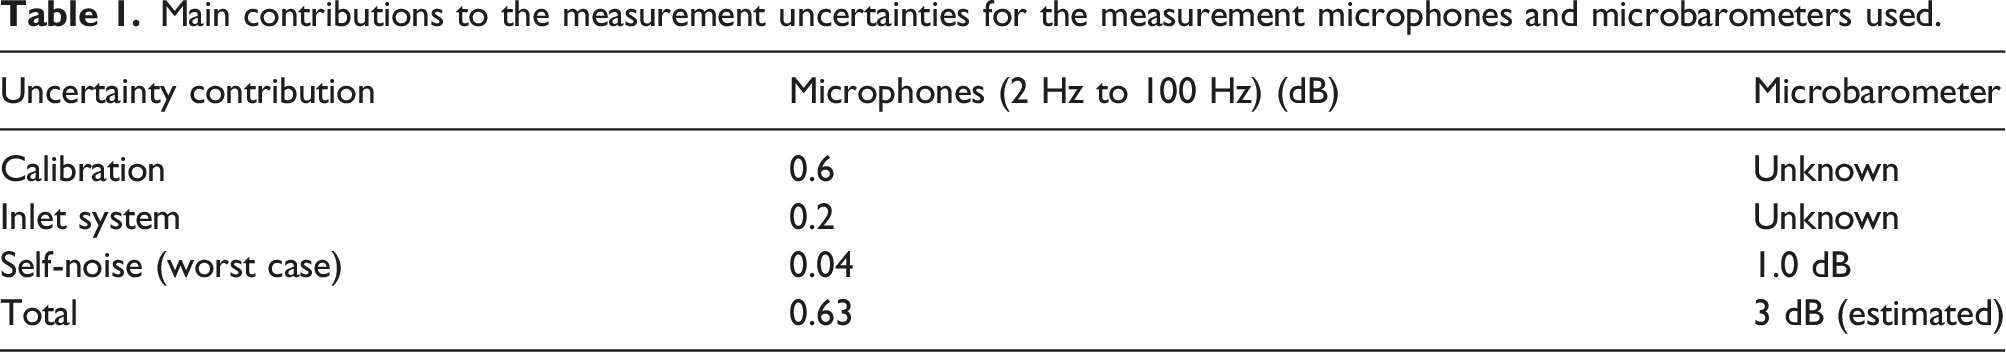
For the microbarometers, the uncertainty contributions originating from the inlet system and from the usage of old calibration data are unknown. The self-noise is a major contribution to the measurement uncertainty. As discussed in the results, the worst-case signal-to-noise ratio of the microbarometers amounts to 6 dB. This results in an uncertainty contribution of 1.0 dB for the third-octave levels. As the details for the calibration of the microbarometers and the influence of the inlet system are unknown, this is also the only uncertainty contribution that can be quantified. However, judging from the level differences in low-wind conditions, the resulting measurement uncertainty of the microbarometers is likely in the order of 3 dB.
Conclusion
The measurements made within this study showed that microbarometers and measurement microphones are in principle both suitable for environmental infrasound measurements. Careful calibration of the microphones was carried out to ensure reliable results. The main disadvantage of the microbarometers was the high noise floor, while the main disadvantage of the microphones was the comparatively higher sensitivity to wind noise. Regardless of which system is used, the effect of wind noise is always an issue to consider. The most reliable results were achieved using a measurement position near the ground combined with extended technical shielding and additional protection by the surrounding vegetation. The noise caused by the wind should be determined onsite to assess the quality of the obtained measurement results. For this purpose, two strategies were proposed and elaborated in this paper. A two-microphone method uses a second microphone that is partly subjected to the wind as an indicator of the strength of the wind noise. This proved to be effective during the field measurements. Alternatively, the onsite wind speed can be measured directly and used to estimate the wind noise by consulting the reference measurement results obtained during this study using the Aeroacoustic Wind Tunnel. Since the results in this study were very specific to the current situation, for a generalization of the methods, further research is necessary providing more experimental data of different application cases. All in all, the control of wind noise is important to make measurements of infrasound in the field more reliable. In combination with better calibration and testing strategies, it represents a very important rational contribution to the worldwide debate surrounding infrasound.
Footnotes
Acknowledgments
We thank Christoph Kling from PTB and colleagues from BGR for their support and valuable discussions. We gratefully acknowledge the support of the Braunschweig International Graduate School of Metrology B-IGSM.
Declaration of conflicting interests
The author(s) declared no potential conflicts of interest with respect to the research, authorship, and/or publication of this article.
Funding
The authors disclosed receipt of the following financial support for the research, authorship, and/or publication of this article: This project 19ENV03 Infra-AUV has received funding from the EMPIR Programme co-financed by the Participating States and from the European Union’s Horizon 2020 Research and Innovation Programme.