
Abstract
An investigation was conducted on the effect of reported pathological symptoms of simulated infrasound produced by wind turbines. There is ongoing debate in the scientific community concerning the cause of the negative health effects reported by people living near wind farms, whether those effects are caused by the infrasound itself, or alternatively by a psychogenic response (such as a nocebo effect) to a presumption that the infrasound is the cause. In this study, a simulated wind turbine infrasound pressure waveform was generated using a custom-built headphone apparatus. Volunteers were influenced into states of high expectancy of negative effects from infrasound, and low expectancy of negative effects and their reactions to either infrasound or a sham noise were recorded. It was found, at least for the short-term exposure times conducted here-in, that the simulated infrasound has no statistically significant effect on the symptoms reported by volunteers, but the prior concern volunteers had about the effect of infrasound has a statistically significant influence on the symptoms reported. This supports the nocebo effect hypothesis.
Introduction
The construction of wind farms in local communities can be contentious, with some residents expressing concern that living in the vicinity of wind turbines can negatively impact health. 1 Some people assert that the infrasound generated by the wind turbines has a negative effect on the health of nearby residents, to the point where it is claimed that some have abandoned their homes in order to get away from what they believe to be the cause of their ill health, although this is disputed. 2 The two main hypotheses in this study are a) that infrasound has a direct physiological effect or b) the effect is psychogenic in nature otherwise known as a nocebo effect.
Pierpont, in her 2009 self-published book of the same name, coined the term “Wind Turbine Syndrome” to describe this phenomenon. 3 According to Pierpont, these health problems include sleep disturbance, headaches, nausea, tinnitus, ear pressure, vertigo or dizziness, visual blurring, irritability, memory and concentration problems, panic episodes, tachycardia, and body vibration. The symptoms have been attributed to the infrasound emitted by the wind turbines which the residents, and some academics, believe to have a deleterious effect on human health. 4 On the other hand, Chapman has identified that individuals have attributed some 244 different symptoms and diseases in humans and animals to wind turbines, which he notes is not credible. 5 The issue has become a focus of organisations such as the Waubra Foundation and various branches of the Australian Landscape Guardians, small groups which have led attacks on wind farm developments in Australia.
Some academics have proposed a number of biological mechanisms to explain the health problems being reported.4,6,7 However, the majority of academics conclude that there is no direct pathological link between wind turbine infrasound and health issues and have proposed that the health concerns are better explained by a psychological phenomenon known as the nocebo effect.8–10
Leventhall claims that the infrasound generated by normal bodily functions such as heartbeat and breathing generate more infrasound in the ear than wind turbines do, and therefore wind turbines are unlikely to have any effect. 9
A number of studies conclude that infrasound is everywhere in nature at a level similar to or greater than that produced by wind farms.11,12 A more recent study at the Waterloo wind farm in South Australian found that whilst a number of nearby residents had raised persistent complaints of health impacts, which they attributed to wind turbines, the sound level of the infrasound blade pass frequency component was found to be at a level significantly below the accepted perception threshold of 85 dB(G). 13
The nocebo hypothesis
The nocebo effect is a negative reaction from exposure to an innocuous substance due to expectations of harm. It is the converse to a placebo which is an inert substance that creates either a beneficial response or no response in a patient. The nocebo effect is psychogenic in nature and is a reaction to a patient’s expectations and perceptions of how an exposure to a substance will affect them. An AWEA and CanWEA literature review rejected a direct physical cause of infrasound symptoms, and instead suggested that some of them may be created by expectations of harm. 10 Chapman found a strong correlation between campaigning by anti-wind farm groups and reports of symptoms and concluded that Wind Turbine Syndrome is a communicated disease. 8
Schomer disagrees and points out that turbine size has increased markedly in recent years, and that the infrasound emitted by modern turbines has shifted to even lower frequencies. He theorises that this could explain the recent increase in complaints. 7 However, Chapman et al. list many large turbine wind farms in Australia from pre- and post-complaint periods (circa 2009) where no complaints were made. 8
Deignan et al. examined the local newspapers of six different communities with wind turbine developments in rural Ontario and found the vast majority of articles contained words or phrases with a fright factor such as “dread,” “involuntary exposure,” and “poorly understood by science” and concluded that these articles might produce fear, concern and anxiety in regard to wind turbines in readers. 14
Crichton et al. were the first to test the nocebo hypothesis subjecting a group of 54 participants to either real or sham infrasound after half the participants had watched a video on the health effects of wind turbine noise designed to increase their expectations of harm, whilst the other half watched a video designed to play down their expectations of harm. The study found that participants exposed to material designed to increase their concern about the effects of wind turbine infrasound were more likely to report symptoms, even when in the sham group. These results are consistent with the nocebo hypothesis.15,16 However, if one compares the level of infrasound recorded at Shirley Wind Farm and other wind farms,17,12 the level of infrasound produced in the Crichton study was too low (40–50 dB, unreported as to whether this is rms or peak and whether the sound was sinusoidal or not). In addition, the duration of exposure to infrasound was 10 min. Whilst it is understandable that it is difficult in a laboratory situation to entertain long periods of exposure, it is nevertheless desirable to increase it as much as possible in any repeat experiment. In adopting a stimulus with such a low level of infrasound, the conclusions in that study should be regarded as if the participants had been exposed to sham infrasound in both parts of the experiment. The objective of this study is to replicate Crichton but with a modified design to avoid those criticisms.
Experimental method
Simulated infrasound waveform
A detailed recording and analysis of infrasound generated by modern wind turbines was made by Walker et al. at the Shirley Wind Farm in Wisconsin, USA. 17 The investigation was conducted at three residences whose occupants reported health problems they attributed to infrasound. The Shirley Wind Farm consists of eight Nordex N100 2.5 MW wind turbines with 85 m hub height and 100 m rotor diameter located at varying distances from the residences, with the closest turbine being 390 m from the nearest residence. The weather conditions reported for the Walker et al. 17 measurements do not appear to be unusual, however, windy periods are noted. The authors do not declare any affiliation with an anti-wind farm movement or with any wind farm proponent and it is assumed they bring an open mind to the experiment. Narrow band frequency spectra reported in Walker et al. of the infrasound confirm the character of the sound was not random but characterised by a recurring fundamental frequency between 0.7 and 0.9 Hz and multiple harmonics which coincide with the turbine blade pass frequency and cannot be from other sources such as fans, subwoofers, refrigerators, etc. which have characteristic frequencies much higher than this.
The infrasound recorded had a maximum peak sound pressure level of 82–89.5 dB.
17
The higher sound levels were measured indoors which is not unexpected given that a confined space will exacerbate the level of low frequency sounds. Walker synthesized the waveform in MATLAB and produced multiple files for use in this study, one of which is a 0.8 Hz trapezoidal-shaped waveform with 16 harmonics as shown in Figure 1. For the purpose of this experiment, the waveform was played at a level of 91 dB peak, this being a slightly higher sound level than that recorded at Shirley. It is also at a higher level than reported for any wind farm to the authors' knowledge. The level also seeks to address the criticism in the Crichton study previously stated that the level of infrasound produced was too low (40–50 dB).
Infrasound signal used in experiment.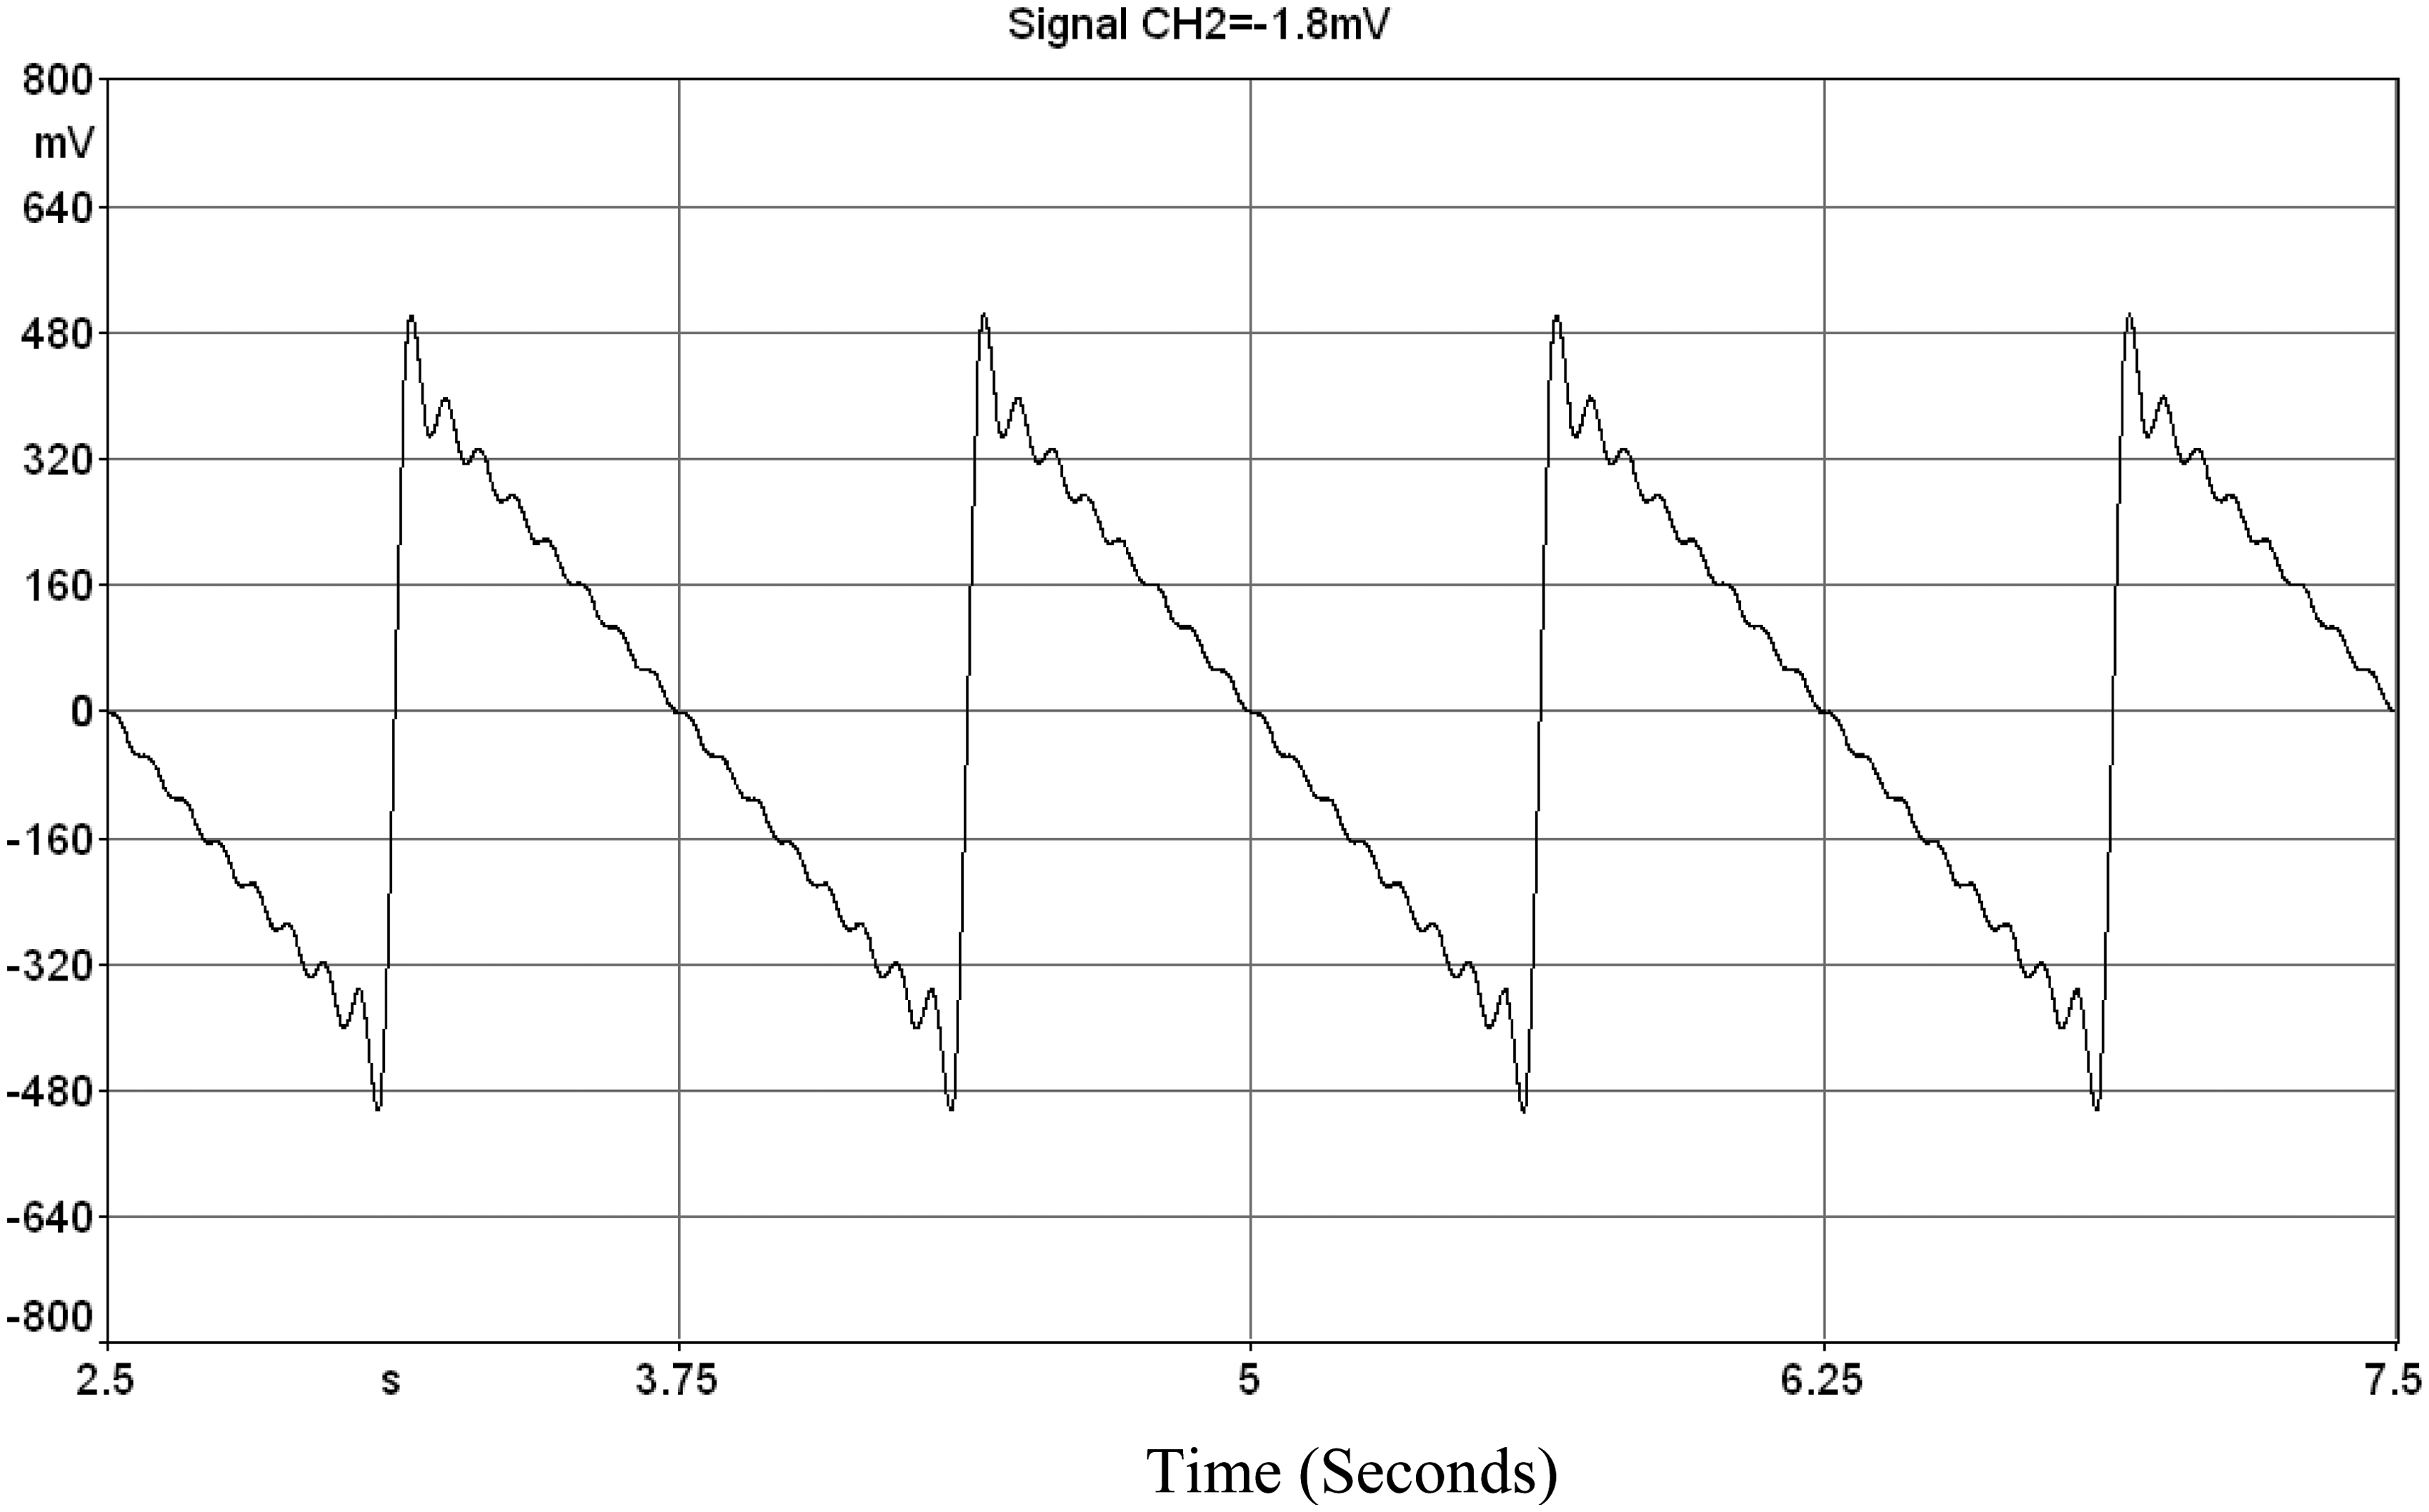
The waveform is especially significant because it simulates an environment allegedly causing residents to have experienced severe adverse health effects to the point where they have abandoned their homes at Shirley.
Apparatus for generating infrasound
Determining an appropriate method of playing the simulated infrasound waveform to participants proved challenging as most commercially available speakers do not have a frequency response designed for the low frequencies of interest for this experiment.
There are two approaches for generating sound at 0.8 Hz, one being the use of one or more large speakers to pressurise a receiving room, the other being playing the sound through headphones using a pneumatic driver. Each apparatus has advantages and disadvantages. The first approach has the advantage of being able to subject the whole body to infrasound but the apparatus is not easily transportable and the experiment would need to be conducted in a quiet receiving room. The second approach has the disadvantage that only the ears are exposed to the signal but the advantage that the equipment is portable and not nearly as susceptible to outside noise. The second generating method was employed in this study and therefore there is an inherent assumption that if infrasound affects the human body, the principal path is via the ears. This assumption is in agreement with the status of current research on this subject. For example, Møller and Pedersen summarise research in this area (looking at differences between normally hearing and profoundly deaf people and comparing thresholds for in-ear headphones versus pressure chambers) 18 and Salt and Kaltenbach adopt the premise that the stimulation of the outer hair cells via the ear is the detection method for infrasound. 19
The pneumatic generating apparatus consists of a nominal 5” diameter Visaton W 130 S loudspeaker screwed airtight to the inside of the lid of Pelican Storm Case iM2075. In the centre of the lid there is fitted a 6 mm air nozzle as shown in Figure 2.
Speaker attached to inside of lid of Pelican case with air nozzle at centre.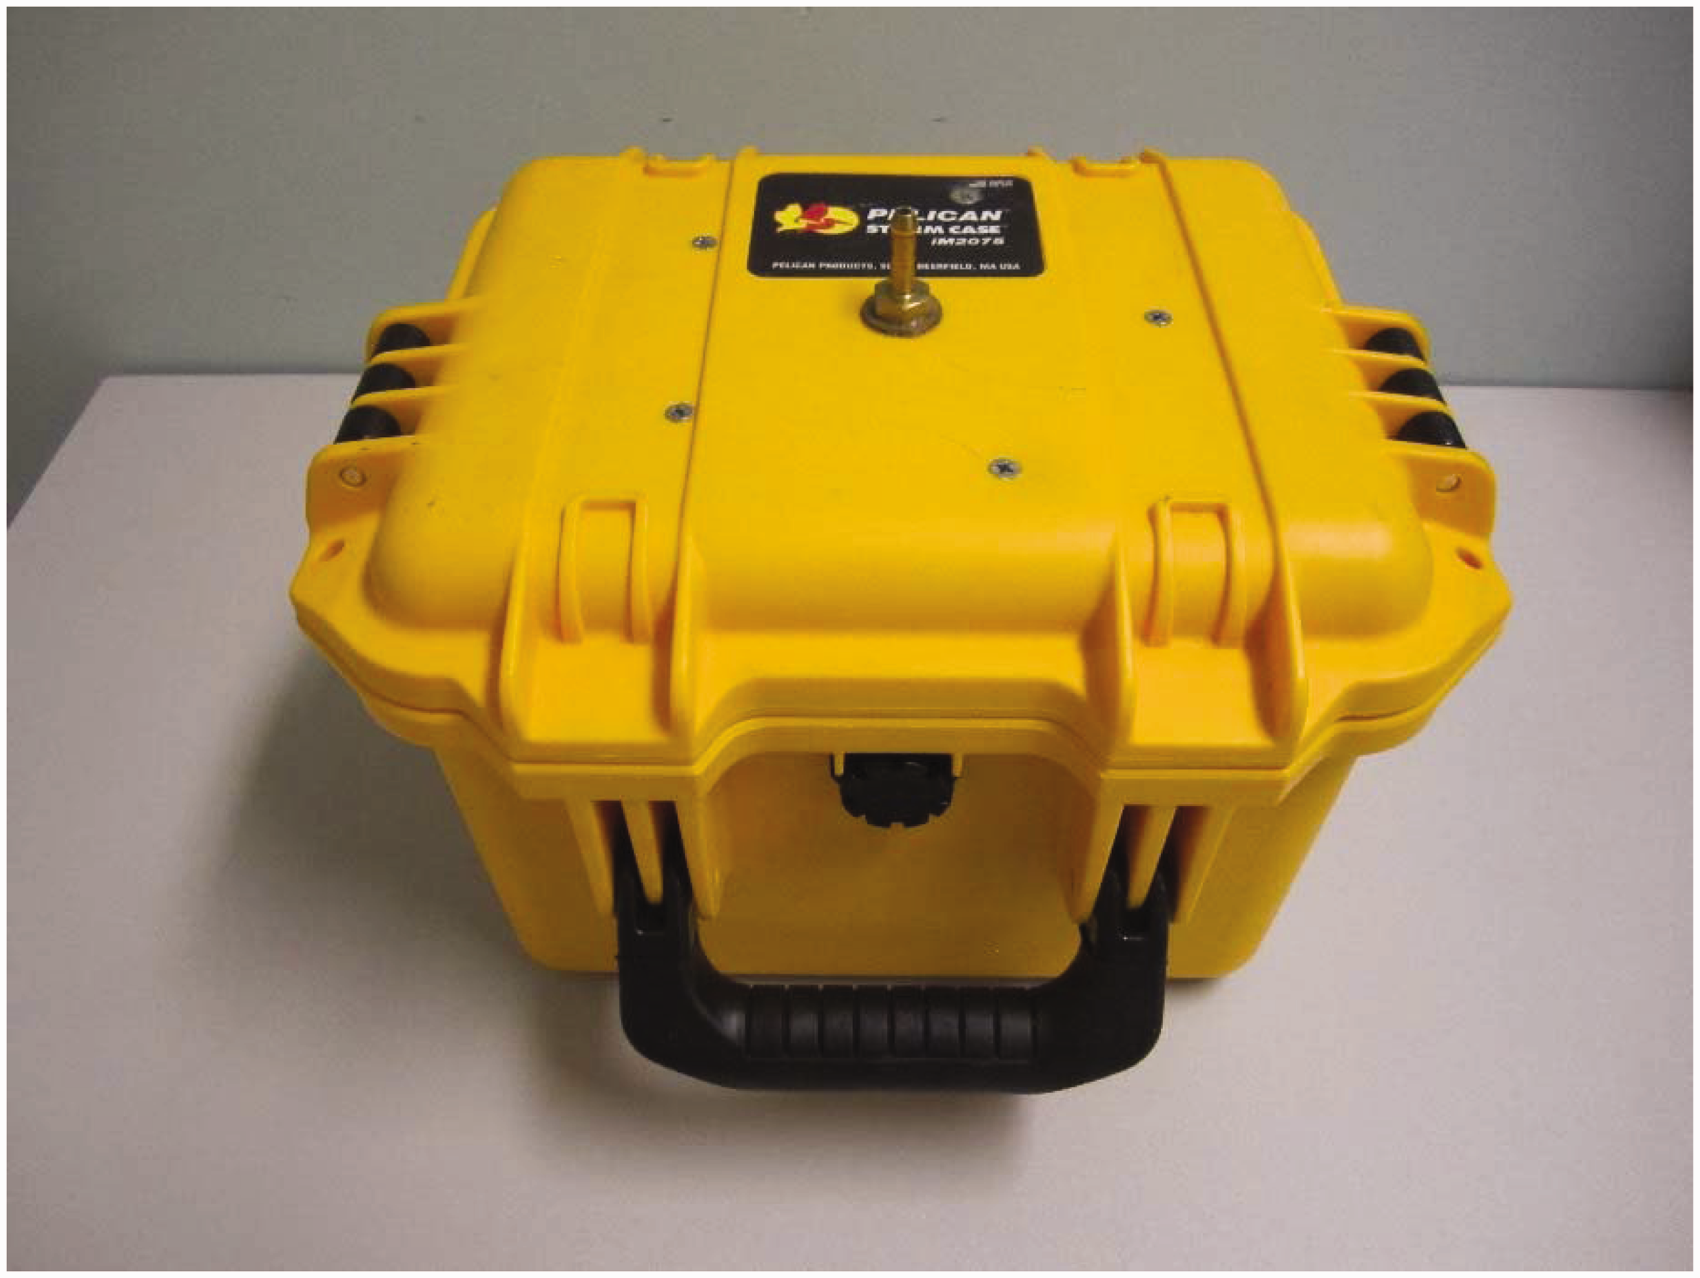
The loudspeaker is driven by a DC amplifier connected to a Sinus Soundbook running SAMURAI 2.0 software which generates the electrical waveform previously described. A 200 Hz low pass filter with DC offset adjustment and a dB attenuator are connected between the Soundbook and the amplifier.
The pressure signal from the speaker is transmitted via a 1.7 m length of 6 mm inner diameter clear vinyl/polyurethane tubing incorporating a brass splitter to connect to each cup of a set of Uvex-X earmuffs as shown in Figure 3. One of the cups was modified to house a G.R.A.S. 40AZ ½” Pre-polarised Free-Field Microphone connected to a G.R.A.S. Type 26CG ¼” Low Frequency CCP Preamplifier. The G.R.A.S. 40AZ microphone has a frequency response of 0.5 Hz to 20 kHz (±2 dB) which encompasses the range of the study.
Complete acoustic headphones including twin 6 mm nozzles with attached tubing, microphone and occlusion ports (located on the cup either side of the head strap).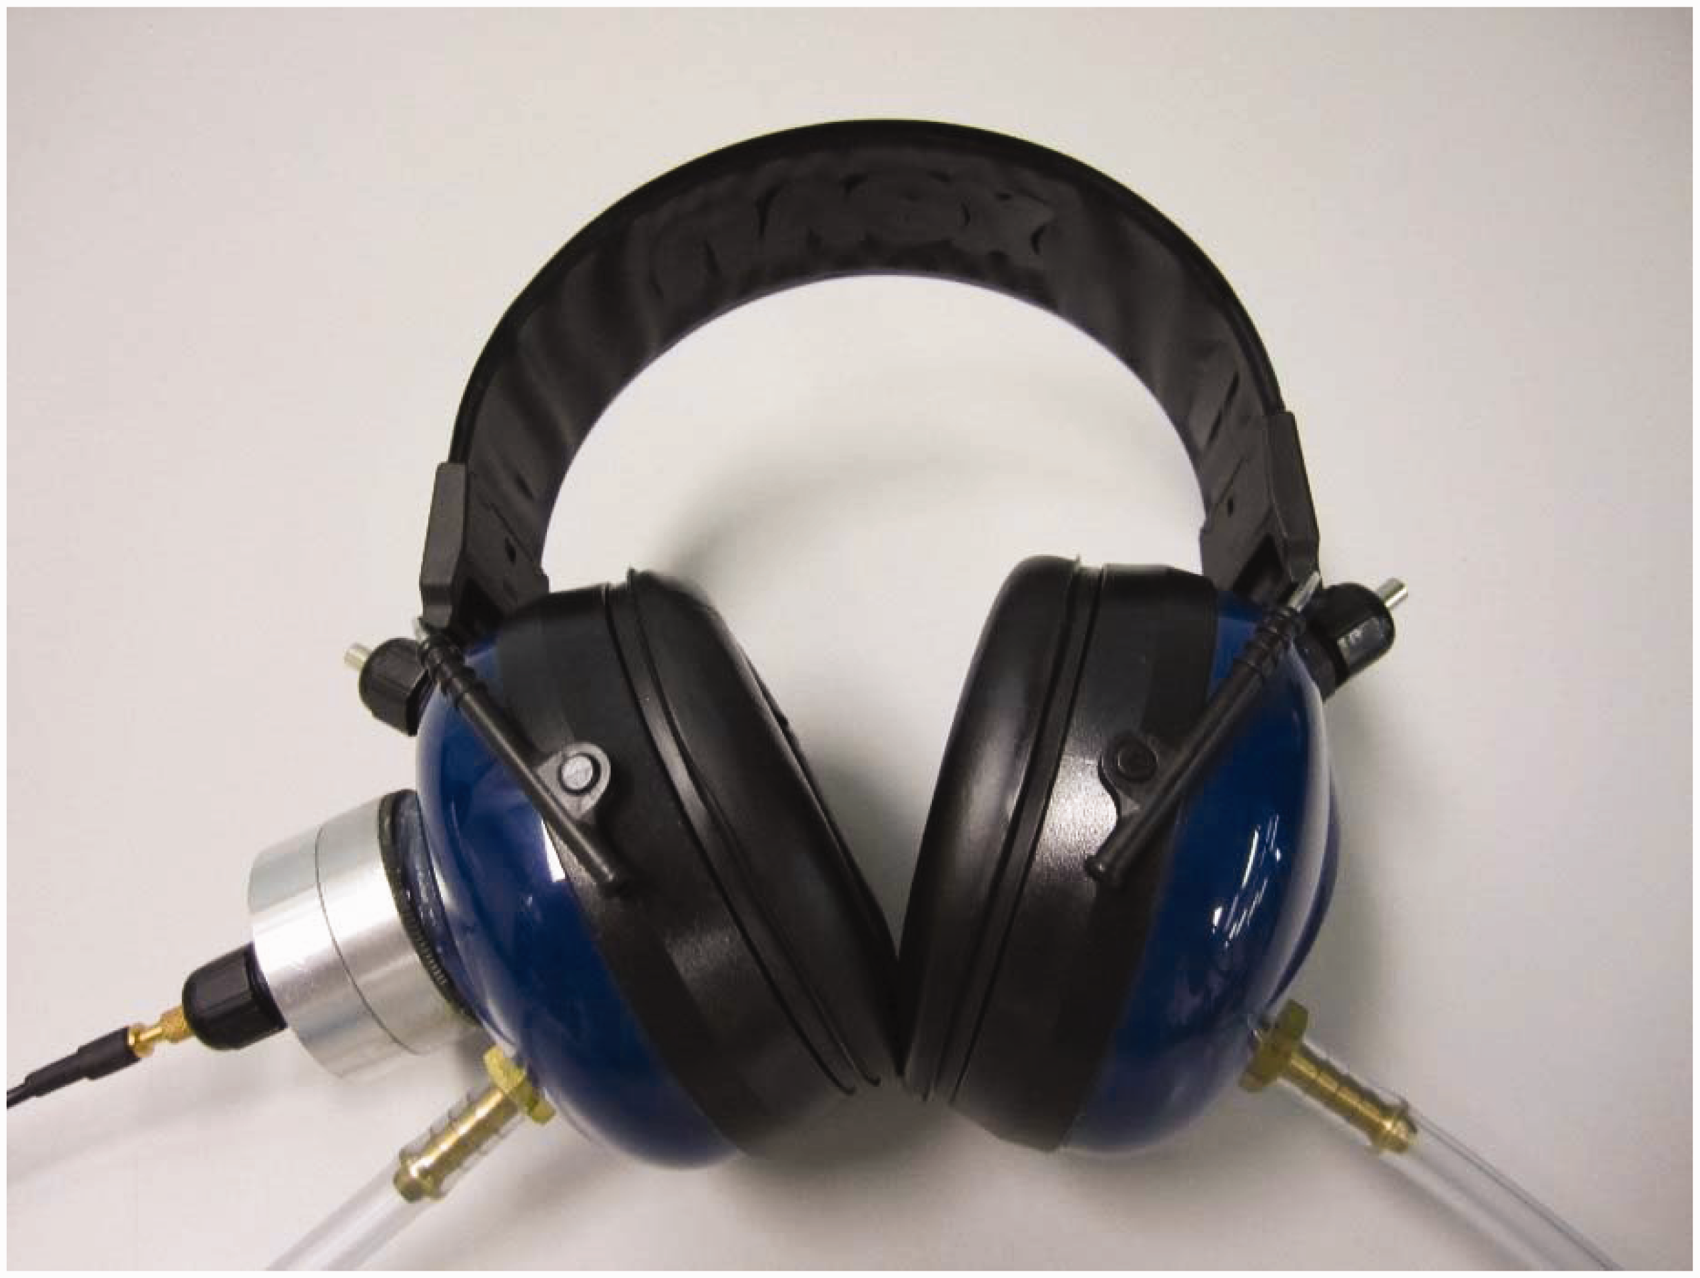
An unexpected complication arose during testing of the headphones. It was found that the measured sound level in the headphones from the heartbeat of all volunteers wearing the headset was in the range 90 dB peak which confounded the generated infrasound signal. The sound of one's heartbeat is audible to a person wearing earmuffs in a quiet room. The effect was reduced significantly to below 80 dB peak by incorporating a 3 mm diameter venting port as shown in Figure 3. Figure 4 shows the effect of occluding and un-occluding the vents. In these traces, there is no infrasound generated by the loudspeaker – the result is simply the measured sound in the headset worn by the volunteer.
Sound pressure trace within headset with venting ports occluded. Sound pressure trace within headset with venting ports un-occluded.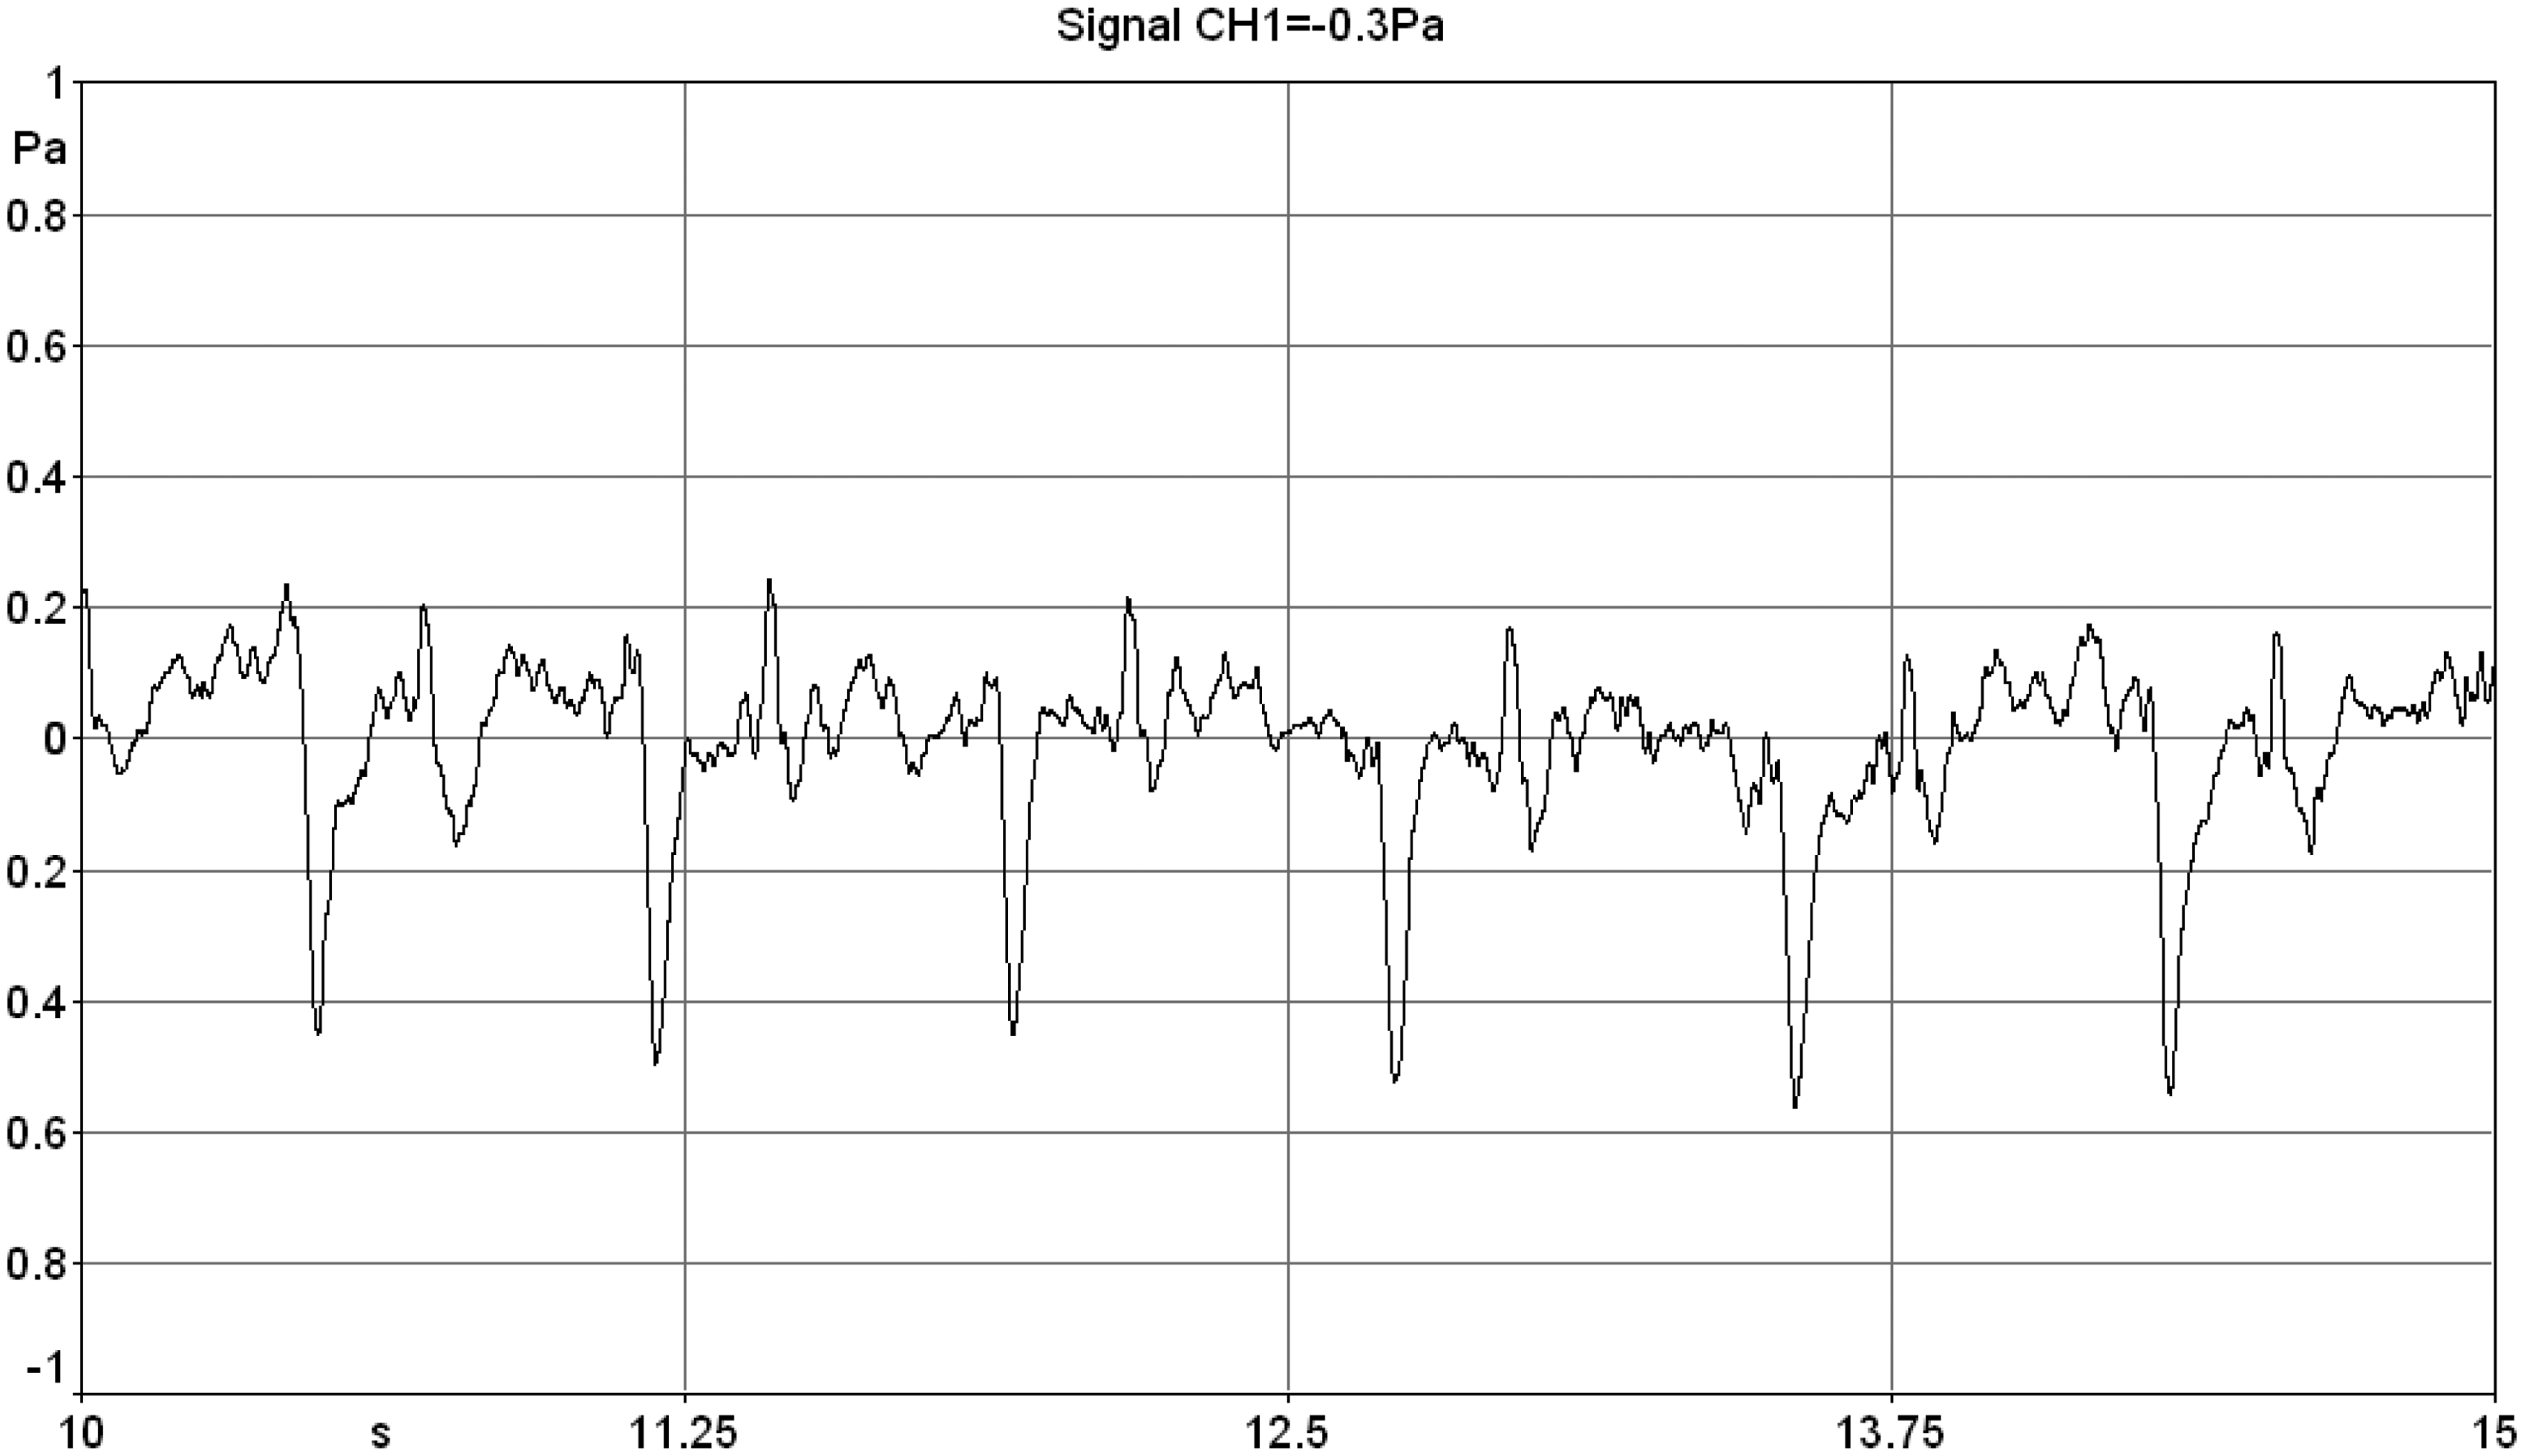
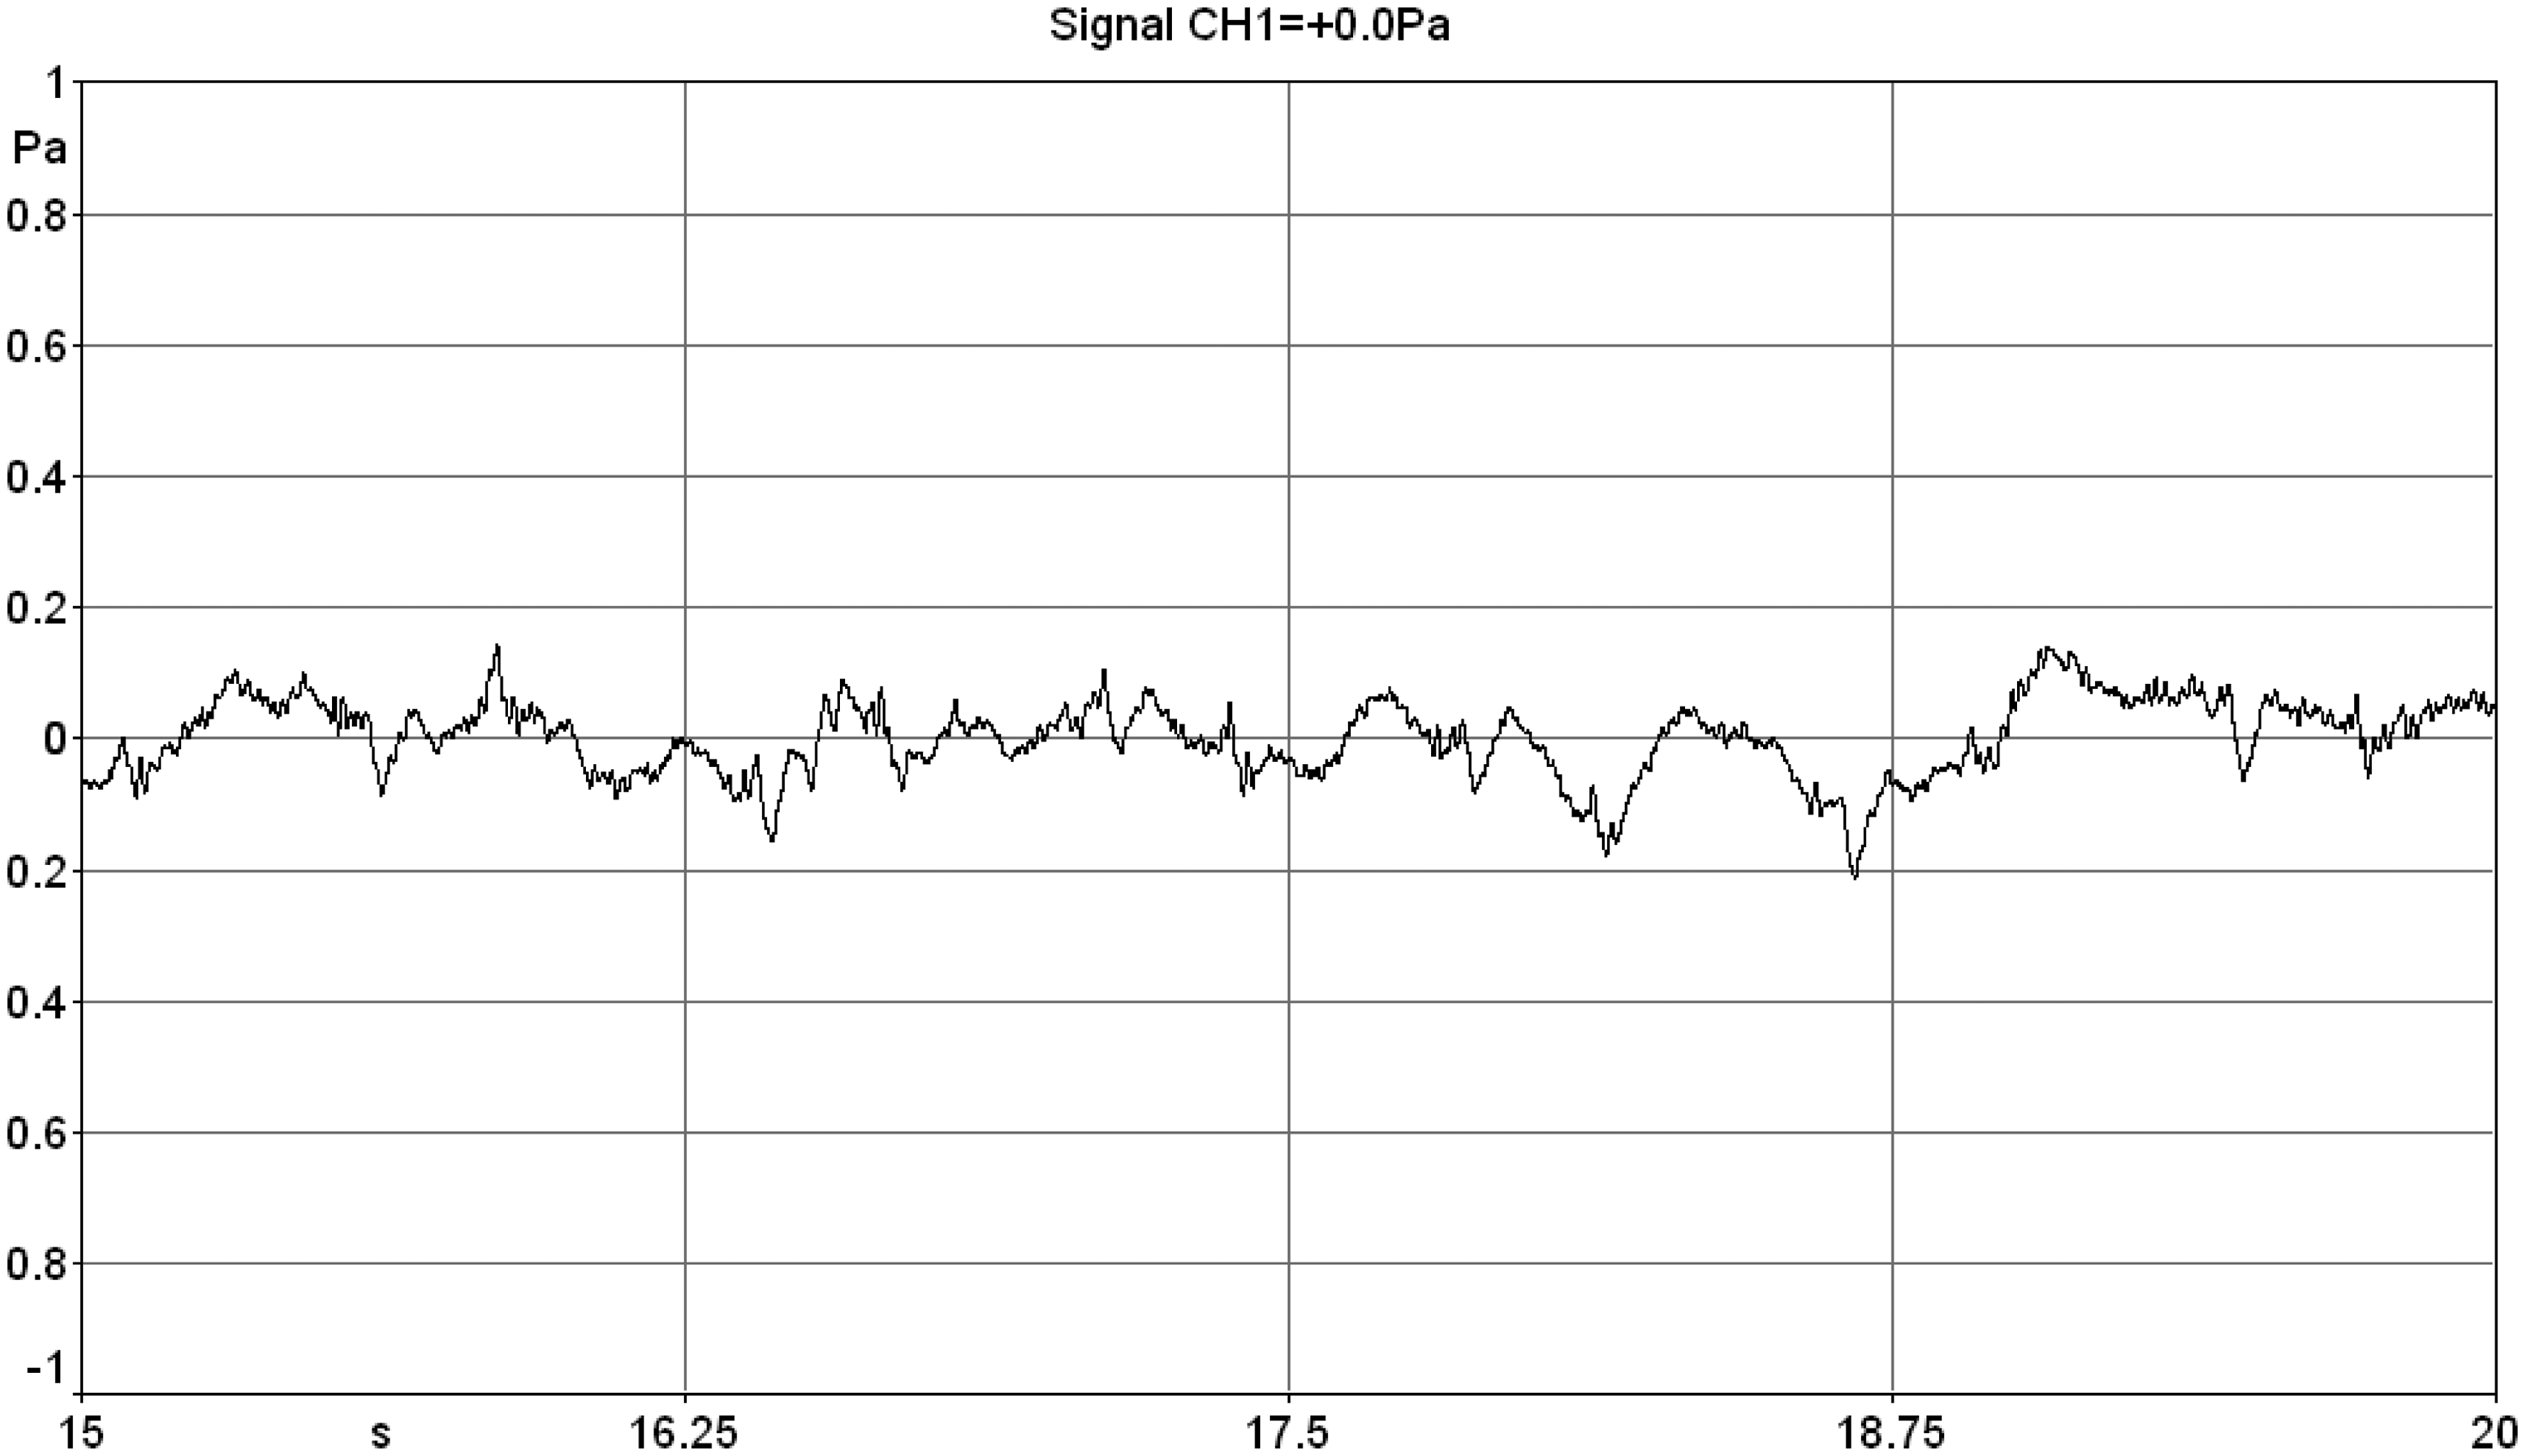
The source of the occluded heartbeat is thought to be pressure fluctuations from blood vessels near the surface of the skin encapsulated by the headphones, acting like a piston in a cylinder pressurising the entrapped air. Several large blood vessels, such as the external carotid artery and the superficial temporal artery, run close to the ear. 20 A detailed examination of this source of sound is beyond the scope of this study, needless to say that the sound level is reduced significantly below the 91 dB peak generated by the loudspeaker and therefore is unlikely to be a confounding factor. This was checked for each participant.
The loudspeaker and microphone combination with the un-occluded vents was checked for linearity and is within ±4 dB from 0.8 Hz to 40 Hz which comprises the frequency range of the generated infrasound and harmonics.
Figure 6 shows a typical output display of the generated infrasound waveform (lower left of the screen), the measured waveform in the headset (upper left), the narrow band frequency spectrum of the generated infrasound waveform (lower right) and the narrow band frequency spectrum of the measured waveform in the headset (upper right).
Soundbook with SAMURAI 2.0 software display during typical test.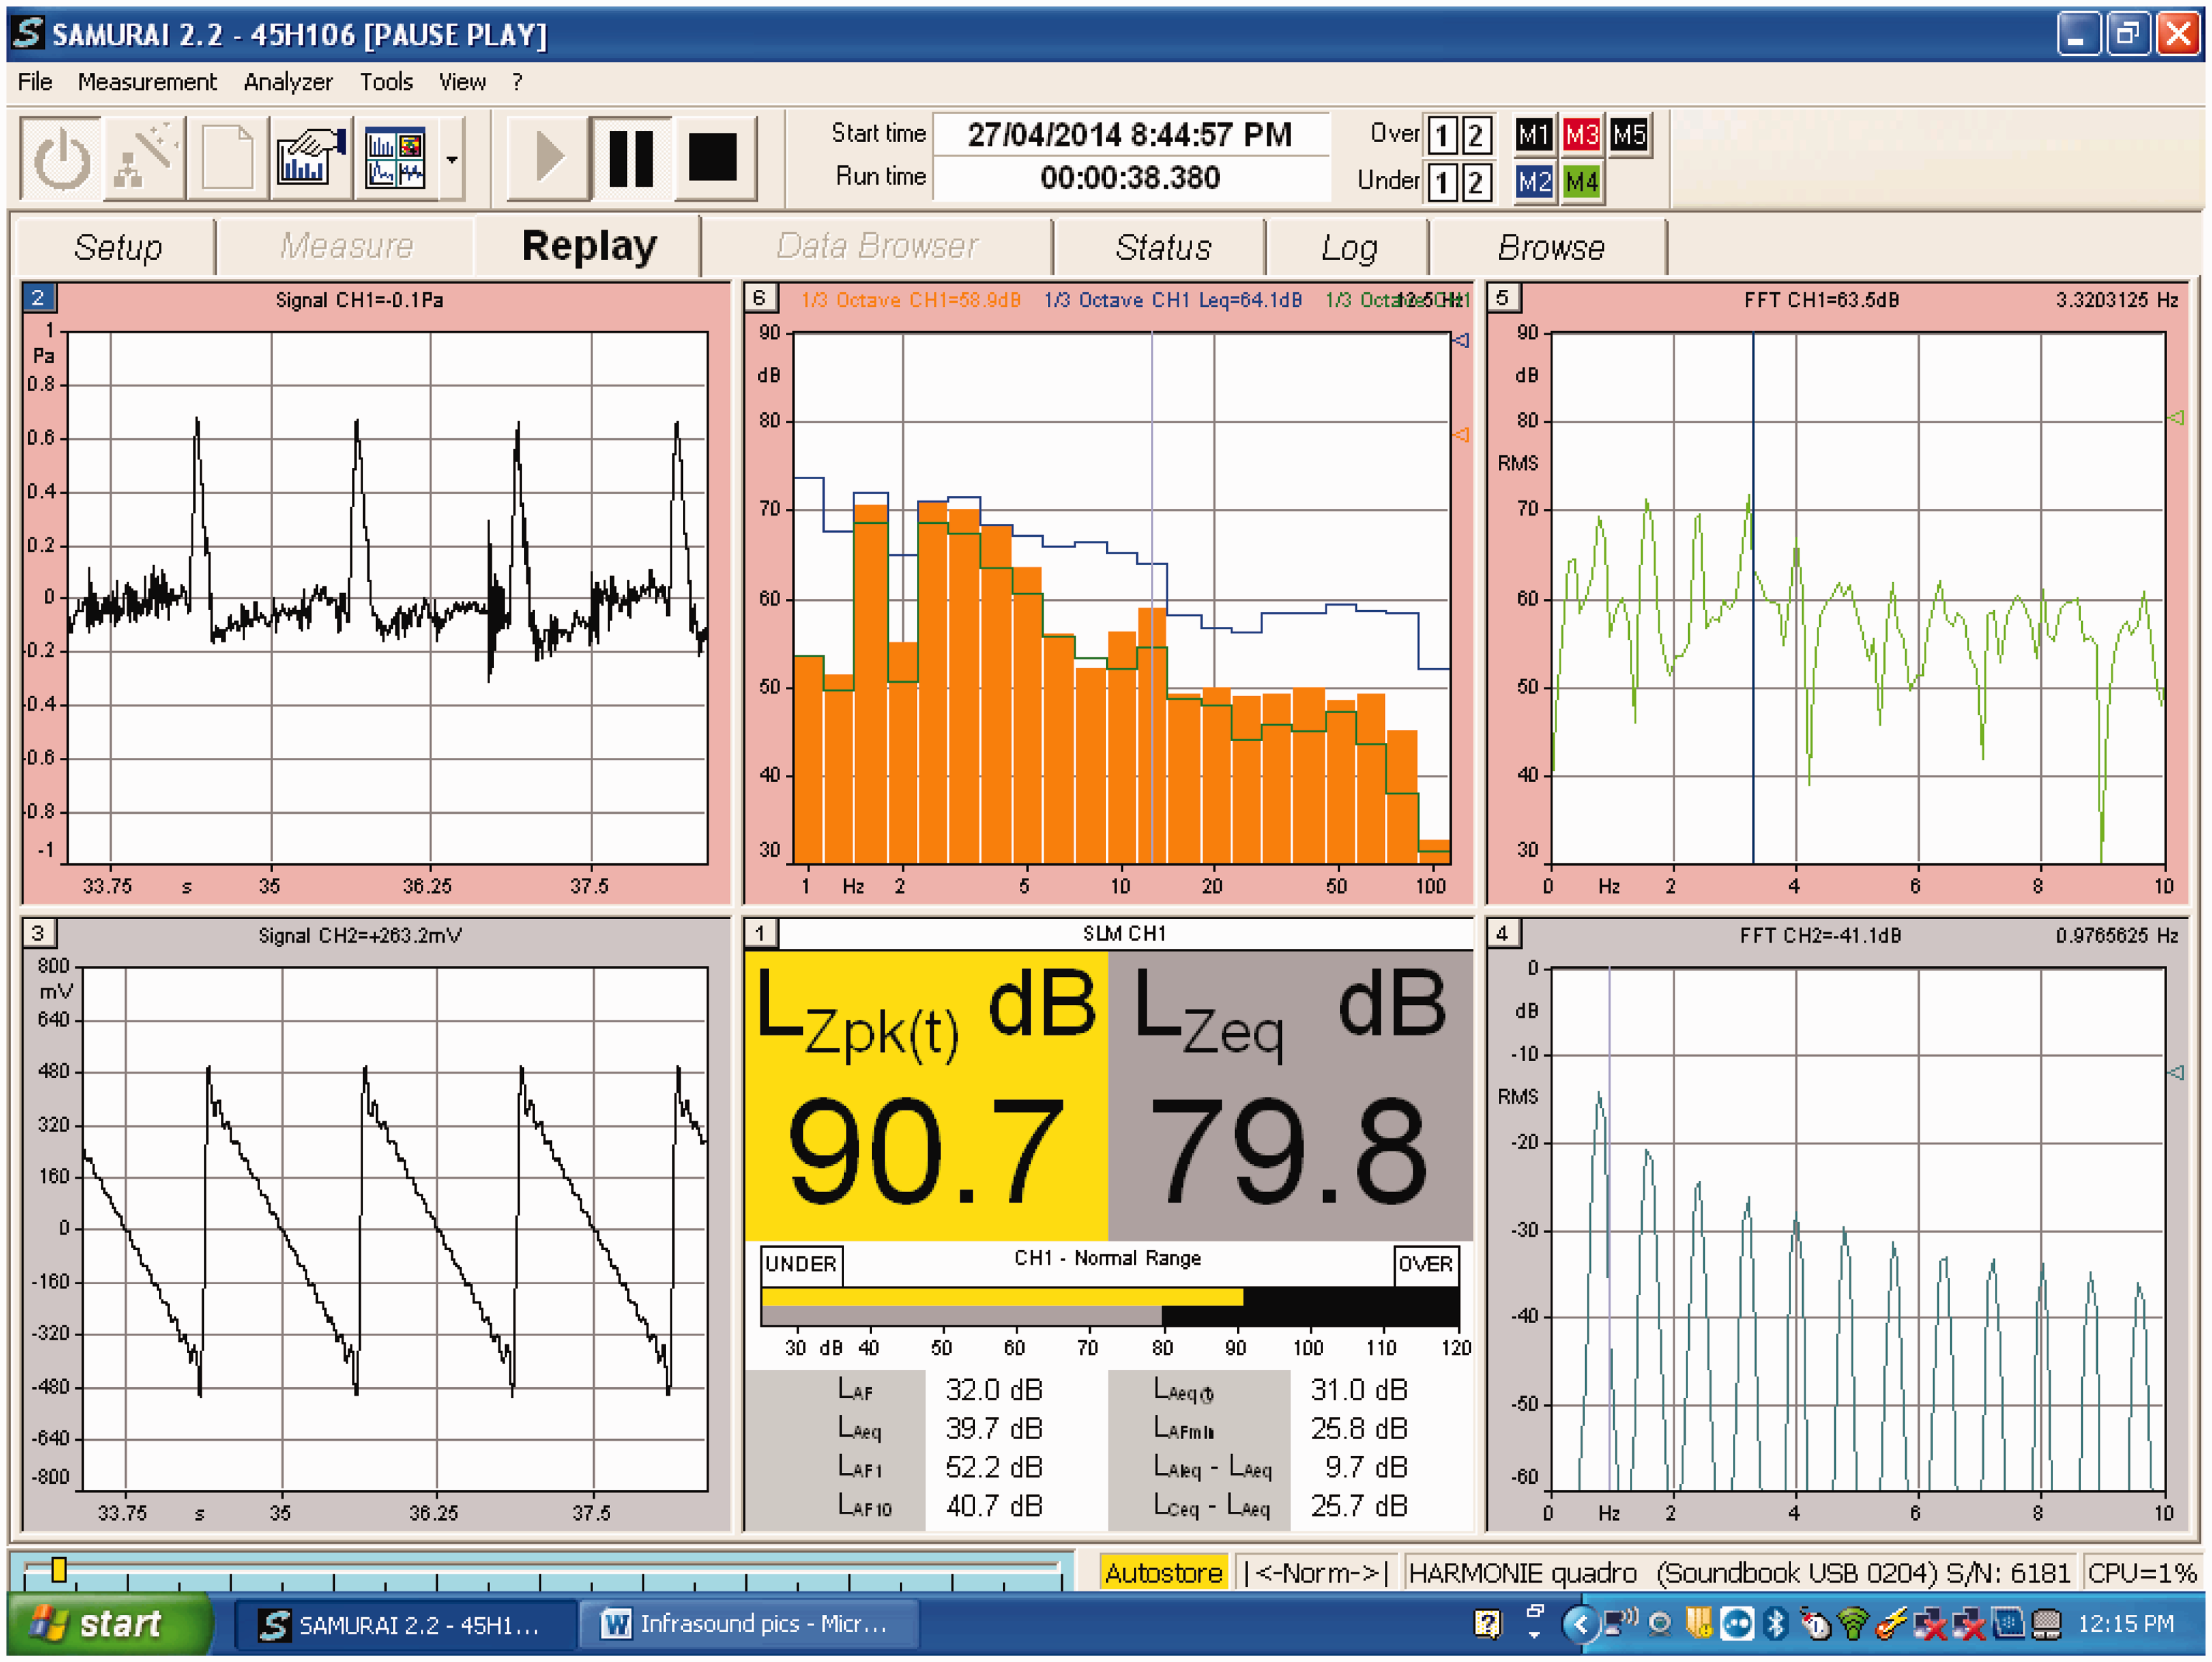
Also shown are a 1/3 octave band levels and LZpk of the measured waveform in the headset (upper centre and lower centre). For comparison, Figure 7 below shows the multitude of blade pass frequency components recorded in a typical recording at Shirley Wind Farm.
Measured typical narrow band spectrum recorded at Shirley Wind Farm showing blade pass frequency components.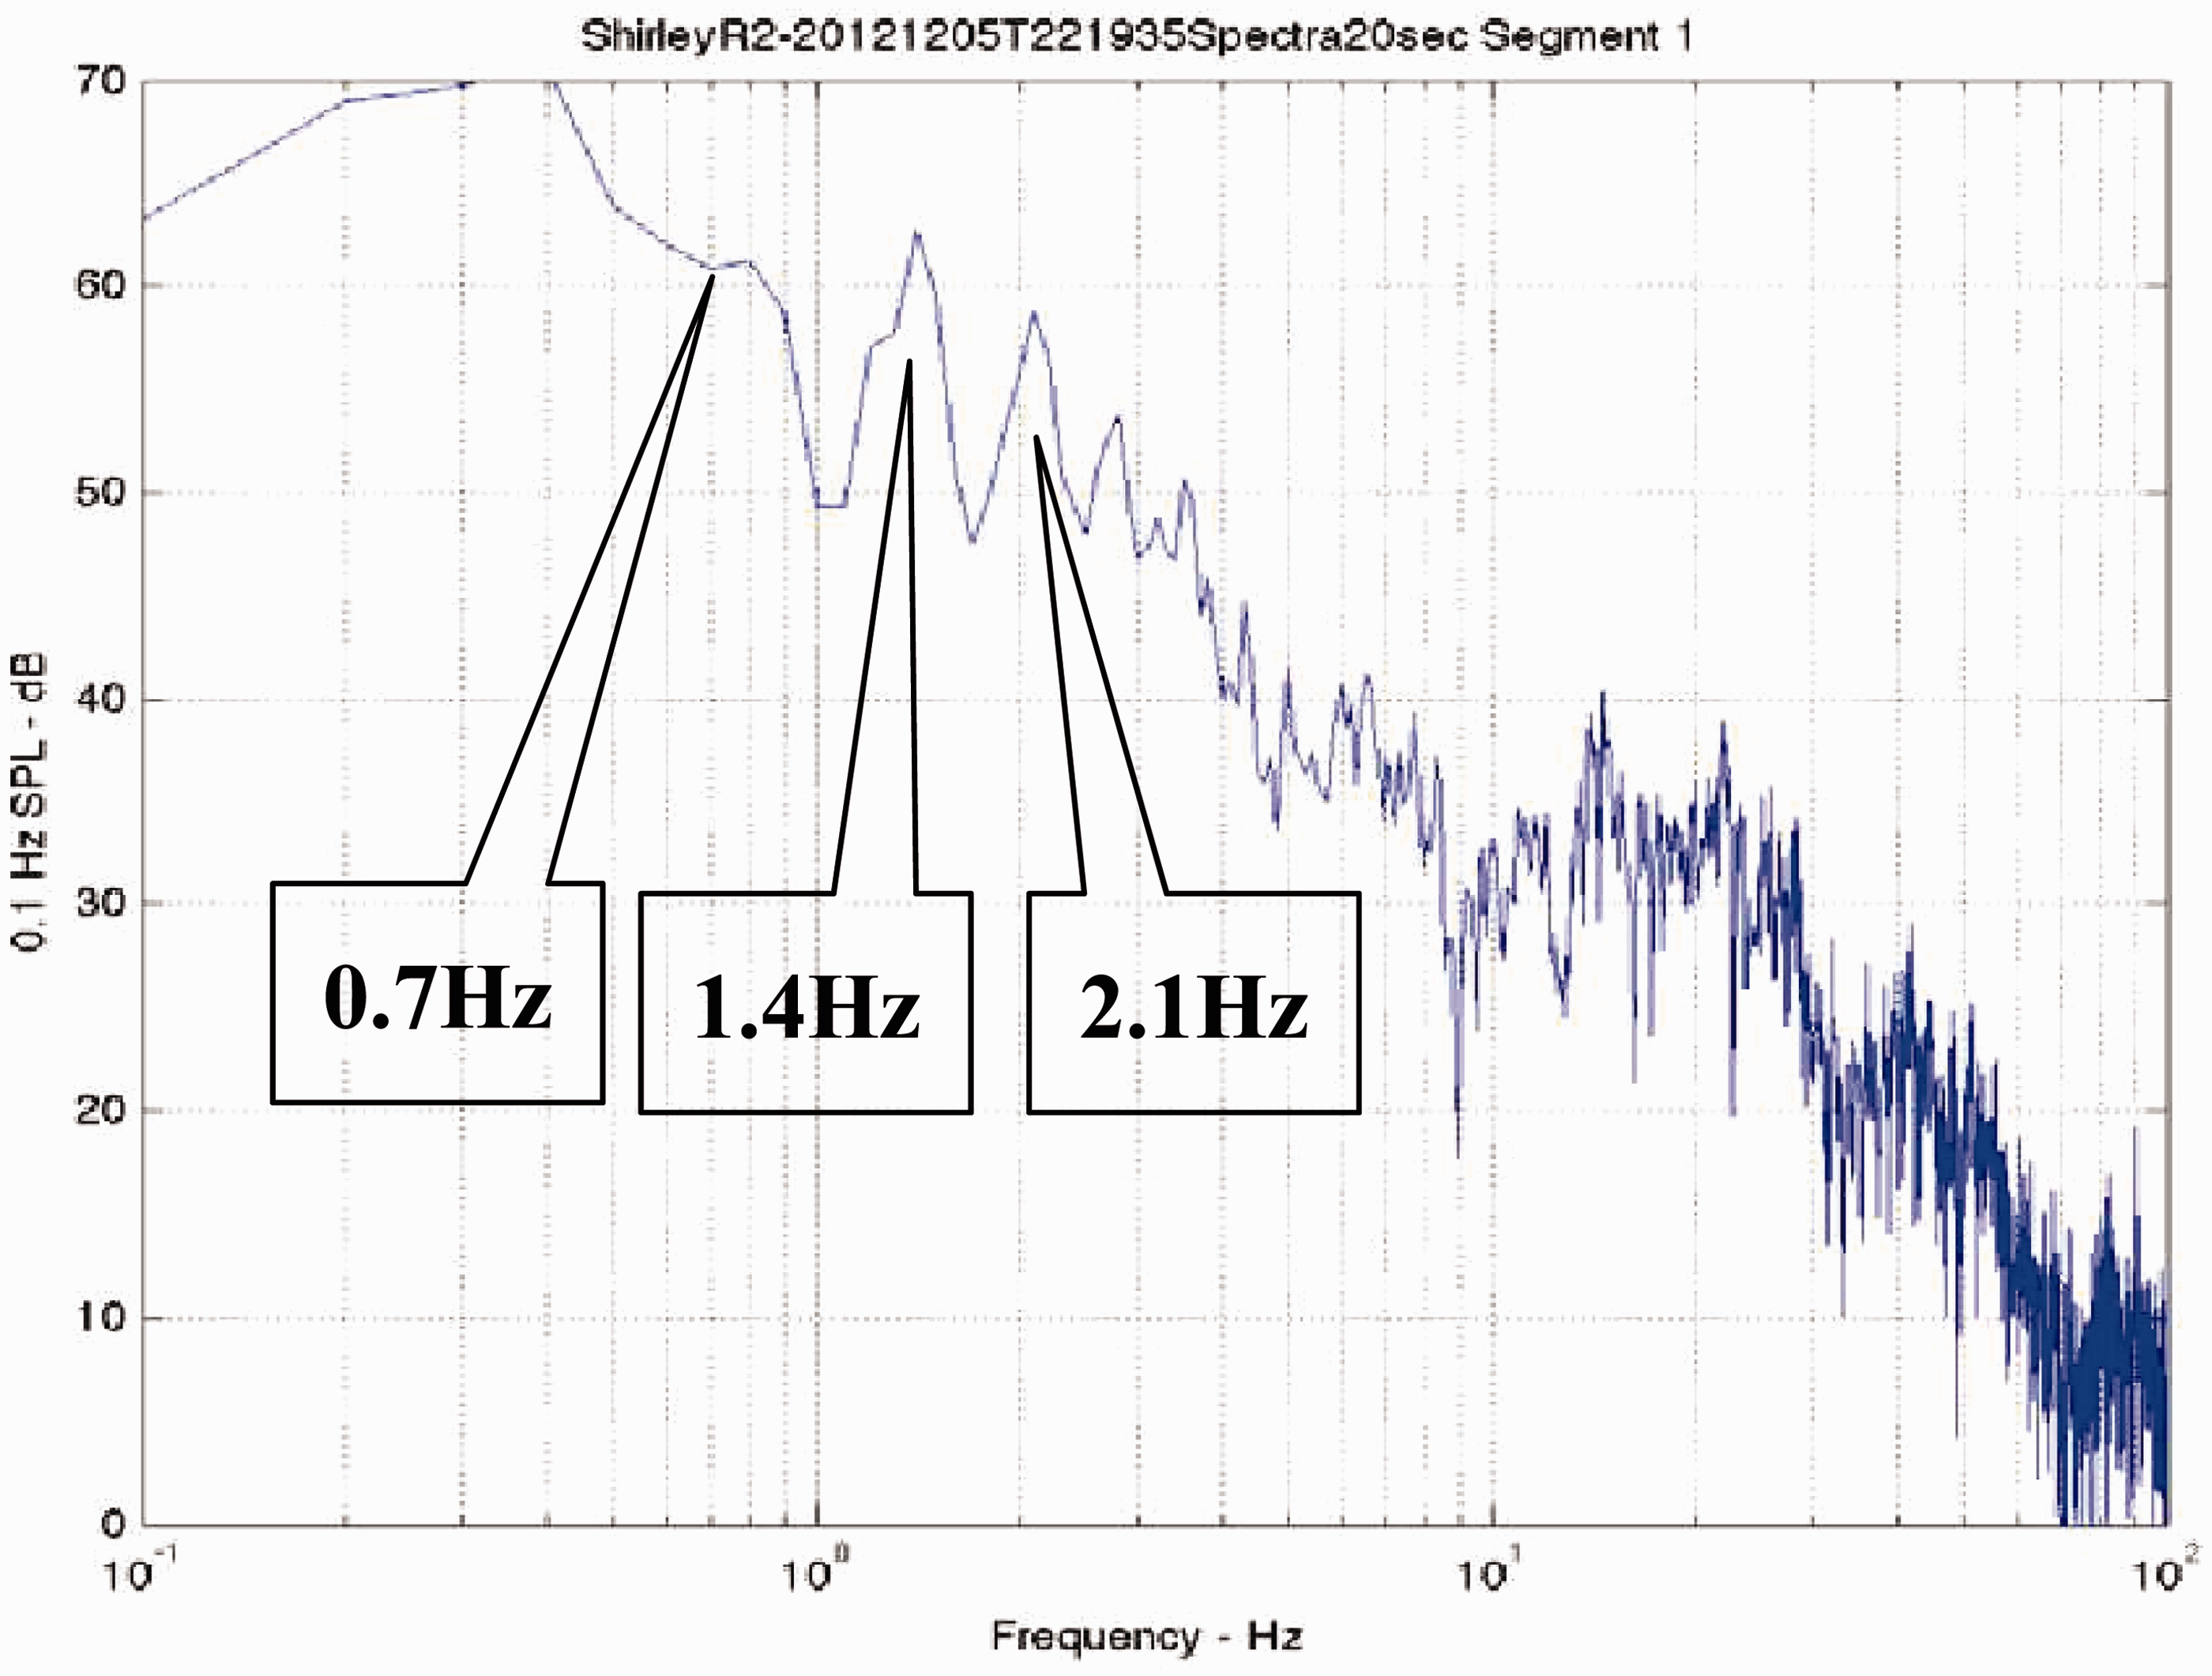
Experimental design
A total of 72 volunteers was tested, 27 female and 45 male. The gender imbalance is noted as not being ideal. The age of the participants ranged from 17 to 82 years with a median age of 29 years. Participants were sourced from professional firms (not associated with wind farms), students, government organisations and family members.
Experimental groups.
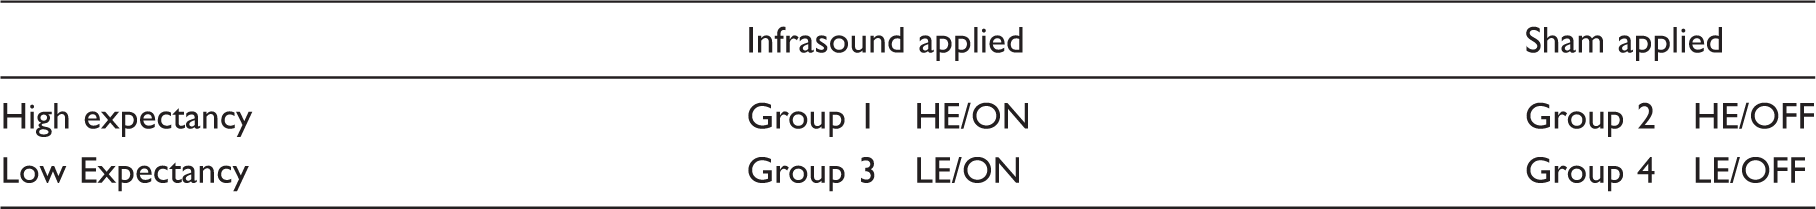
This experimental design differs from the Crichton study in an important way. The Crichton study used two groups in a “crossover study”, exposing them both to sham and “real” infrasound. This study used four groups in a “parallel study”, exposing them only to one of sham or “real” infrasound. A crossover study minimises characteristic differences between participants because each participant is tested with real and sham infrasound and those differences are assumed to cancel out. However, when testing a placebo effect, such as the effect of infrasound, there is a concern that any effects of exposure to infrasound might carry over to the sham period of the experiment. Ideally there should be a delay between the two periods of exposure which is not mentioned in the Crichton study. But a delay would also prolong the experiment with the obvious concern that participants would not be willing to give up their time. Therefore, it was decided in this study to use the alternative parallel study which allows for a longer time of exposure and eliminates the risk of contamination.
Each participant was tested once only to either sham or applied infrasound. Participants were told that they would be watching a video with some background information on the topic. The participants were unaware that there were two such videos having different intentions. The participants were told that they would be listening to infrasound for 23 min, but that they would not necessarily hear the infrasound. Participants were not aware that some of them would not be exposed to infrasound (sham). In respect of the exposure time, Ambrose and Rand (who are acoustic consultants with reported sensitivity to motion sickness) claimed to have personally experienced symptoms ‘within 20 minutes’ of un-blinded exposure to wind turbines. 21 In addition Salt and Lichtenhan report an experience by a woman in Europe that “From the moment that the turbines began working I experienced vertigo-like symptoms on an ongoing basis”. 4 Nevertheless, it is accepted that exposure to 23 min of infrasound can no way equate to a long-term period and therefore the conclusions of this study must be interpreted with that limitation in mind.
Prior to the test, the participants were asked to complete a questionnaire which rated to the extent that they were feeling various symptoms on a 7-point Likert scale ranging from 0 (none) to 6 (extreme) at the commencement of the experiment and then again at the conclusion. There were 24 symptoms listed on the questionnaire, 12 that are typically associated with wind turbine health complaints (headache, ear pressure, ringing in the ears, itchy skin, sinus pressure or irritation, dizziness, pressure in the chest, vibrations within the body, racing heart, nausea, tiredness, feeling faint), and 12 that are not typically associated with wind turbine health complaints (stomach ache, aching legs, aching arms, sore joints, stiff muscles, back pain, numbness or tingling in the body, difficulty swallowing, sore jaw, chills, hot flushes, hand tremble or shake).
Participants were also asked to rate how concerned they were about the health effects of wind turbine infrasound on a 7-point scale ranging from 0 (completely unconcerned) to 6 (extremely concerned). The typical and atypical symptoms in the questionnaire were deliberately included to test for the nocebo effect. Participants were then randomized to watch one of two introductory videos each of 5 min duration designed to modify their expectations,22,23 one to heighten expectations (of an interview with a wind farm affected couple) and the other to lower expectations (of an academic explaining why in his view infrasound is not a problem).
At the conclusion of the expectation video, the participant was fitted with the special headset described previously and was directed to watch a sub-titled video documentary of duration 23 min with no connection to wind farming. The purpose of this distraction video was to give the participant something to do during the experiment in order to direct their attention away from the symptom questions. The examiner played the infrasound (or the sham infrasound) for the duration of the documentary. Instructions were provided to both the examiner and the participant in sealed envelopes. The examiner was unaware as to which video the participant watched, nor whether the participant would be exposed to the infrasound, until such time as he left the room and opened the envelope. At the conclusion of the video documentary, the participant completed the second questionnaire, identical to the first, without referring to the first.
The number of symptoms with a score ≥1 was calculated for both the initial and final questionnaires, as was an intensity of symptom score, which was calculated as the sum of all the ratings given.
Results
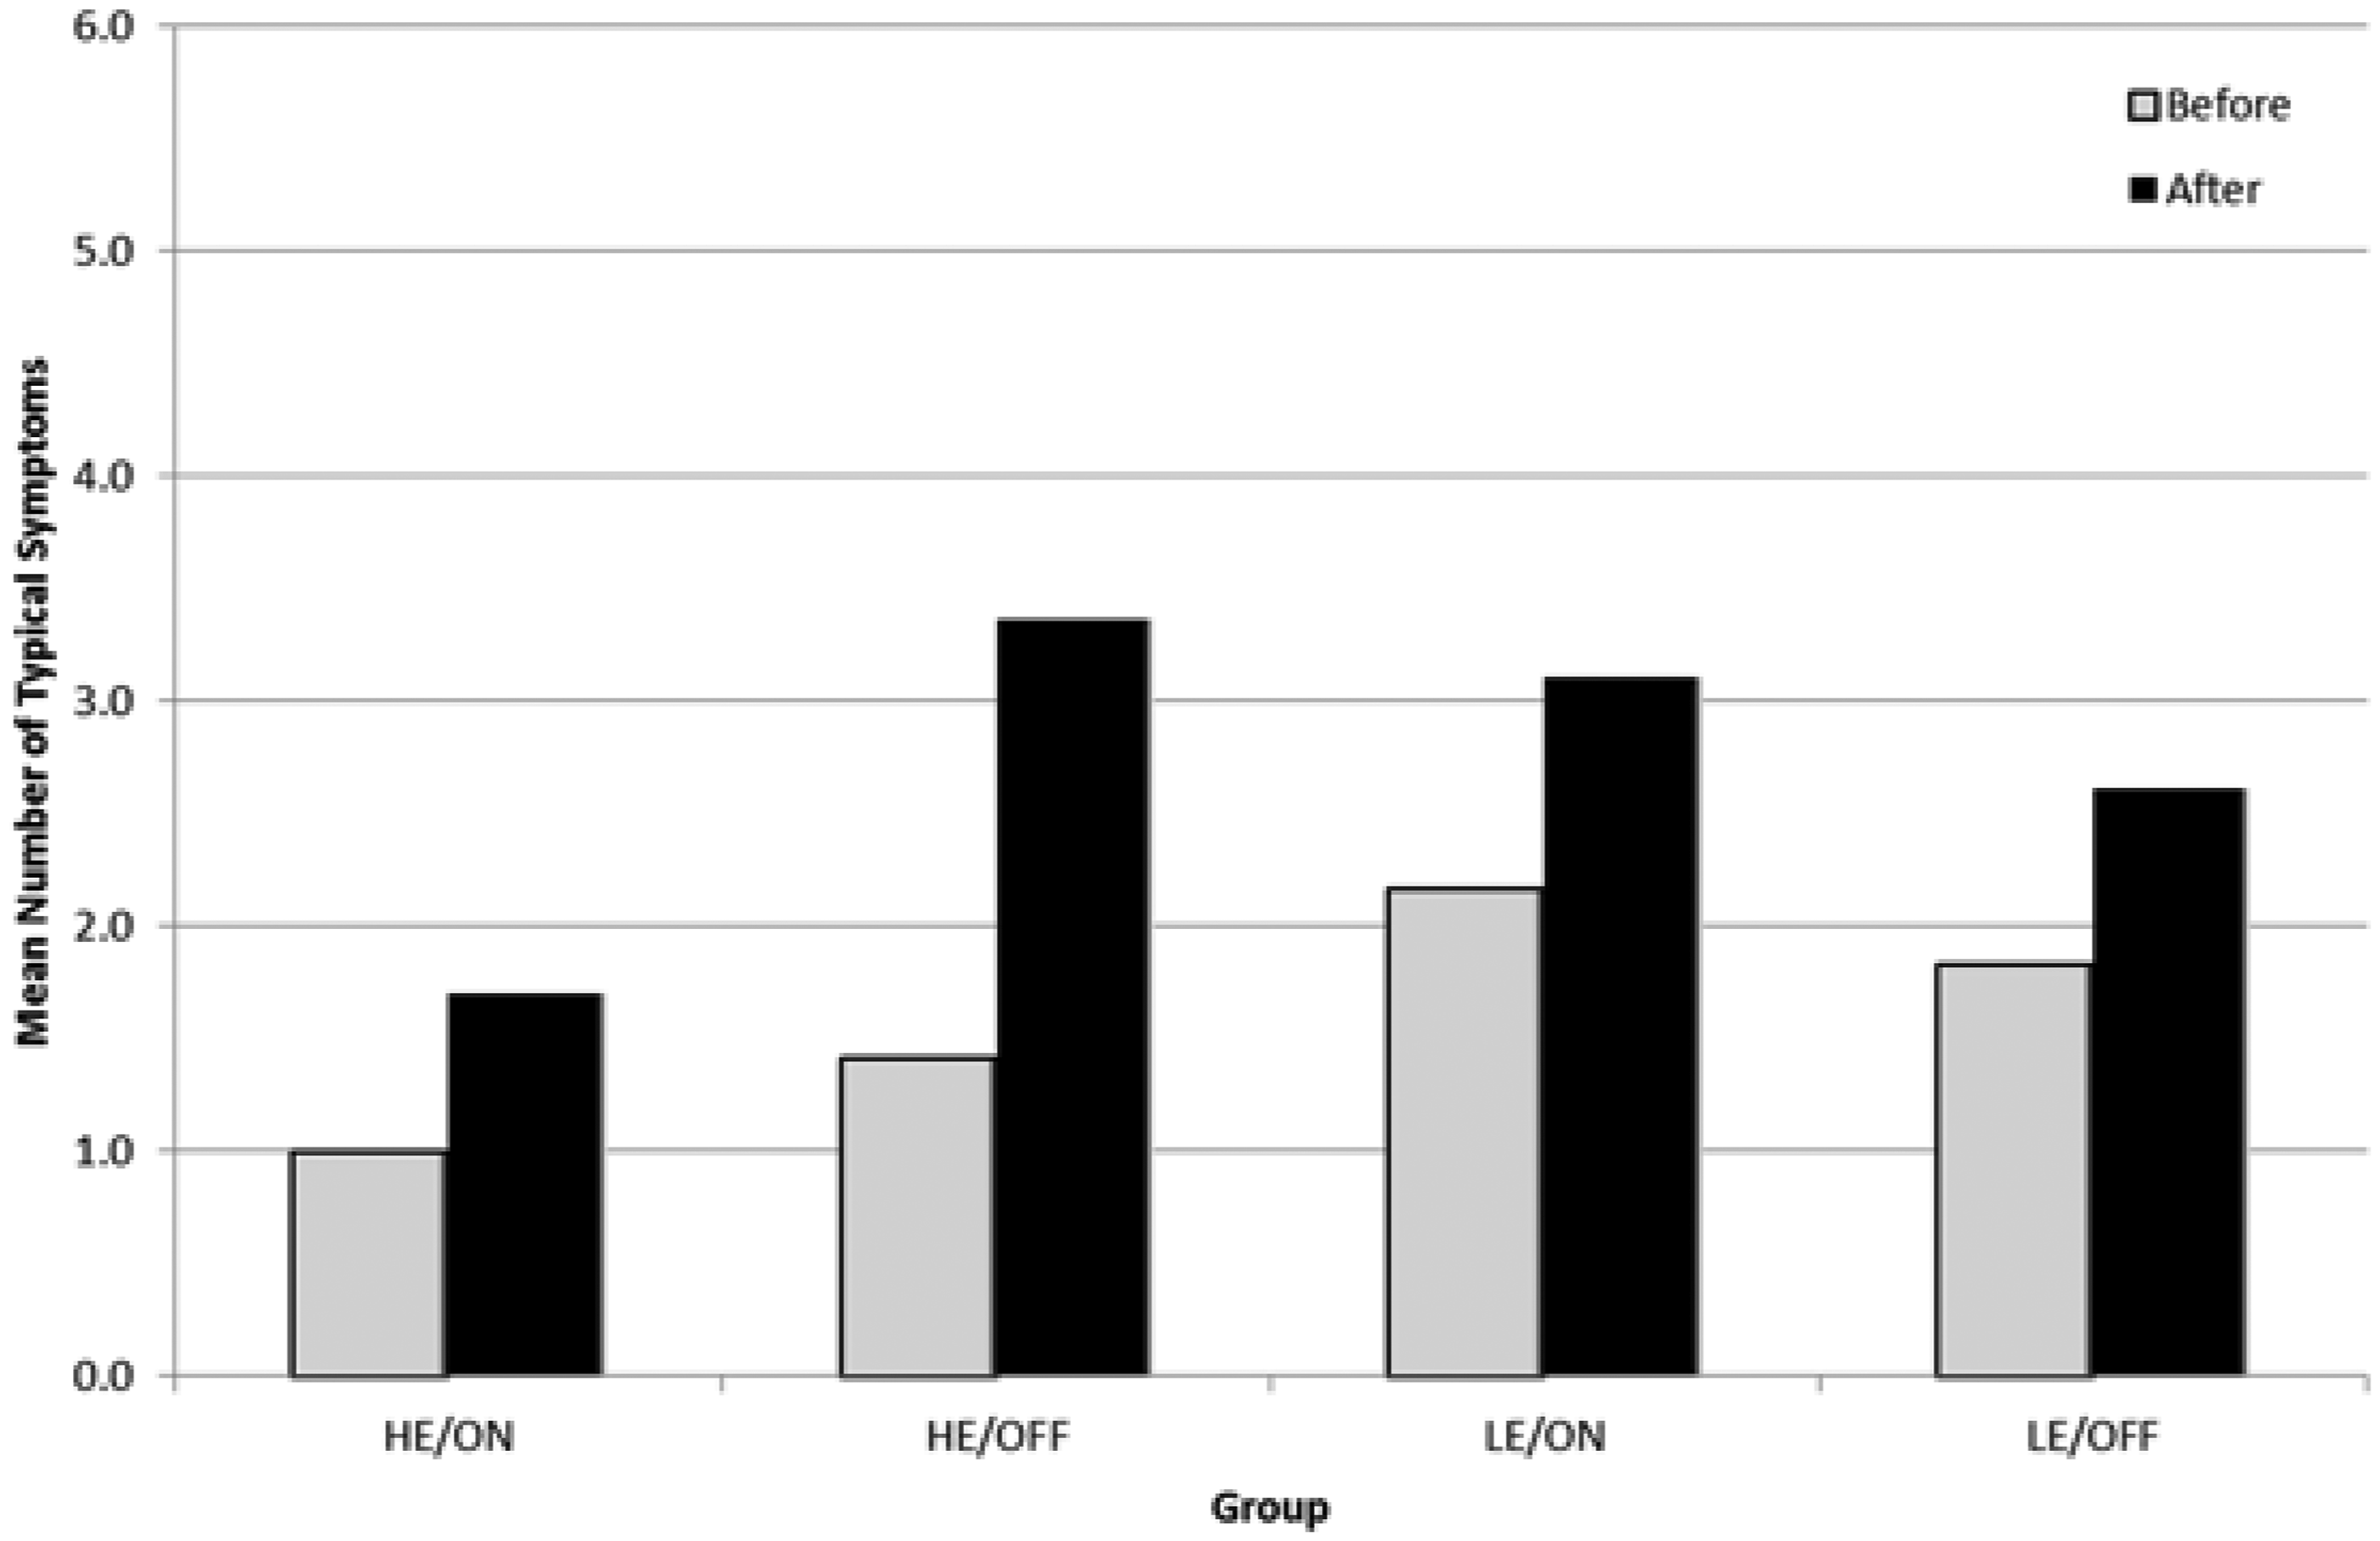
Table 2 shows the results of the mean and standard deviations of the number of symptoms and are plotted in Figures 8–10.
Mean number of symptoms before and after, per group. Mean number of typical symptoms before and after, per group. Mean (SD) of number of symptoms, number of typical symptoms and number of atypical symptoms per group before and after.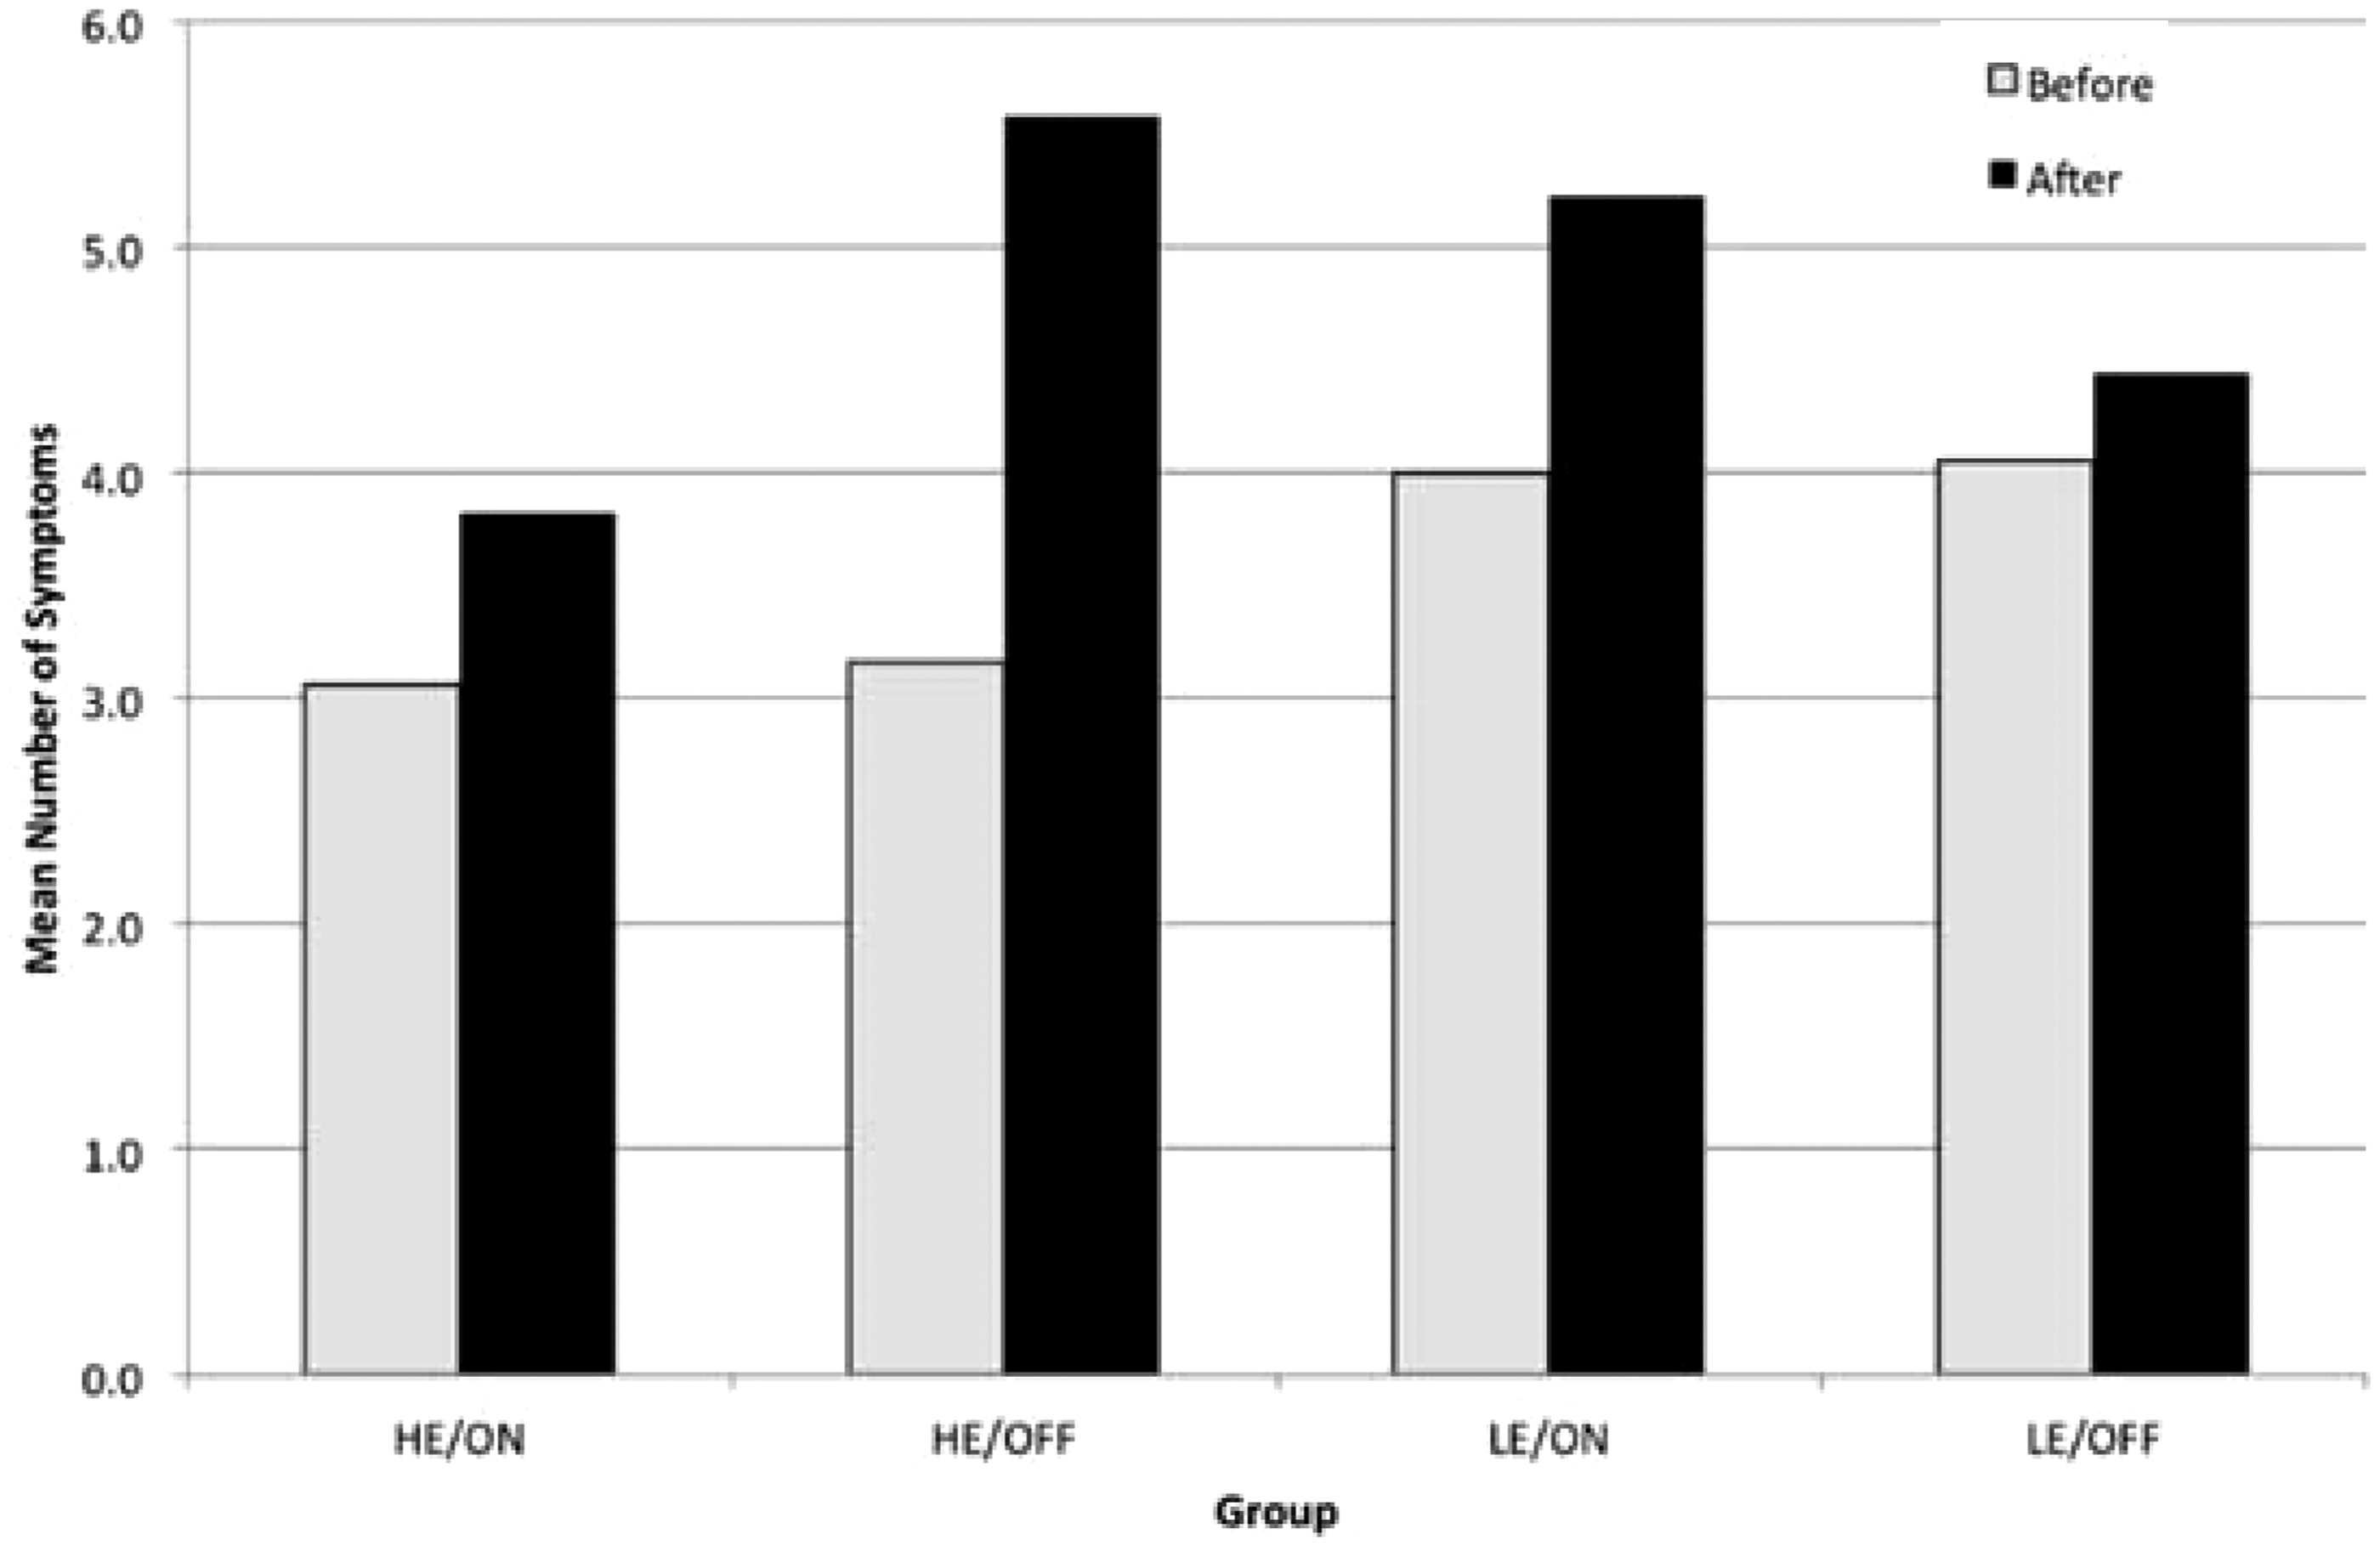
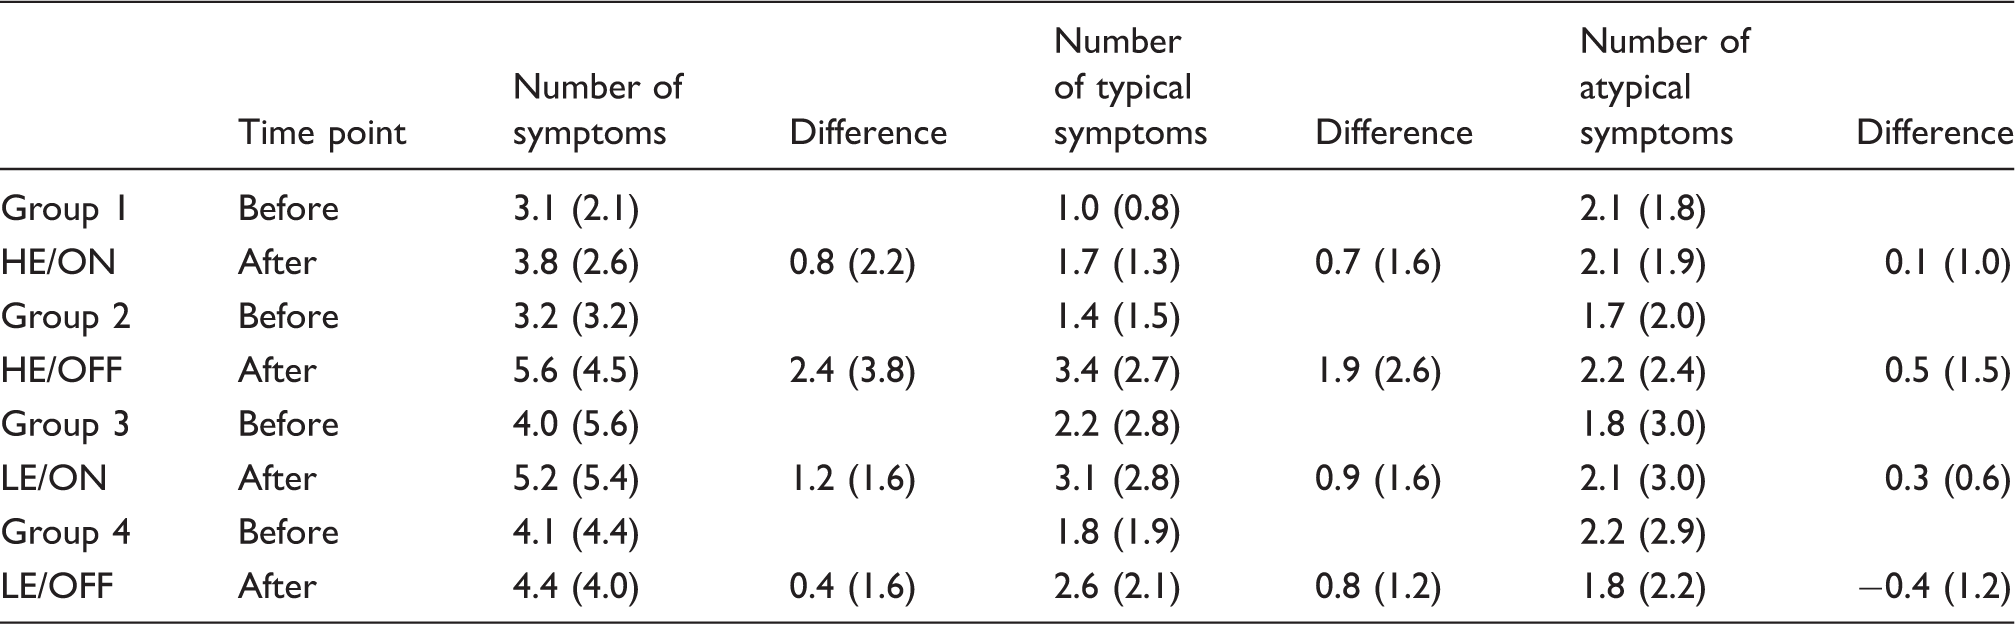
A similar conclusion was obtained for the mean intensity of symptoms present both before and after the experiment per group which is shown in Table 3. The intensity is the sum total of all the symptom ratings, for instance, if a participant rated headache as 2, and tiredness as 1, whilst all the other symptoms were rated 0, the intensity of symptoms would equal 3. The data from Table 3 was then used to create the charts in Figures 11–13.
Mean number of atypical symptoms before and after, per group. Mean intensity of symptoms before and after, per group. Mean (SD) of intensity of symptoms, intensity of typical symptoms and intensity of atypical symptoms per group, before and after.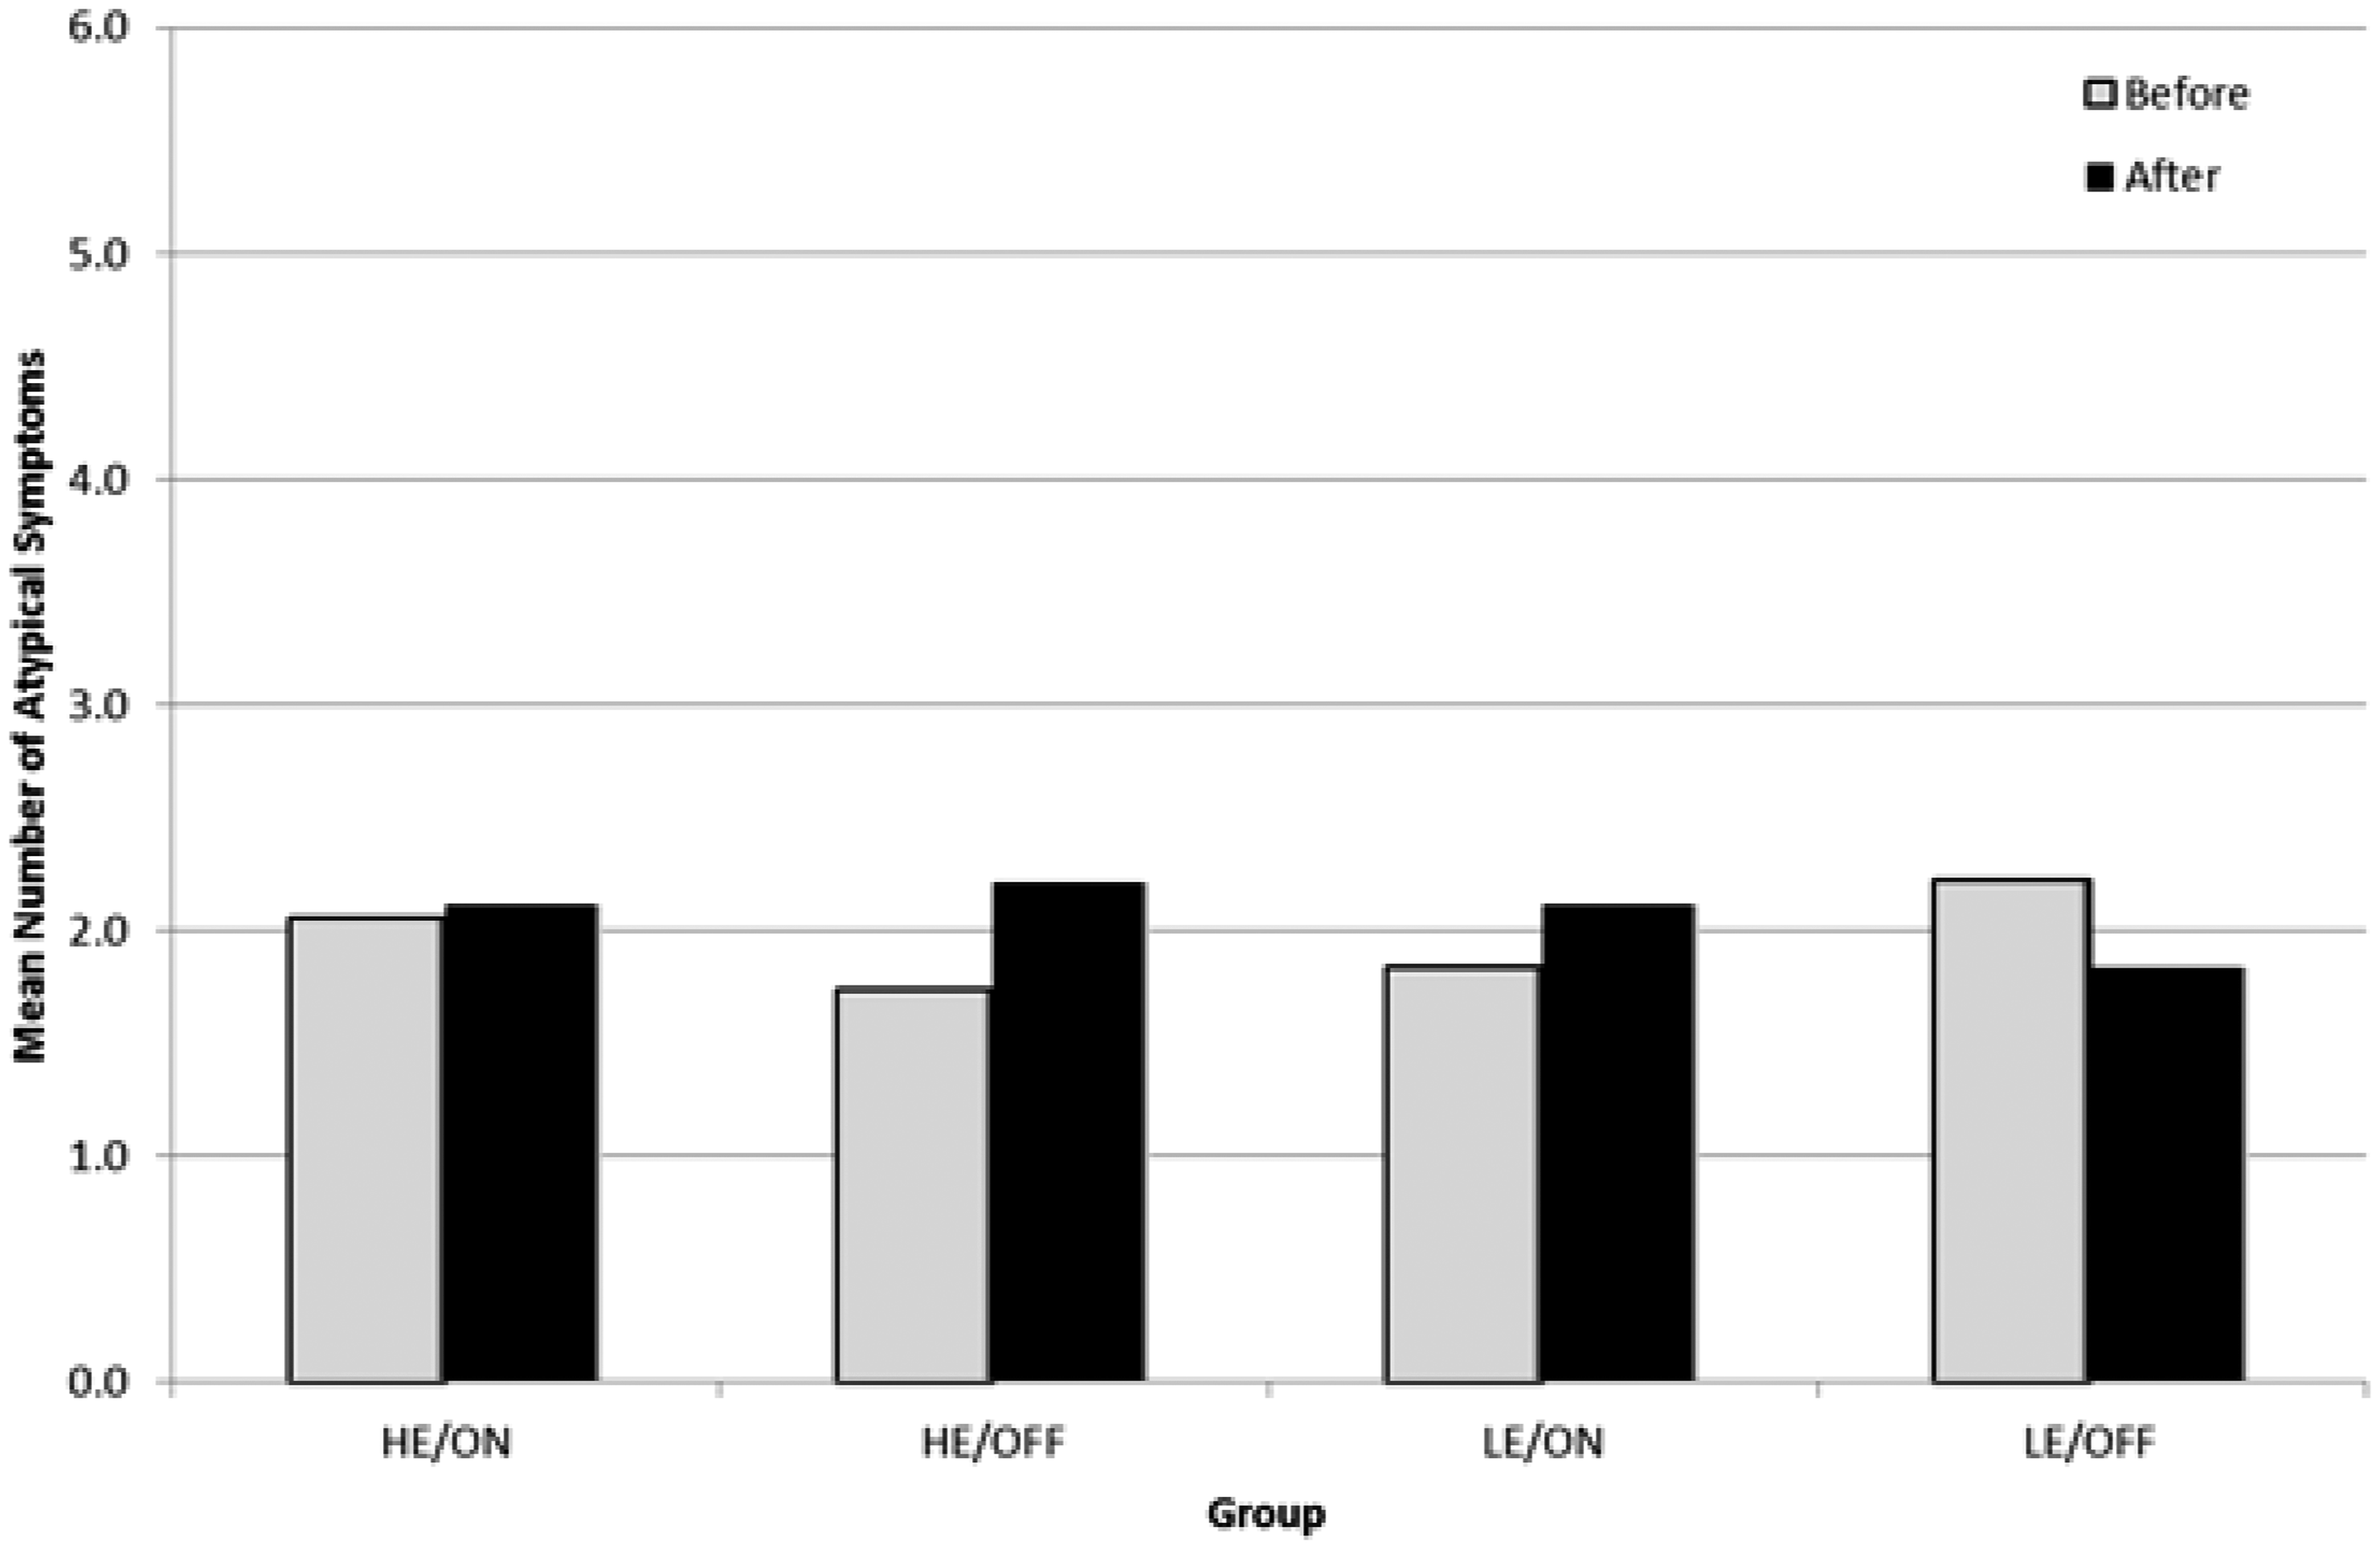
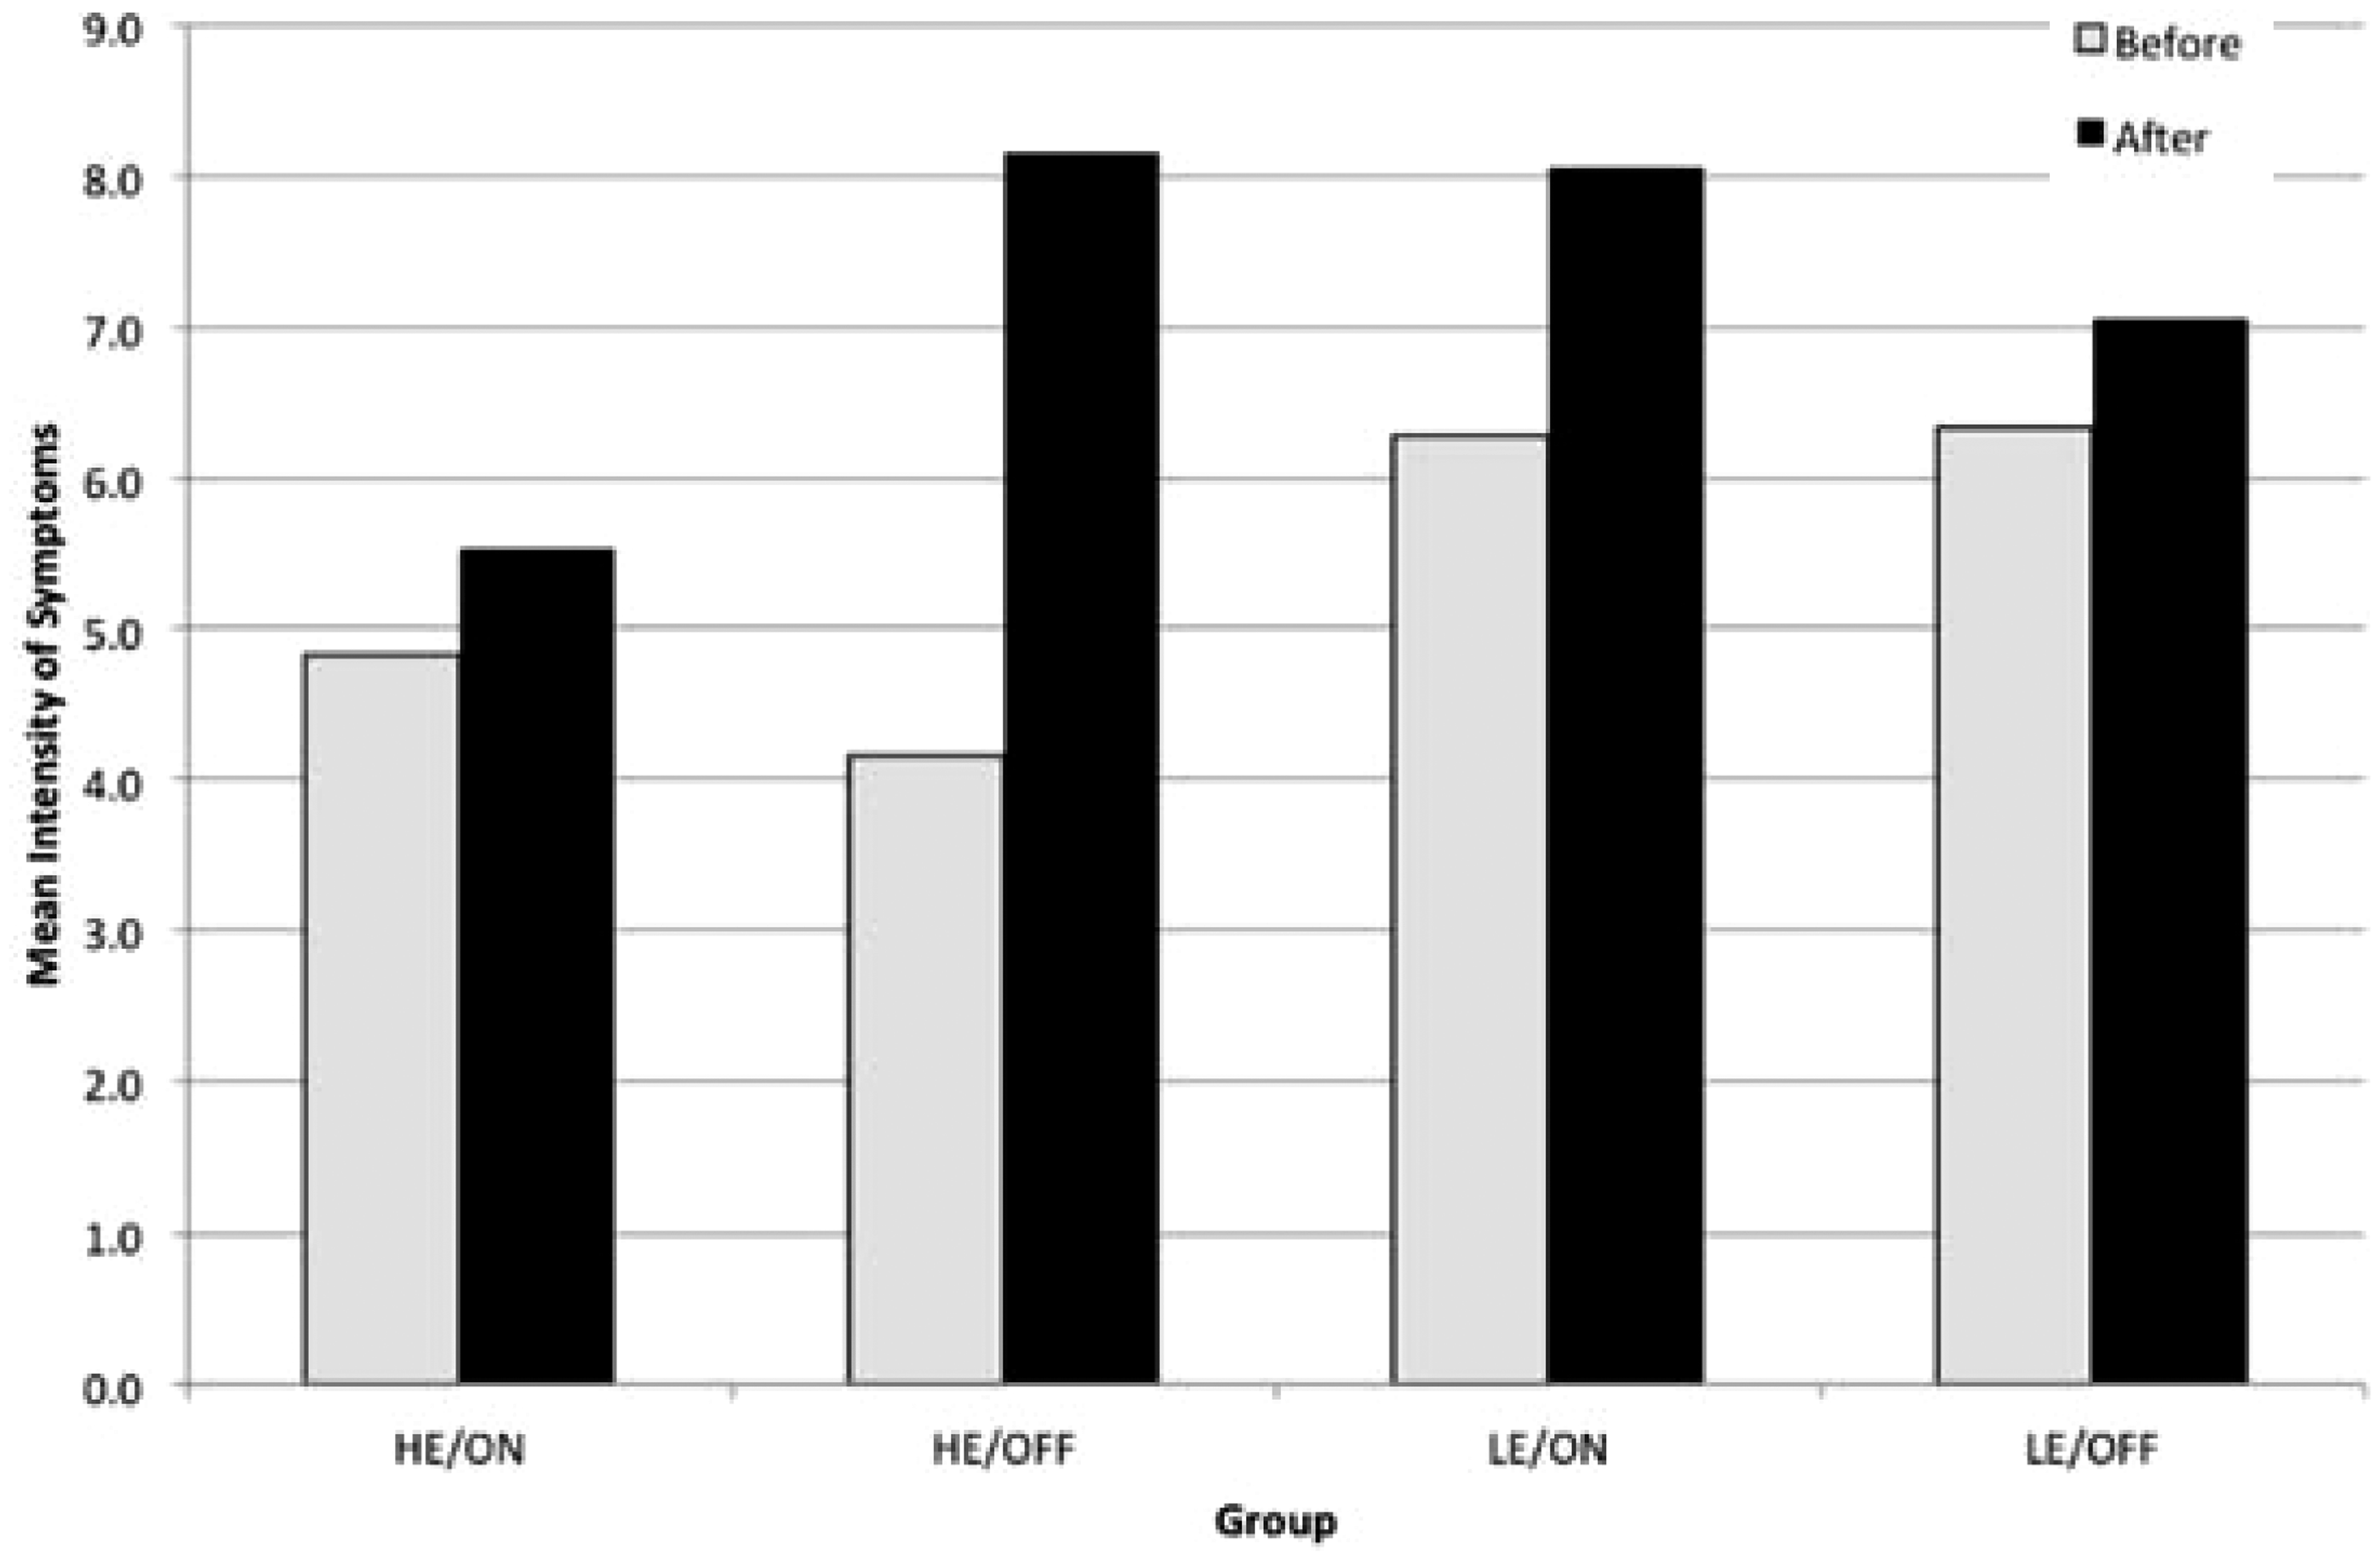
The results from the means are inconclusive. If the infrasound alone had a direct physiological effect it would be expected that HE/ON and LE/ON would show an increase in the number of symptoms after the experiment, whilst there would be little to no difference in the other two groups where there was no infrasound present. Instead, there is an increase generally in the number of symptoms for all groups. Conversely, if the infrasound had no direct effect but instead it was the expectation of harm having an effect upon their reactions (i.e. the nocebo effect), it would be expected that HE/ON and HE/OFF would show an increase in the number of symptoms after the experiment whilst there would be little to no difference in the other two groups.
Therefore, a more detailed study of the six results presented above was conducted with ANOVA, ANCOVA and regression analysis utilising the statistical programme IBM SPSS in order to sort out any significant results or trends.
By way of explanation, ANOVA tests to see if there is any difference between groups on some variable, for example, is there a difference in baseline concern between the four groups. ANCOVA tests the effect of an independent variable (such as manipulation or infrasound on/off) in the presence of a covariate (such as age and gender). Regression explores how a dependent variable (such as number or intensity of symptoms) changes when one of a number of the independent variables is altered, but the rest remain fixed. Baseline concern, age, gender, expectancy group and whether the infrasound was present or absent are the independent variables.
There were three statistically significant outcomes for which the p value < 0.05 (see Note 1):
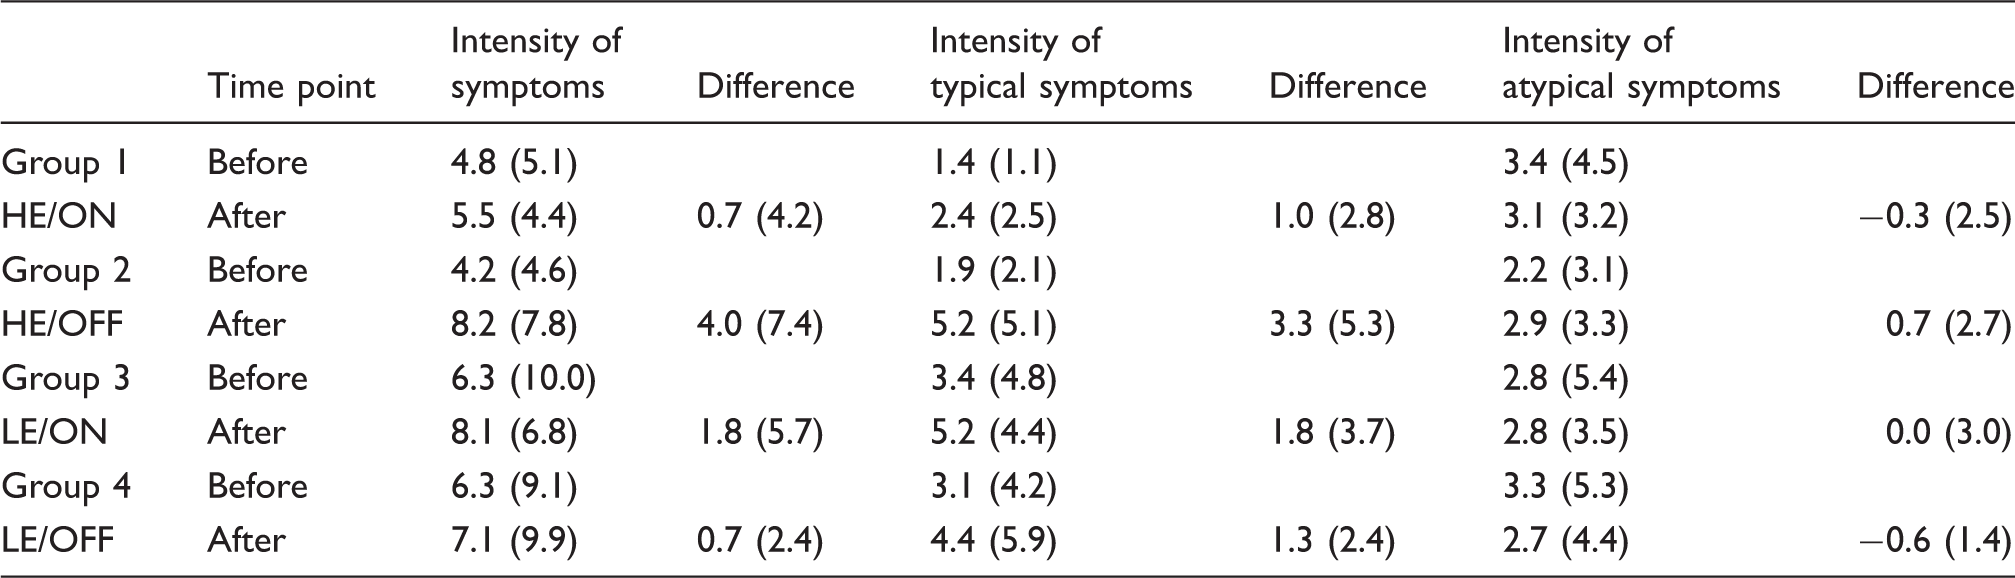
Result 1: For the high expectation groups the presence of infrasound had a negative effect on the number of typical symptoms F(1, 72) = 4.02, p = .049. Result 2: Baseline concern is highly correlated with both the mean number and mean intensity of typical symptoms t(1,67) = 0.005. The baseline concern was checked between the four groups, no group having unusually large amounts of baseline concern and no group reporting any dramatic differences in the number or intensity of symptoms. Result 3: Age correlated with the number of typical symptoms with older participants reporting fewer numbers of symptoms F(1, 72) = 5.29, p = .025.
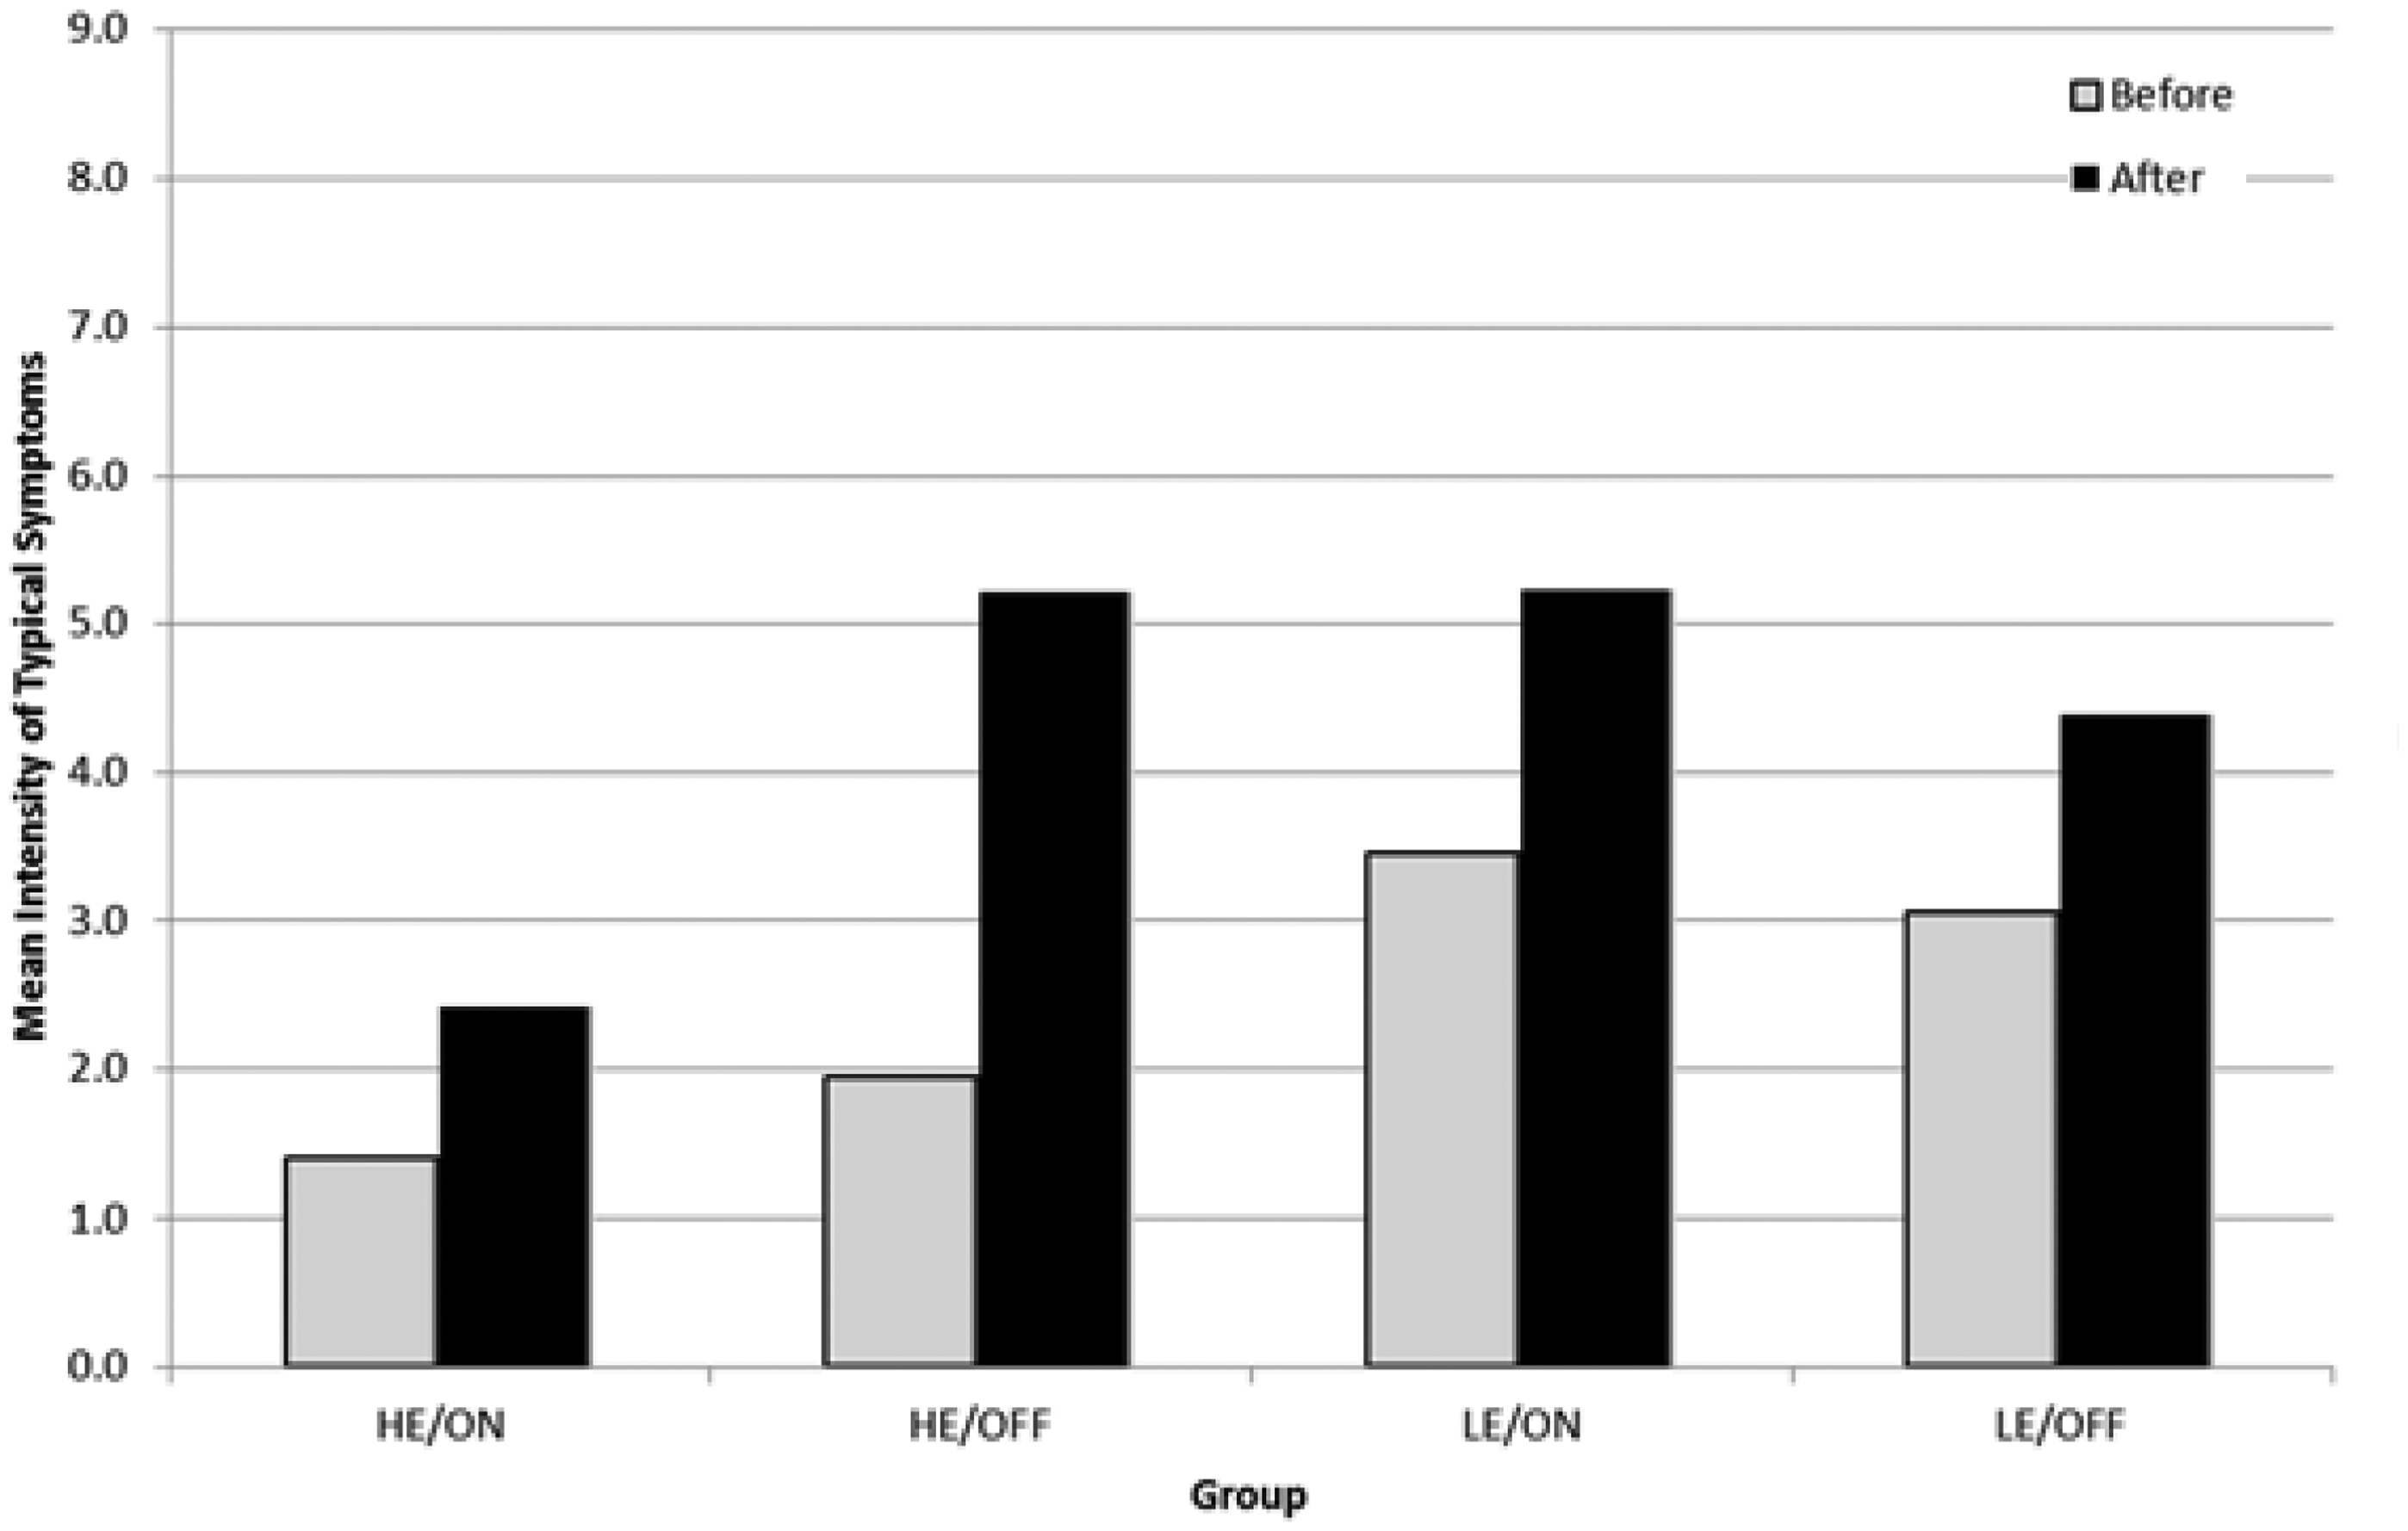
Mean intensity of typical symptoms before and after, per group. Mean intensity of atypical symptoms before and after, per group.
There were three outcomes for which the p value was between 0.05 and 0.1 which is not statistically significant but is indicative of a loose trend only:
Trend 1: expectancy manipulation using the introductory videos resulted in an increase in the difference of concern felt by the HE groups F(1, 64) = 3.11, p = 0.083. Trend 2: the application of infrasound resulted in an increase in the difference of concern that volunteers expressed after the experiment F(1, 64) = 3.41, p = 0.07 even though the infrasound, as previously stated, showed no correlation with the number or intensity of symptoms. This is a curious result but is of modest or low significance and may be an artefact of the experiment or alternatively it may be a consequence of the audibility of the infrasound and associated harmonics. However, none of the participants reported being able to hear the infrasound. As discussed further below, this is an area of interest warranting further investigation. Trend 3: Gender is a trend in both typical b = 0.418, t(1,67) = 0.054 and atypical symptoms b = 0.582, t(1,67) = 0.055, females experiencing more symptoms than males.
Discussion
For the high expectations groups the presence of infrasound actually reduced the reported number of typical symptoms (result 1). For the low expectations groups, there was no statistically significant outcome and there was also no statistically significant outcome for the intensity of symptoms for either group. The best that can be concluded from these outcomes is that the presence of infrasound in the experiment did not increase the number or intensity of typical symptoms in any statistically significant manner. This is supportive of the hypothesis that the infrasound has no direct physiological effect on human health, at least for the time of exposure used in this experiment. Were infrasound to have an effect one would expect to see an increase in symptoms when the infrasound was present, but that did not occur.
The baseline concern strongly correlates with the number and intensity of typical symptoms (result 2). It indicates that people’s pre-conceived expectations of harm are far more significant than any other manipulation or variable present in the experiment. Those participants who began the experiment already convinced of the harmfulness of infrasound were much more likely to feel symptoms, whilst those who approached the study with the mind-set that infrasound was harmless probably remained unaffected. This is supportive of the nocebo hypothesis.
The expectancy manipulation using the videos was successful to some extent (Trend 1). But it did not result in a statistically significant outcome and therefore did not appear to cause any dramatic change in the subjects’ viewpoints from their initial position.
A curious outcome is that infrasound was shown to have a trend in elevating the levels of concern felt by participants (Trend 2). This is interesting because it raises the possibility that some participants are somehow able to perceive the sound when it is present. A test of threshold perception of infrasound would be a worthwhile follow up investigation. Although the sound is said to be far below the acoustic threshold of hearing, those perception curves were made using a sinusoidal acoustic signal. A different perception test to establish new perception curves based on the trapezoidal waveform present in this experiment would be a useful contribution to scientific understanding.
Age had a statistically significant impact on the number of typical symptoms with older participants reporting fewer numbers of symptoms (result 3). Perhaps this is due to hearing deteriorating with age, but as infrasound itself does not have a statistically significant effect, this seems unlikely.
In respect of gender, females reported more symptoms than males (trend 3). This is also difficult to interpret. Perhaps some of the atypical symptoms, such as stomach-ache, are more common to females than to males. However, the result should be treated as inconclusive due to the high proportion of males used in the experiment.
The data from this study is supportive of the conclusion in Crichton et al. 15 that infrasound has no physiological effect, at least for the time of exposure used in this experiment, contrary to the claims of Ambrose and Rand 21 and also supports the nocebo hypothesis.
Conclusions
The effect of wind turbine infrasound on reported human symptoms is addressed in this study. The two main hypotheses are a) that infrasound has a direct physiological effect or b) the effect is psychogenic in nature otherwise known as a nocebo effect. Whilst it is noted that this experiment is of short-term duration exposure, there are claims that even short-term exposure to infrasound (within 20 min) can cause symptoms.
The experimental procedure was designed to replicate Crichton et al. 15 with an important difference being the method of generation of infrasound at an appropriate noise level. The final experiment was a double blind study of 72 volunteers, wherein their expectations of harmful health effects from infrasound were influenced into either a state of HE, or LE. Participants were subjected to either the real infrasound generated by the sound apparatus, or to no sound at all, in order to establish a control group in the experiment.
It was found that the presence of infrasound in the experiment did not increase the number or intensity of typical symptoms in any statistically significant manner. This is supportive of the hypothesis that the infrasound has no direct physiological effect on human health, at least for the time of exposure used in this experiment. Were infrasound to have an effect one would expect to see an increase in symptoms when the infrasound was present, but that did not occur.
Whilst the expectancy manipulation was found to have shown a loose trend in influencing the typical symptoms associated with wind turbine infrasound health complaints indicating that the manipulation was working to a degree, it was the level of concern that a volunteer felt prior to the beginning of the experiment instead that had a statistically significant effect on the reported typical symptoms associated with wind turbine infrasound.
It is concluded that volunteers who came into the experiment with pre-conceived notions of infrasound being harmful generally reported more symptoms than volunteers who began the experiment more sceptical about the potential health impacts of infrasound. These results support the hypothesis that a nocebo effect and not a direct physiological effect may be the cause of reported symptoms, at least for the time of exposure used in this experiment.
Footnotes
Declaration of conflicting interests
The author(s) declared no potential conflicts of interest with respect to the research, authorship, and/or publication of this article.
Funding
The author(s) received no financial support for the research, authorship, and/or publication of this article.