
Abstract
The use of airborne infrasound and other stimuli to elicit (cervical) vestibular-evoked myogenic potentials (cVEMPs) was studied to address the common proposition that infrasound may efficiently stimulate the vestibular system, an effect which may underlie the so-called wind-turbine syndrome. cVEMPs were measured for both ears of 15 normal-hearing subjects using three types of airborne sound stimulation: (1) 500-Hz tone bursts (transient); (2) 500-Hz sinusoidally amplitude-modulated tones at a 40-Hz rate (SAM); and (3) low-frequency and infrasound pure tones (LF/IS). The two former stimulation types served as control and allowed a systematic comparison with (3). It was found that SAM stimulation is effective and appears to be comparable to transient stimulation, as was previously observed in a yet small number of studies. Although the vestibular system is reported to be highly sensitive to low-frequency mechanical vibration, airborne LF/IS stimulation at ∼80–90-phon loudness levels did not elicit significant saccular vestibular responses.
Keywords
Introduction
Airborne sounds can elicit vestibular responses and this phenomenon is used in the clinic to assess the otolith function.1,2 The elicited vestibular-evoked myogenic potentials (VEMPs 3 ) are usually recorded using a tone-burst “transient” acoustic stimulus with a repetition rate of 3 to 6 Hz and a frequency in the range 500–4000 Hz. VEMPs are measured from the sternocleidomastoid (SCM) cervical muscle or from the extraorbital ocular muscle, which are respectively called cVEMPs and oVEMPs. Previous research has related cVEMPs with excitation of the saccule 4 and oVEMPs with excitation of the utricle. 5
To elicit VEMPs, relatively high stimulus levels are required (90–100 dB HL), with peak sound pressure levels (pSPL) that can easily exceed 120 dB pSPL. As stimulation frequencies are within the most sensitive frequency region of hearing, the clinical VEMP measurement has raised some concerns regarding patient hearing safety and comfort. For example, temporary reduction in distortion-product-otoacoustic-emission (DPOAE) levels has been found after VEMP measurements for acoustic stimulation with peak levels close to 130 dB pSPL.6 Also, sensitive individuals, such as those affected by tinnitus or hyperacusis, can experience high levels of discomfort. Because of this, recent studies have tested alternative types of stimuli, such as low-frequency tone bursts 7 and continuous tonal stimulation with sinusoidal amplitude modulation (SAM) at low rates.8,9 In this work, infrasound (f < 20 Hz) was tested as an additional alternative, because vestibular receptor cells 10 and the entire vestibular system11,12 are most responsive to mechanical vibration at very low frequencies. Also, as the transport of acoustic energy from the oval window to the otolith hair cells is impeded by fluid inertia, an effect that declines towards lower frequencies with 6 dB/octave, it might be expected that more acoustic energy reaches the otoliths at low frequencies.
Testing of vestibular sensitivity to low-frequency and infrasound is also motivated by the common proposition that these sounds can produce dizziness, loss of balance and nystagmus.13–16 Although such connection has generally not been backed by objective evidence,17–19 in principle, such effects could indeed occur due to direct stimulation of the vestibular system.
The mechanical sensitivity of vestibular sensory cells to low frequencies is, however, counteracted by the fact that the transfer of sound pressure from the ear canal into the scala vestibuli decreases at a rate of 6 dB/octave below about 1000 Hz, due to the increasing stiffness impedance of the middle ear.20–23 Although this transfer function roughly flattens out below ∼100 Hz down to the infrasound frequency range, sound pressures are expected to be ∼20 dB lower than 1000-Hz levels in this range. 23 Nevertheless, recent estimates from an otolith model 24 have suggested that infrasound (0.7–7 Hz) may induce sufficient otolith acceleration to produce the motion-sickness-like symptoms frequently reported by people living near wind turbines.16,17,19 In addition, animal data suggest that infrasound can produce large endolymphatic potentials. 25 Since the inner ear is an enclosed electrical volume that comprises both, balance and hearing organs, excitatory effects of the cochlear potentials on the vestibular system cannot be ruled out and requires testing in a controlled laboratory setting.
Unfortunately, literature is scarce regarding physiological evidence of vestibular sensitivity to airborne low-frequency and infrasound in humans. To our knowledge, only the preliminary study of Lücke and colleages 7 has directly measured the ability of short low-frequency tone bursts (40–120 Hz) to elicit transient VEMPs. They concluded that the transfer characteristics of the middle-ear dominate the VEMP thresholds (for both oVEMPs and cVEMPs) and found no evidence of increased sensitivity of the otolith organs to airborne low-frequency sound. However, their stimuli were short tone bursts, consisting of only a single cycle (Hanning-windowed), and they did not evaluate the infrasound range. Thus, the ability of airborne infrasound to elicit VEMPs has yet to be tested, and we attempted this for cVEMPs using continuous tones. Two previous studies8,9 showed that vestibular responses can be elicited with continuous acoustic stimulation. They utilized SAM of mid-frequency carriers (250–1000 Hz) with infrasonic and low-frequency modulation rates (5–120 Hz). Their result demonstrated that such continuous stimuli can elicit a vestibular envelope-following response (EFR). The largest responses were elicited with carriers near 500 Hz and modulation rates close to 40 Hz.
In order to validate our method and obtain data for multi-method comparisons, we systematically went from the clinical test using a transient tone burst, to EFRs in response to a 40-Hz-SAM stimulus, to the frequency-following responses (FFRs) to pure tones with decreasing frequencies, arriving at a 4-Hz infrasound stimulation. Altogether, cVEMP responses to stimulation of 30 ears were recorded using these three types of stimuli.
Methods
Stimuli
This study was conducted with the approval of the UCL Research Ethics Committee (Project ID 0565/004). Stimuli were generated using a custom-written MATLAB program (MathWorks, Inc., Natick, MA) with 48 kHz sampling rate.
Transient cVEMPs
In order to assess normal vestibular function, the clinically used transient stimulus was applied. 3 This also served as a baseline for the comparison with the two other stimulation types. The transient stimulus was a 500-Hz tone-burst sequence, with a repetition rate of 5 Hz. The pulse duration of each tone burst was 6 ms, including rise-fall linear ramps of 2 ms. The total stimulation was for 120 s and had a peak level of 119 dB pSPL.
SAM cVEMPs
The SAM stimulus consisted of a 500-Hz tone carrier, modulated at a rate of 40 Hz. The modulation depth was 100%. These stimulus parameters were chosen since they have led to optimal results in previous studies.8,9 The continuous stimulation lasted for 120 s, started and ended with an envelope minimum, and had a peak level of 116.5 dB pSPL (equivalent to an RMS level of 105.5 dBA). This EFR measurement validated that our spectral-analysis method of continuous stimulation was functional.
LF/IS cVEMPs
Pure tones of 40, 16, and 4 Hz were tested; their levels were set to 112.5, 121 and 132 dB SPL, respectively. These levels were chosen, as they are well above those associated with environmental infrasound,26,27 and were inspired by the proposed curves by Møller and Pedersen 28 (which were interpolated/extrapolated). The LF/IS pure-tone levels are estimated to fall roughly between an 80- to 90-phon loudness level. Stimulus duration was 120 s. Due to the cyclic stimulus generation by the software, no onset and offset ramps could be applied. However, all pure tones started and ended at a zero crossing to minimise audible on and offset effects, which were further reduced by the hardware due its low-pass filter characteristic.
The three different stimuli applied in this work are illustrated in Figure 1.
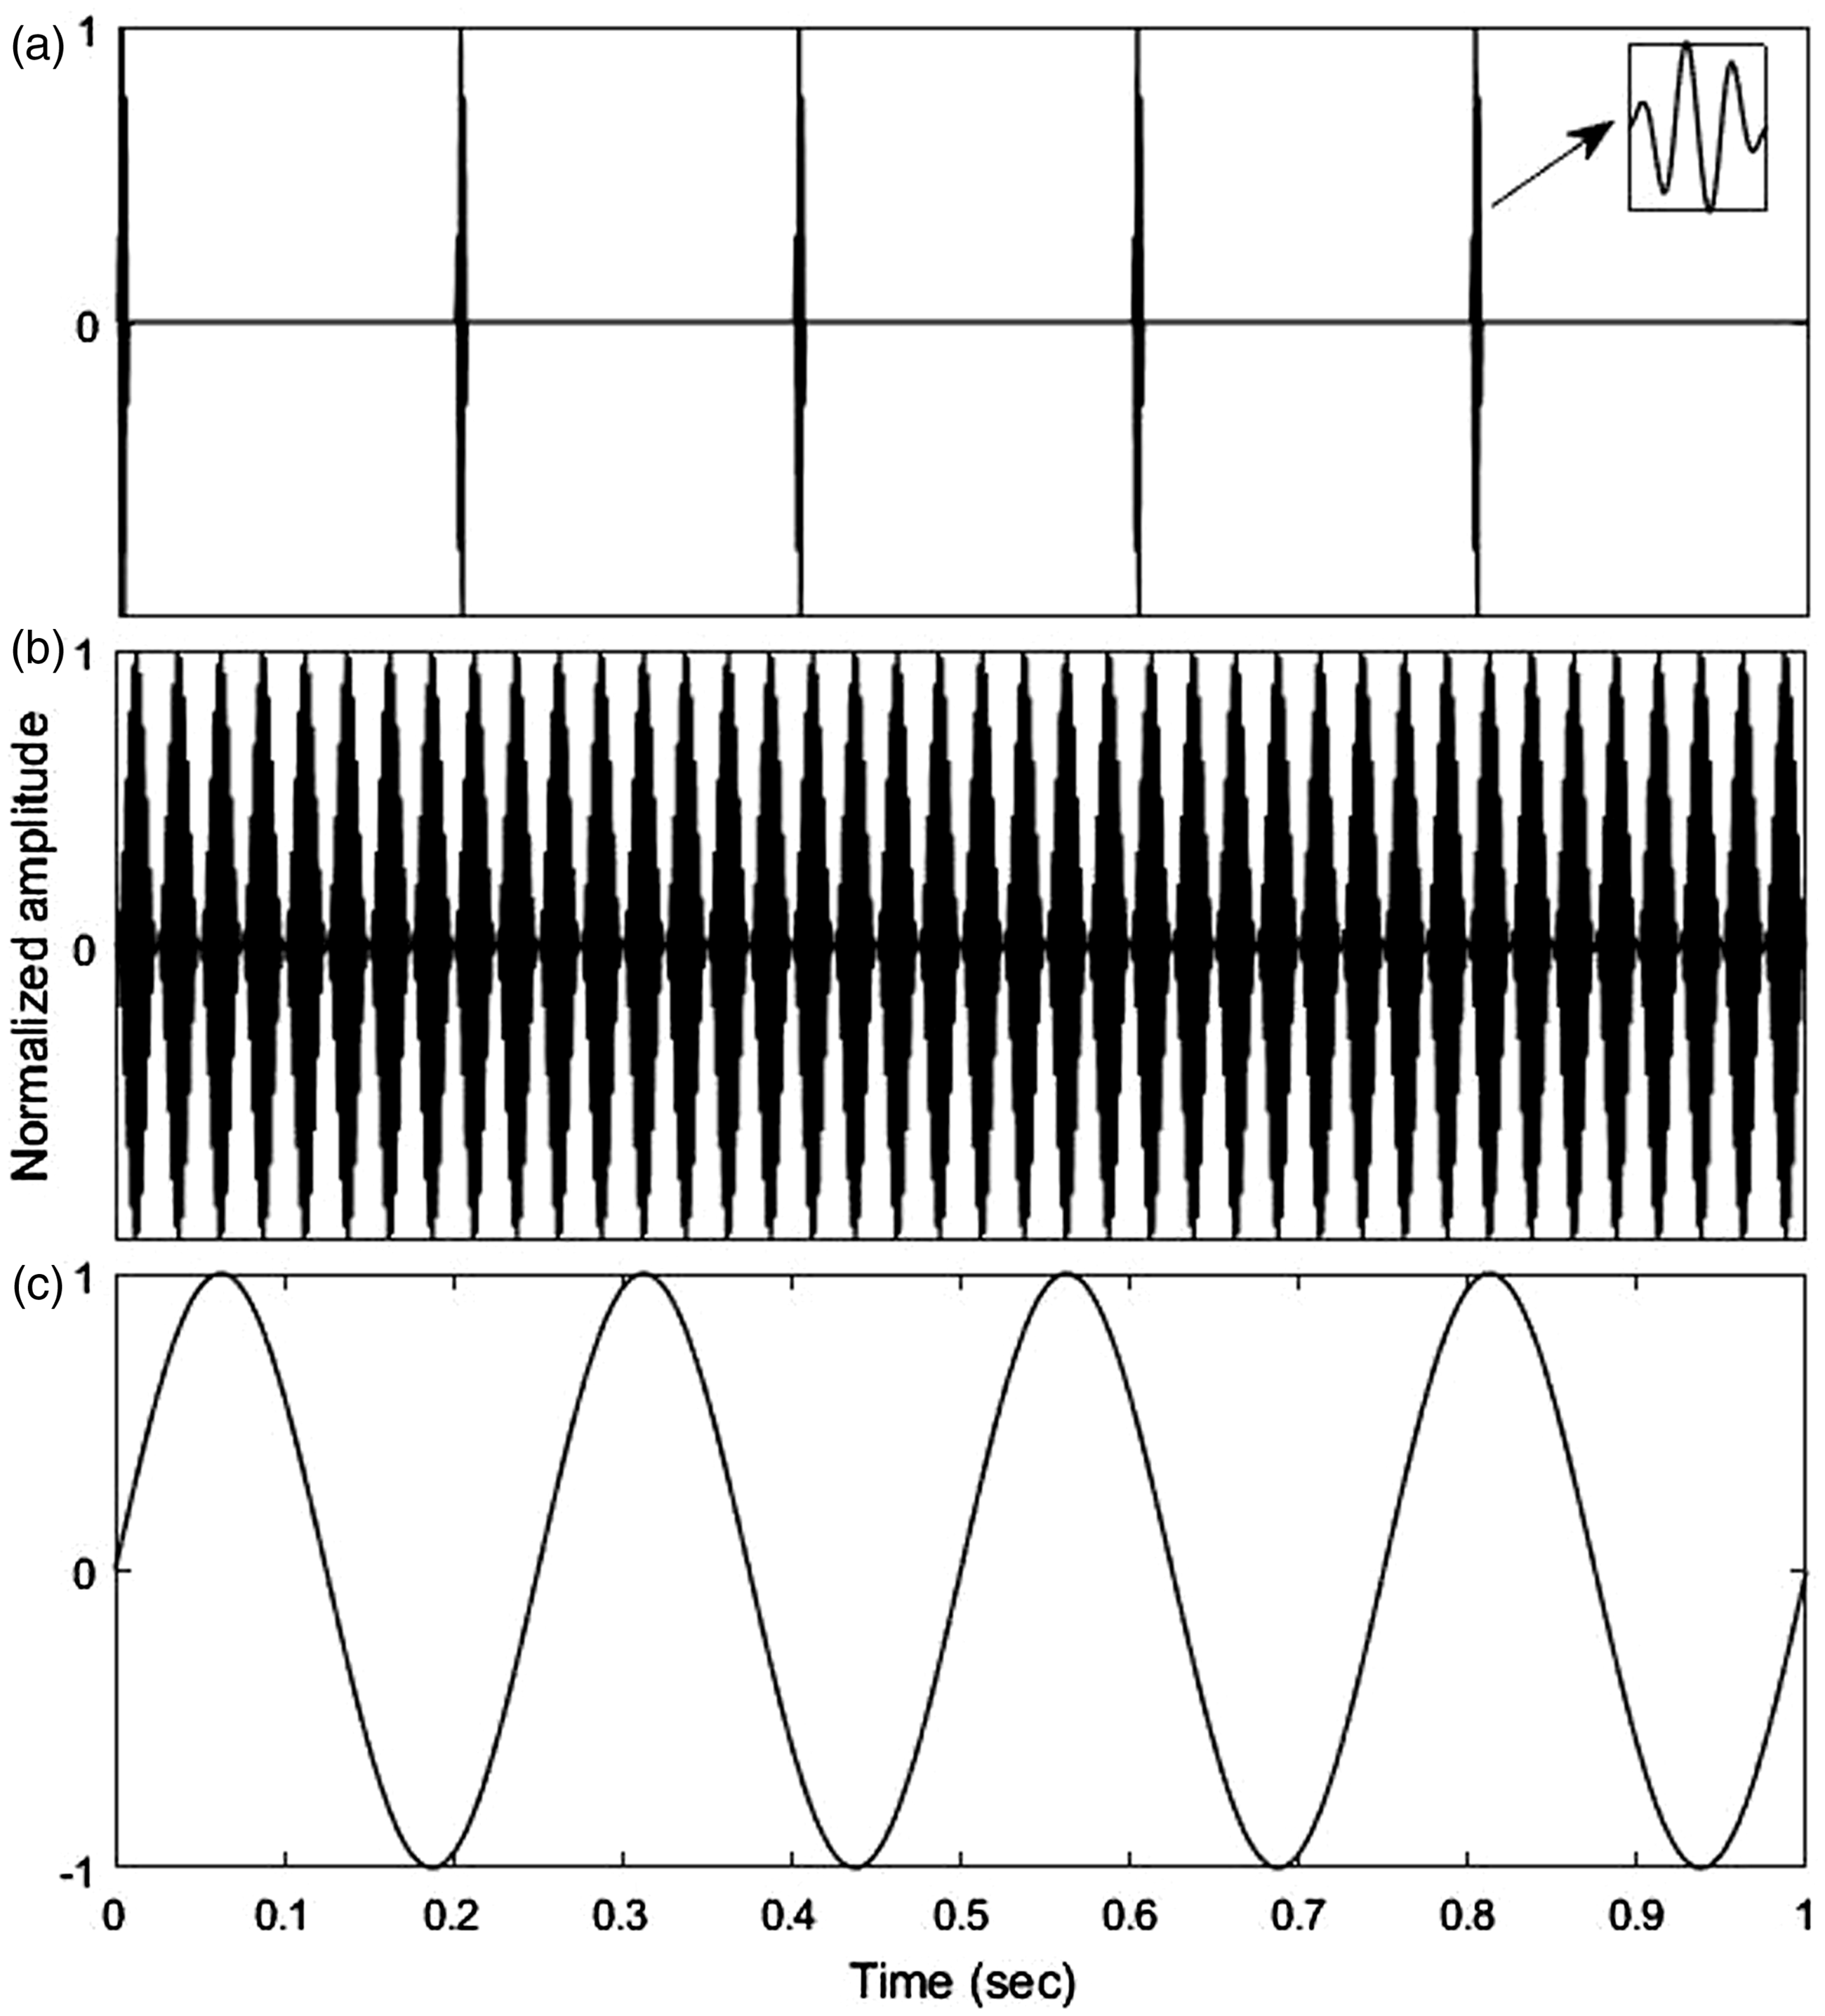
A 1 s long section of each stimuli type used to elicit cVEMPs: (a) Transient stimulus (b) SAM stimulus (c) LF/IS stimulus (example: 4 Hz). For illustration purposes, all amplitudes were normalized.
Subjects and procedure
Fifteen participants, 13 females and 2 males, aged 20–29 (mean = 23.5) participated in the experiment. Subjects had no history of vestibular impairment, nor did they report tinnitus or hyperacusis. Participants were screened for normal hearing (125–8000 Hz, HL < 20 dB) using pure tone audiometry 29 and for normal middle ear function (middle-ear pressure between −50 to +50 daPa) using tympanometry. 30 Subjects were instructed to turn their heads towards the opposite side being stimulated and orient their chin slightly down, looking over their shoulder and so applying tension to the ipsilateral SCM as much comfortably as possible. The tension was audited via palpation by the experimenter. Both of the subjects’ ears were measured independently (total N = 30). Presentation order of the stimuli was Transient, SAM, and LF/IS. In each case, measurements started with the right ear and after completing the left ear, the next stimulation type was measured. The order of LF/IS frequencies tested (40, 16, 4 Hz) was reversed when switching ears. After each single 2 min long recording, subjects were given at least 2 min to relax and gather strength. If the subject required more time to rest, more than 2 min were given before the next recording. The latter started after participants stated they were ready. Overall, five 2-min long recordings were made for each ear, resulting in a total exposure of 10 min per ear.
Since pilot recordings did not show significant oVEMP responses to continuous SAM stimulation, this study focused on collecting cVEMPs.
Acoustic sound generation and calibration
Transient and SAM cVEMP stimuli were delivered monaurally via supra-aural TDH-50p earphones (Telephonics Corp., Farmingdale, NY), directly driven by the headphone output of a 24-bit RME Fireface UC audio interface (Audio AG, Haimhausen, Germany). LF/IS cVEMPs were generated by a custom-made sound source designed for the controlled playback of acoustic infrasound and low-frequency. The source consisted of a subwoofer loudspeaker chassis (15P80Nd, Beyma, Valencia, Spain) that was placed inside a hermetically sealed wooden box. The latter is acoustically connected to the subject via a long polyethylene tube (length: 8 m, inner diameter: 14 mm), itself connected to a narrower silicon tube (length: 0.38 m, inner diameter: 2.5 mm), which fitted tightly to the connecting tube of an Etymotic ER1-14A earplug (Etymotic Research, Elk Grove Village, IL), plugged to the subject’s ear canal. Sealed sources of this kind allow the monaural playback of intense low frequency and infrasound stimuli with higher harmonics well below the level of the fundamental 31 (>30 dB below for all LF/IS stimuli used here). The line output of the RME audio interface was low-pass filtered (6 dB/octave, passive, fc = 10 Hz) before power amplification (BEAK Type BAA 120, Frankenblick, Germany). This filter, together with the acoustic low-pass filtering effect of the 8-m polyethylene tube and appropriate electric attenuation, made sure that at maximum electric output of the audio interface, the sound pressure in the ear canal could not exceed 105 phon at any frequency (based on extrapolation of standardized ELCs 32 and ELCs proposed for infrasound 28 ), thus, ensuring the participants’ safety.
All sound levels were confirmed using Brüel & Kjær equipment (Brüel & Kjær Sound & Vibration Measurement A/S, Nærum. Denmark), calibrated with a B&K 4231 sound calibrator. The supra-aural TDH-50p earphones were attached to a B&K 4153 artificial ear, connected to a B&K 2636 measurement amplifier, which could be switched between RMS and peak mode, while it also allowed to apply A-weighting (the latter was only used to report the SAM stimulus level also in dBA). LF/IS stimuli were calibrated in a 1.3-ccm cavity with a ½ inch B&K 4165 microphone (±2 dB down to 2.6 Hz), connected to the B&K 2636 measurement amplifier.
Electromyogenic recordings
The electromyogenic (EMG) recordings were made with a BioSemi ActiveTwo System (Biosemi B.V., Amsterdam, Netherlands). Inside the Biosemi AD-box, the analog input signals are transformed into 24-bit digital words, with a fixed amplifier gain of 31.25 nV/bit, and an input voltage range limited to −262 mV to +262 mV. The output digital data are sent via an optical cable to the USB2 receiver box of the system, which is connected to a PC for data visualisation and storage. The ActiView software (provided by Biosemi) was used to control the recording and monitor the electrode signals. The stimulus-synchronised trigger signal, sent every 1 s on an audio channel of the RME audio device, was recorded via the trigger inputs of the Biosemi system.
The same electrode configuration was used for all three types of measurements: Three flat active electrodes were used, together with the flat Common Mode Sense (CMS) and Driven Right Leg (DRL) ground electrodes, which are particular to the Biosemi system. One electrode was placed on the ipsilateral SCM muscle (upper 1/3rd), while the reference electrode was placed on the sternum. The CMS and DRL ground electrodes were placed slightly apart, on the forehead.
Electrode impedance was monitored by displaying the running average of the voltage difference between the CMS electrode and each active electrode, called electrode offset in the ActiView software. This was kept within the limits of ± 40 mV recommended by Biosemi. 33
Data analysis
Analysis of the EMG recordings was done offline making use of the Matlab toolbox “Fieldtrip”. 34 The stored EMG signals were low-pass filtered with a cutoff frequency of 1.5 KHz. To reduce processing time in the analyses described below, signals originally sampled at 16384 Hz were subsequently down-sampled to 4096 Hz. Synchronized by the recorded trigger signal, the recordings of 120 s were split into 120 trials for subsequent averaging. No artefact rejection was applied, as discarding trials based on their RMS amplitude or variance did not markedly affect the outcome. It should be noted that, as both the strength of the VEMP and that of the myogenic noise increase with muscle tension, 35 VEMP amplitude on its own is not a reliable measure of the vestibular signal. It is instead preferable to consider the signal-to-noise ratio (SNR) when estimating the strength and validity of a response. The particular processing for each type of cVEMP measurement is described next.
Transient cVEMPs
The 1-s long trials were further divided into five 200 ms segments, resulting in a total of 600 trials, each containing the response to a single tone burst presentation (presented at a rate of 5 Hz). A bootstrap technique 36 was used to objectively assess the presence or absence of a transient cVEMP response. The parameter used to evaluate significance was an estimate of the SNR, called ±difference. It was obtained from the ratio between the standard deviation (SD) of the sum of two buffers (+) and that of their difference (−), where each buffer consisted of the average of either all even or all odd trials. Based on the comparison with average buffers containing 200-ms segments that are not synchronized to the triggers, the bootstrap method then provided a p-value for the synchronized ±difference, which represents the chance that the observed signal is just random myogenic noise. The window duration was set to 80 ms, a duration that provided the highest number of ears having a significant ±difference (i.e. with the highest SNR estimate across all ears; evaluated in the range 40–200 ms). Significant individual averaged responses were visually inspected for the characteristics of a typical clinical cVEMP response before a reading of the peak-to-peak amplitude was taken. The latter was calculated from the difference between the positive (p) and negative (n) peak values of the cVEMP at their respective time delays and will be referred to as p13-n23 amplitude.
SAM and LF/IS cVEMPs
SAM as well as low-frequency pure-tone stimulation can elicit EFRs/FFRs in the SCM muscle, which is phase-locked to the individual cycles of the modulation/stimulation frequency. The EFR/FFR is visible as a spectral peak in the Fourier transform of the recorded signal. To assess whether the spectral peak was random myogenic noise, or due to synchronized myogenic response to the stimulus, significance was assessed using the Rayleigh test.37,38 This method provides an R-statistic (with values between 0 and 1) and a corresponding p-value (see below) to accept or reject the null hypothesis that trial phases follow a circular uniform distribution. To apply this test, first the recorded signal was cut into n = 120 segments, each 1 s long, and their complex spectra were computed. Then, the phase values of the signal component (θ FFR ) were used to calculate the R-statistic (Fisher, 38 p.31).
Results and discussion
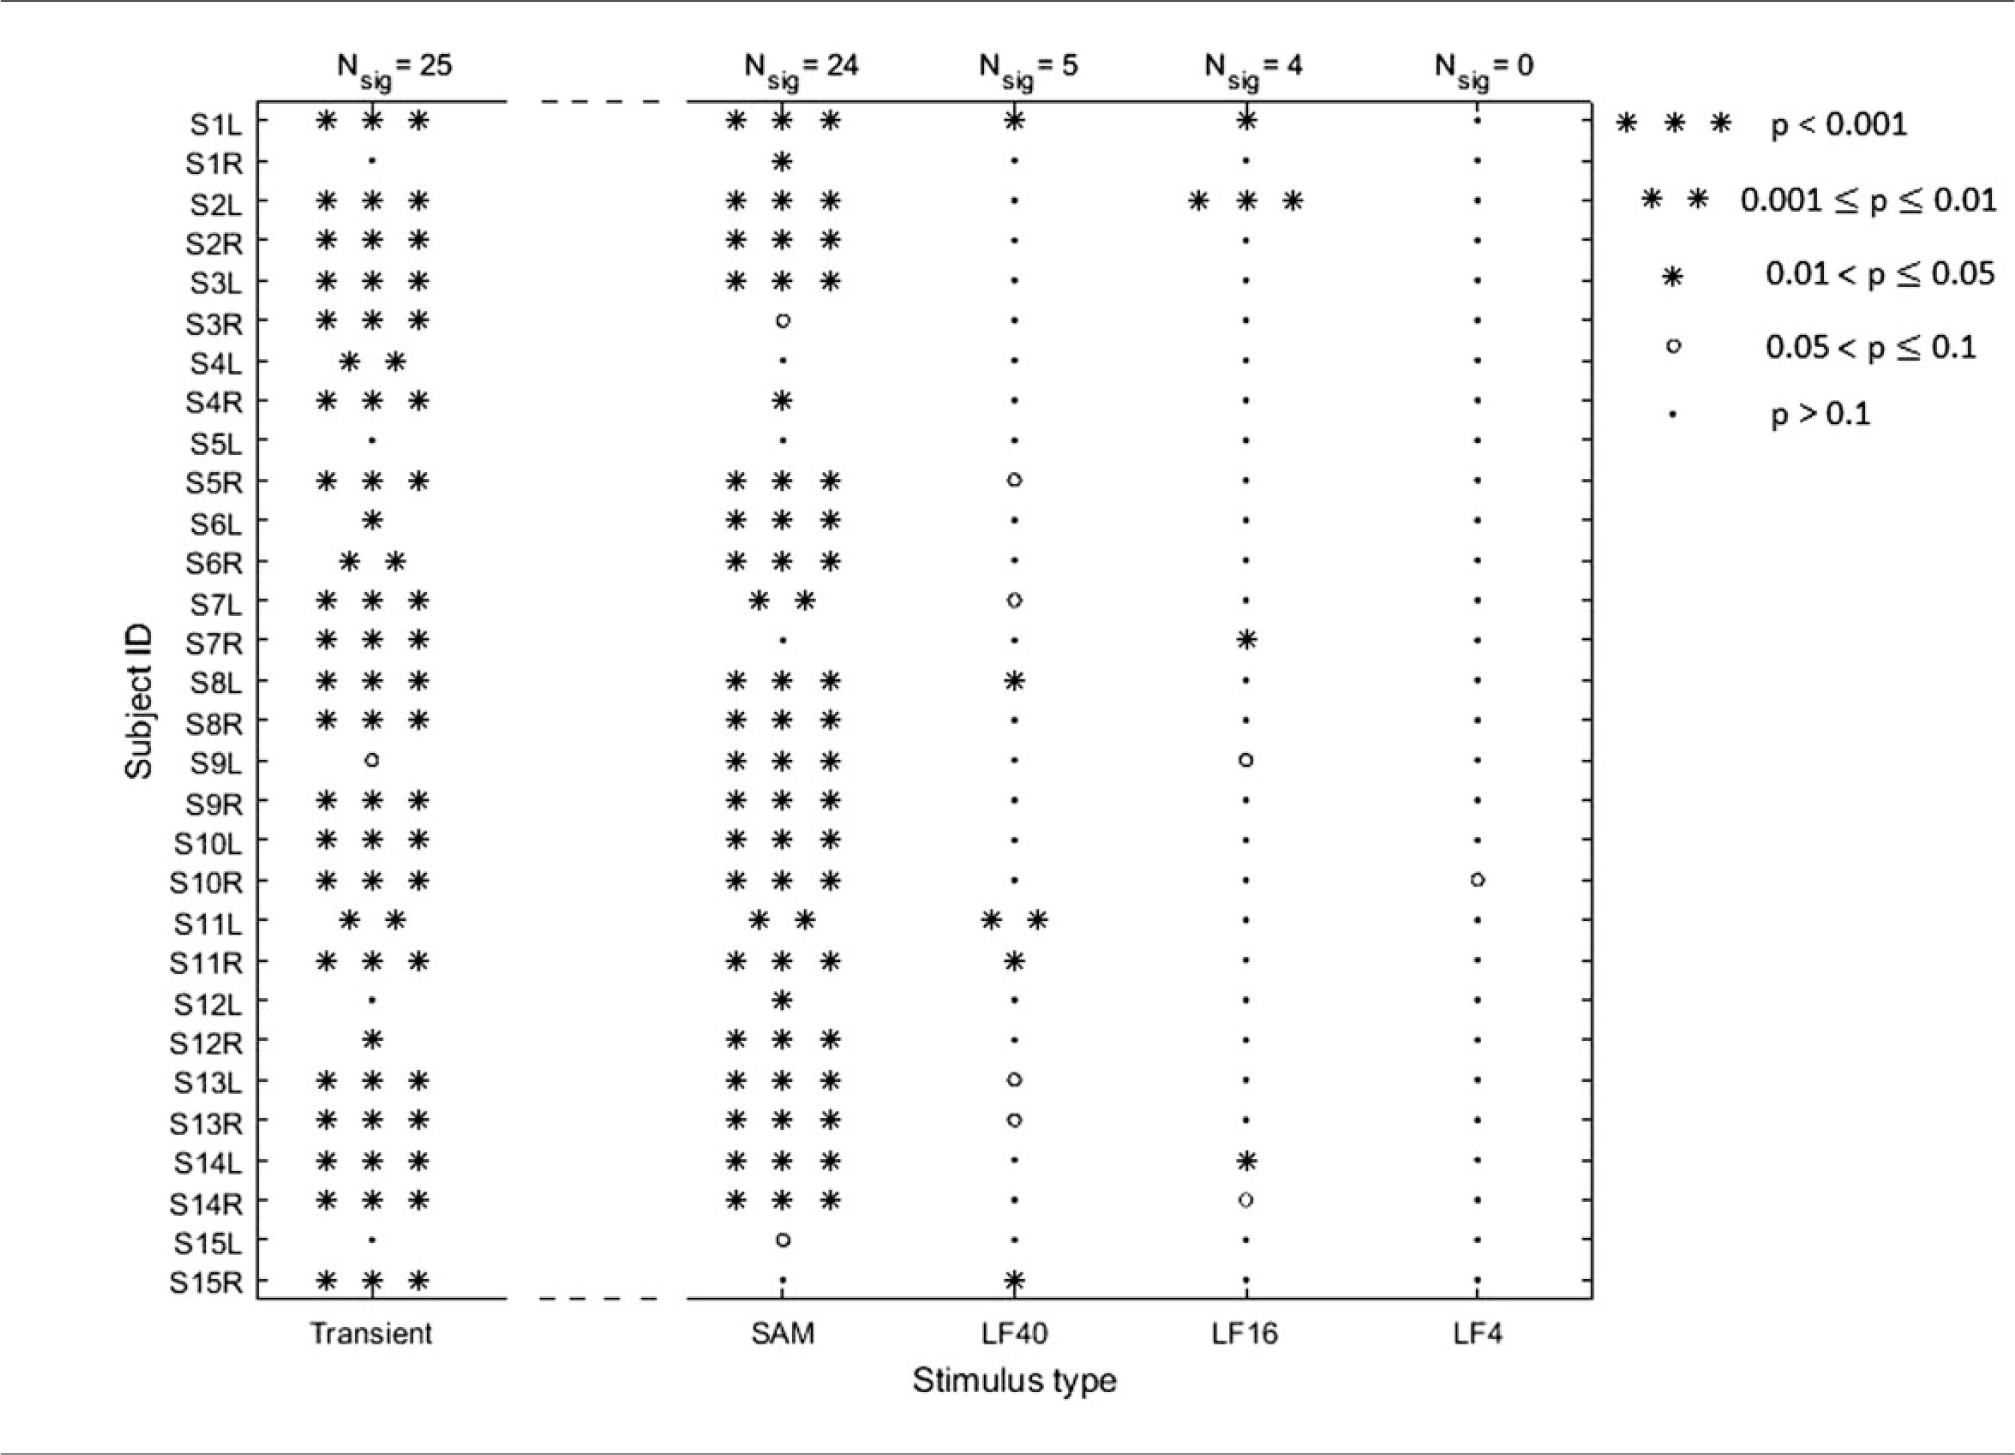
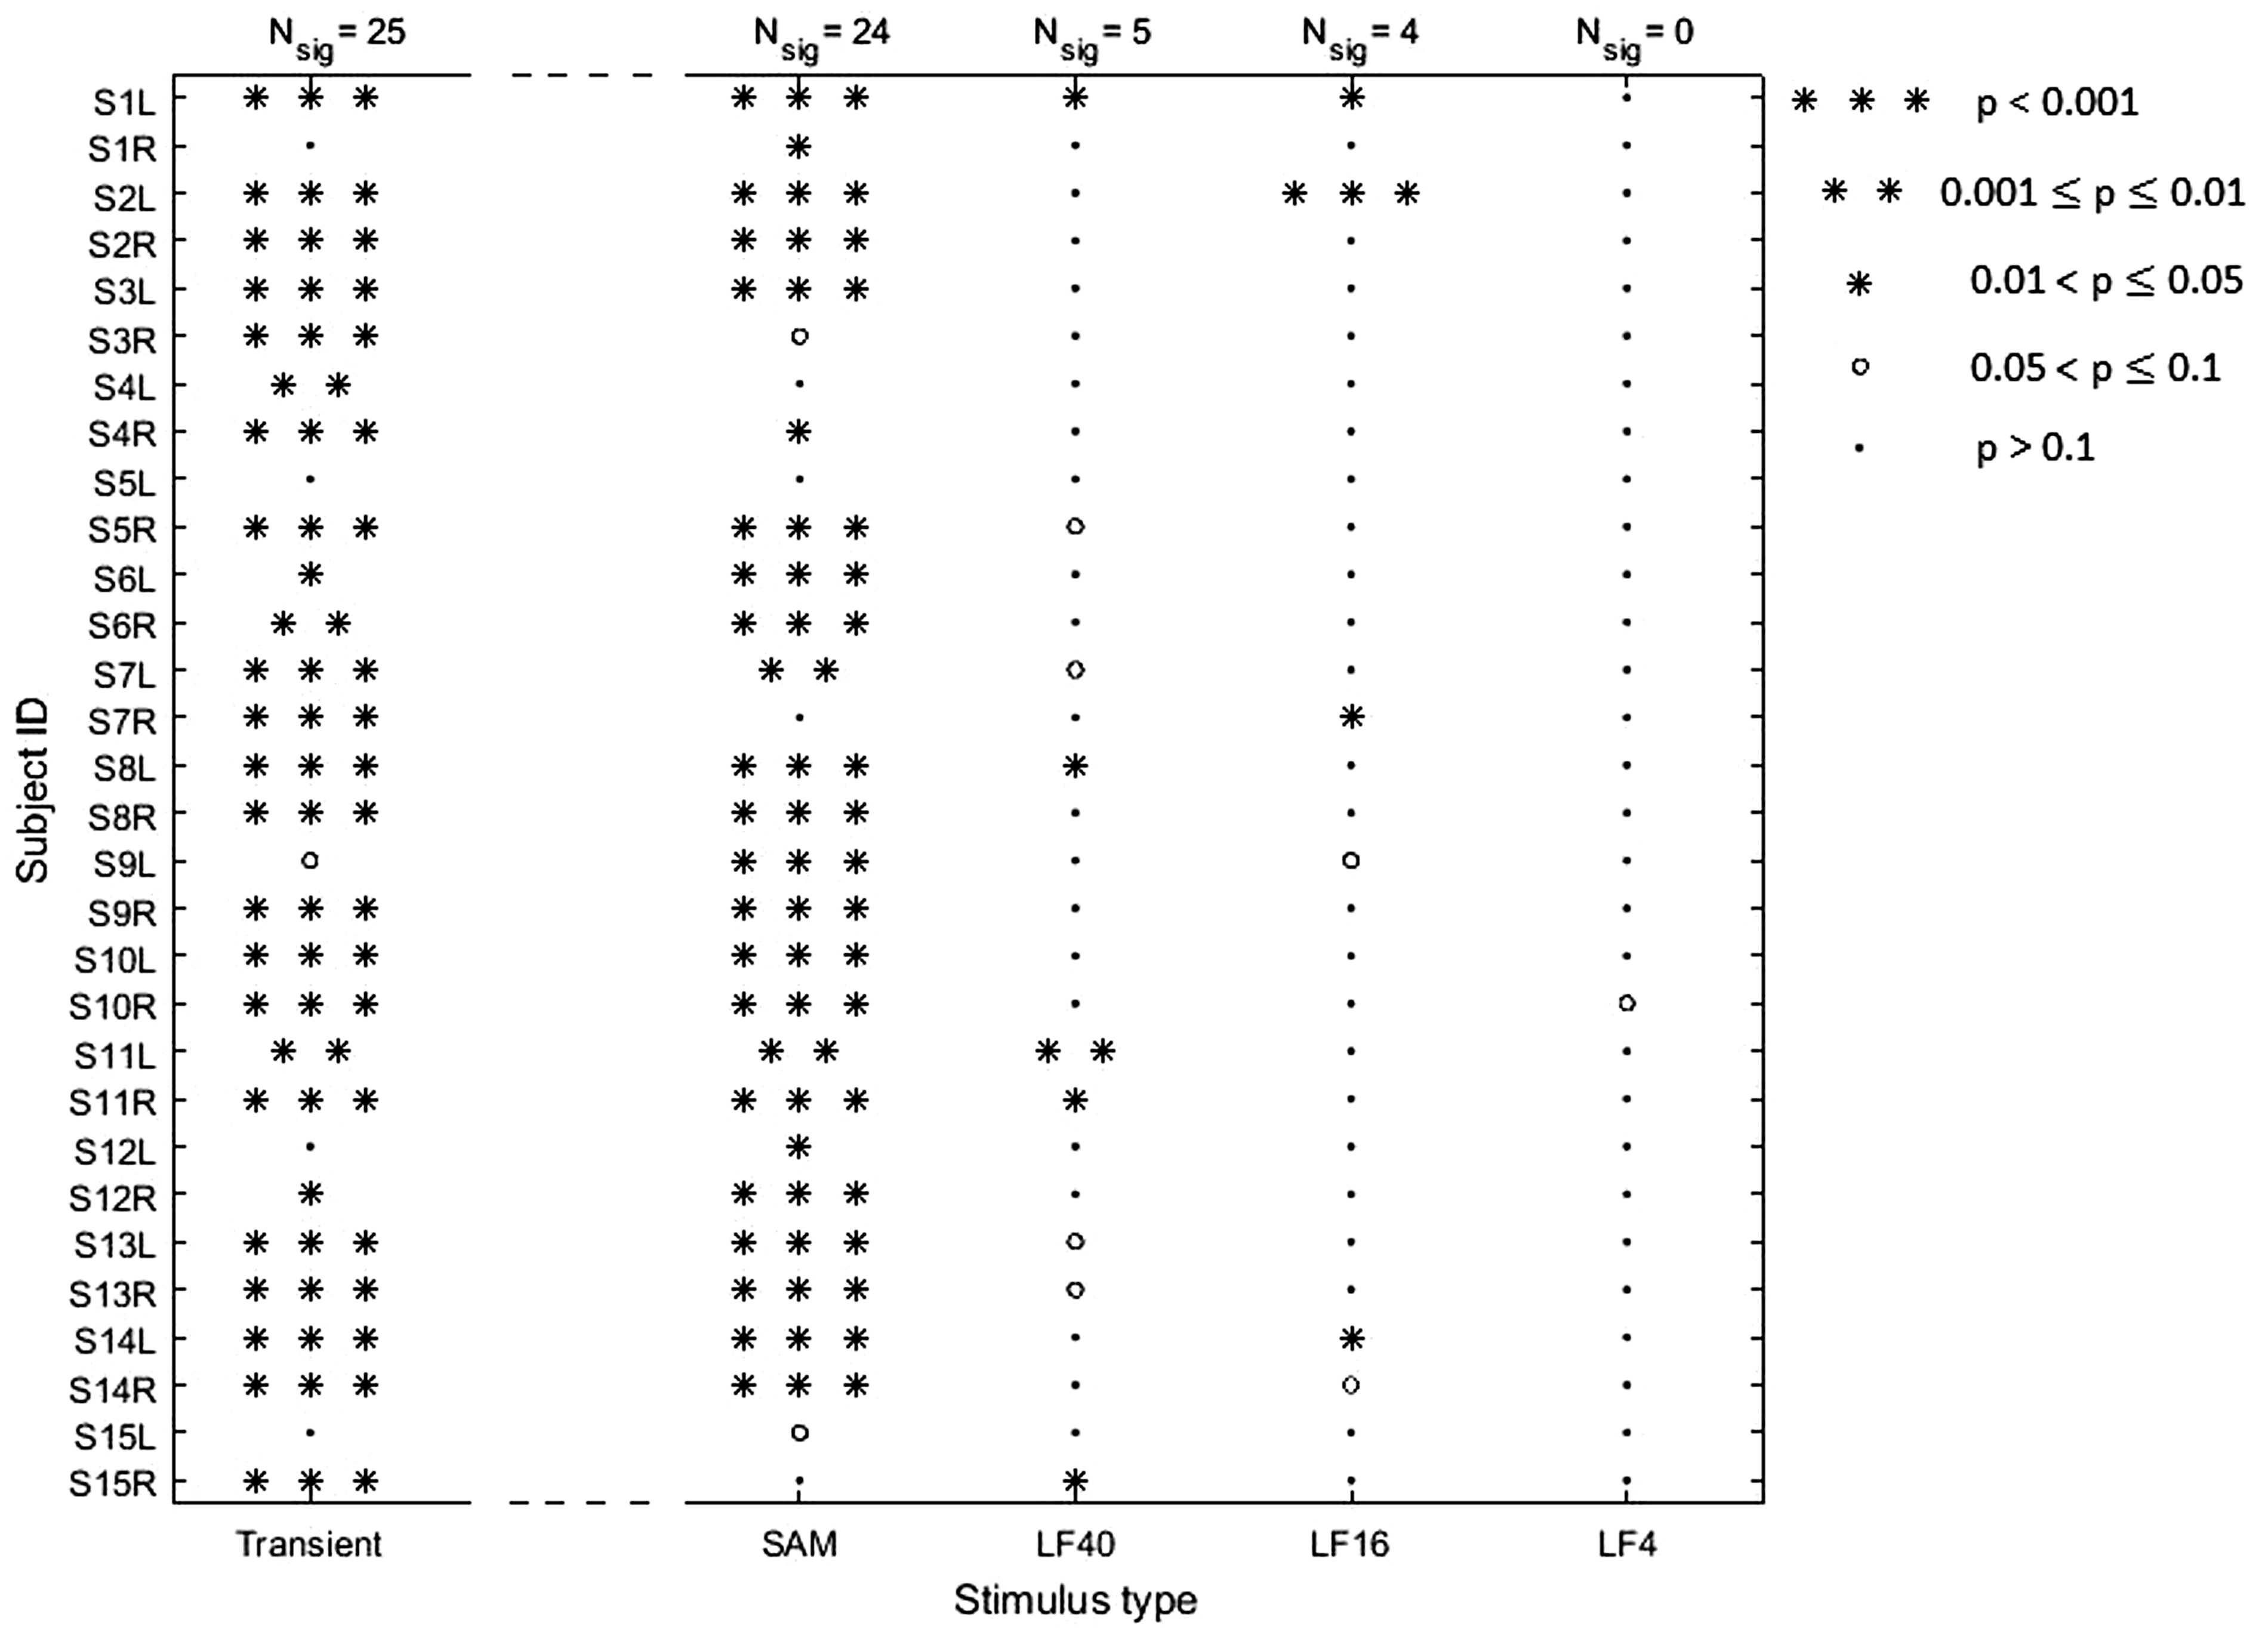
Before showing details and example cVEMPs specific to the three types of stimulation, an overview of our results is given in Table 1. It shows clearly a low number of significant responses to LF/IS stimulation, albeit most of the subject population having reliable transient cVEMPs and/or SAM cVEMPs: 24 out of the 30 ears presented highly significant cVEMPs, with p < 0.001, for either transient or SAM stimulation. Out of these, stimulation of only four ears with pure tones gave significant responses (p < 0.05), none of which were to 4-Hz stimulation. If only the 15 ears are considered that presented highly significant cVEMPs (p < 0.001) to both transient and SAM stimulation, it is found that the majority of 12 ears were not significantly responsive to LF/IS pure-tone stimulation.
Significance of cVEMP responses obtained when stimulating each ear (L: left, R: right) with each of the five different stimuli (see legend). The number of significant responses (Nsig, with p < 0.05) corresponding to each stimulus type is given at the top of each column. Note that the method used to calculate significance was different for transient stimulation than for the continuous stimulation types (see the Methods section).
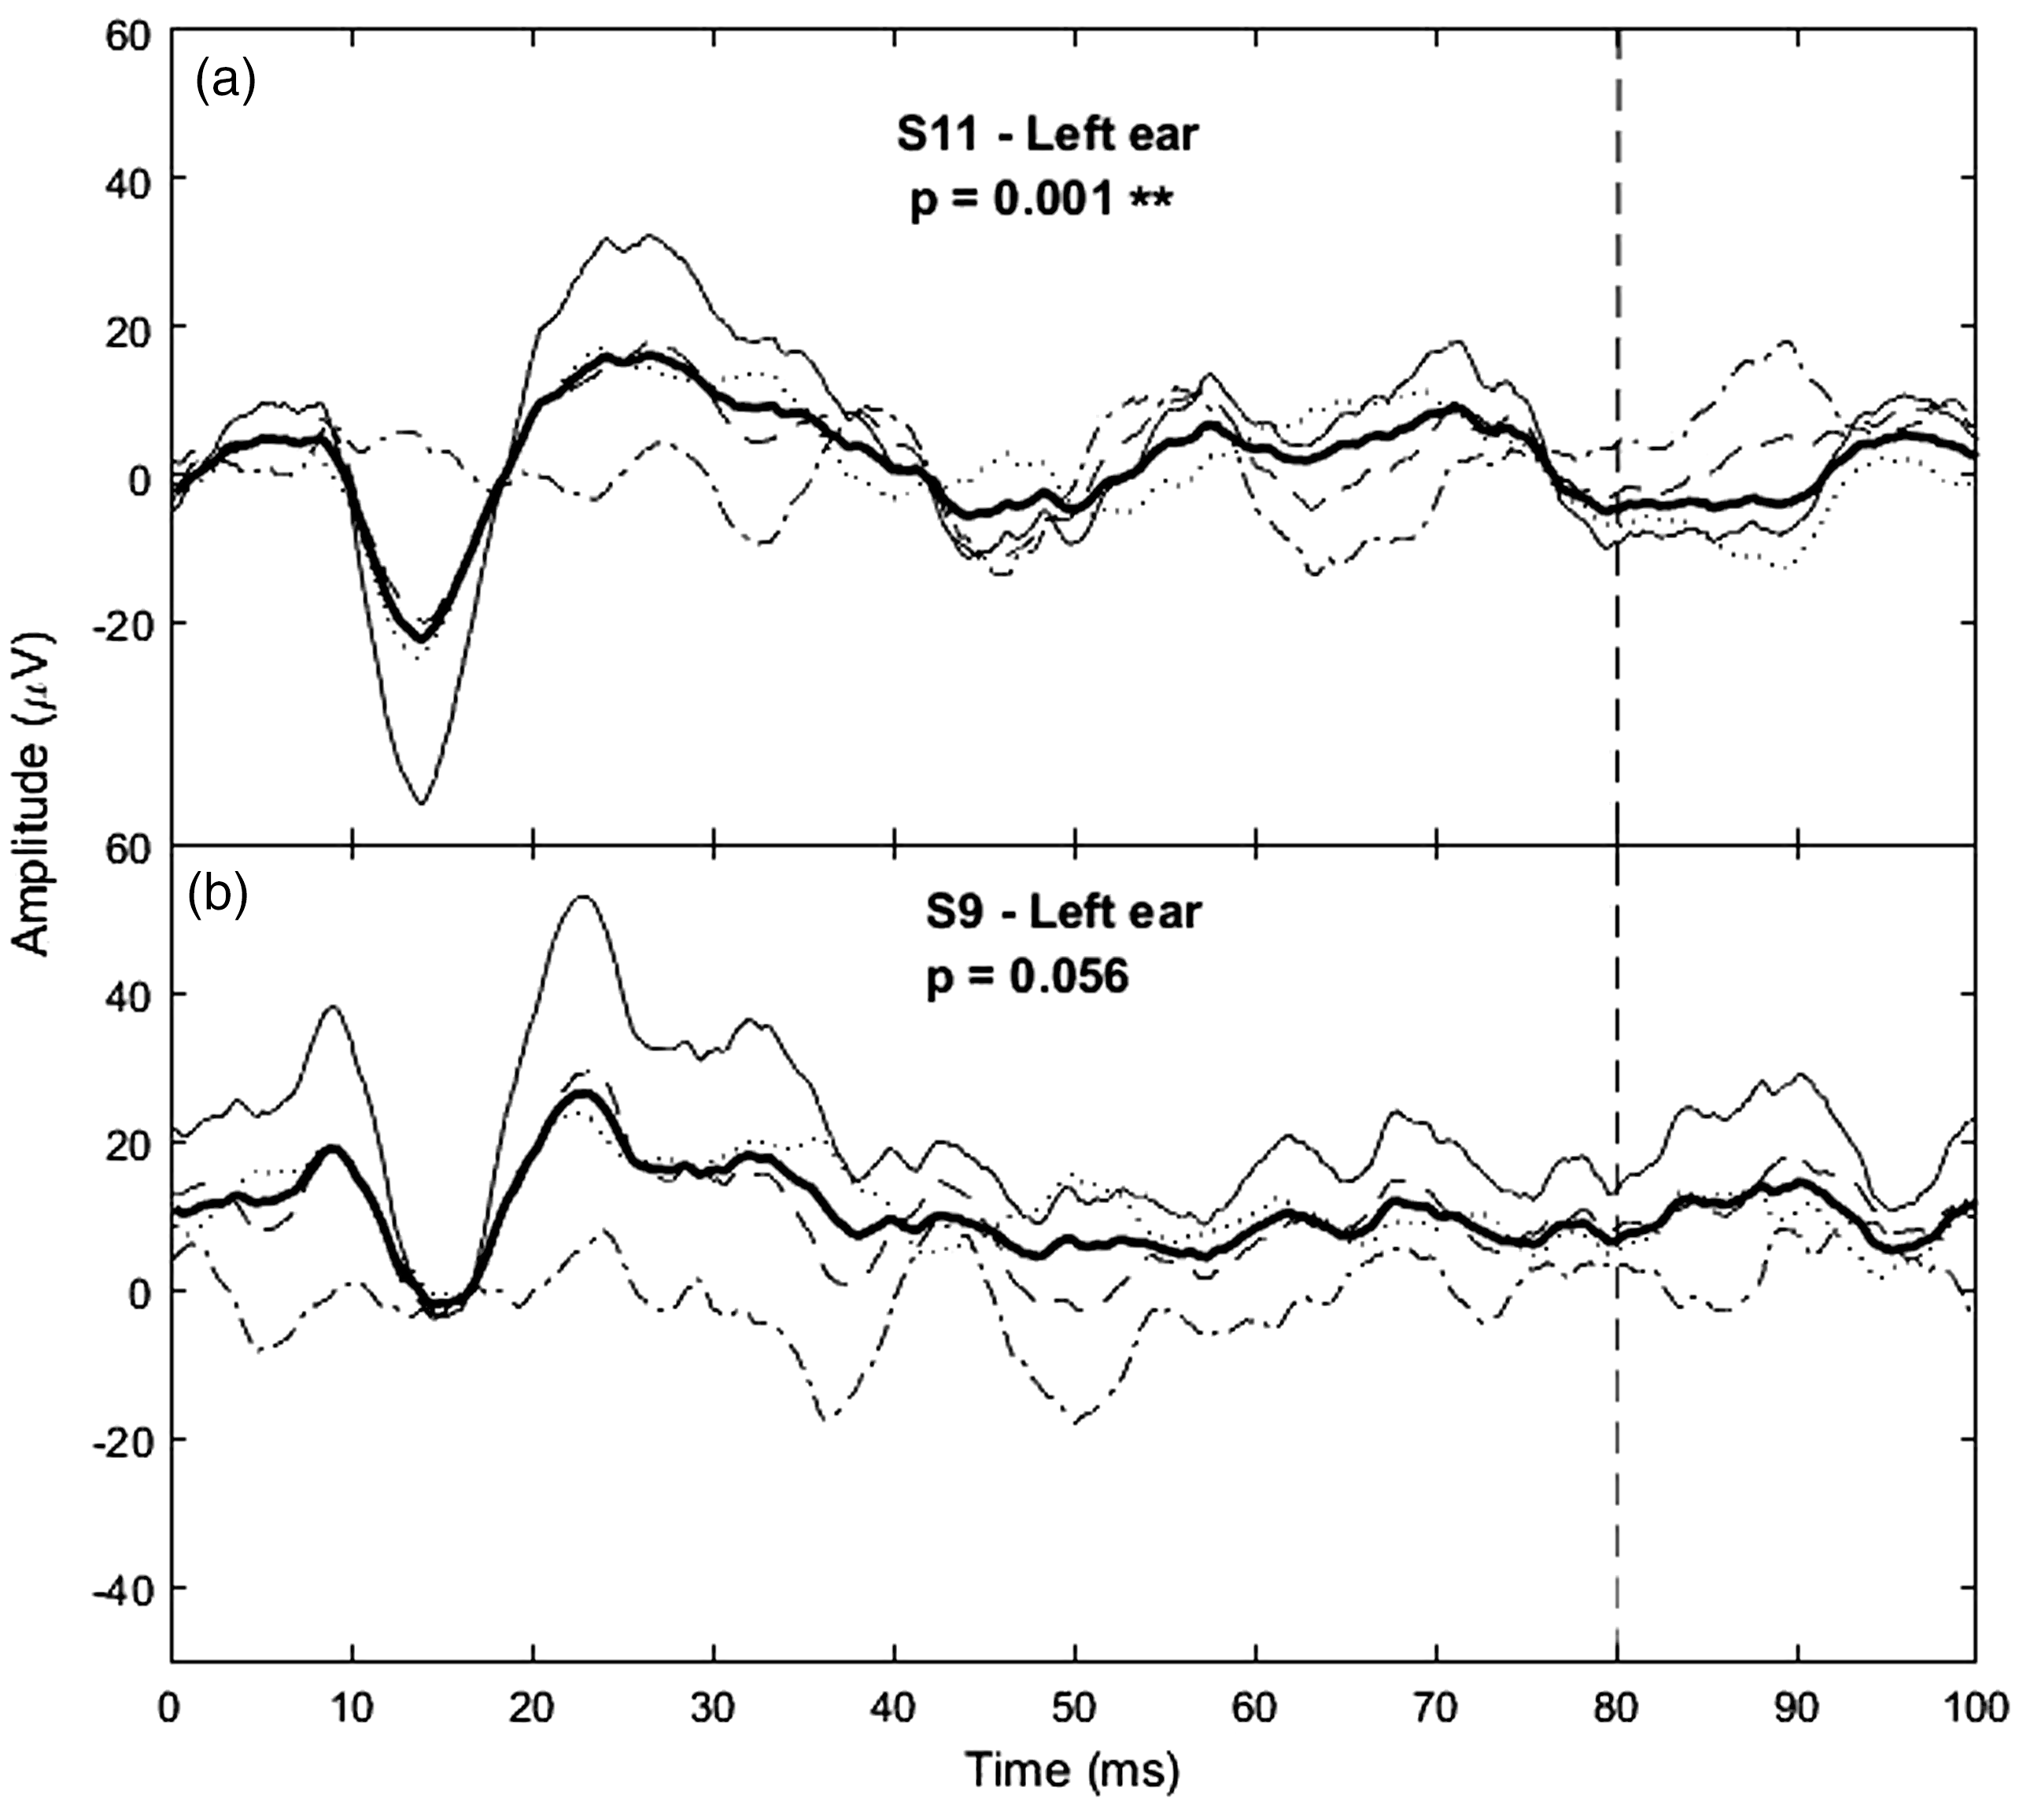
Two example transient cVEMPs and their significance values obtained with the bootstrap technique. The averages from all 600 (5 × 120) trials (bold line) as well as the averages from the even and odd buffers (dashed and dotted lines, respectively) are shown. The sum and difference between the even and odd buffers are also shown (thin solid line and dashed-dotted line, respectively). For significant responses (panel a), the SD of the buffer sum will be much larger than that of their difference, and hence the ±difference parameter will be large (and significant) compared to non-significant responses (panel b). The length of the signal considered in the bootstrap analysis is indicated by the vertical dashed line (80 ms).
Note that there was one case, subject 15’s left ear, that presented an abnormal tympanogram (middle ear pressure < −50 daPa), and thus this may explain why the ear did not present any significant cVEMPs. However, other cases that presented almost absent/weakly significant responses (e.g. S1R, S5L, S12L), presented normal tympanograms.
Transient cVEMPs
Figure 2 shows two example transient cVEMP signals obtained in response to the 500-Hz tone-burst stimulus. The response in panel A shows the typical p13-n23 biphasic component, which was similarly observed in all significant responses. An example of non-significant response, with a p-value just above significance is also shown (panel B). Of the 30 ears, 25 (83.3%; see first column of Table 1) presented significant responses with p < 0.05, with an average peak-to-peak (p13-n23) amplitude of 95.3 dB re 1nV (SD = 6.5 dB).
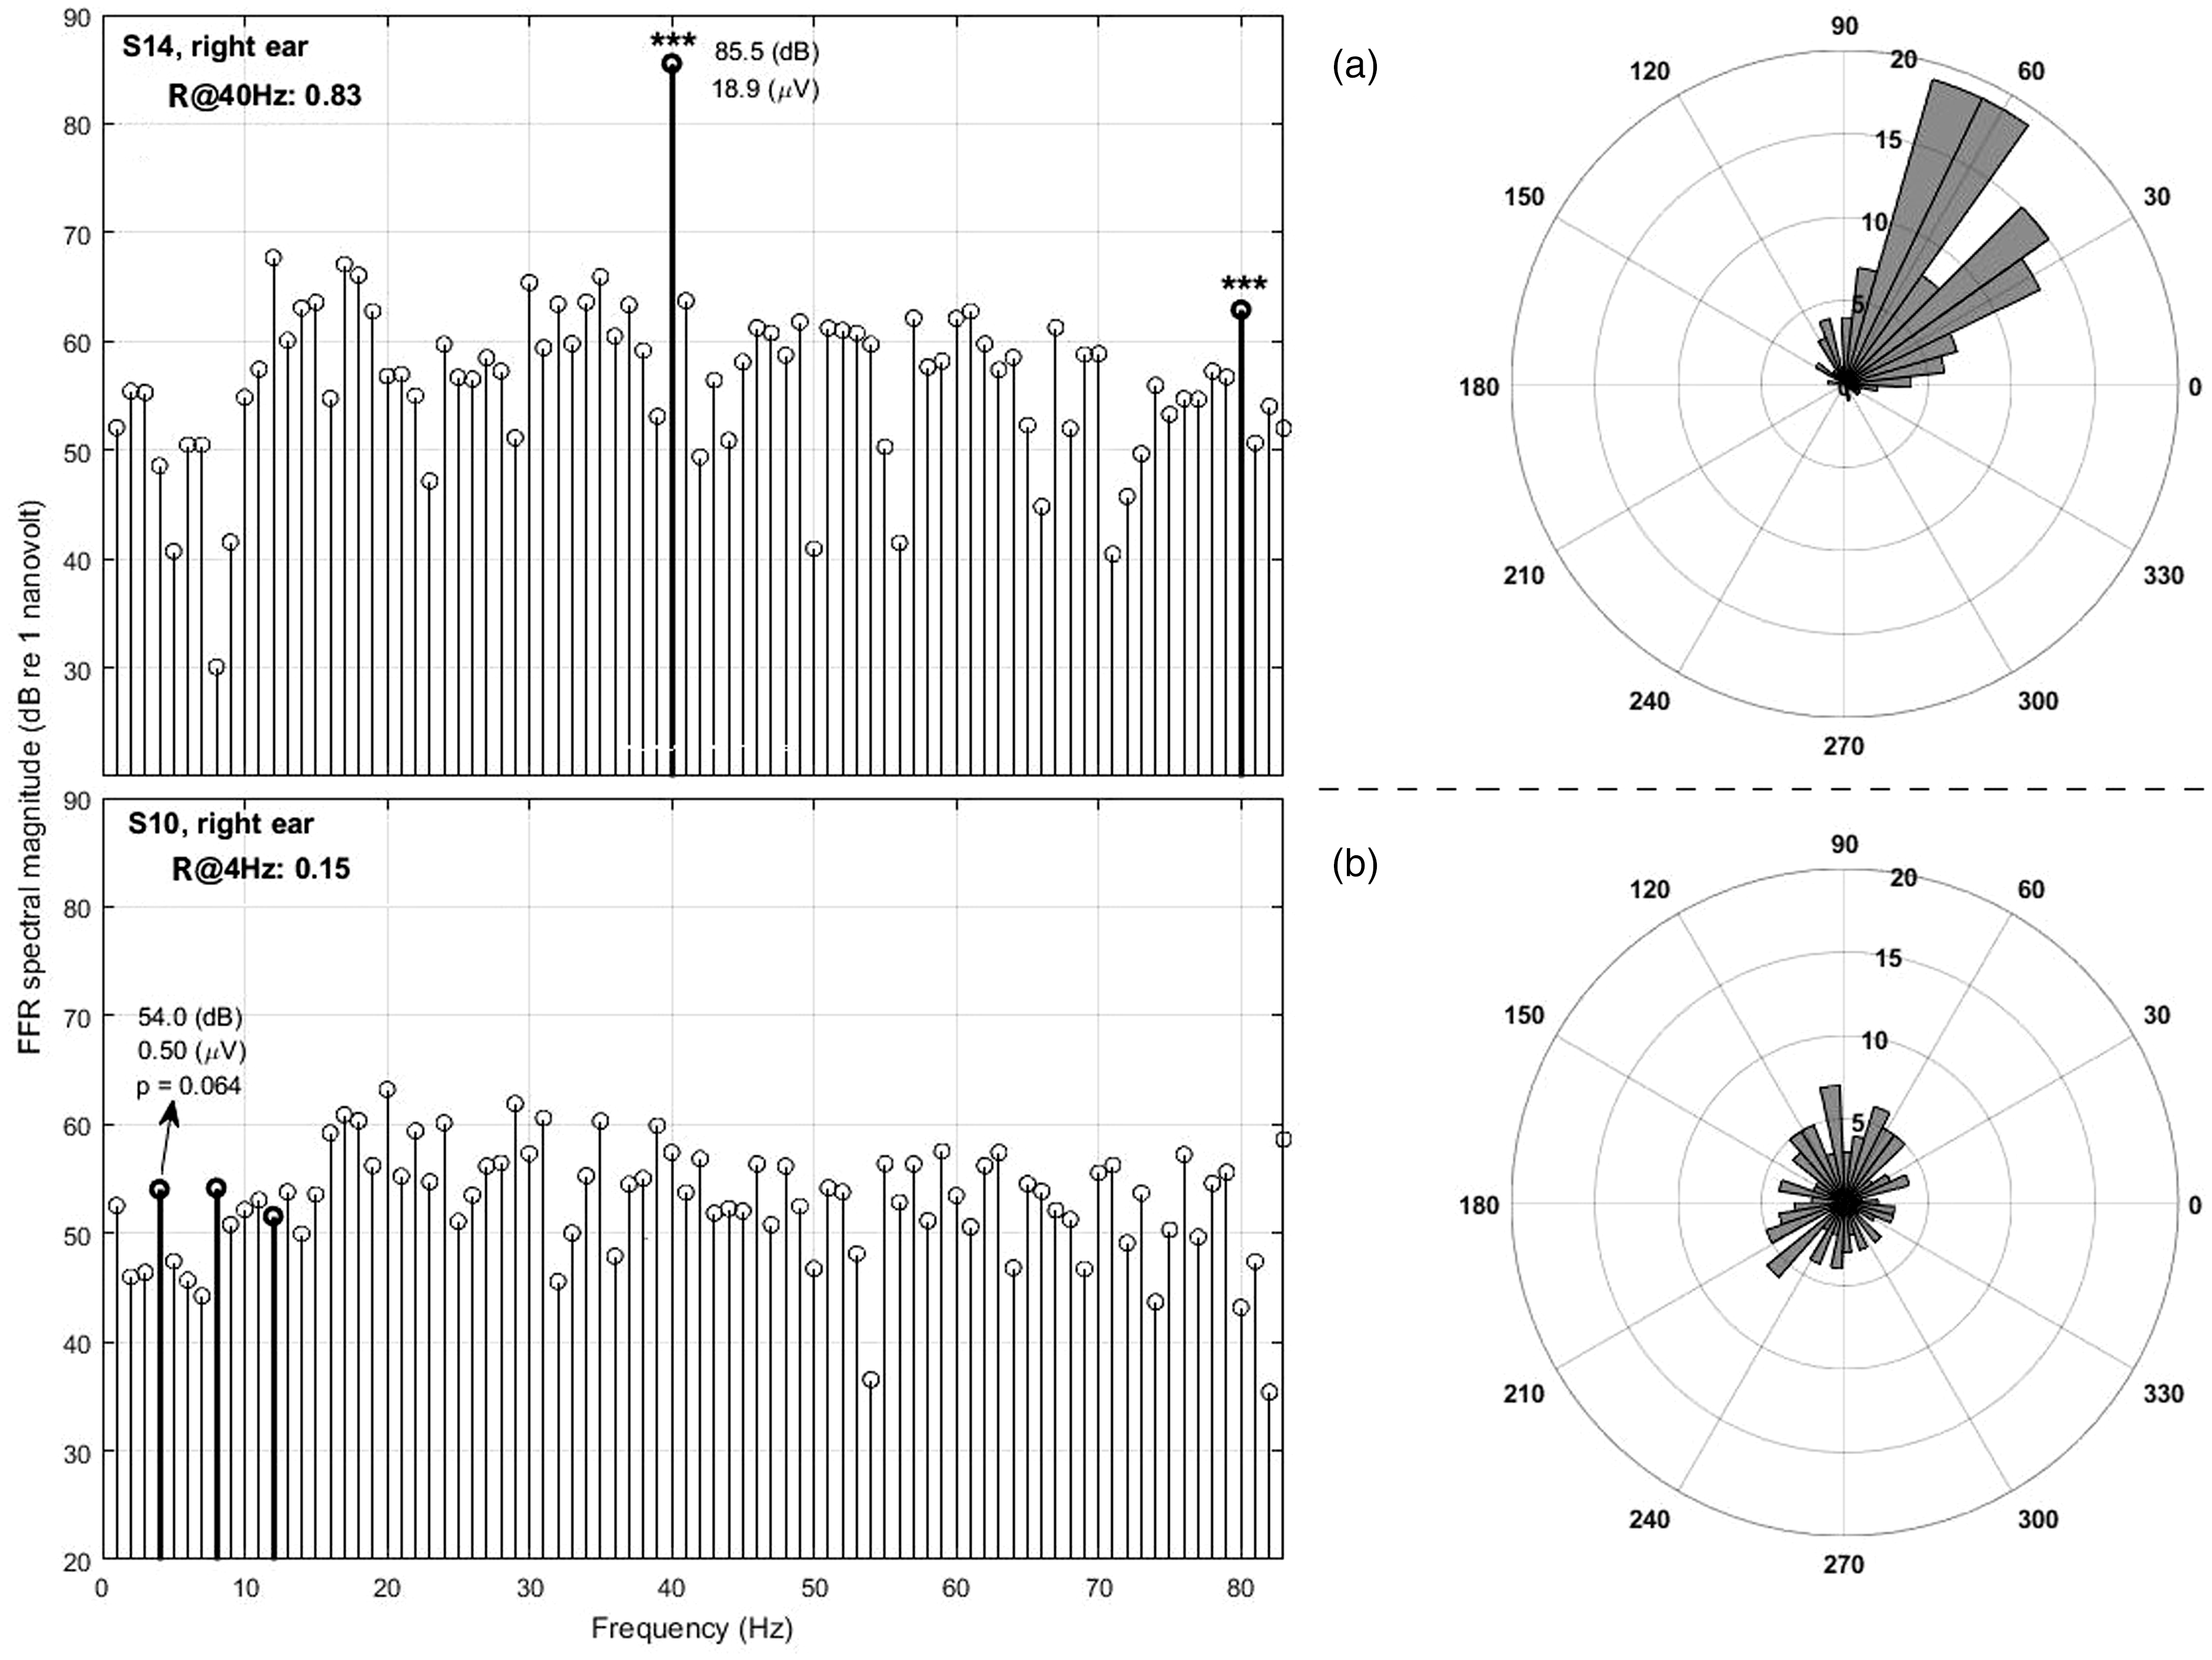
Panel a, left: Example spectrum of the EFR obtained using the 40-Hz SAM stimulus. The 40-Hz spectral component and its second harmonic are shown as bold stems. In this case, both the 40-Hz component and second EFR harmonic are significant with p < 0.001 (shown with asterisks). As exemplified here, significant phase locking generally resulted in a spectral peak at the modulation frequency that is clearly above the baseline myogenic noise (thin spectral lines). The angular histogram (panel a, right) shows the phases of most trials falling mainly into one quadrant, resulting in a high R-value. Panel b, left: The response from the ear that produced the highest R-value using the 4-Hz infrasound stimulus (S10R) is shown for comparison (only the first three harmonics are shown in bold here.) The angular histogram (panel b, left) shows phases were more evenly distributed across all quadrants, resulting in a low R-value.
The average p13 and n23 latencies amongst these significant cases were 15.9 ms (SD = 1.6 ms) and 25.9 ms (SD = 2.3 ms), respectively. Both, the average p13-n23 amplitudes and latencies, as well as their SDs, are similar to values reported in the literature for cVEMPs obtained with air-conducted tone bursts2,39,40 (using linear µV values we obtained a mean amplitude of 74.2 µV (SD = 49.4 µV), which is comparable to the 73.8 µV (SD = 45.5 µV) reported by Basta et al., 39 who proposed normative data for a similar age group and a stimulation level of 115 dB SPL. Their p13 and n23 latencies of 16.2 ms (SD = 2.5 ms) and 24.0 ms (SD = 2.6 ms) are also similar to ours).
SAM cVEMPs
Figure 3 shows an example spectrum of the EFR to the 40-Hz SAM stimulus (panel A, left). The muscle’s phase locked response to the 40-Hz modulation rate of the stimulus was here highly significant, which resulted in a clear spectral peak at 40 Hz (bold stem line) and a high R-value. Such salient spectral peaks were typically observed if responses were significant (p < 0.05), while for non-significant cases the spectral magnitude at 40 Hz (and that of higher EFR harmonics) was at the level of the myogenic noise (thin spectral lines).
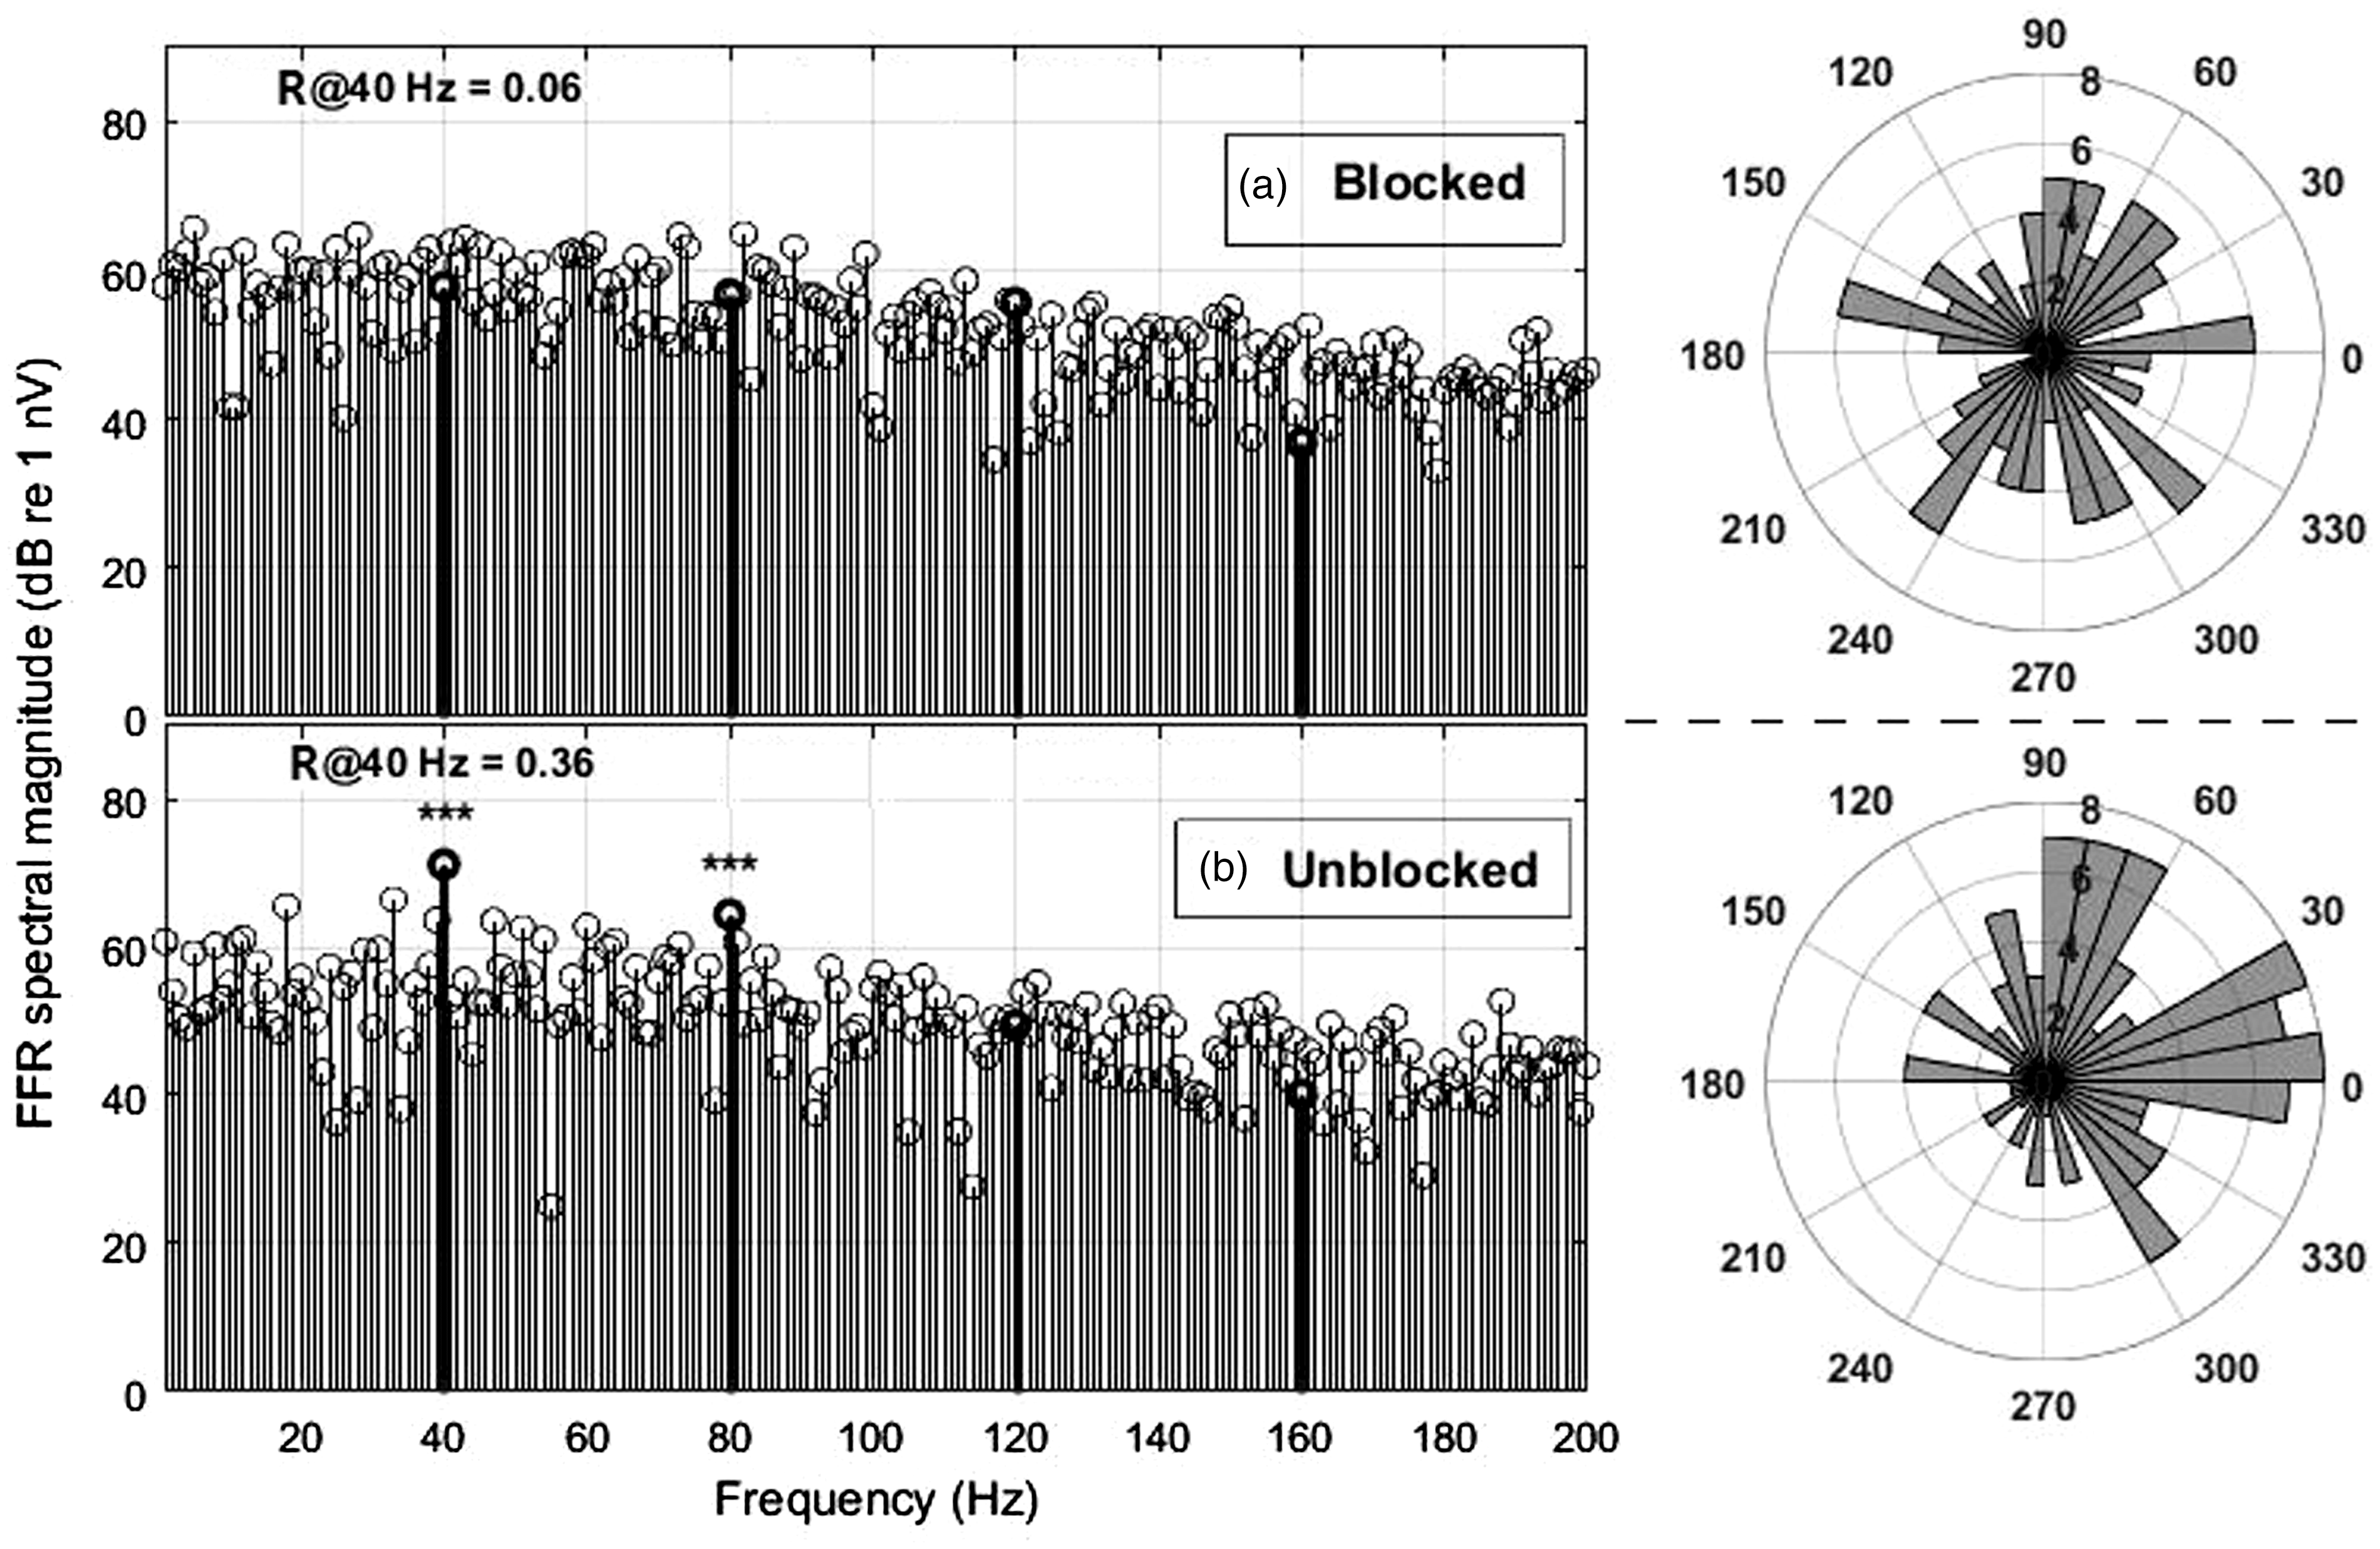
Example spectrum of an EFR control measurement to the 40-Hz SAM stimulus under the same measurement conditions as the main tests, but with the sound-delivery by the THD-50 headphone mechanically attenuated (panel a). Two minutes later, with the obstruction removed, ear S1L presented significant phase coherence (panel b). Corresponding angular histograms are shown on the right side of each panel.
Overall, 24 ears (80%) presented significant EFRs with p < 0.05 (see 2nd column of Table 1), meaning that both types of measurements, transient cVEMP and SAM cVEMP, performed similarly well in terms of number of significant cases. The average spectral amplitude of significant cases was 75.5 dB re 1 nV (SD = 6.9 dB), which is similar but somewhat larger than the mean amplitude of ∼70 dB re 1 nV (equals 3.2 µV) reported by Bell et al.8 for a 39-Hz SAM stimulus (with same carrier frequency and repetition rate as here) and likely explained by their lower stimulus level of only 96 dBA.
For 21 ears, significant cVEMPs were obtained for both transient and SAM stimulation. However, there were also seven cases which were significant in one but not in the other stimulation type, suggesting the methods are not fully equivalent. Without a comprehensive vestibular test battery, it is not possible to say which of the two methods has the better sensitivity and specificity. But in our experience, the SAM cVEMP might well be clinically applicable.
It may be argued that artefacts, such as electro-magnetic cross-talk from the sound sources, or cables, produced false positives in SAM stimulation so that their validity might be questioned. Note, however, that in the case of the SAM stimulation no 40-Hz spectral component is present in the electrical signal. Nevertheless, we tested for the possibility of such artefacts, by attenuating the acoustic sound stimulus of the THD-50 mechanically a while recording with the same electrical signal, and the 40-Hz EFR disappeared (see Figure 4).
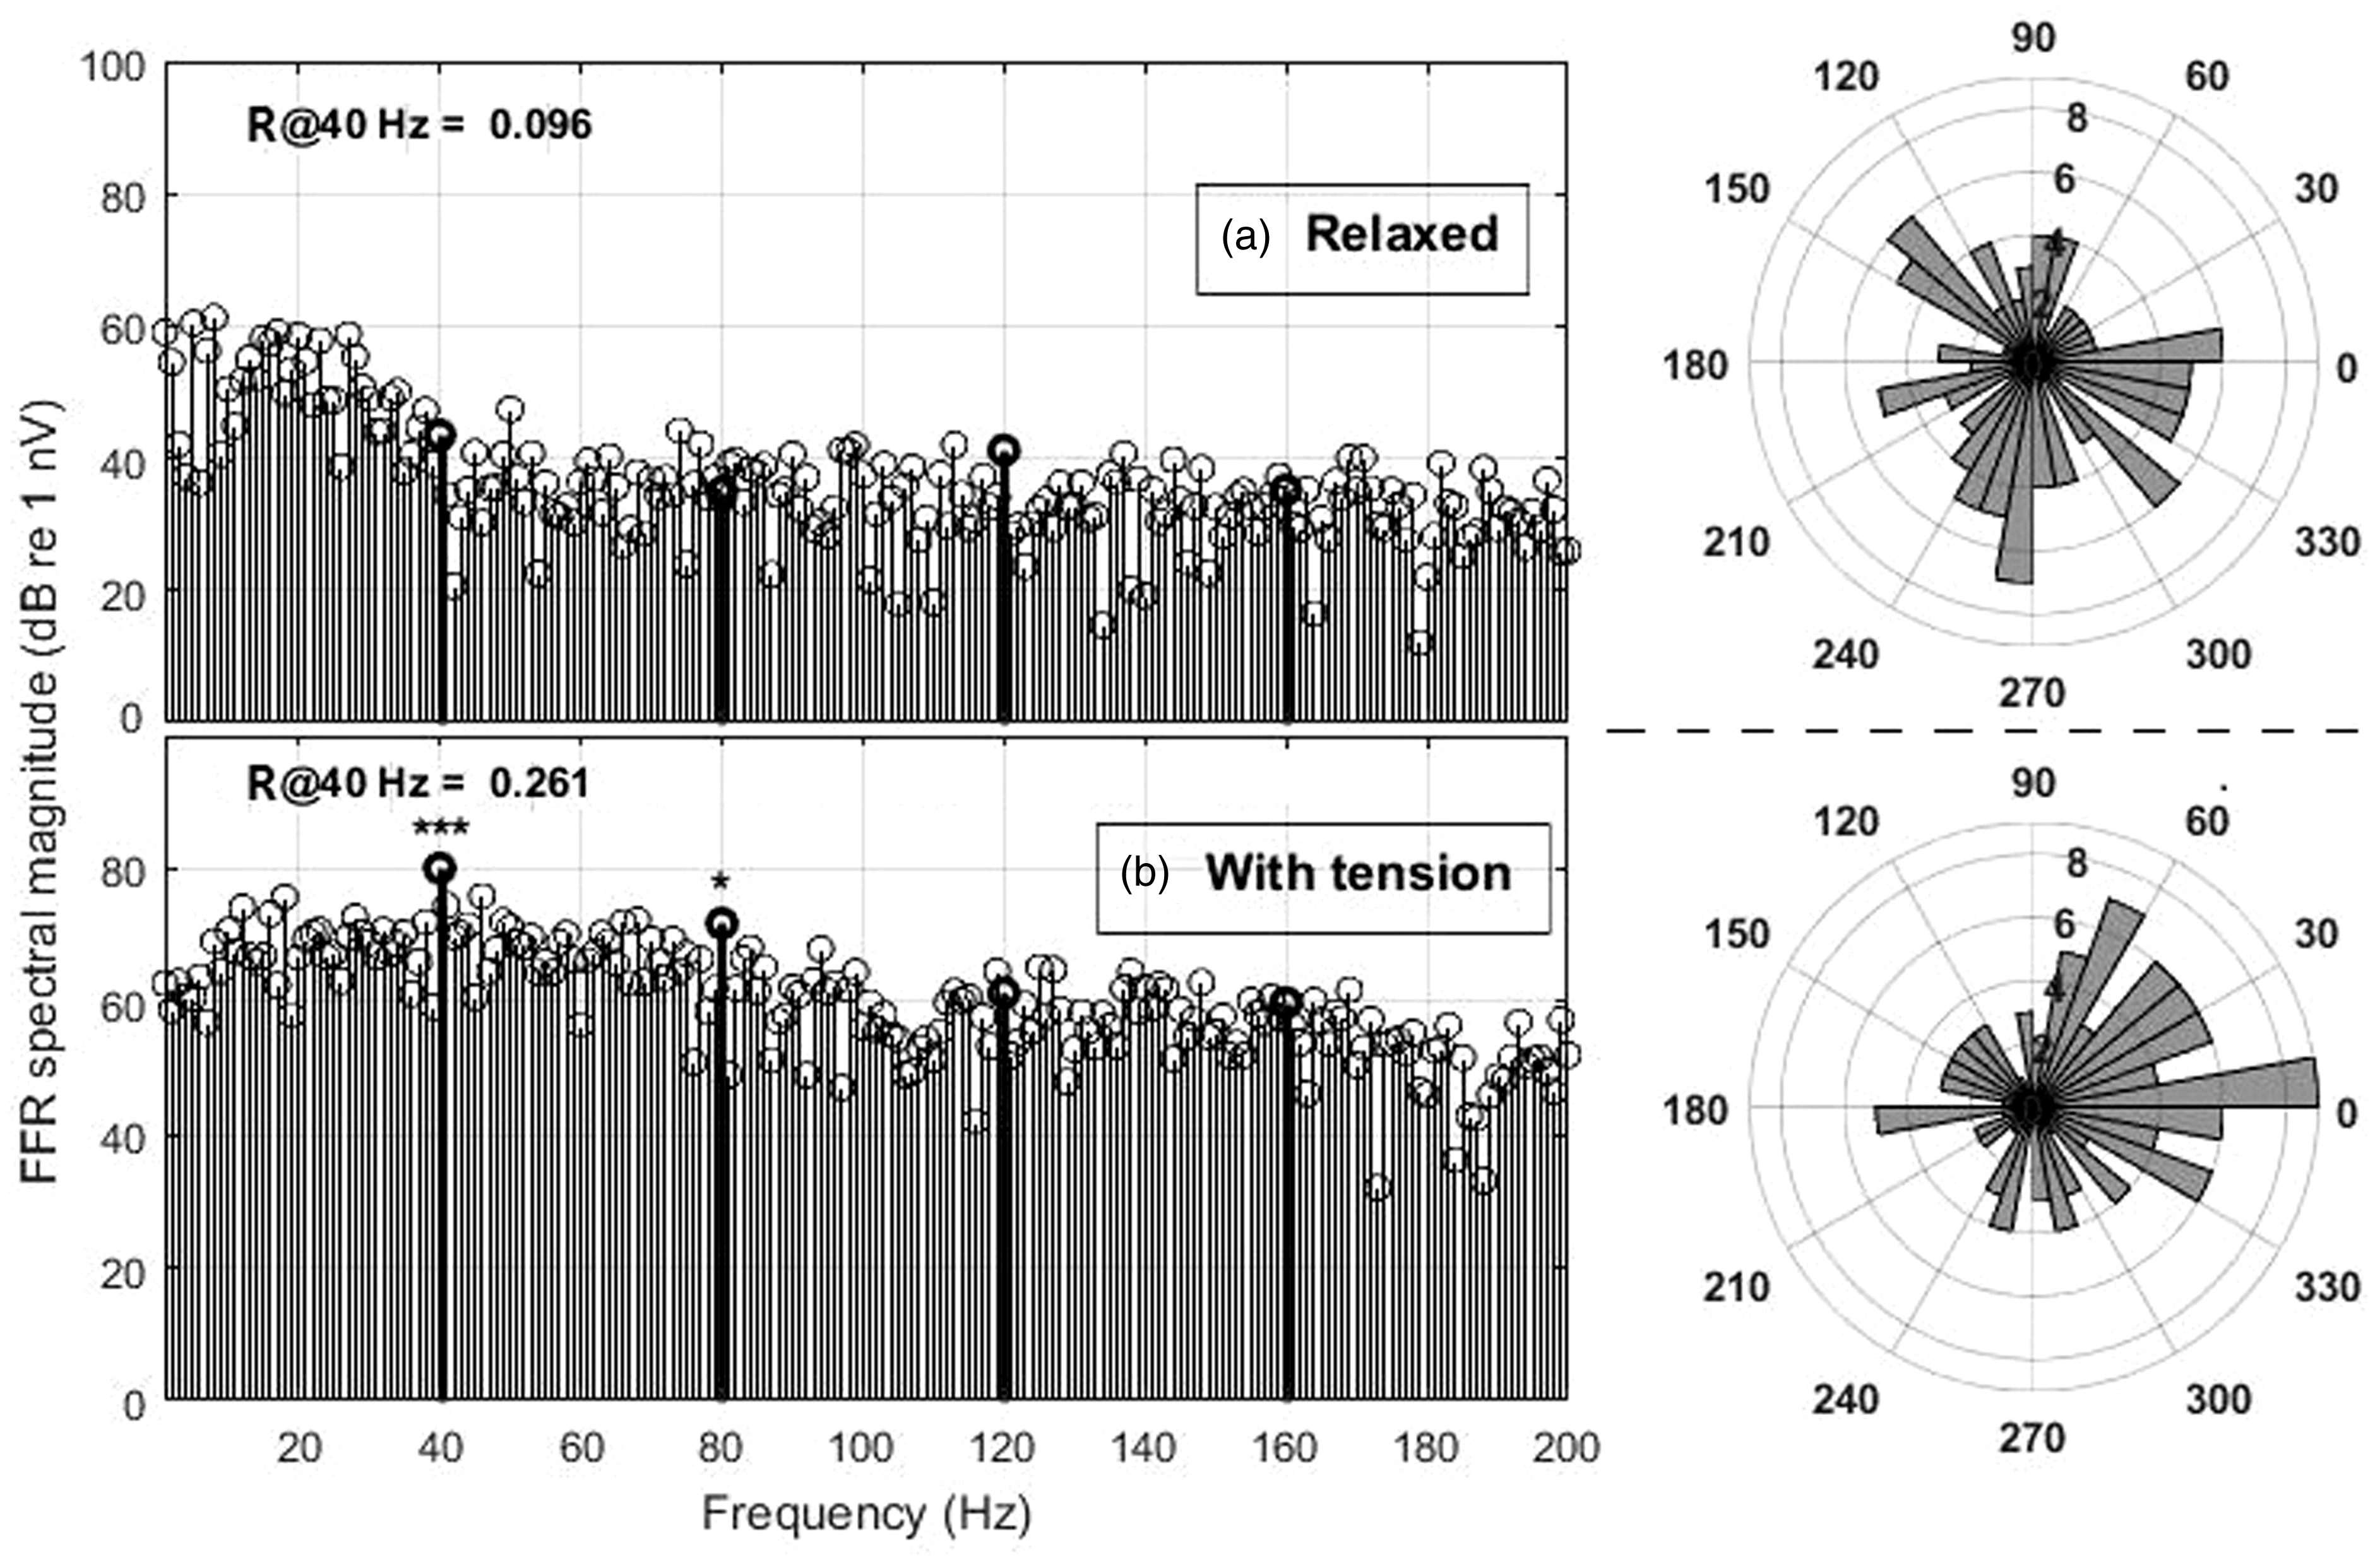
Example spectrum of an EFR control measurement to the 40-Hz SAM stimulus without (panel a) and with applying muscle tension (panel b). Both measurements are from the same subject within minutes. Corresponding angular histograms are shown on the right side of each panel.
We also checked that the recorded EFR response to the SAM stimulus was actually a myogenic potential and did not originate from the brain, which also responds with a strong auditory steady-state response (ASSR) specifically to a 40-Hz SAM stimulation. Figure 5 shows how muscle tension increases myogenic noise, but also produces a much larger (and significant) response, whereas the brain’s ASSR would not be influenced by muscle tension.
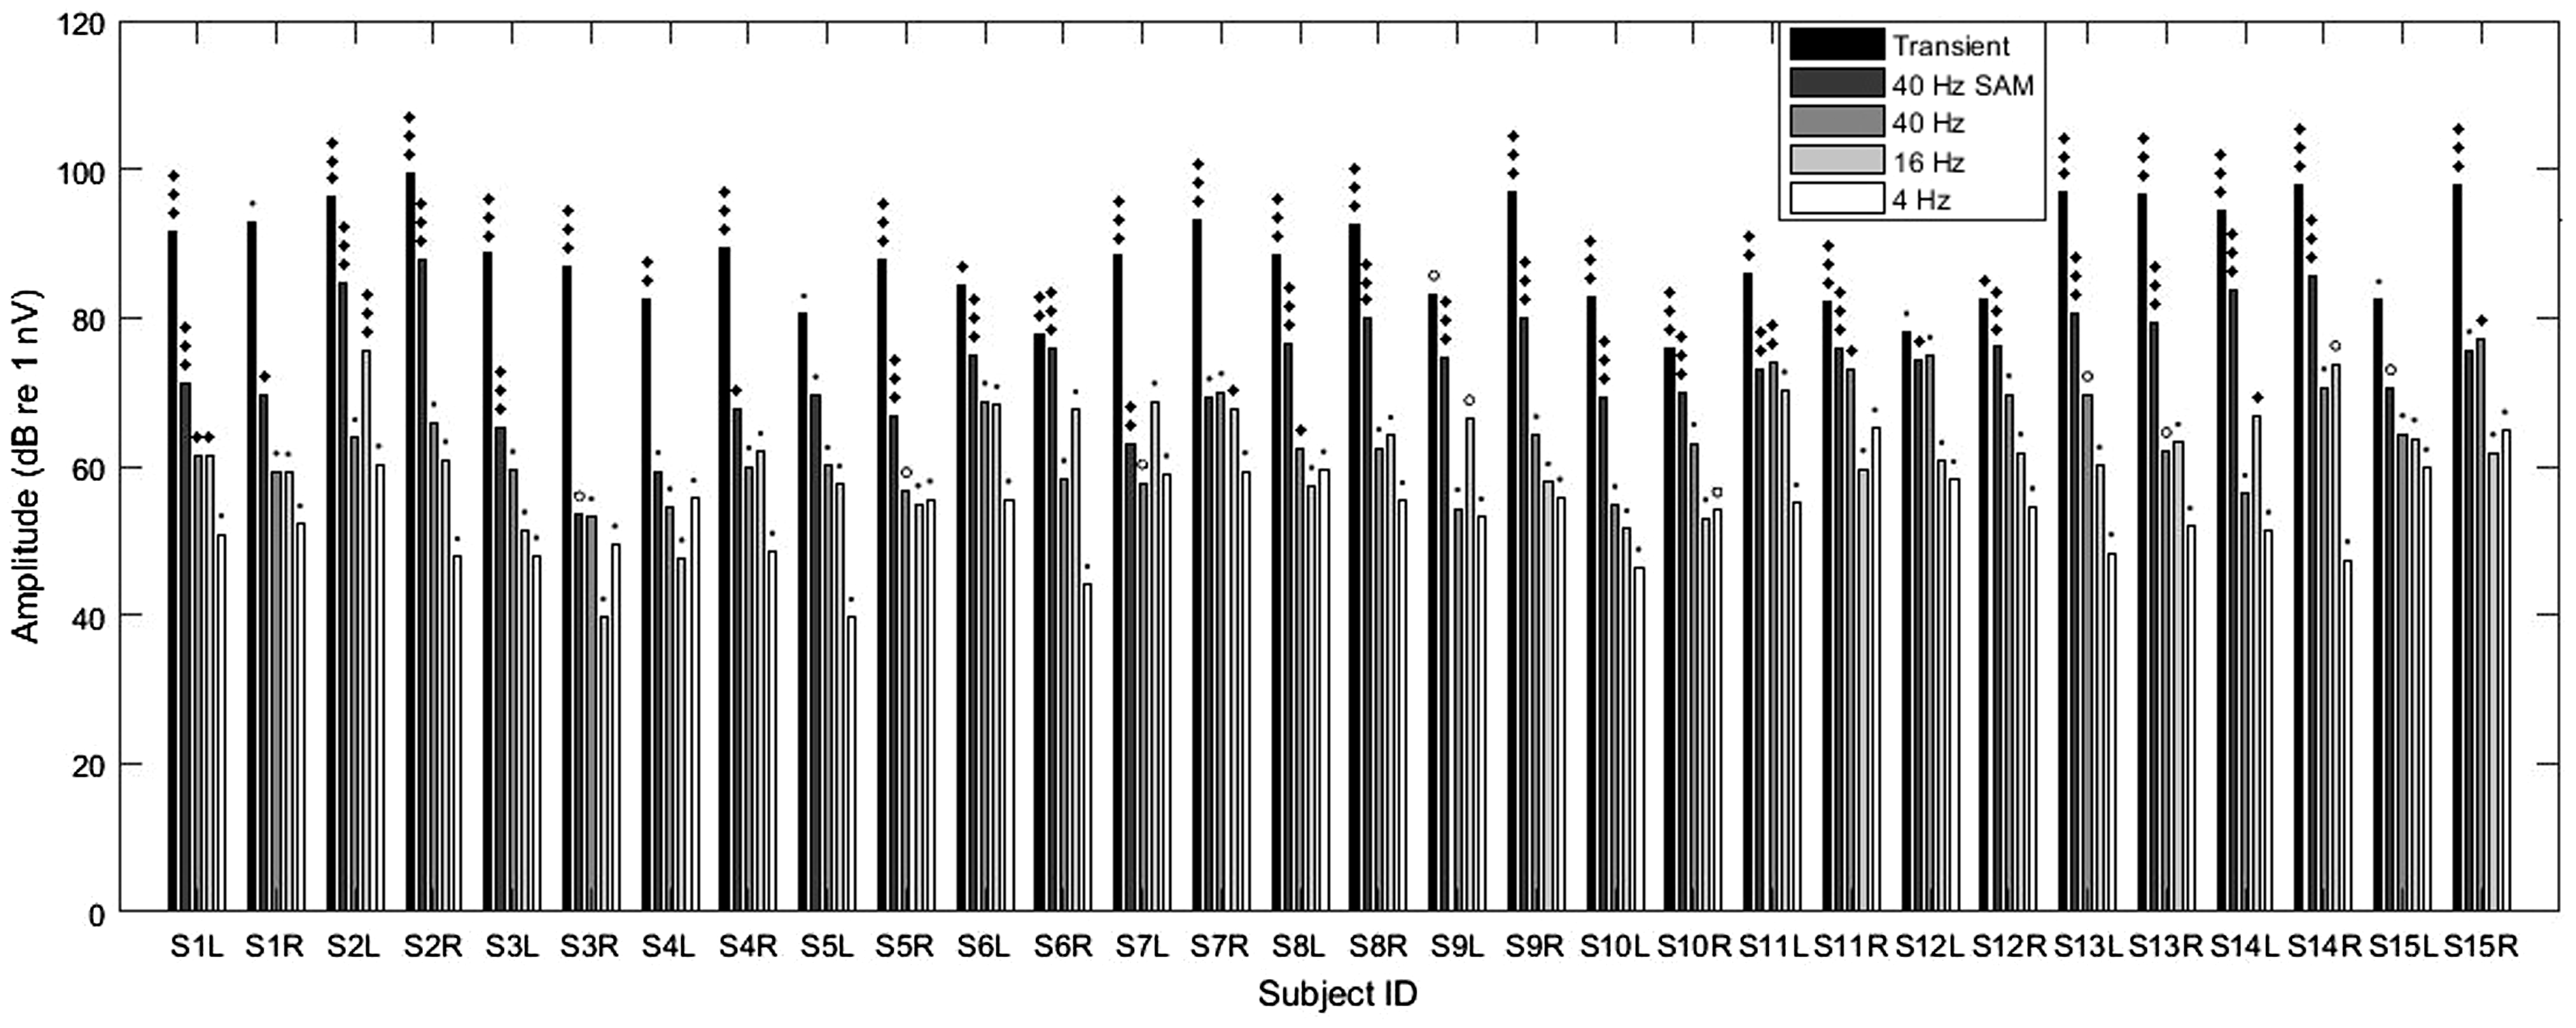
cVEMP amplitudes obtained for each ear and stimulus type (left to right: transient, 40-Hz SAM, 40 Hz, 16 Hz, and 4 Hz; see legend). Significance of each case is given above each bar line with symbols as defined in Figure 2. Note that for transient cVEMPs, the p13-n23 amplitudes were halved to be comparable with the spectral amplitude of the EFRs and FFRs.
LF/IS cVEMPs
The attempt to evoke cVEMPs with continuous LF and IS pure-tone stimulation was the actual aim of our study. However, this kind of stimulation yielded clearly a lower amount of convincing spectral peaks than the SAM stimulation: only 5, 4 and 0 responses were significant for 40-, 16- and 4-Hz stimulation, respectively (see Table 1, columns 3–5 for individual significance data). Note that the decrease in the number of significant responses with decreasing frequency cannot be explained by an unfavourable trend in the myogenic noise floor: the noise was constant, or even decreased with decreasing frequency below 40 Hz (see spectra in Figures 3 to 5 and the average spectra in Figure 7(b)).
An overview of all individual amplitude values for each type of stimulation is given in Figure 6.
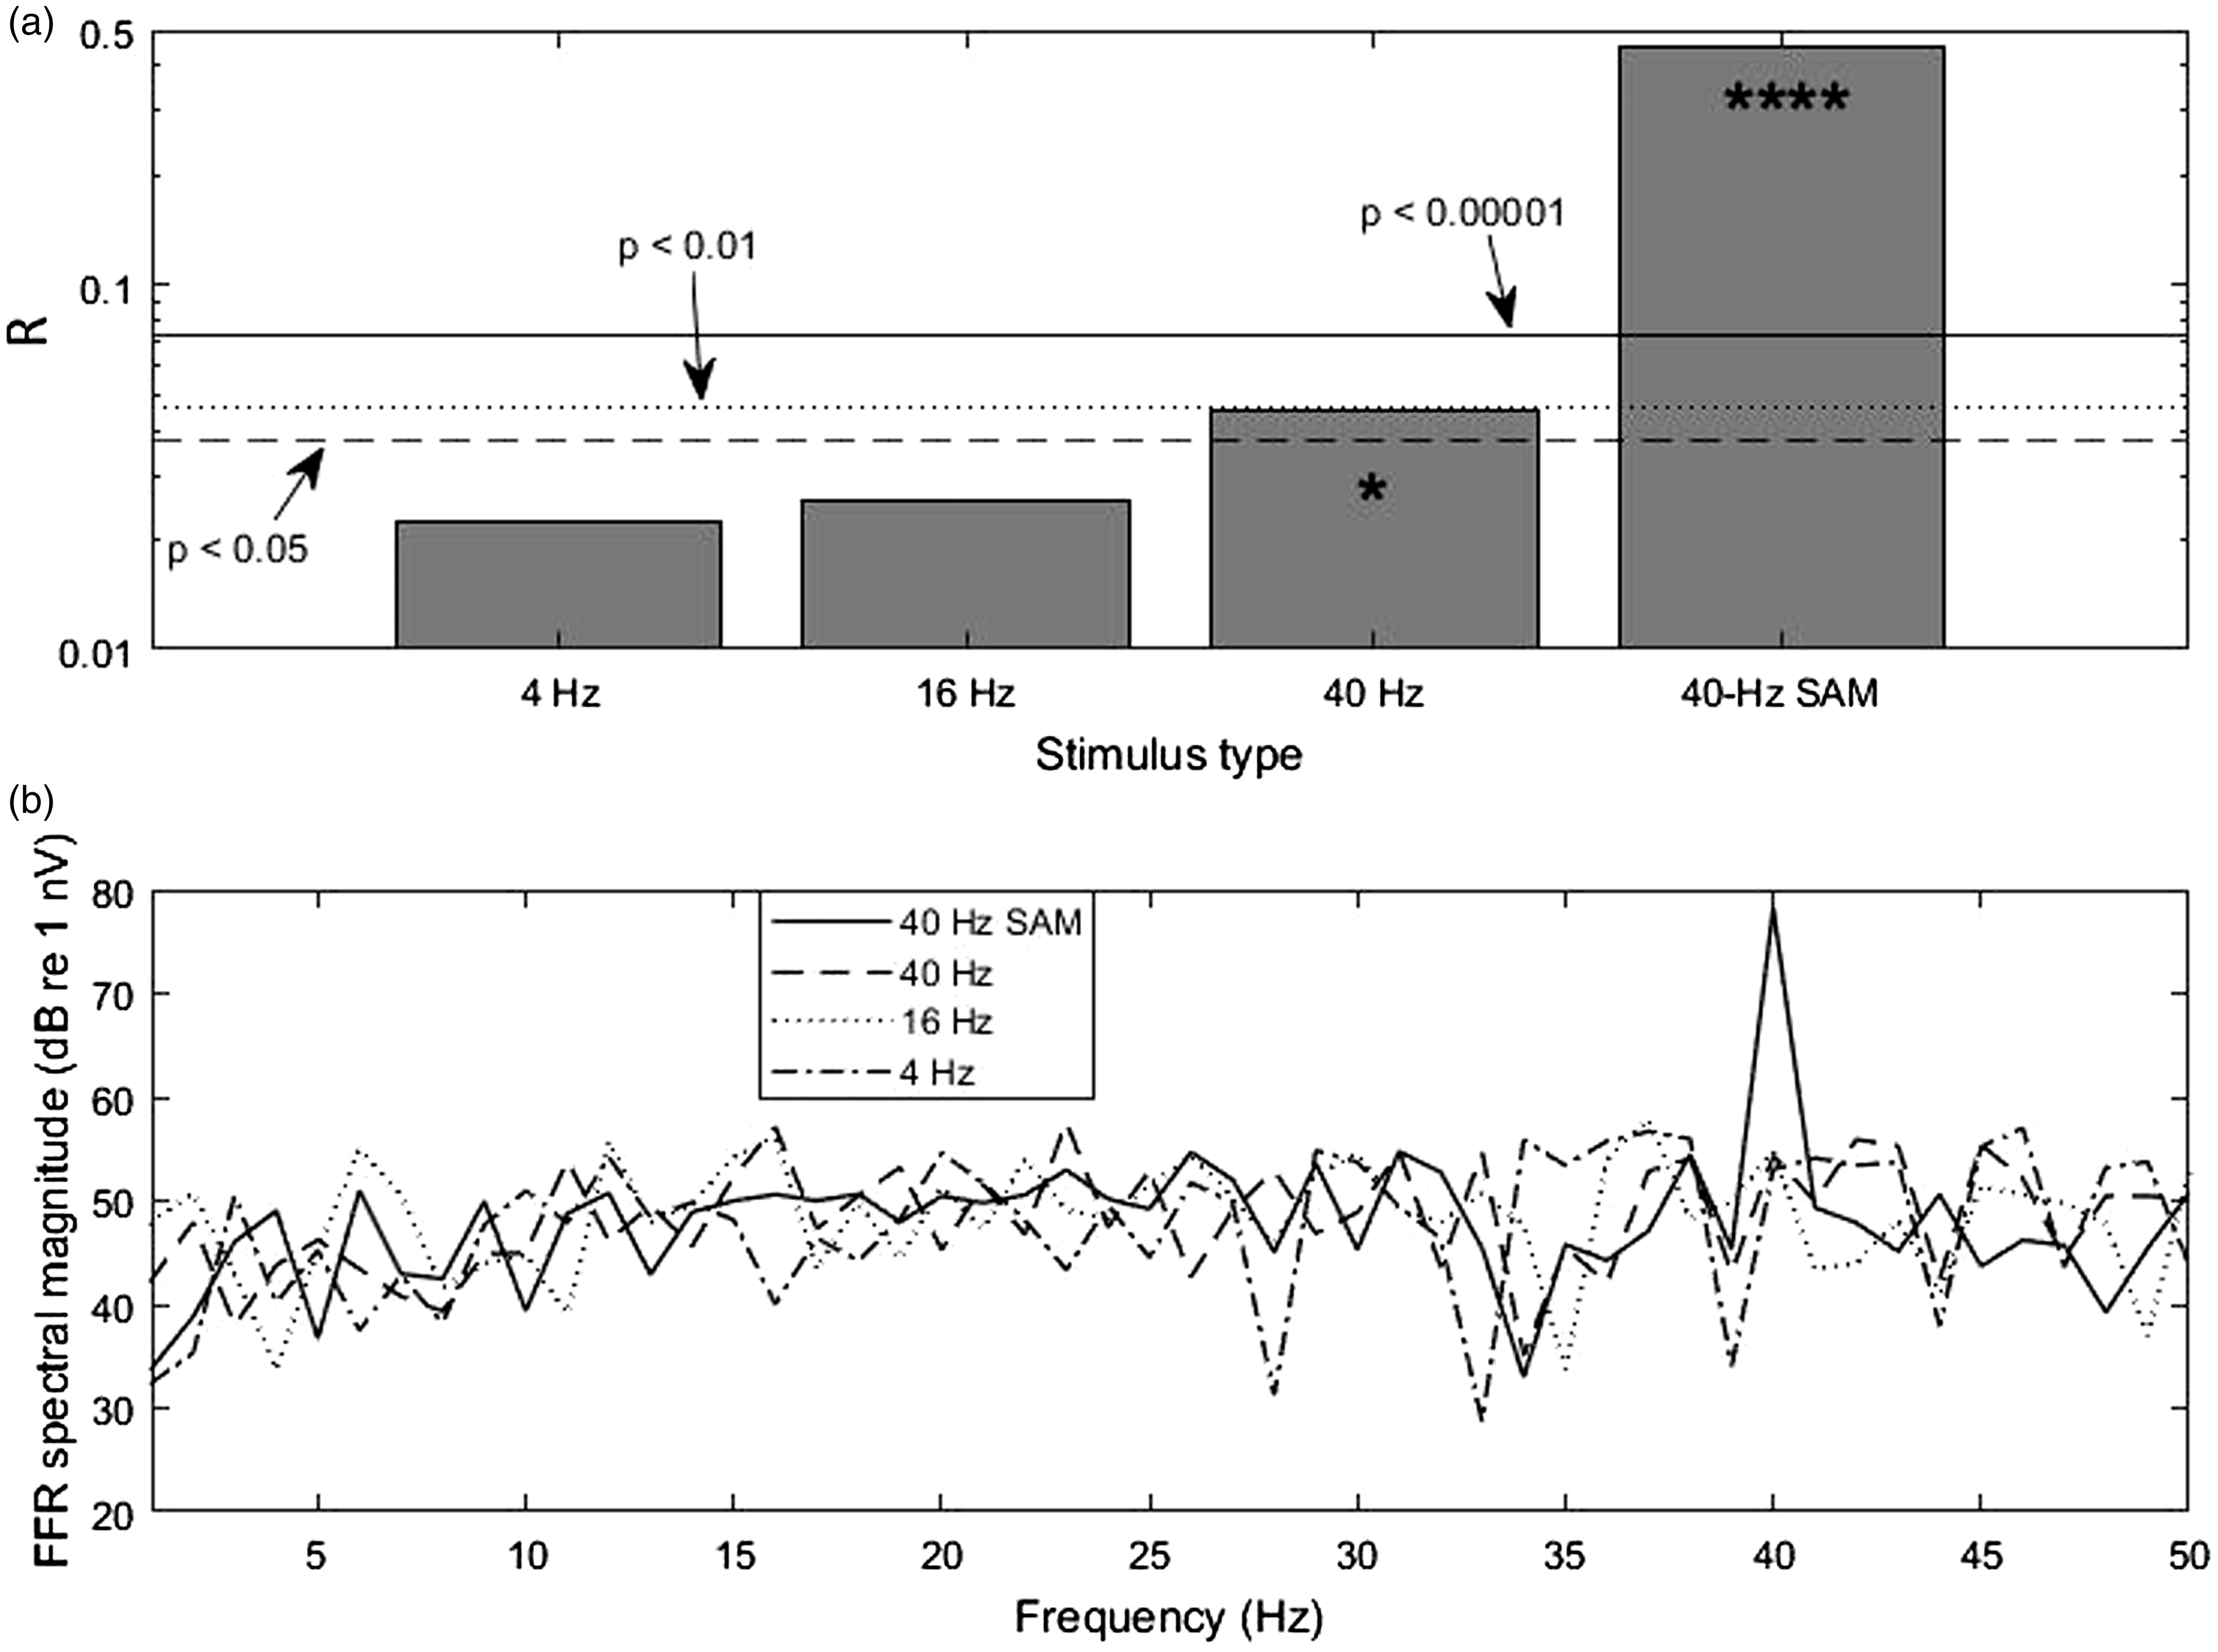
(a) R-values obtained from the combined trials of the subset of 18 subjects (N = 18 × 120 = 2160) that had p ≤ 0.01 for both transient and SAM stimulation (for individual significance data see Table 1). Critical R-values are shown with horizontal lines (* denotes p < 0.05 while **** denotes p < 0.00001; significance was calculated for 2160 trials). (b) The average spectra of the recorded signals show that the myogenic noise floor remained rather constant below 40 Hz. Only data from the 18 subjects used for panel A were averaged. Note that only the average spectrum of the response to the 40-Hz SAM stimulus showed a clear response peak.
Overall, for LF/IS stimulation there are only two cases where p < 0.01. Considering that the total of measurements with pure tones is n = 90, there is a binomial probability of ∼ 17% for these two cases to occur simply by chance. In other words, these cases might be dismissed, being due to random myogenic noise reaching the R-value required for p < 0.01. On the other hand, there are overall nine cases with p < 0.05, and the binomial probability for this is only ∼2%, indicating it is rather unlikely that these values of the R-statistic arose just by chance. It is therefore possible that some degree of phase locking to the pure tones occurred. A puzzling case is that of S2L, that presented a highly significant cVEMP to 16-Hz, but not to 40-Hz pure tone stimulation (but both transient and SAM stimulation yielded significance, see Table 1). It is possible that S2’s left inner ear was abnormal in a way, which made the subject’s saccule particularly sensitive to infrasound with frequencies around 16 Hz. Indeed, a recent model predicts an increased transmission of infrasound into the vestibular system in human ears with superior canal dehiscence (SCD). 41 A lower than normal VEMP threshold has already been observed with 500-Hz transient stimulation in patients with SCD. 42 As this syndrome has an estimated prevalence of one in 33 people, 43 the case of S2 would be in line with reports of a small percentage of people presenting motion-sickness symptoms when exposed to infrasound. However, S2 did not report such experiences. Unfortunately, the subject was not available for a re-test to confirm this significant cVEMP.
It may be argued that the notably lower amount of significant cVEMPs for LF/IS stimulation occurred because of muscle fatigue,44,45 as this stimulation type was tested towards the end of the sessions. However, there are two reasons why we think this was not the case: (1) The EMG noise-floor mean spectral levels (see Figure 7) were similar across all conditions. A decreased muscle tension due to fatigue would have led to a level decrease for the affected condition(s).46,47 The stability in EMG noise floor was observed when considering not only the significant ears but also when including all ears, with mean spectral levels (5–200 Hz) of 38.2, 40.1, 39.4, 39.5 dB re 1 nV for SAM, LF/IS 40-Hz, 16-Hz and 4-Hz, respectively. As the transient cVEMP contains spectral energy spread below about 150 Hz, a mean spectral level of 21.7 dB was obtained between 150 and 500 Hz, which was nearly the same as the 22 dB obtained for the SAM condition in the same frequency range. Considering subsequent LF/IS conditions measured for the right ear – in the order 40–16–4 Hz – their mean levels (5–200 Hz) were respectively 43.5, 42.9, 42.9 dB, which are stable within 0.6 dB; left-ear measurements done in order 4–16–40 Hz, had respective EMG levels of 41.9, 42.1, 42.1 dB (within 0.2 dB), with their mean being within 1 dB of mean right-ear levels. (2) For each condition, the number of significant ears (Nsig) was similar or at least not systematically lower for left ears than right ears (these were measured in order right-left; for Transient, SAM, and all LF/IS, Nsig was respectively 14, 12 and 3 for right ears and 11, 12 and 6 for left ears). The breaks of at least 2 min (and more if subjects required) between each measurement and the young subject group (20–29 years) is the likely reason for not observing effects of muscle fatigue in our data.
Considering the subject population as a whole, it is fair to say that (at least for the tested levels) the R-values systematically decline with decreasing pure-tone frequency (summarised in Figure 7(a)), which itself is a sign of decreasing SNR. Since the spectral amplitude of the baseline myogenic noise remains rather constant below 40 Hz (Figure 7(b)), the decline in R-value indicates that, if the pure tones indeed evoked a cVEMP, the myogenic signal is definitely not getting stronger as the stimulation frequency approaches the infrasound range. This challenges the idea that the vestibular system of normal inner ears is particularly sensitive to infrasound and that its activation by airborne infrasound might underlie the negative symptoms reported by complainants about wind turbine noise (e.g., see Schomer et al.24).
Conclusions
The fact that a 500-Hz tone with 40-Hz amplitude modulation evoked an EFR confirms that the SCM can follow such fast stimulation. However, our extension of this FFR method to pure-tone stimulation provided little evidence that those stimuli with frequencies ≤ 40 Hz are able to elicit a cVEMP. Admittedly, the sound pressure levels applied in our LF/IS experiments might be too low to elicit a cVEMP, and our finding might have been positive with stronger pure-tone stimulation. However, our applied loudness levels (estimated between 80 and 90 phon) were already much higher than those connected with occurrences of the “wind turbine syndrome” and other common complaints about infrasound. We therefore conclude that the saccule, which is assumed to be the primary source of activation for cVEMPs, 4 seems to be rather insensitive to airborne infrasonic stimulation, or at least, if it does respond to this kind of stimulation, it does not evoke a cVEMP. As the present study focused on collecting cVEMPs, it is still an open question for future studies whether infrasound can activate the utricle, which evokes oVEMPs, 5 or if infrasound can activate the semicircular canals. Further, there is also the possibility that the otolith organs of abnormal inner ears, for example with semi-circular canal dehiscence, might be more sensitive to infrasound.41,48,49 We assumed in our study that our subject population presented normal inner ears. However, it may be that the highly significant 16-Hz cVEMP observed in S2L is an example of a small percentage amongst the population having abnormal inner ears, with a saccule more sensitive to specific infrasound frequencies.
Similarly, we cannot exclude that whole-body exposure to infrasound can lead to structural accelerations similar to those under bone-conducted stimulation, as used by Todd et al.,11 who showed sensitivity of the otoliths to low-frequency and infrasonic bone vibrations as evidenced by oVEMPs. However, we doubt that airborne infrasound, at the intensity levels produced by wind turbines, can produce head accelerations at a similar scale to those evoked by bone vibrators.
Footnotes
Acknowledgements
The authors would like to thank Agnes Koller for her help with the data collection and Jaime Undurraga for providing the script to generate the stimuli and trigger.
Declaration of conflicting interests
The author(s) declared no potential conflicts of interest with respect to the research, authorship, and/or publication of this article.
Funding
The author(s) disclosed receipt of the following financial support for the research, authorship, and/or publication of this article: We thank the funding received from the EARS II project (European Metrology Programme for Innovation and Research (EMPIR), grant number 15HLT03). EMPIR is jointly funded by the EMPIR participating countries within EURAMET and the European Union. C.J also thanks Universidad de Las Américas for supporting the completion of this article.