
Abstract
Helmholtz resonators are widely applied in industries to reduce the transmission of unwanted noise and passively attenuate tonal noise in pipes/ducts. For example, internal combustion engines take advantage of Helmholtz resonators by combining air box, subwoofers and perforated pipes/plates to reduce engine noise emission nowadays. However, the main drawback of the conventional Helmholtz resonators includes a very narrow bandwidth. To broaden the effective noise damping frequency range of Helmholtz resonators, a number of different improved designs are reported and tested recently in the literature such as applying an array of separated resonators or implementing mechanical-coupled Helmholtz resonators. In this work, we conduct a brief review on the aeroacoustics damping performance of coupled Helmholtz resonators over low frequency range. The noise damping performances could be characterized and quantified in terms of transmission loss and sound absorption coefficient. Both definitions are discussed. Comparison is then made between the separately working resonators and the mechanical-coupled ones. This is achieved by replacing the sharable flexible sidewall with a rigid sidewall. The effect of the mean grazing flow is also discussed and examined on the noise damping performances. An experimental case study of the present authors is included. Additionally, to improve the noise damping performance further, an overview of the resonators neck with different noise damping materials inserted is conducted. Finally, 3D numerical approaches in simulating the aeroacoustics damping performances of coupled Helmholtz resonators are reviewed. This case study and brief overview provides a guidance on improving the design of coupled Helmholtz resonators and an array of Helmholtz resonators.
Keywords
Introduction
Undesirable engine noises1–3 could be attenuated by applying Helmholtz resonators.4–6 A Helmholtz resonator7–10 has a shape resembling a beer bottle, containing an enclosed volume of air,11,12 which communicates with the engine pipe via a small opening/neck.13–15 The cavity volume air may resonate at its natural resonant frequency.16–18 It depends on the cavity volume and the geometry area of the neck/opening. At resonance, the combustion noises19–23 could be significantly attenuated by the thermos-viscous effect 24 and vortex shedding 25 across the neck of the resonator. The resonators’ damping performance is dramatically deteriorated at a far off-resonant frequency.26–28 To improve the resonators’ noise damping performances over a broad frequency range, actively passive control of acoustic damper such as Helmholtz resonators or perforated liners29,30 could be applied to tune the resonant frequency of the acoustic dampers in real-time. In this way, it enables acoustic damper corresponding to the operating condition changes of the engines.31–34
Helmholtz resonators4,5,8 have a wide application in air-breathing engine industries, such as gas turbine engines 11 and internal combustion engines. 12 Extensive research16–18 has been conducted to optimize the design and the acoustic noise damping performance of such resonators at a low frequency range, typically below 800 Hz.3,12,18 It is possible that a Helmholtz resonator35–37 is mechanically coupled with a flexible membrane additionally, which can be used as a coupling sidewall/element to improve the transmission loss38,39 and stabilize combustion systems.40,41 Previous experimental and numerical studies42–45 have shown that Helmholtz resonators could be applicable for sound absorption46–49 over large bandwidths provided multiple resonators that tuned in different frequencies;50–55 Helmholtz resonator allows narrow frequency bandwidth with high transmission loss.56–62 Besides, estimated transmission loss63–66 can be improved by inserting acoustic porous materials. 4 Fibreglass is a porous material with good sound absorption and low transmission losses 5 . Thus, it is imperative to analyse the fundamental approaches in three parameters: (1) acoustic materials properties, (2) coupling mechanism in experimental set-up and (3) frequency variation applied on Helmholtz resonators.67–73 In this work, we conduct experimental case studies on investigating acoustic damping performances of coupled Helmholtz resonators in different shapes over the low frequency ranges. Here we also consider the effects (1) acoustic porous materials, (2) the grazing flow Mach number. This is aimed to identify the optimum design for combustion engine applications 74–85. Before the case study is presented, it would be informative to overview of theoretically predicting the resonant frequency of Helmholtz resonators and characterizing the resonator’s acoustic damping performances in various ways.
Overview of Helmholtz resonators and characterizing resonator’s aeroacoustics damping
Overview of the noise damping mechanism and resonant frequency of Helmholtz resonators
Review of noise damping mechanism of conventional Helmholtz resonators
The acoustic damping mechanism86–88 of Helmholtz resonators consists of the conversion of acoustical energy into vortical energy. They are also known as linear and nonlinear damping mechanism. Incident large-amplitude sound waves interact with the shear layers formed at the resonator neck rims. It is subjected to acoustic pressure fluctuations. The shear layers destabilized to form vortex rings. The vortices are then dissipated with insignificant broadband sound production. As long as certain frequencies, depending on the operating and geometrical characteristics, the incident acoustic waves could be almost completely attenuated by the resonator compared by a resonant cavity and a neck.
Helmholtz resonator89–91 is a specially built damper, which is enabled to observe resonant response at specific frequencies when subject to external vibration. The volume of the resonator V, neck area S and length L determine the frequency subject to resonation in constructing the Helmholtz resonator

The necks of Helmholtz resonators allow air to radiate, which contributes to resistance flow against the downstream flow, when sound is propagated from the source. This is defined as the radiation resistance,
The stiffness of the system is obtained by modelling the neck to be a vibrating piston. When the piston is compressed inward by x-distance, the volume of the resonator is changed, and the pressure is varied as


To maintain the displacement, x, the force, f is needed, where f =SP=sx; s is the effective stiffness, that is, given as

The wall resistance and the radiation resistance provide the total resistance against downstream propagation. These downstream waves have an instantaneous complex component, which acts on the resonator opening. This is modelled by

The differential equation resulted from manipulating equations (11)–(13) is given as

Since the resonator97–101 input mechanical impedance is


Equation (8) is valid for any shape, as long as the length constraints are much smaller than a single wavelength, and the neck is not too large.
Review of coupled Helmholtz resonators
Conventional Helmholtz resonators are highly effective over a narrow frequency band only to reduce the transmission of wanted noise.
4
This limits its application in practice due to the narrow bandwidth and the ineffectiveness on attenuating acoustic disturbances of varying frequencies. In order to broaden the frequency bandwidth of the noise attenuation, and to be adaptive to dissipate acoustic perturbations of varying frequency, coupled Helmholtz resonators were designed and proposed. The first mechanical-coupled Helmholtz resonators were proposed by Griffin and his co-workers
4
about 2 decades ago. Other designs of coupled Helmholtz resonators and the tests63–69 have shown that flexible membrane-coupled Helmholtz resonators could be effective over a wider frequency bandwidth. And the resonant frequencies are altered
73
due to the dynamic variation of the cavity volume resulting from the incident large-amplitude sound waves. As revealed in equation (8), the conventional resonators cavity volume V=constant. However, the flexible membrane will lead to the volume fluctuating V≠const. This is periodic pressure fluctuations in the cavities of the coupled Helmholtz resonators. This is confirmed in the experimental test.
73
When a thin elastic membrane is stacked between two resonators connected in parallel, it leads to more attenuation of the unwanted sound over a wider frequency bandwidth. Some noise damping materials are filled in the necks of the resonators, enabling to evaluate the transmission loss in the coupled Helmholtz resonators. The model illustrated in Figure 1 shows how the coupled resonators are connected with a closed-end and open-end air space along the air duct downstream. Mechanically modelled coupled resonator structure.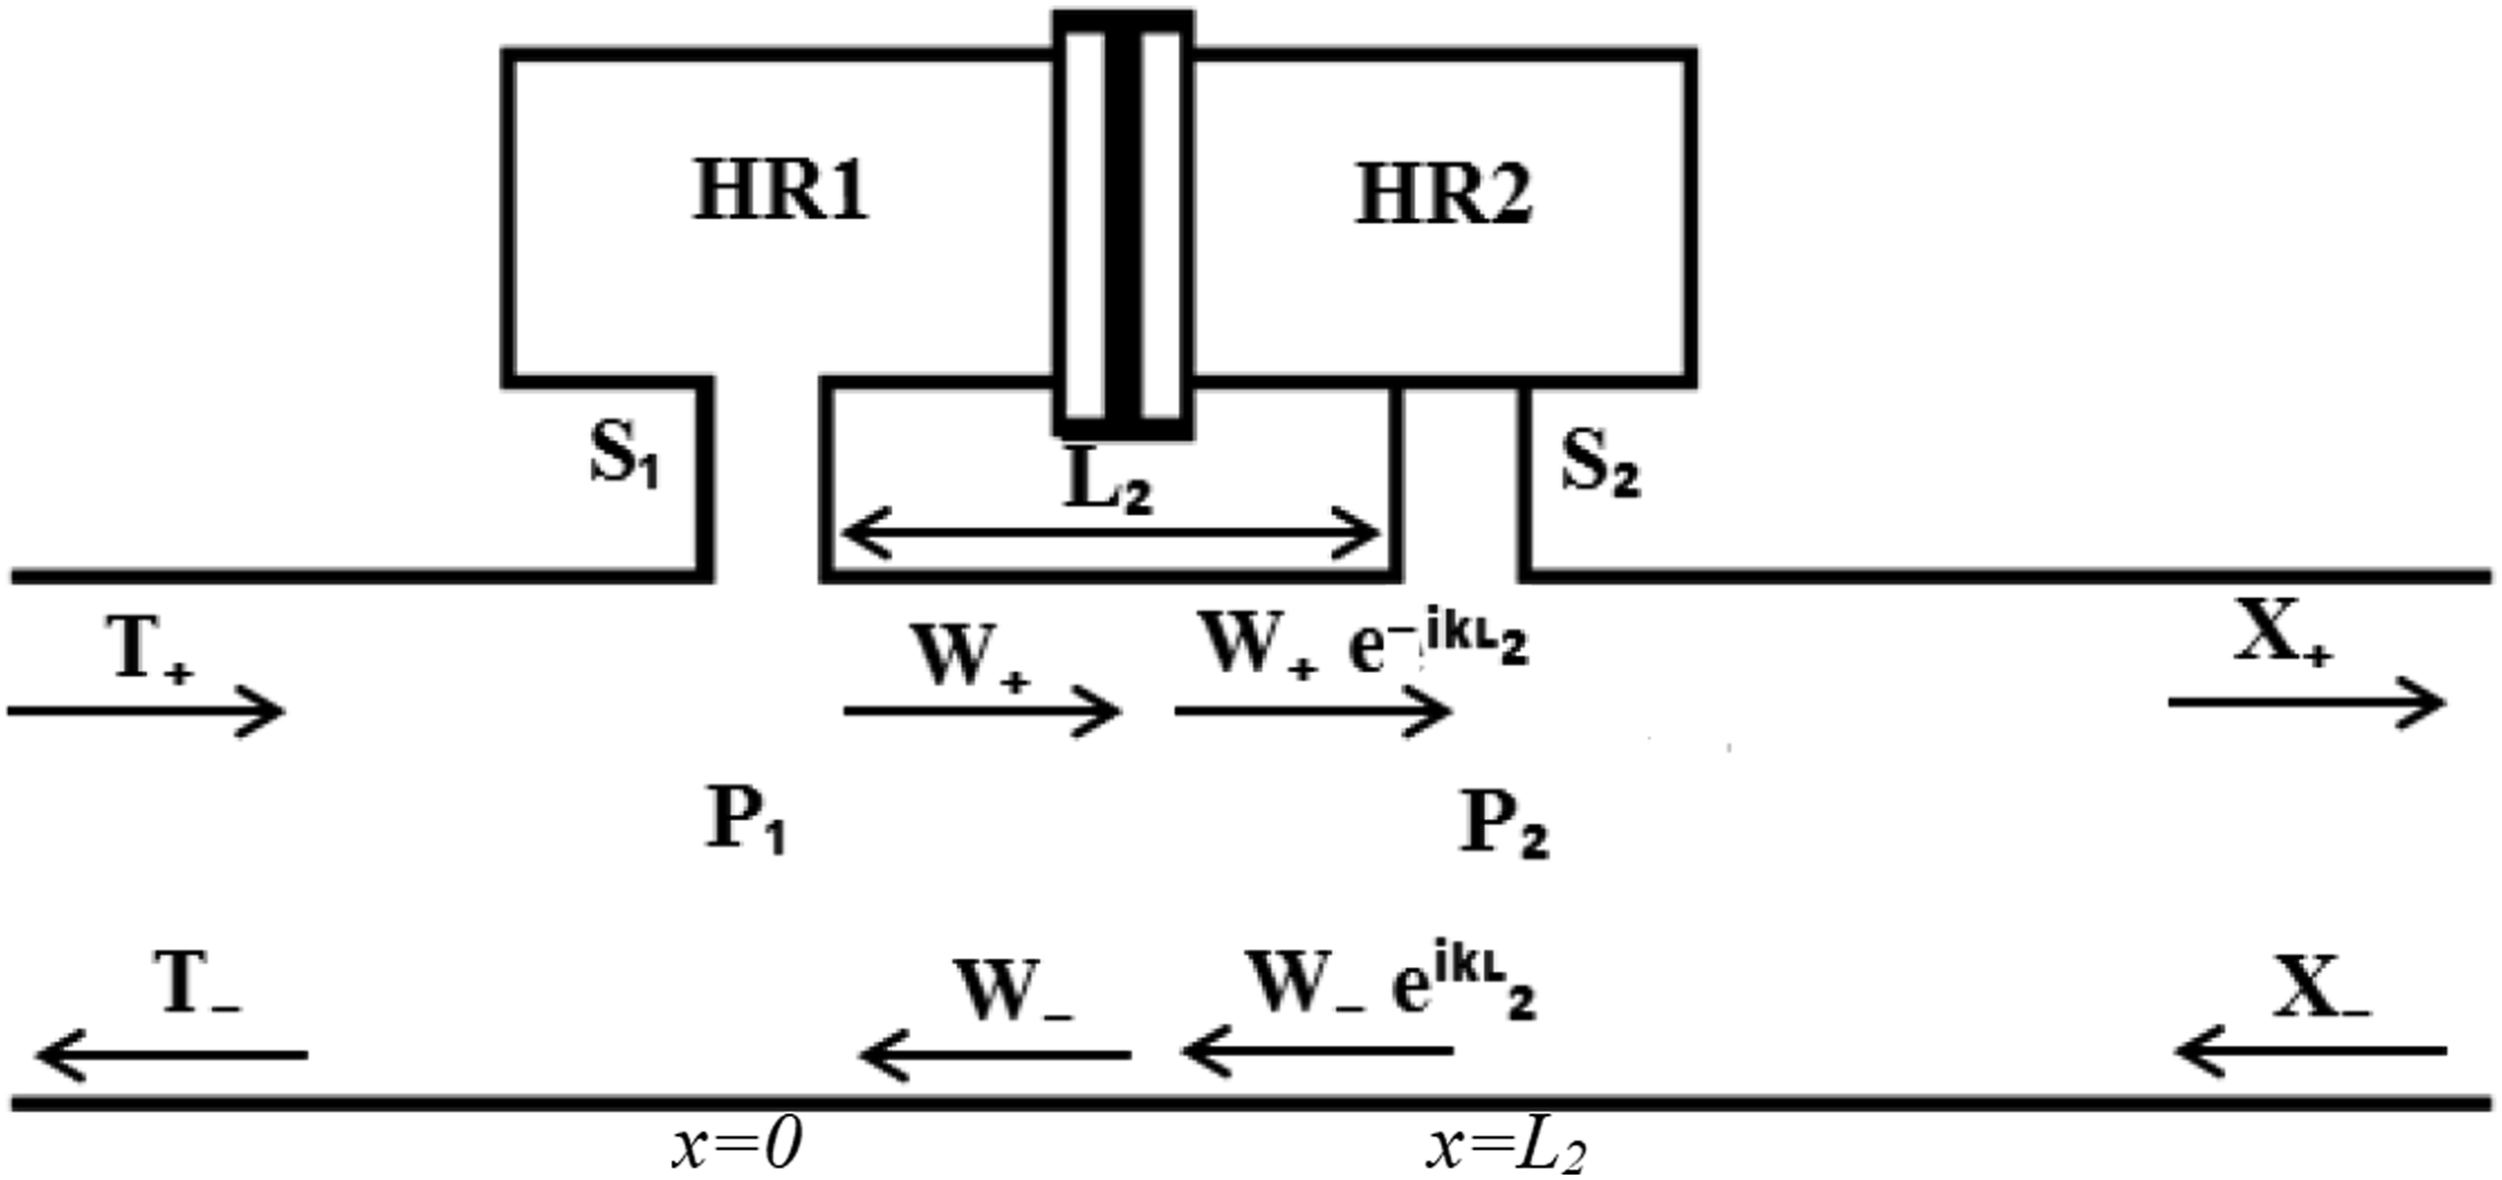
In this duct, the problem is modelled in a classical mechanical style, dealing with the actual physical displacement of air within the duct and resonators as well as the membrane. Since the complex pressures of the propagating and reflected waves have already been modelled in Appendix equation (49) and the respective quantities of the resonators have been indicated, we shall use the same terminology in this description as well. However, since the experimental tests have been conducted in an anechoic chamber, we shall assume that the reflected wave coefficient,
The system deals with the actual movement of air in the resonator, the rectangular-shaped duct and the membrane. Equation (47) demonstrates the pressure acted by the reflected waves, propagating waves as well as the resonators; thus, the same terminology has been applied. Nevertheless, the reflected wave coefficient, X₋ is assumed to be zero due to the echo-free chamber, in which either sound or electromagnetic waves are absorbed to insulate from exterior noise sources. Another assumption has been made at low frequencies; the pressure in the duct is expressed as such, where the quantities are defined in Appendix 1; L₂ is the distance between two resonators


The conservation of the volume of velocity is applied below at any values of the resonant frequencies at Helmholtz resonators as


The motions of each individual resonator can be mathematically described as follows


Characterizing Aeroacoustic Damping Performances of Helmholtz resonators
Definition of transmission loss
Sound waves travel spherically from a point source of the sound, and when it does, it becomes less intense. This is because with a source emitting constant power, the area of the surface of the sphere increases; thus, the sound intensity at any point on the sphere must decrease. Transmission loss occurred, when there is a loss in sound intensity due to the opposing wave propagation from the source to the downstream. Sound pressure is inversely proportional to the distance from the source, as long as the sound does not encounter any obstacles.
The experimental tests mainly focus on the sound transmission loss, geometry differences and the damping materials’ behaviour affecting the Helmholtz resonators. Different methods are introduced to find out the acoustic properties and their behaviours in the system. In the previous researches,54,76 one used the standing-wave-ratio (SWR) method to measure the maximum and the minimum values in the standing wave tube by mobilizing the microphone at different positions. The applied method requires a minimum distance of one wavelength design test tube, whereas the lower frequencies are not suitable for this application according to λ= v/f 53 . The accuracy is unlikely to be improved if the uncertainty of the first minimum position is unable to determine, and errors would be introduced. Additionally, the aspect of the diameter and displacement of the microphone is limited in the SWR method, where a large diameter is advisable.
Incident and reflected acoustic impulses can be separated to determine the acoustic properties of the system in a long tube. A microphone is assembled at the origin, where the tube has to be significantly long enough so that the total duration of the time is sufficient for the sound waves to propagate from upstream to downstream and to reflect back to the origin. The properties of the system would be able to identify through the values obtained from the sound magnitude and phase. In order to have the whole system work correctly, the tube can’t be excessively long because the dissipation will contribute to the major issue during the experimental tests. 53 However, the experimental tests were conducted using six microphones. Three of them are located upstream, and the remaining 3 microphones are placed downstream to determine the impact of the acoustic properties filled with noise damping materials in Helmholtz resonators. Upstream microphones are to collect data from the incident and reflected waves to determine the reflection coefficient, the sound absorption coefficient and transmission loss.
Theory of transmission loss
Following equation (47), the pressure of a harmonic wave propagating in an air duct is expressed as a function of distance, x. The equation can be described further with cross- and auto-spectral densities as


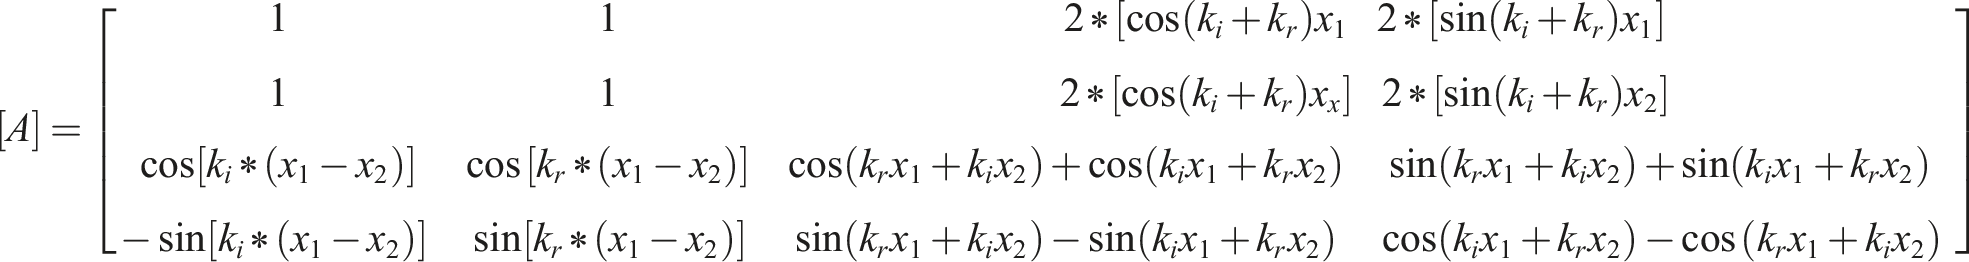
By merging equations (9a), (9b) and (10), we can get equations that can be solved analytically via matrix manipulation for any two microphones. In our experimental test, the third microphone adds an additional data point that can be further used for averaging purposes for more reliable and repeatable results


The above equations can also be applied to microphones 1 and 3 by switching out microphone 2 with 3. All the quantities above are obtained from the recorded pressure data, and can be solved for


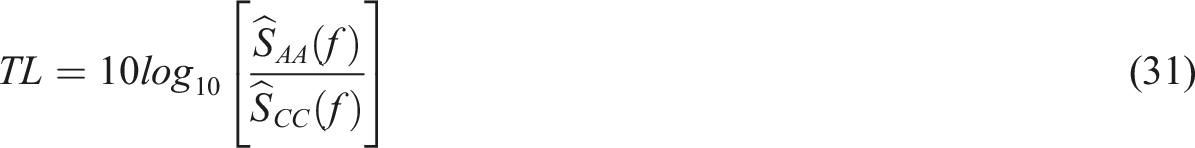
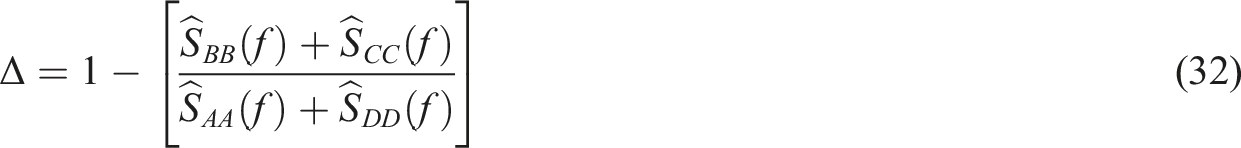
By combining equations (14)–(30), the pressure spectra of the upstream and downstream waves can be measured to determine the transmission loss. The experimental test was carried out in an anechoic chamber, assuming that there are no downstream reflected waves. Nevertheless, the transmission loss values of the sound wave propagating in the air duct in any geometrical form can be calculated using the following equations
Experimental case studies
Pressure sensors calibration
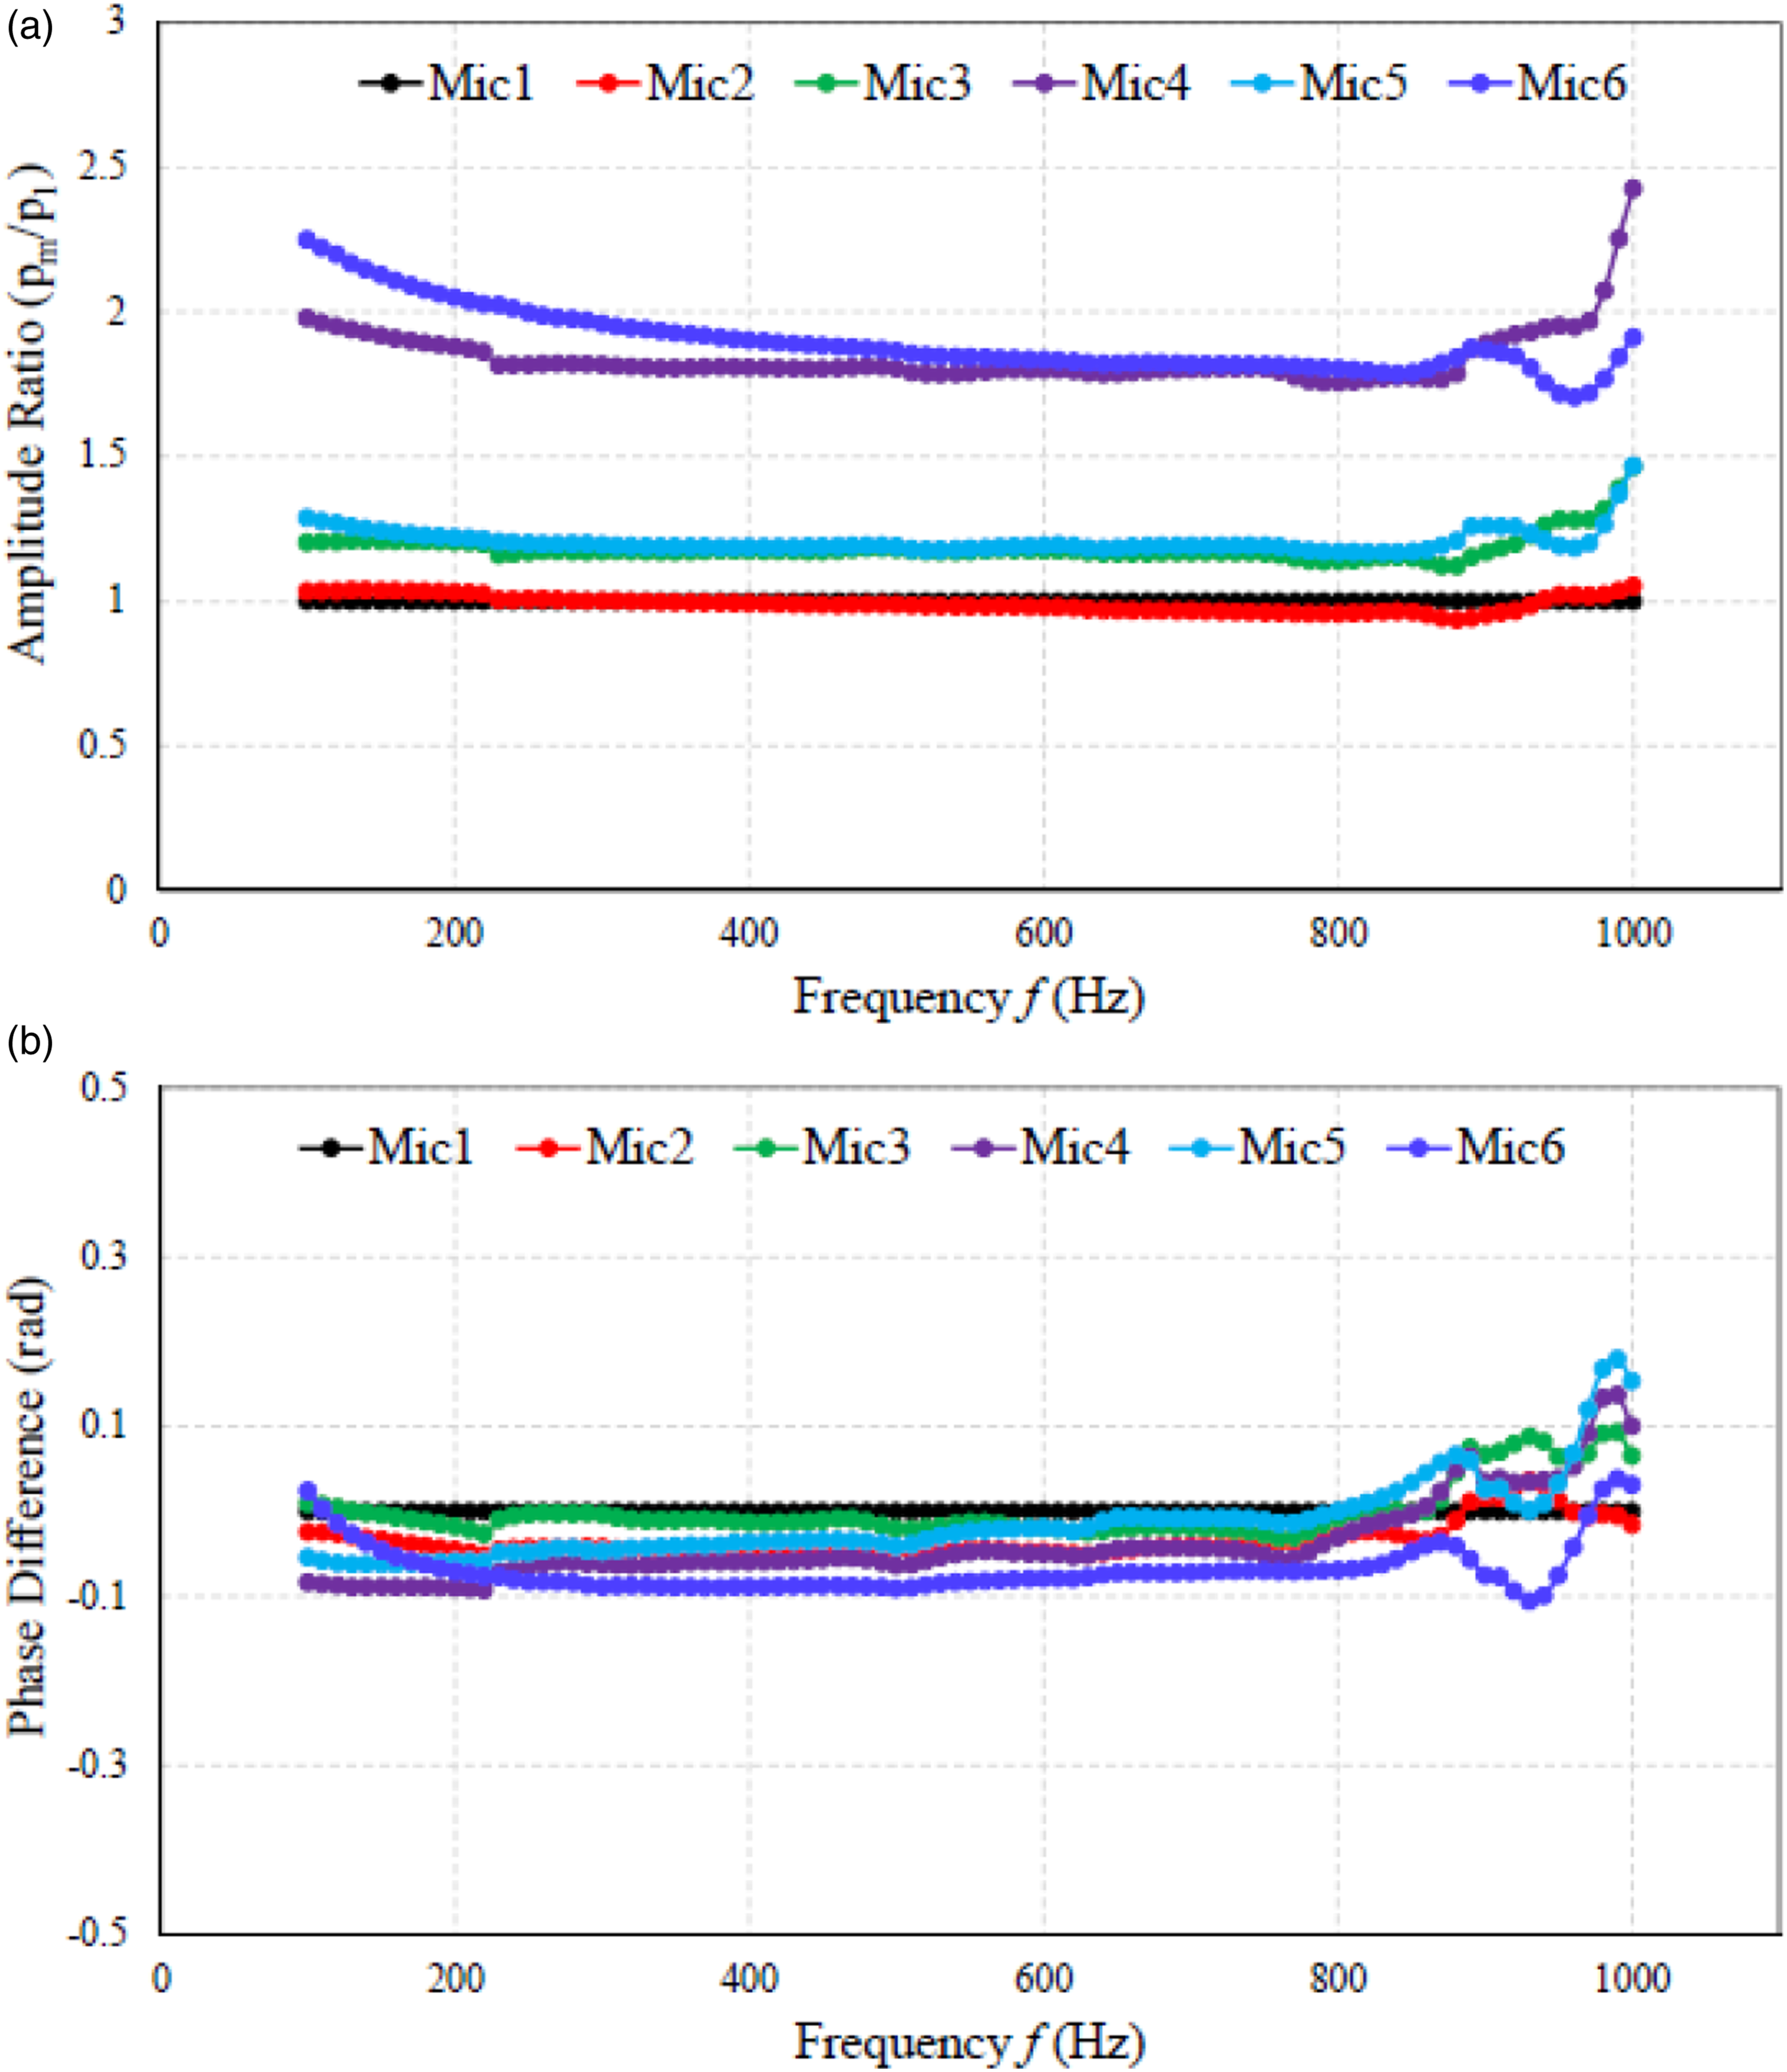
To demonstrate the procedures and quantify the aeroacoustics damping performances of coupled Helmholtz resonators, an experimental study 61 is conducted as a case study. Here, six microphones were distributed, three upstream and three downstream, and utilized in Helmholtz resonators attached to a pipe with a grazing flow present. The frequency response of each microphone (see Figure 3) would be slightly different depending upon the tolerances and manufacturability. Hence, the microphones are required to calibrate as an additional process prior to the experiments for reliability and repeatability. However, the difference of 4 dB is acceptable, as observed in the previous experimental studies.55,56,63
A calibration chamber (see Figure 2) was constructed with six holes circularly drilled inside where the microphones are flush-mounted for calibration. The box was designed and built in such a way that it is rigid and heavy enough to prevent the noise generated from structure vibration. Furthermore, the mounting position of the microphones and the loudspeaker are maintained at a constant distance for repeatability. Sound level metres were placed in the calibration chamber between the point of origin and the end of the test tube to measure the estimated loss of sound pressure level in decibels (dB). In addition, a power amplifier function generator, sound level metres, and a velocity test probe were used in the present set-up. Calibration box. Calibrated amplitude and phase ratio of the microphones used in experimental tests.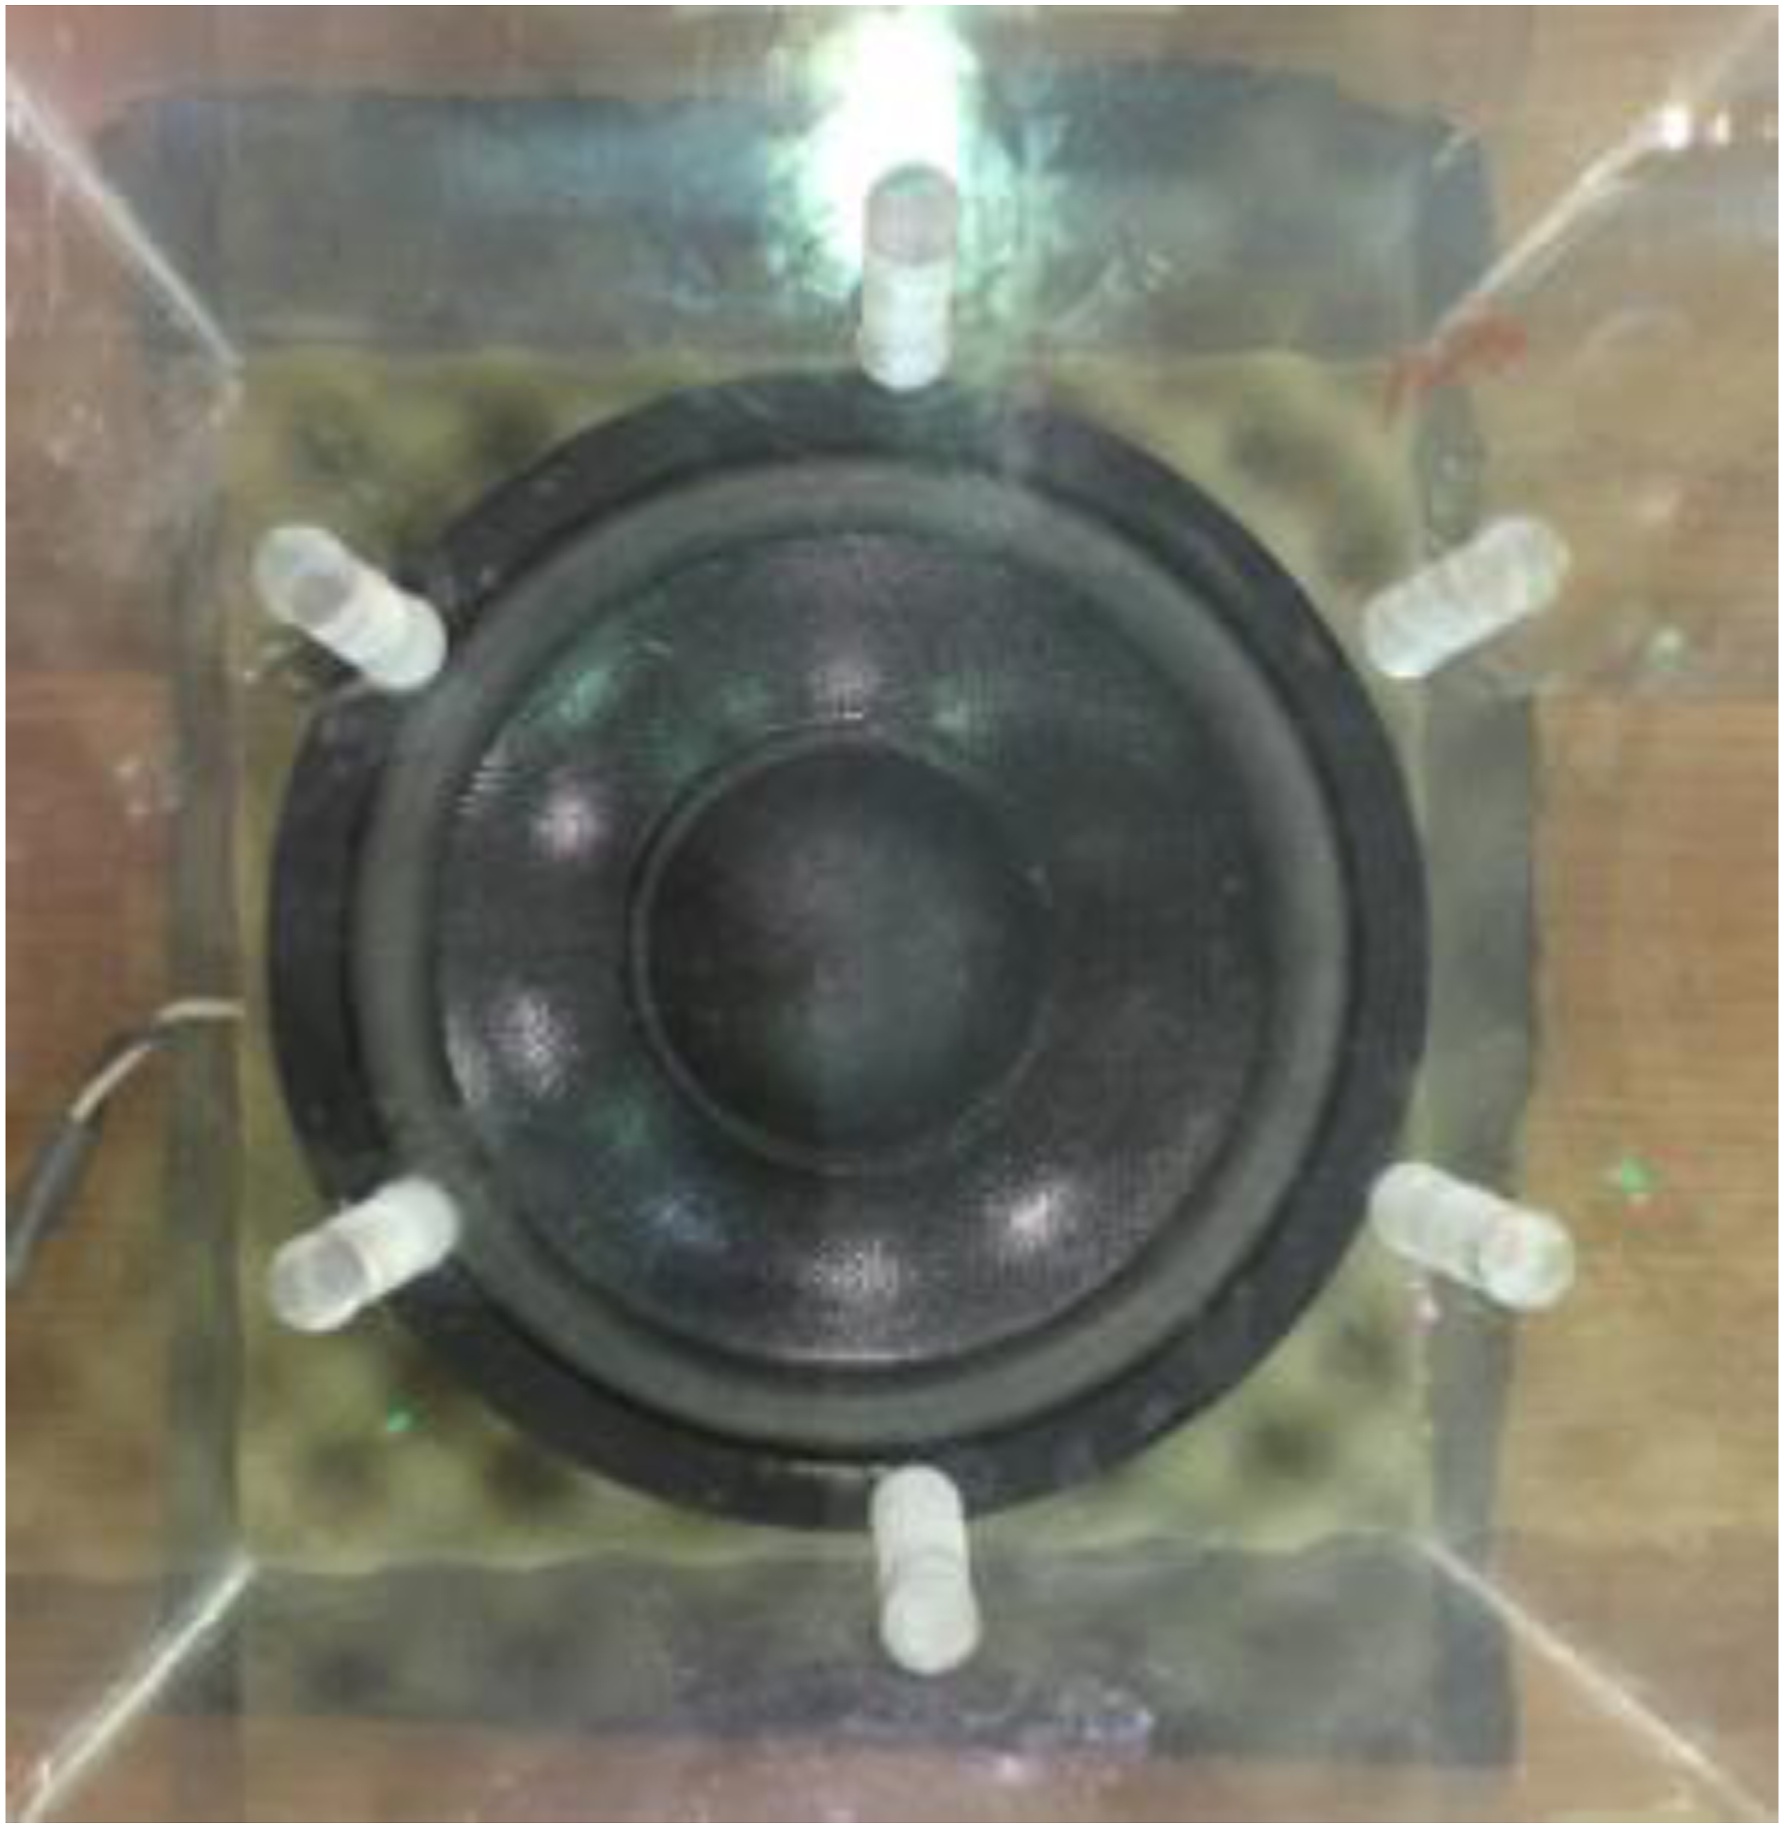
Theory of the classical two-microphone technique for determining TL
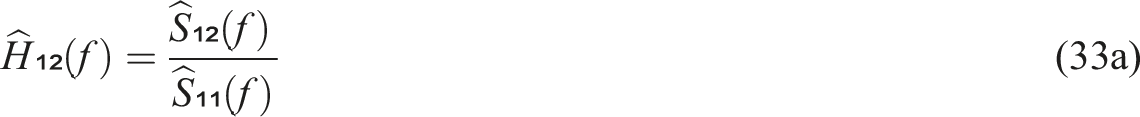
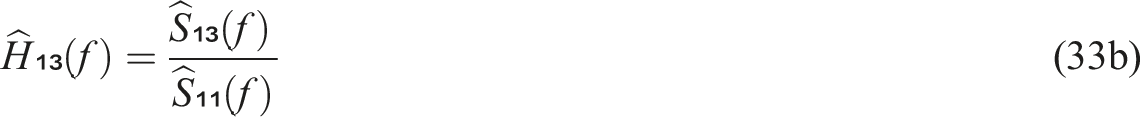
The distance between the microphones and the sound source is the most influential factor in the calibration process. Therefore, it is enabled to minimize any distance error with respect to the variation of the frequencies and wavelength as well as to ensure no distinct phase shift among microphones is observed. Hence, the magnitude difference in phase shift is concluded as the result of the mounting process. To avoid such scenario, the transfer function of the reference and the target microphones was kept as the execution of relative calibration. Each microphone will have a range of frequency response or transfer function, and the frequency responses for the second and third microphones with respect to the first microphone are written as
Mathematical computation of the transfer function between the second and third microphones is expressed as
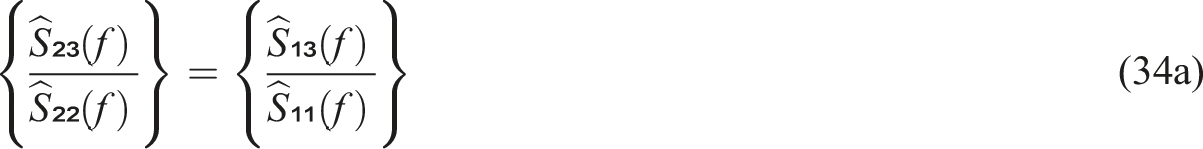
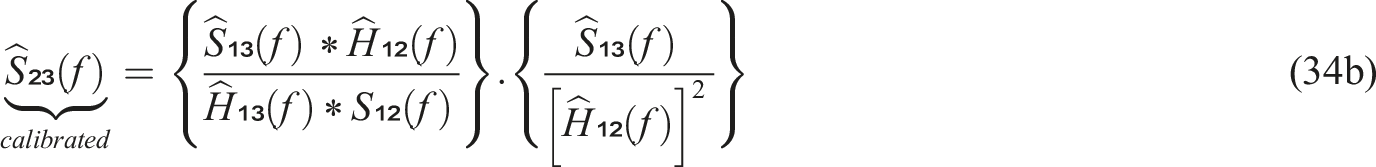
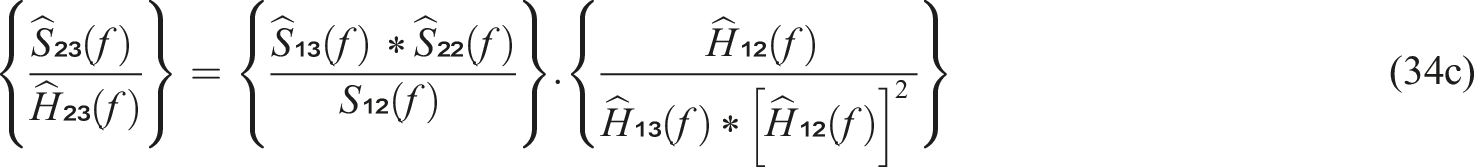
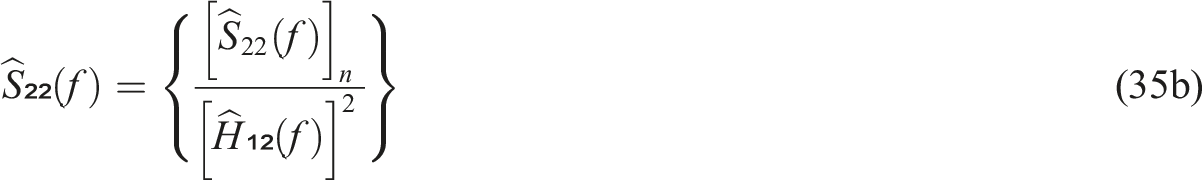
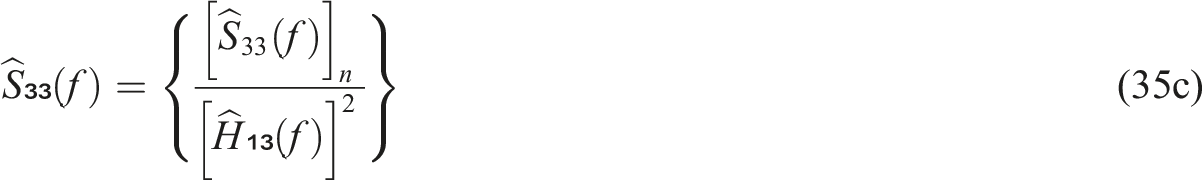
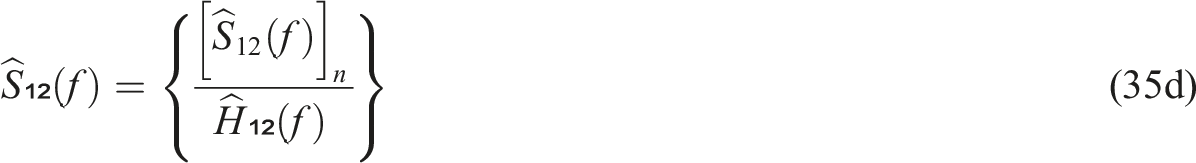
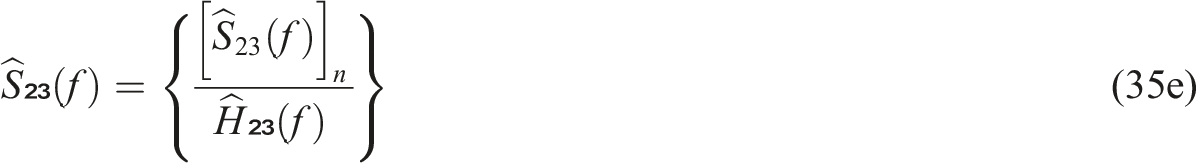
Therefore, the microphones can be calibrated using the frequency response function, with the first microphone being the reference. Raw data are collected, then normalized the ratio between the auto- and cross-spectral densities of the microphones to the first microphone at each frequency. From the equations below, n represents non-calibrated quantities and

Calibration results of the microphones
Acoustic pressure amplitude data was logged using LabView software, and the experiments were conducted in a non-echoic environment to avoid influences from external factors that could impact data collection. Once data were collected, the data processing was done in ‘MATLAB’ software, which is particularly implemented for calibration. Recorded pressure amplitude is reasonably acceptable, although there is a slight difference in magnitude, that is,
The minimal phase shift difference is seen between
Experimental set-up and tests
Overview of the experimental set-up and key test components
Coupled Helmholtz Resonators, shown schematically in Figure 4, are set up with the rectangular-shaped duct. There are two necking attached to the resonators and a membrane-embedded inside. Six microphone holding tubes are drilled, each 10 mm apart from the centre. The space for membrane mounting is available between two connecting resonators, and their necks are held tightly by bolts and nuts to prevent leakage. The chamber is connected to the boundary box, where the loudspeaker and air flow supply are mounted, as shown in Figure 4. The speaker is fixed at a place closest to the inlet duct, and the mean airflow is supplied into the chamber with a top acrylic lip, sealed with scotch tape to ensure that there is no air leakage during the experiments. Experimental set-up for Helmholtz resonators.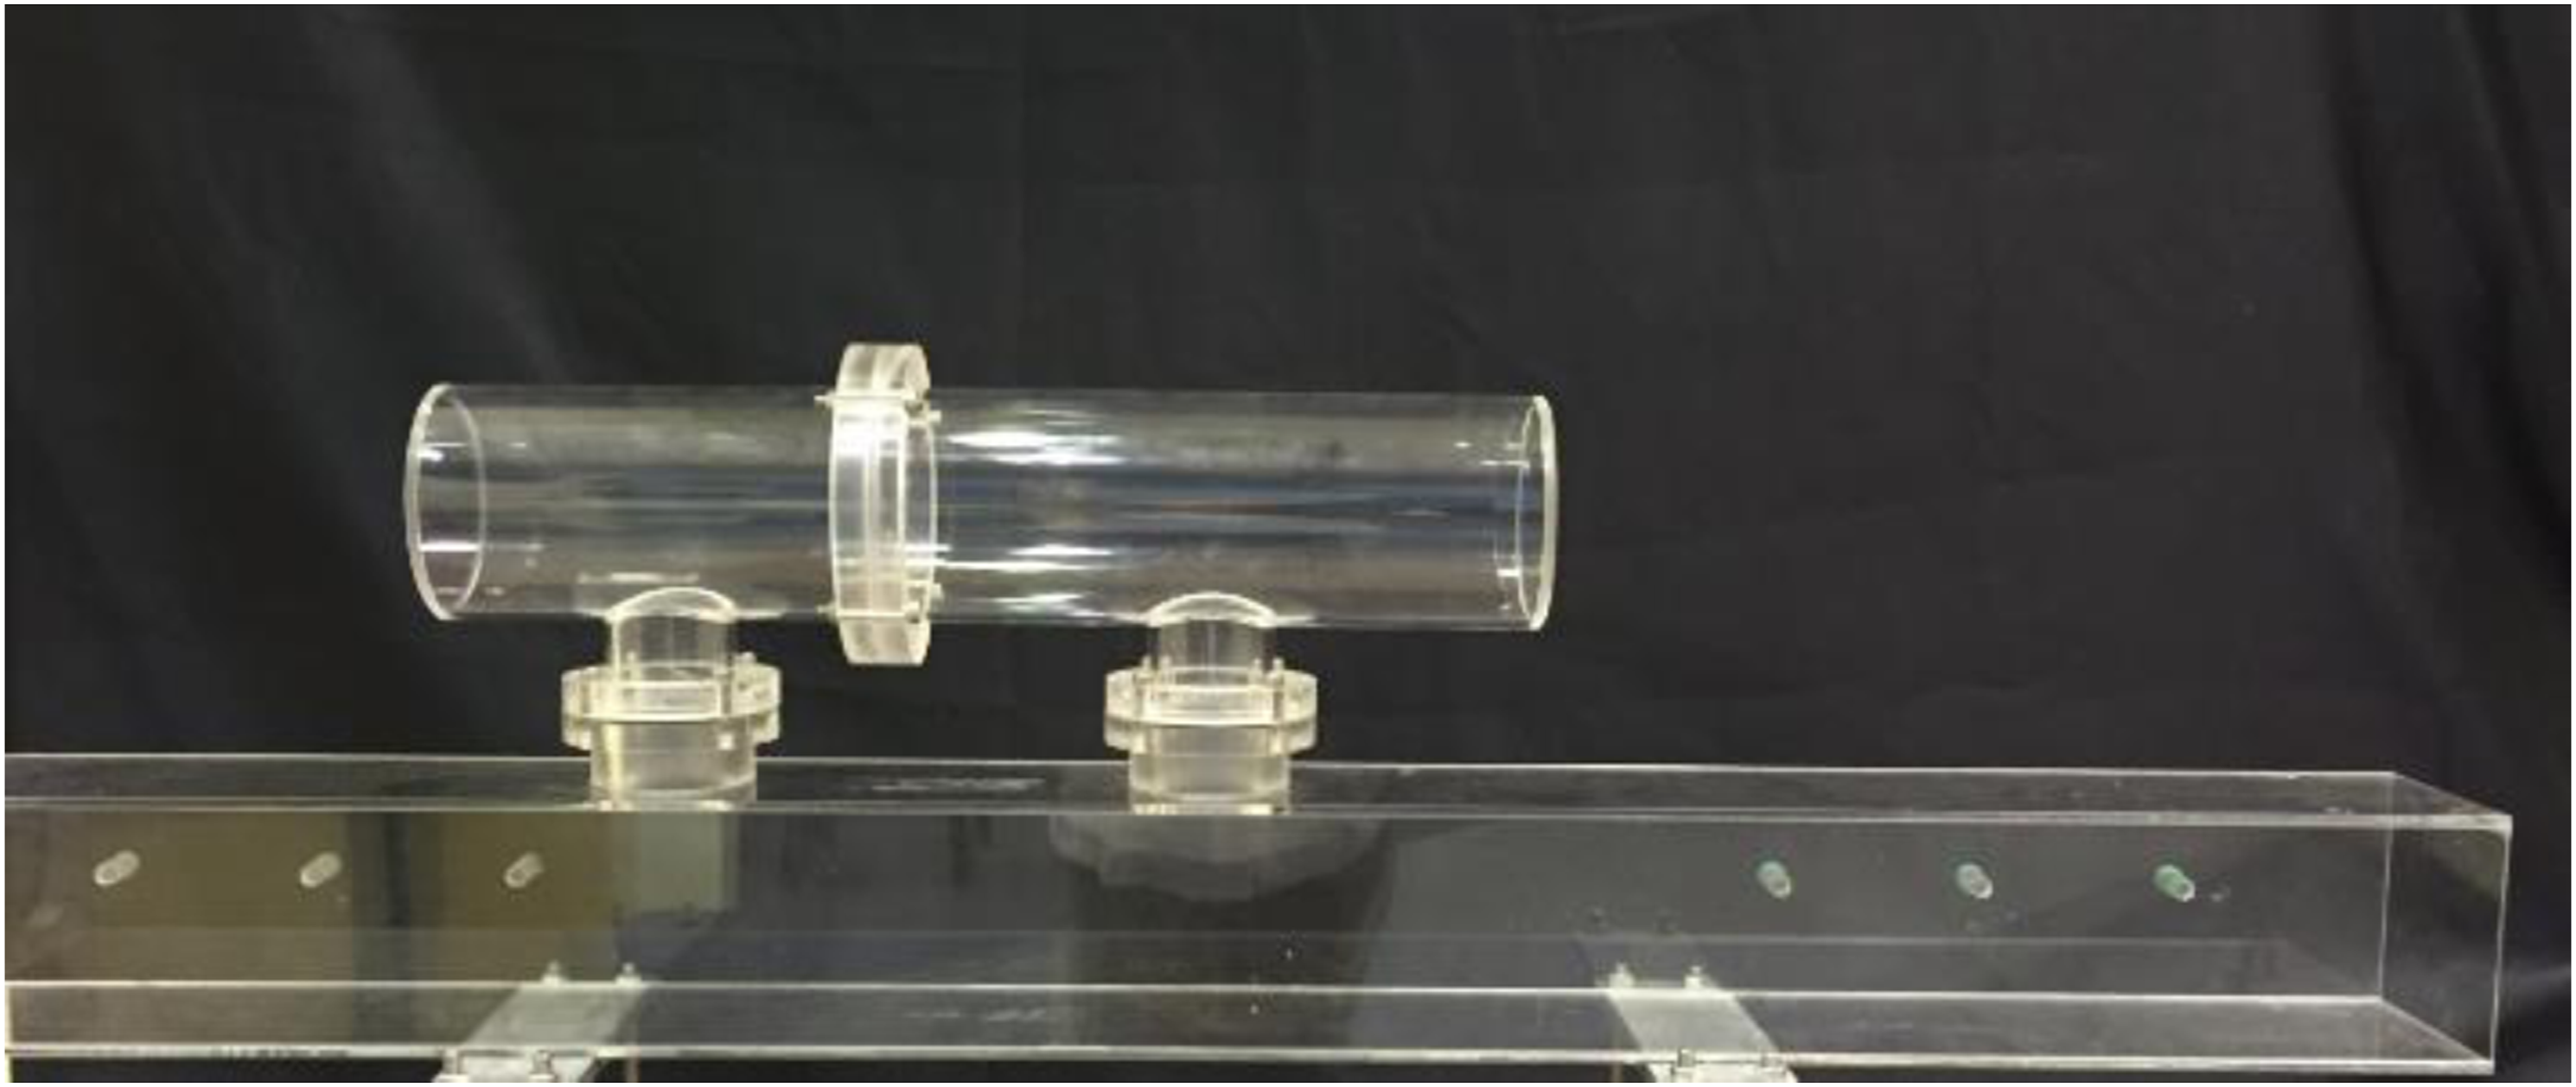
Loudspeaker and microphones
A loudspeaker is used as a source to transmit sound waves over input frequencies during the experiment. The speaker size of 6 inches is selected, that is, sufficient enough to generate power of 105 dB waveform, which covers the required frequency ranges. The loudspeaker used for calibration and assembled at the chamber is chosen approximately the same size to obtain the closest measurement. However, errors could be introduced if sound wave propagation along the air duct takes longer to develop the acoustic profile fully.
Six microphones are used for these experiments, and the sizes are selected to fit for the accuracy so that the minimum calibration would be acquired and the consideration of phase constraints in tolerances to the tubes drilled at the air duct’s wall. The axial locations of those six microphones should be mounted accurately, and careful handling of those microphones is necessary during the pre- and post-calibration. Figure 5(b) shows the microphones are slotted inside the tube sealed with blue tabs for experiments. Photos of a Loudspeaker (left) and a microphone (right)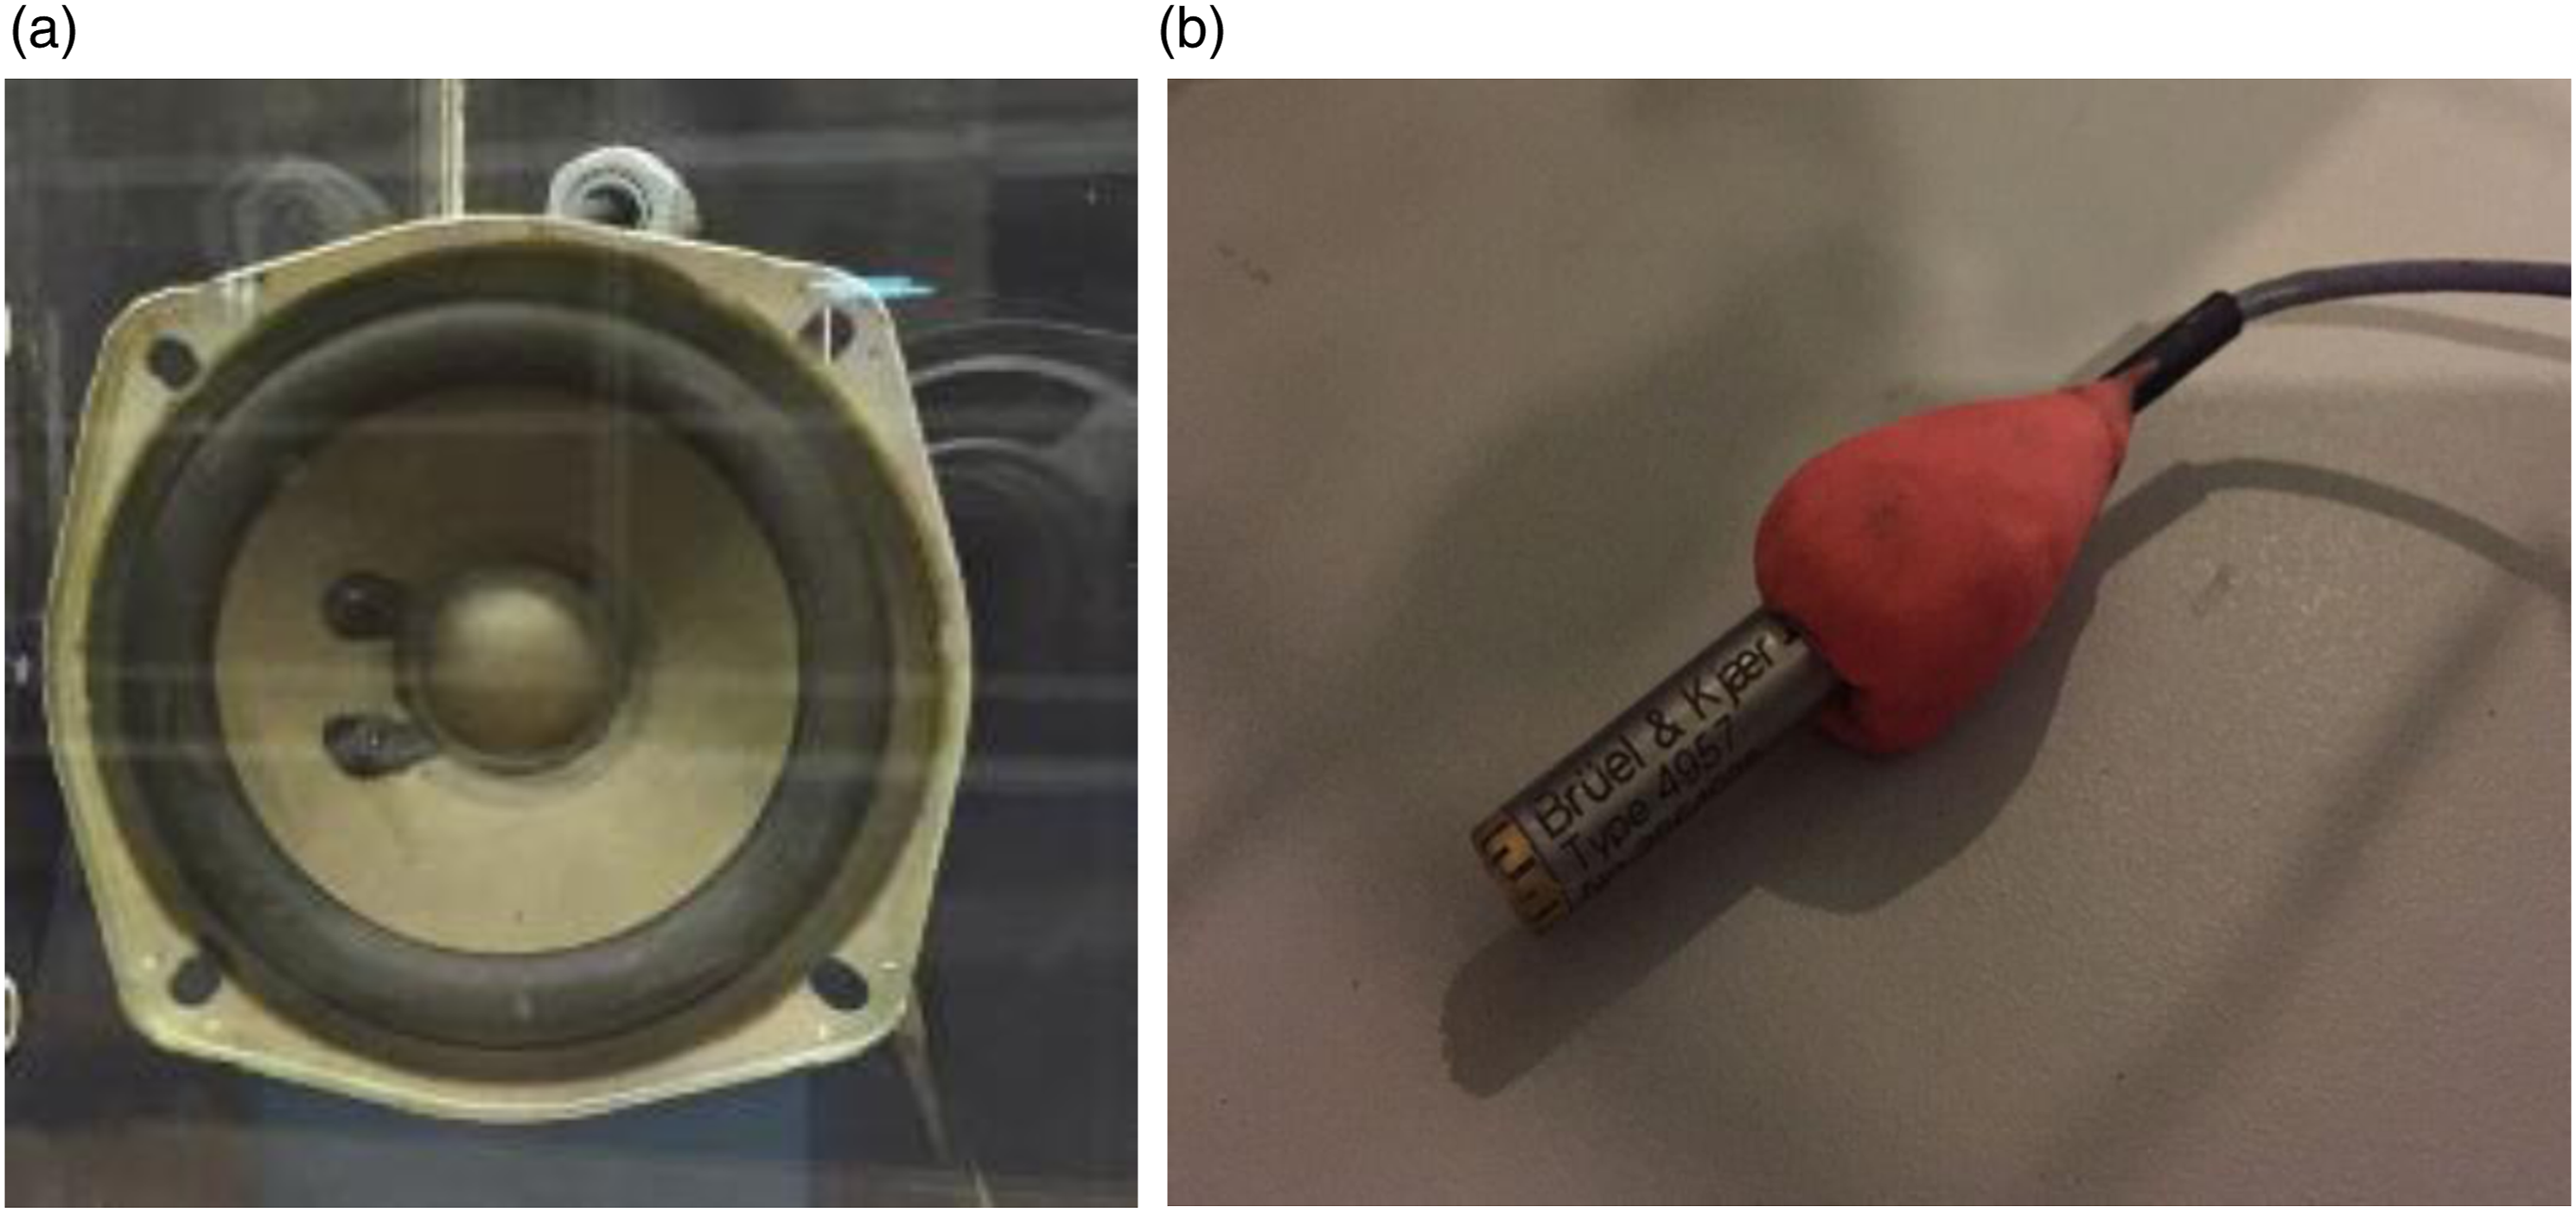
Helmholtz Resonators
In this experiment as shown schematically in Figure 6, the resonators are Geometrical Display of Square-Shaped Helmholtz Resonators.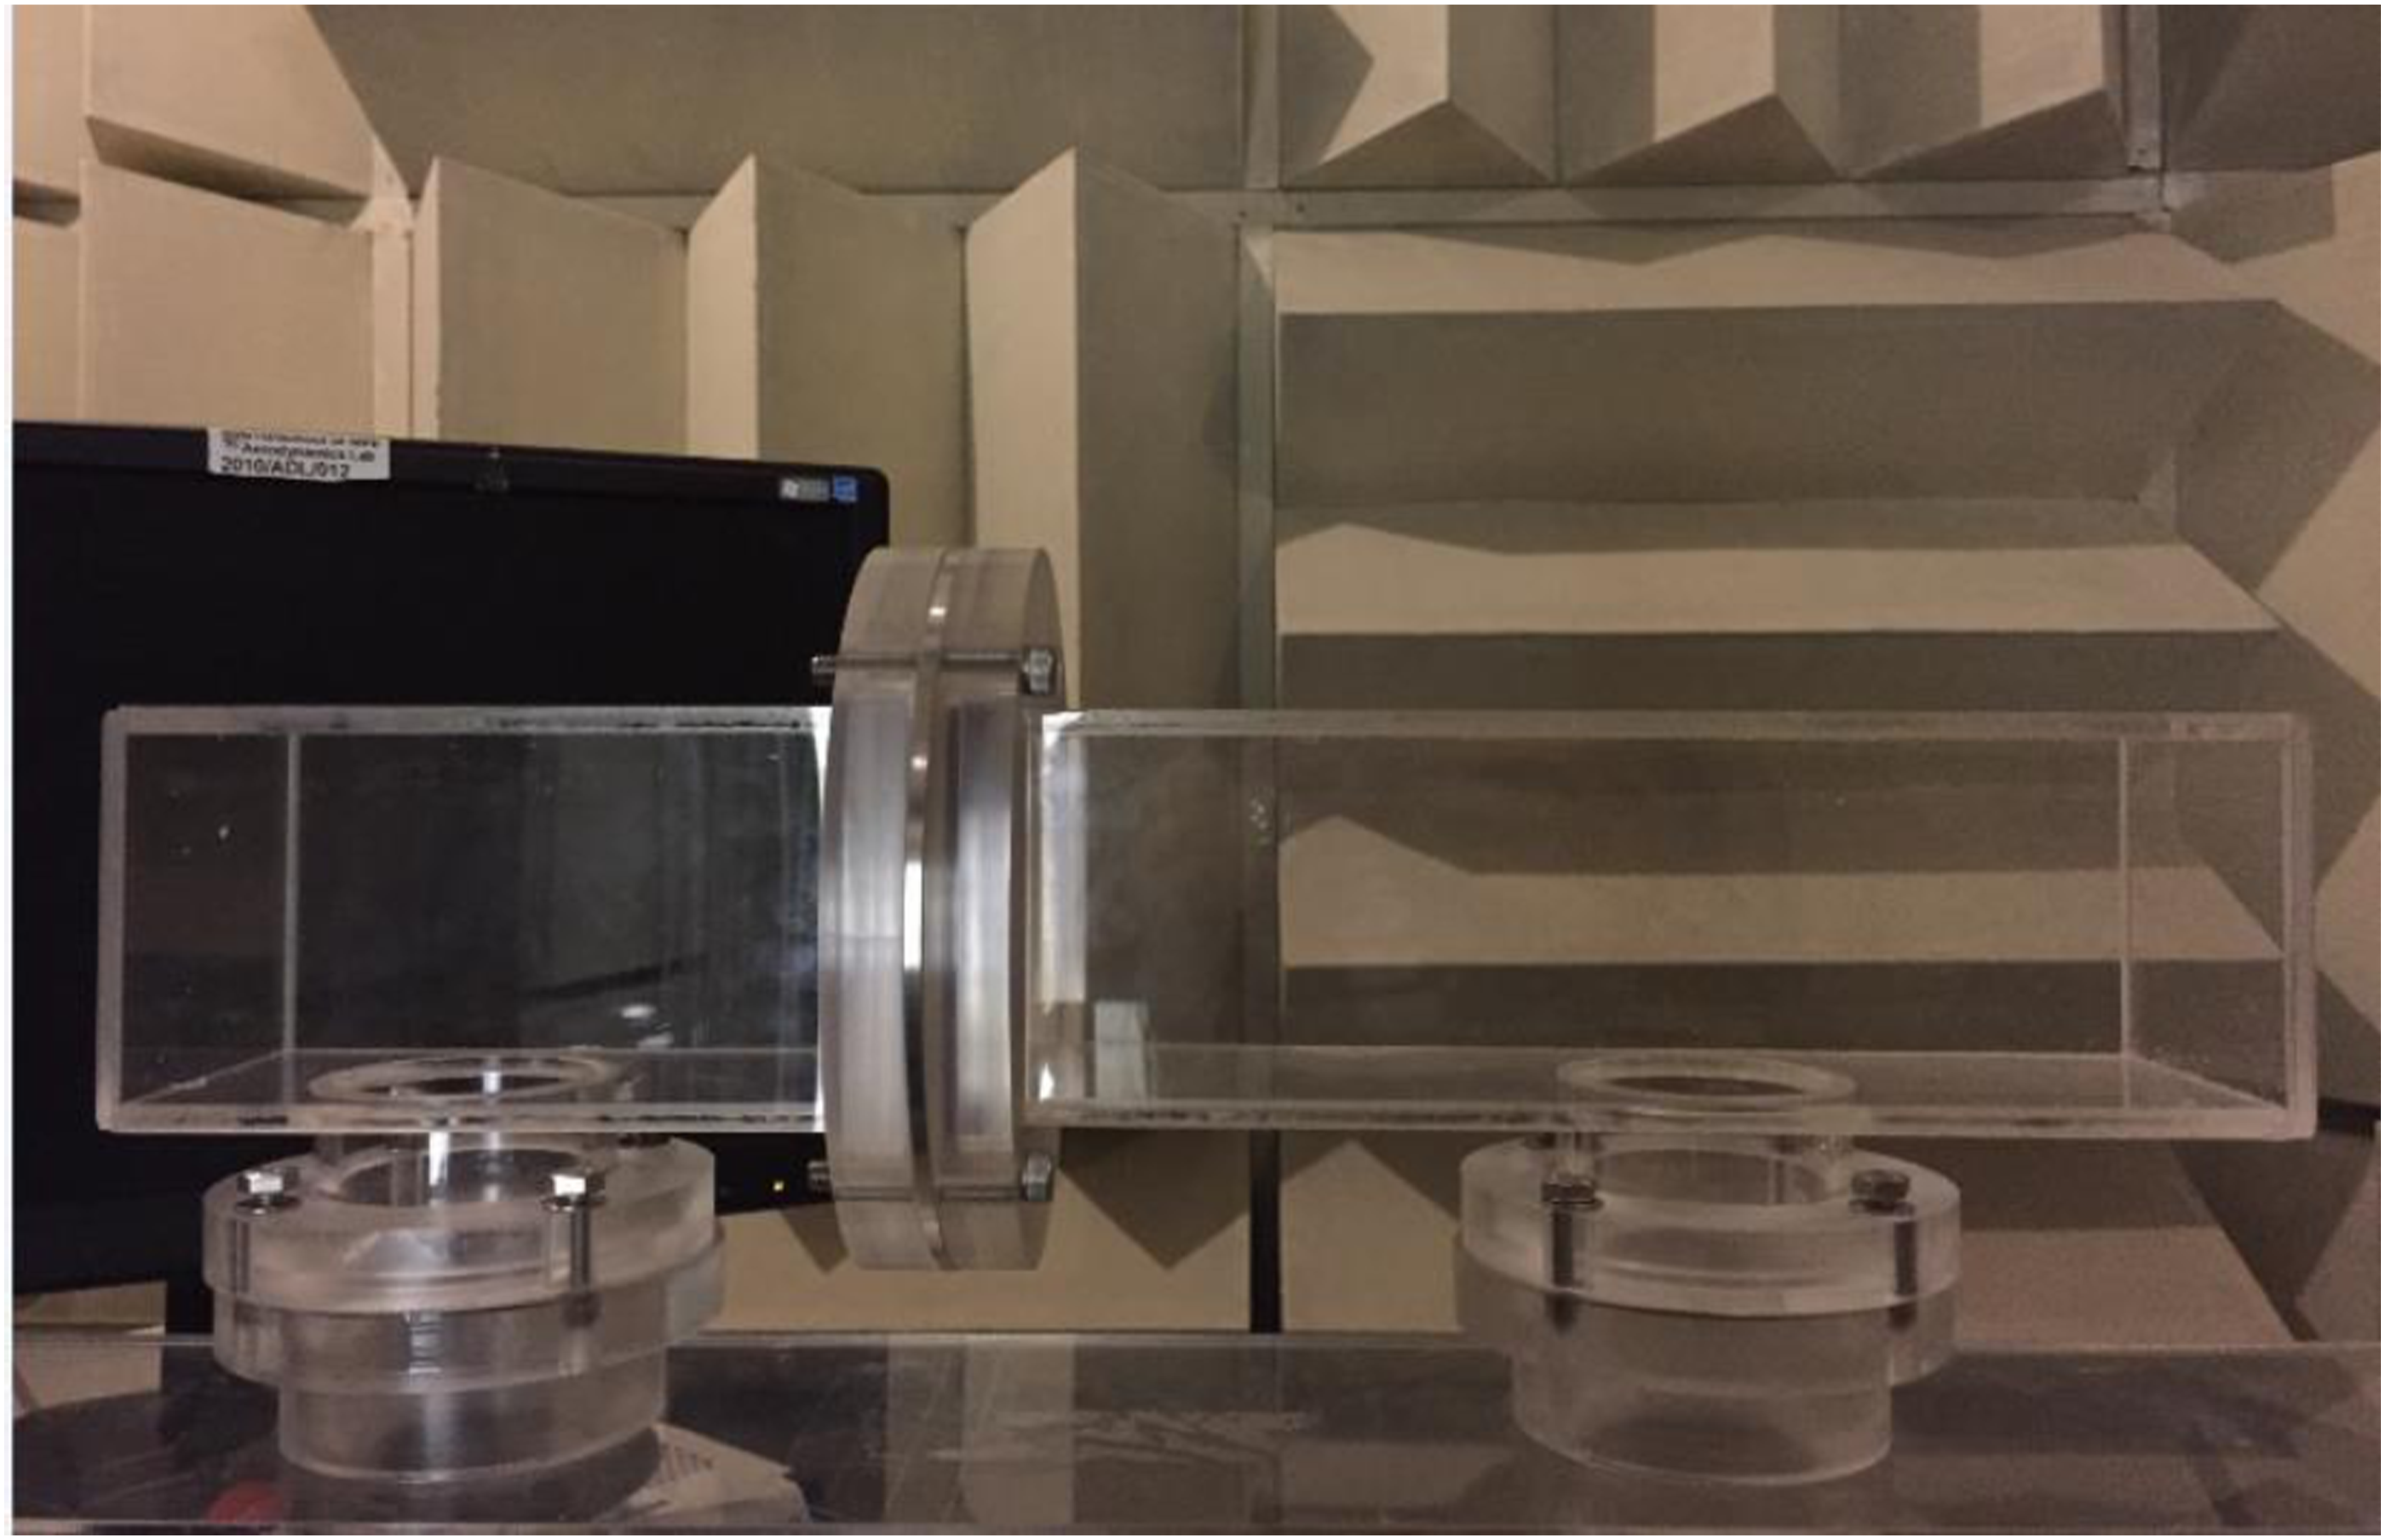

The resonator’s
Acoustic foam and acoustic wool
Eggcrate foam as shown in Figure 7 is a type of acoustic foam formulated as soundproofing by attenuating the incident sound waves. The purpose of using acoustic foam is to enhance sound quality by reducing the residual sound in the environment. It is a lightweight material made of polyurethane foam and eliminates the noises by controlling the reverberation that sound can make by bouncing off from the walls. Reverberation is defined as several reflections, when a sound signal is reflected and decayed once the objects absorb the signal in the environment. Resulting from the sound reflection, the sound intensity starts to reduce depending on the frequency. Pictures of (a) acoustic foam and (b) acoustic wool.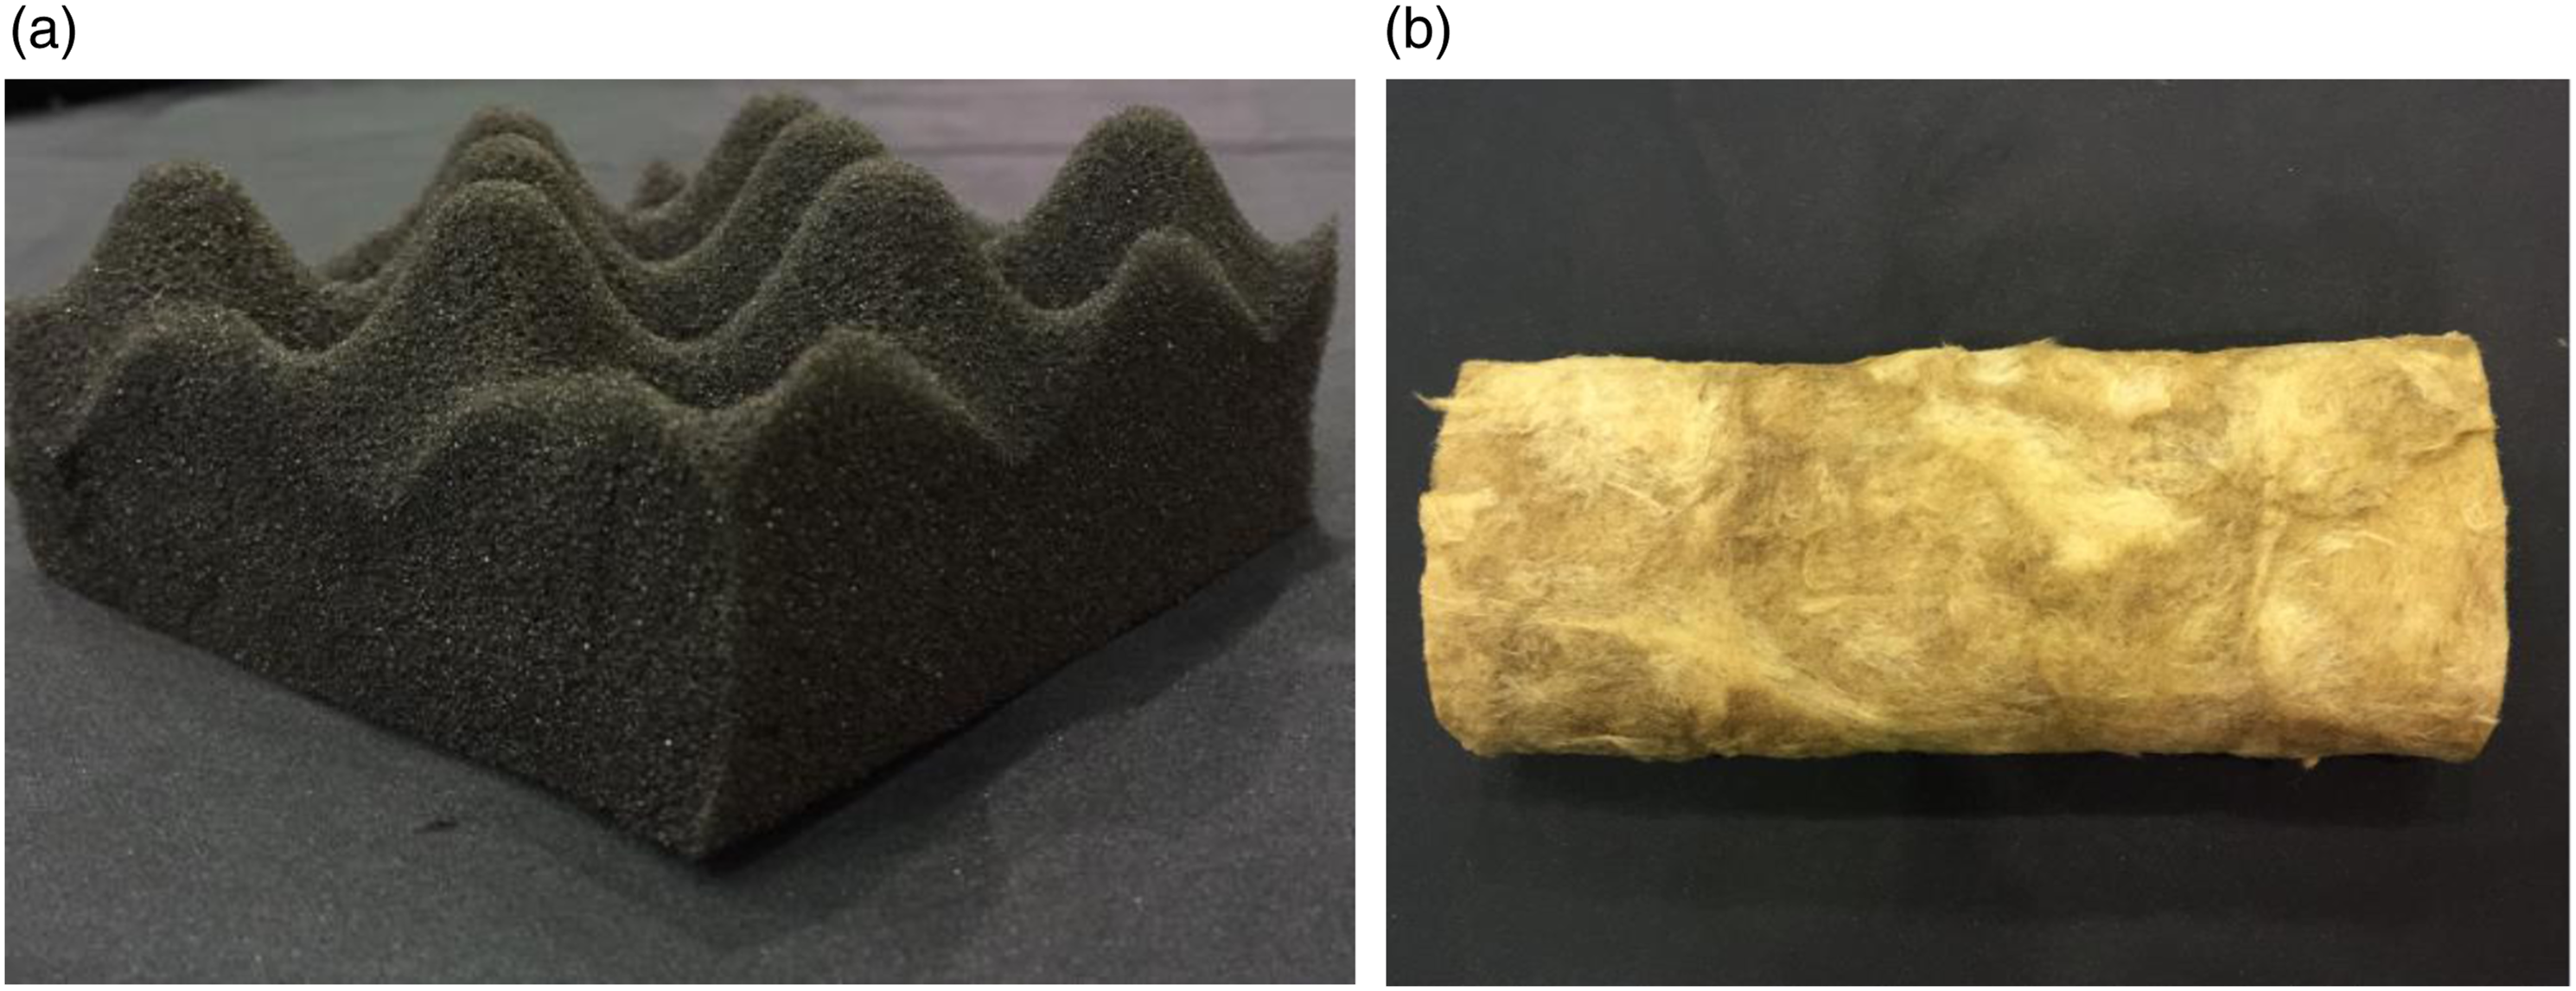
Acoustic wool serves as sound-attenuating insulation. It has the properties of glass wool, so-called fibreglass, which primary function is reducing airborne sound transmission loss and sound reverberation in the environment. It is widely used in industry where lightweight, high tensile strength and exceptional resilience properties are required. It is made of fine and long fibre slabs with a diameter of 6–7
Flexible plate and rigid plate
The circular rig is fabricated, and an elastic sheet is pasted on it. The complete flexible plate as shown in Figure 8(a) is sandwiched between the two connecting rods of resonators. A similar approach has been carried out for rigid plates (see Figure 8(b)), where the material is made of acrylic embedded between resonators as another parameter for this experiment. Pictures of (a) flexible plate and (b) rigid plate as the sharable side wall of the coupled Helmholtz resonators.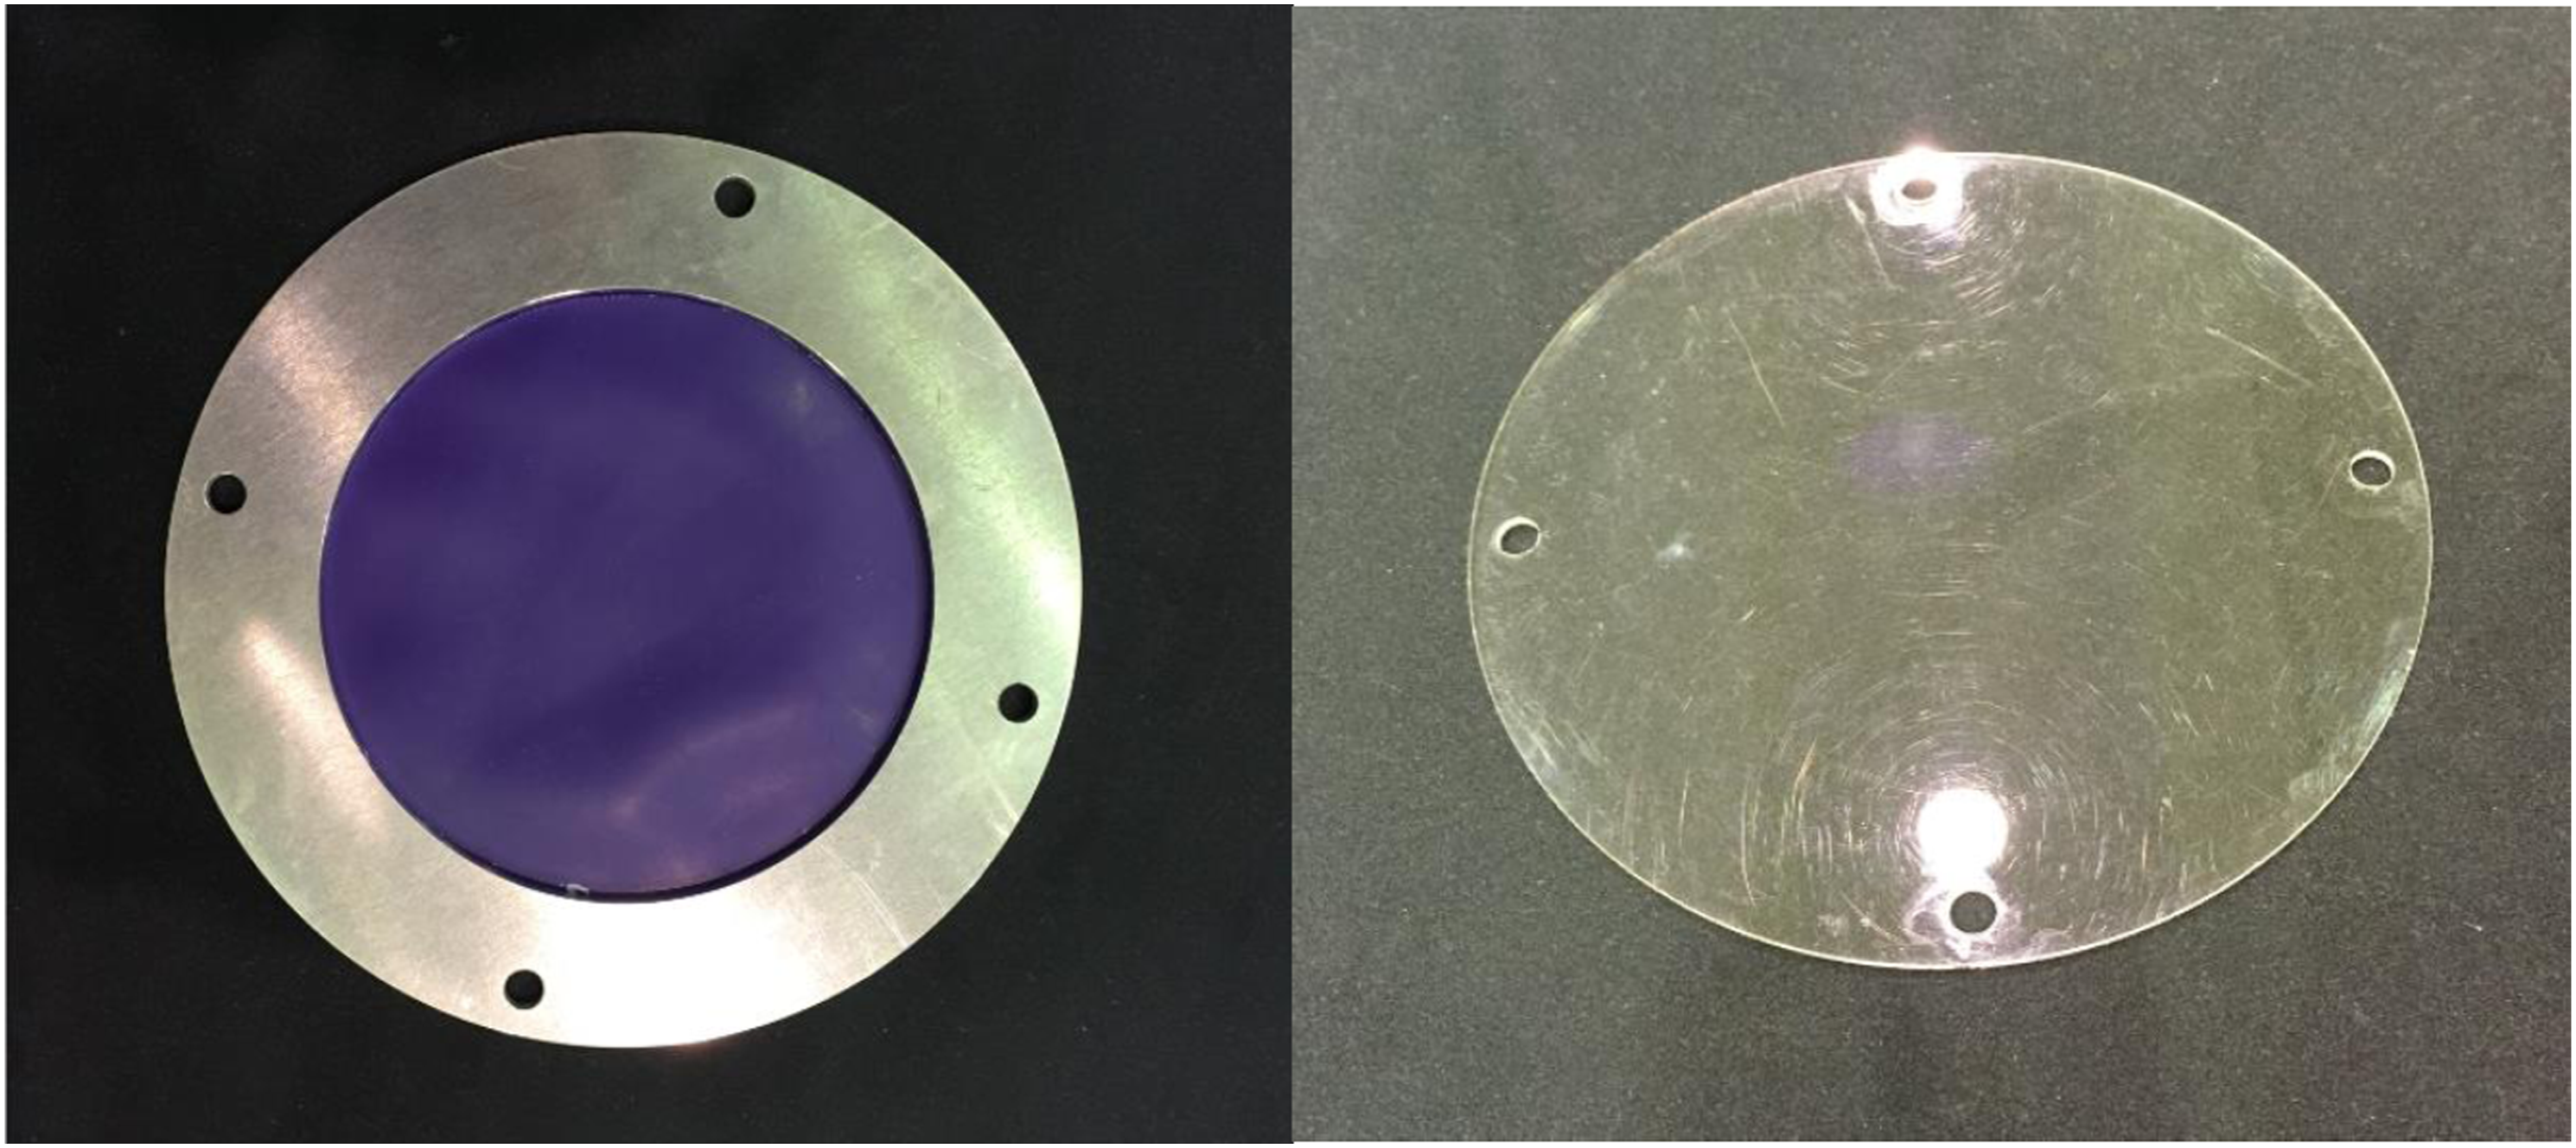
Description of the experimental method and theoretical prediction of resonant frequencies
The experiment is conducted in the anechoic chamber with three different parameters to test the transmission loss of resonators. The experimental set-up of cylindrical-shaped Helmholtz resonators is shown in Figure 9. The first parameter is the rigid circular plate, 100 mm in diameter, connected in parallel between the two Helmholtz resonators to evaluate transmission loss. Secondly, the flexible circular plate of the same diameter with rubber attached, a damping mechanism, was placed to conduct the test. Lastly, the resonators’ necks are filled with three different types of the noise damping materials, such as acoustic foam and wool, for conducting the test. Two different geometries: square- and cylinder-shaped resonators, are experimentally tested. The corresponding results are discussed in section 5. Experimental set-up of cylindrical-shaped Helmholtz resonators in the anechoic chamber.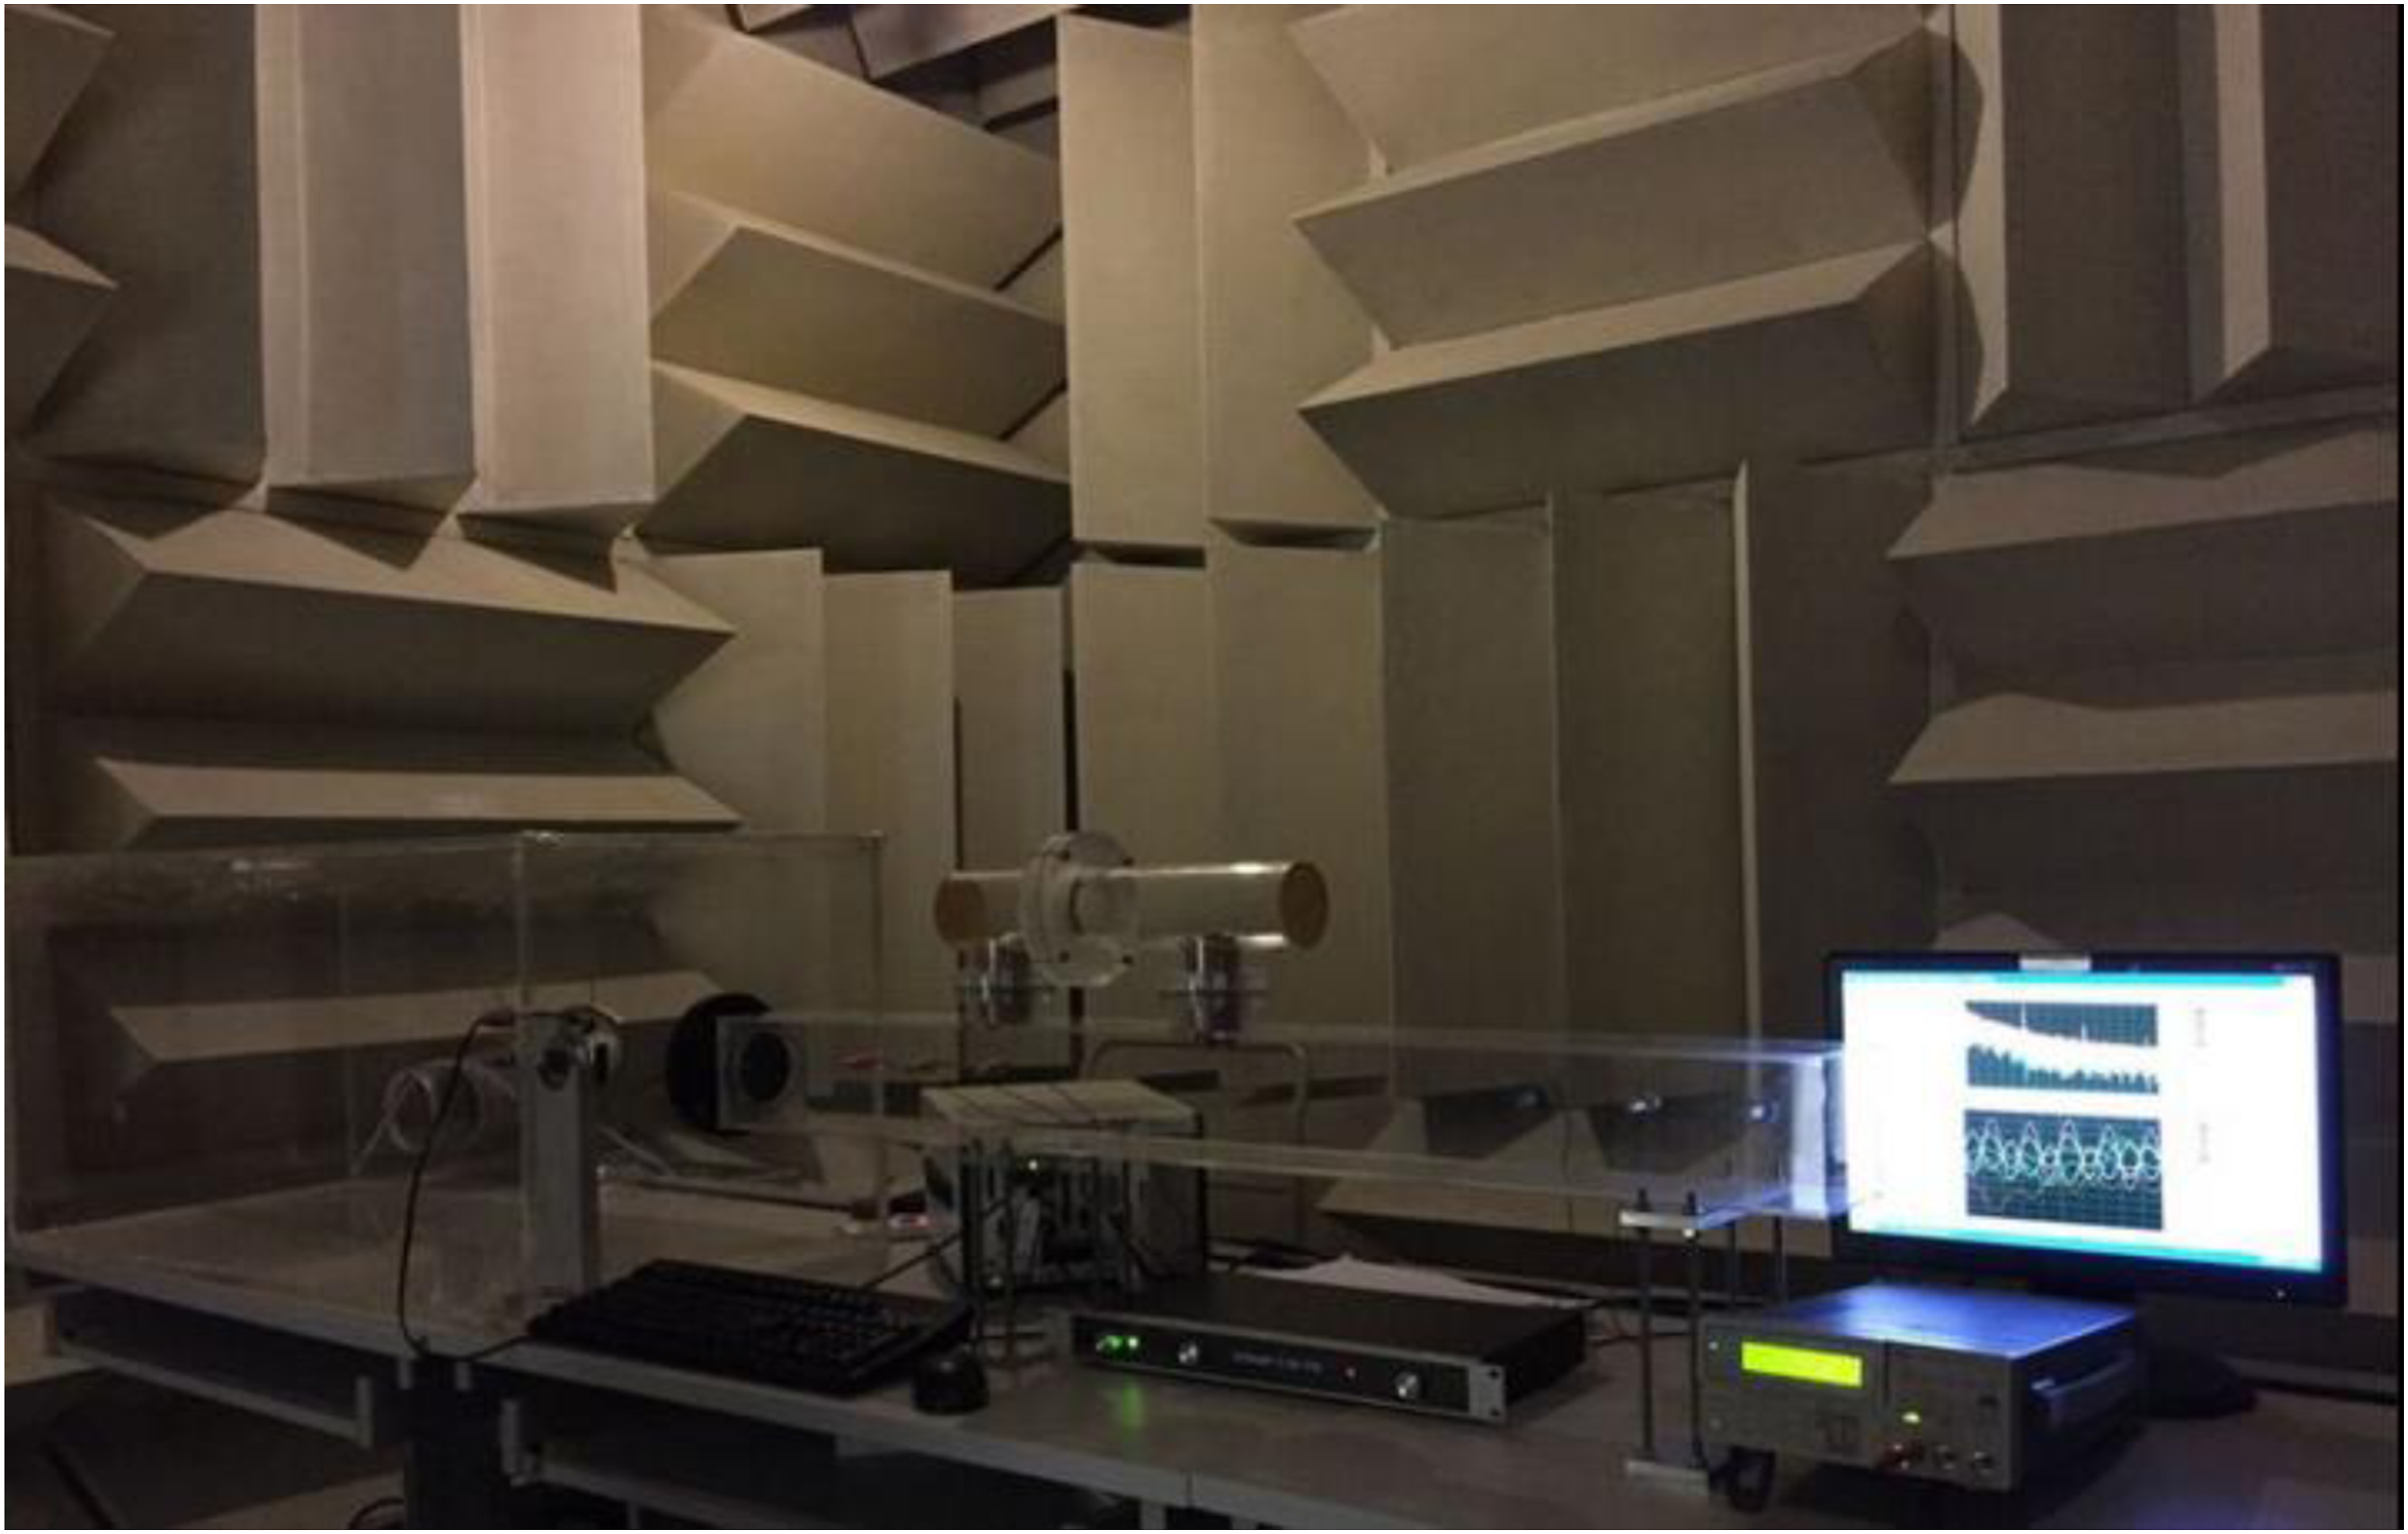
The resonator’s parameters and geometry of the overall structure are described in Appendixes 1 and 2. The loudspeaker is connected to the amplifier to produce a range of frequencies, 150–600 Hz, by increasing 5 Hz in each parameter. Six microphones method for transmission loss is adopted; measurement readings are recorded via three microphones located upstream and another three downstream of the resonators. Each microphone is fixed at 10 mm equal intervals away from each other, and the reference is chosen to microphone 1. Mean flow velocity is measured using a hot-wire anemometer in this experiment.
Four different parameters are tested, the air pump supply is turned on to the maximum supply voltage, and the maximum mean flow velocity is measured using a hot-wire anemometer. The subsequent velocities [ • Theoretical prediction of the resonant frequencies of HRs
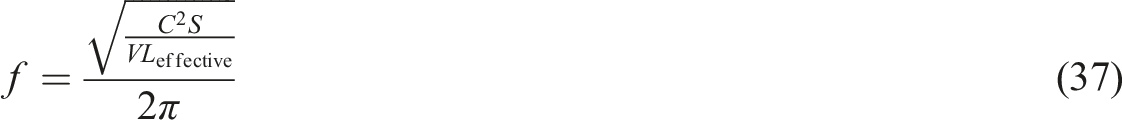
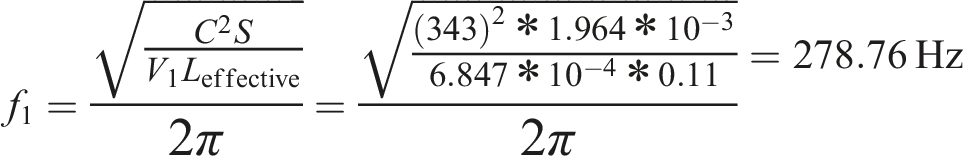
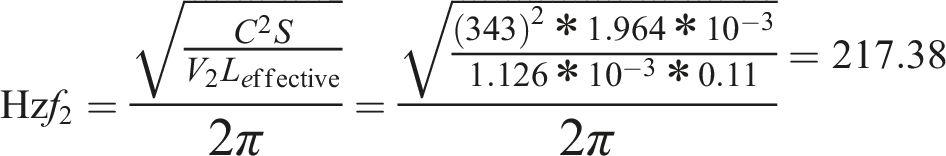
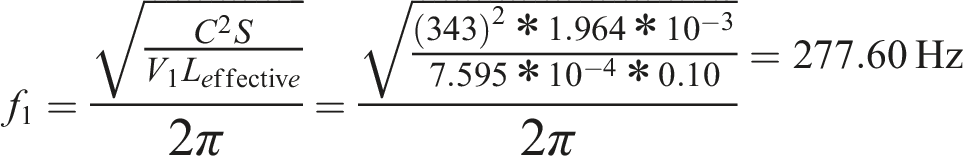
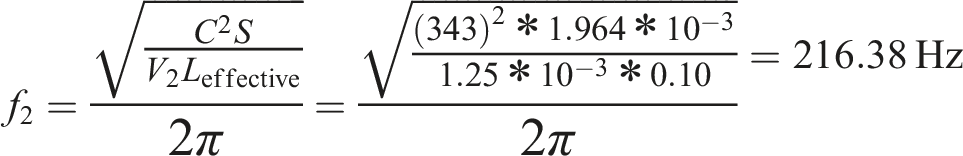
The theoretical calculation is carried out for both square-shaped (see Figure 6) and cylindrical-shaped (see Figure 4) Helmholtz resonators to compare with the result from the experiment. The individual resonators frequency is calculated using the equation below • Prediction of the resonant frequency of the cylindrical-shaped Resonators with a sharable Rigid Plate as a sidewall • Prediction of the resonant frequency of the square-shaped Resonators with a sharable Rigid Plate as a sidewall
Experimental results coupled cylindrical- and square-shaped Helmholtz Resonators with a sharable rigid Plate in the presence of a low mach number grazing flow
The experiment was carried out with a rigid plate made of acrylic with a 1.5 mm thickness circular in size and applied between the two resonators to act as a sharable sidewall. Ideally, two prominent peaks of the resonant frequencies could be observed. The experimental tests are conducted for a frequency range between 150 Hz and 600 Hz with an incremental step of 5 Hz.
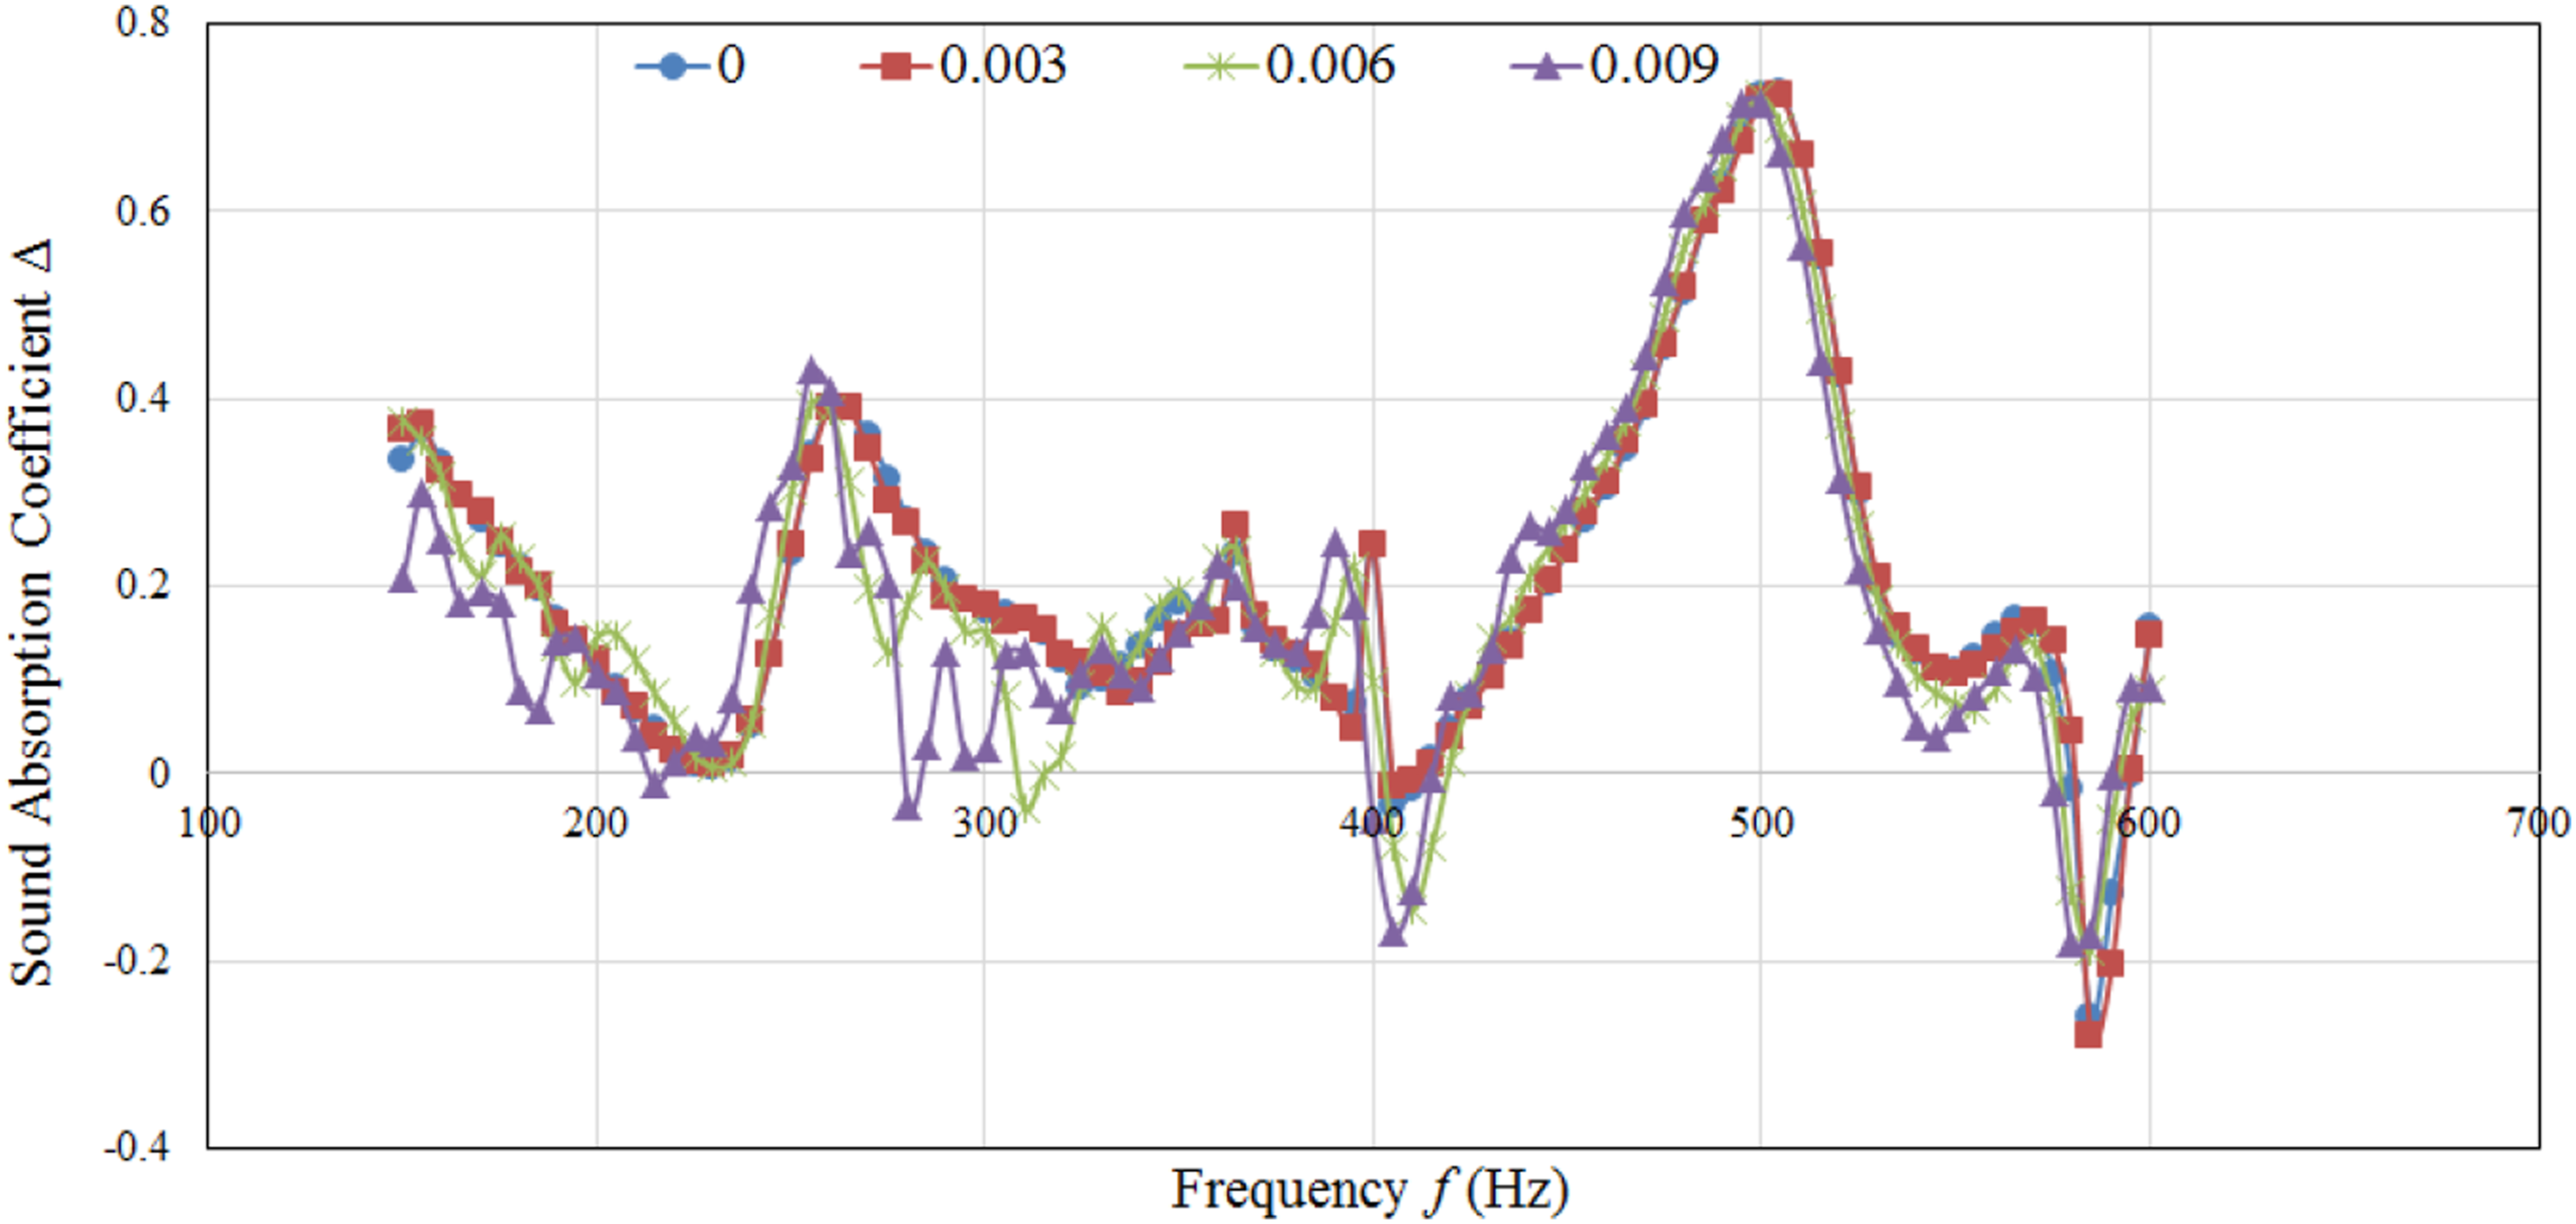
Figures 10 and 11 show the variation of the sound absorption coefficient, Δ, of squared- and cylindrical-shaped coupled Helmholtz resonators varied with the forcing frequency, as the grazing flow Mach number is set to 4 different values. It can be seen that the maximum sound absorption coefficient could be as high as 80%, which means that the resonators absorb approximately 80% of the incident sound energy. While comparing the performance of square- and cylindrical-shaped resonators, it is observed that the cylindrical-shaped resonators perform better at the tested frequency range, that is, between 150 Hz and 600 Hz, with the presence of local peaks, Δmax. This confirms that the cylindrical shape is a better design choice. Variation of sound absorption coefficient of square-shaped resonators with a sharable rigid plate. Variation of sound absorption coefficient of cylindrical-shaped resonators with a sharable rigid plate.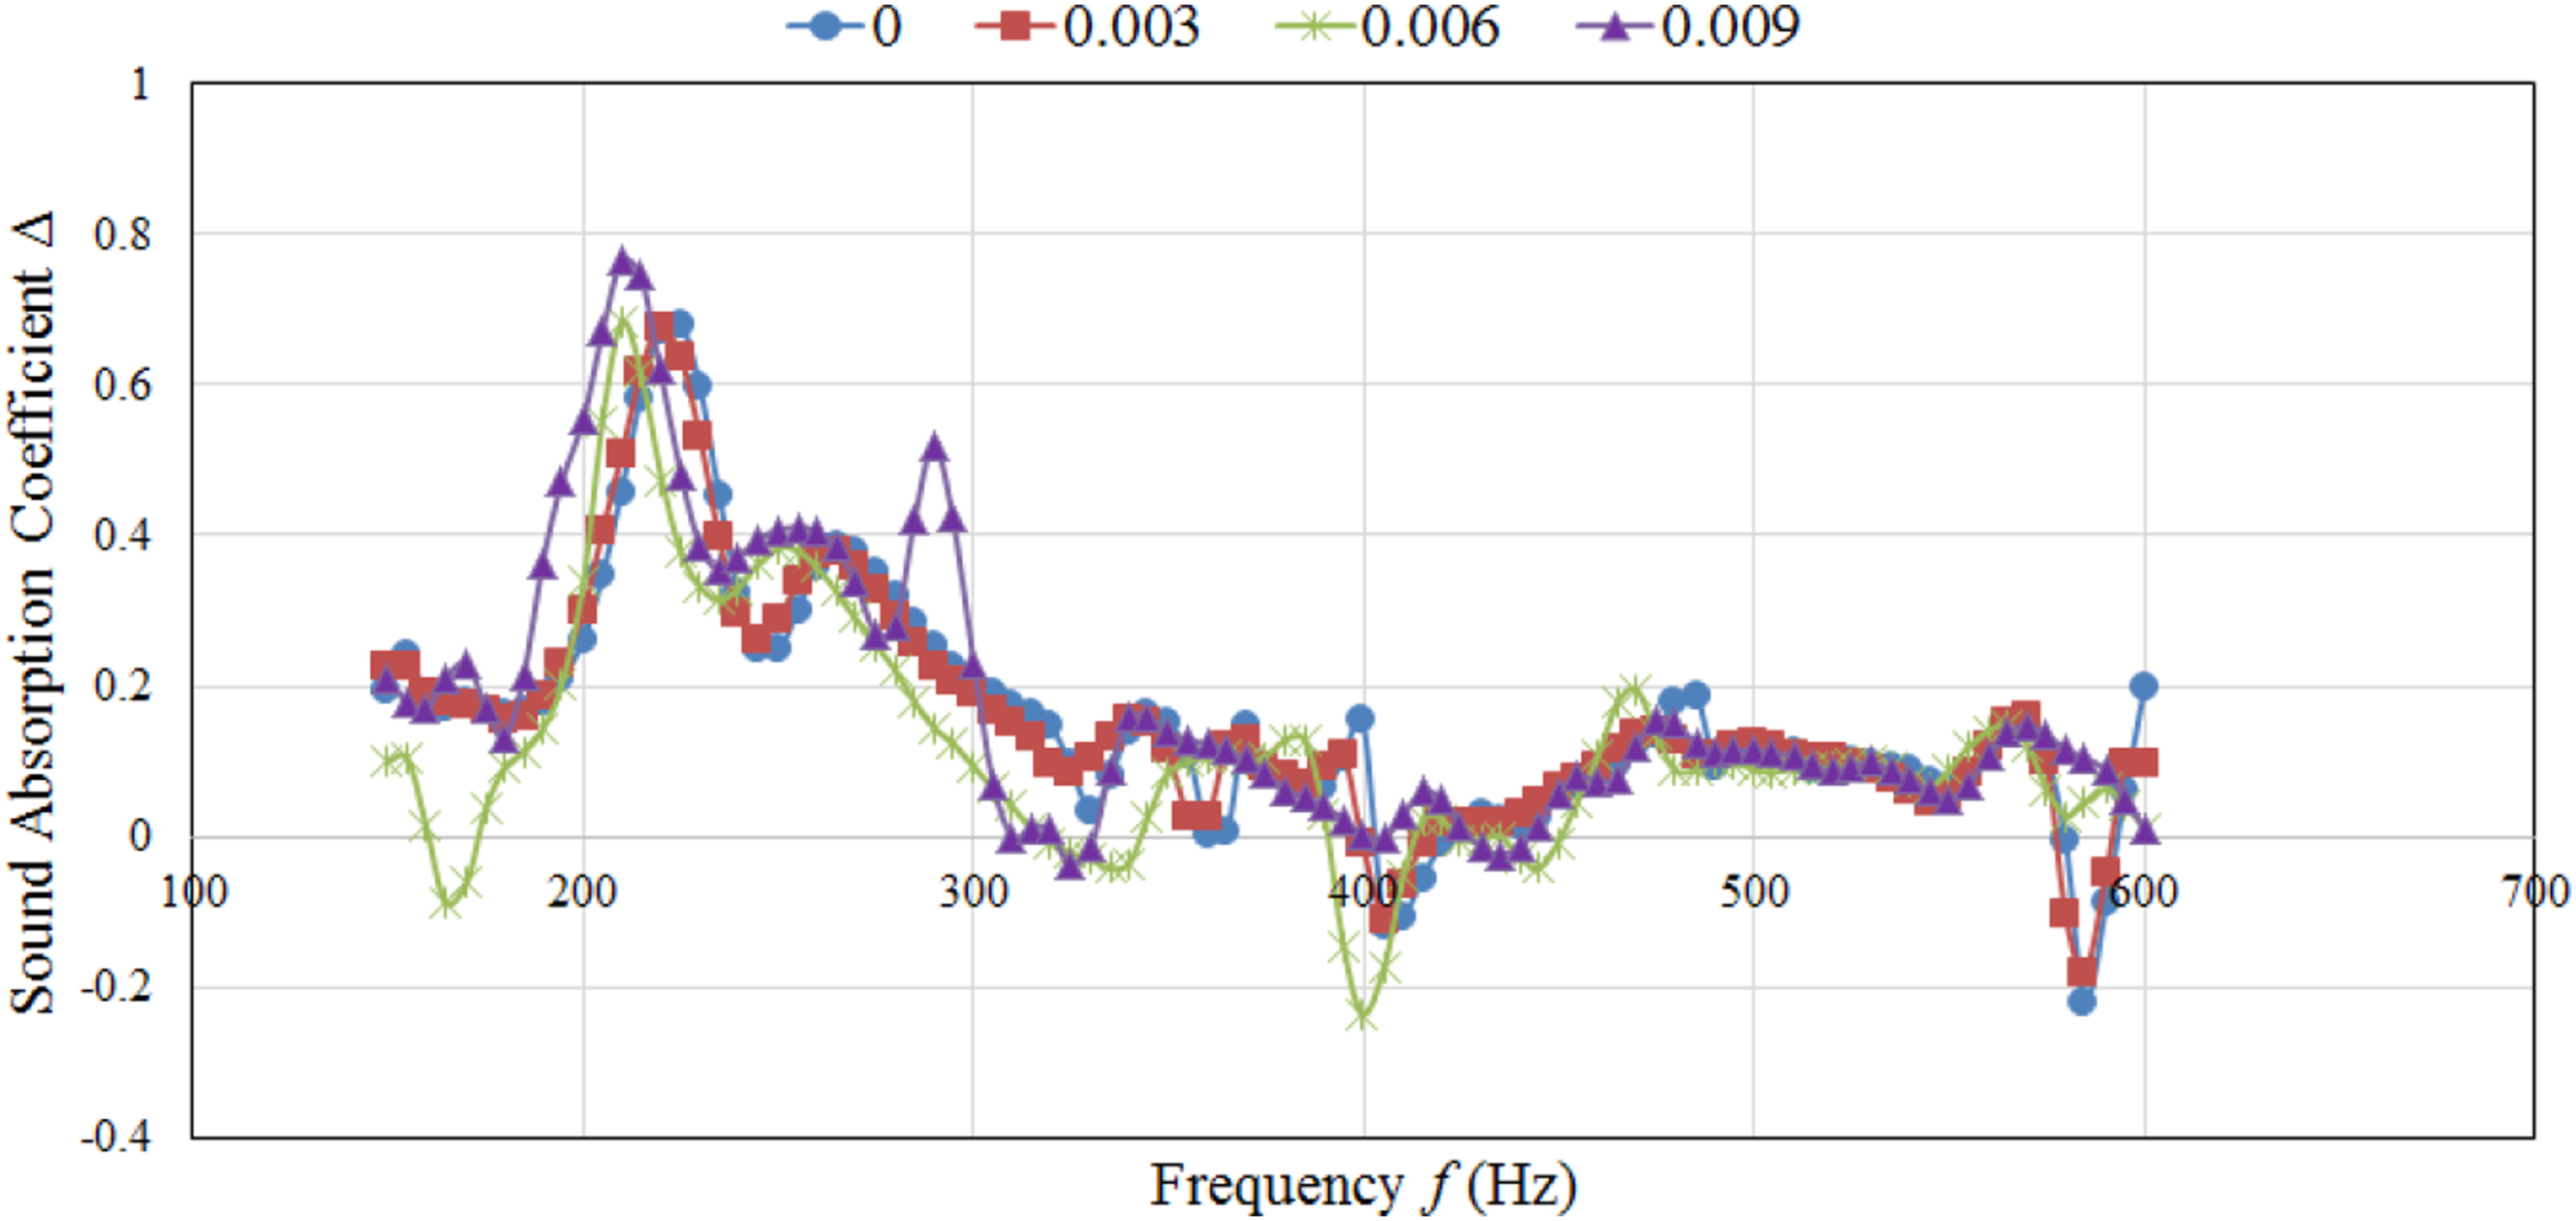
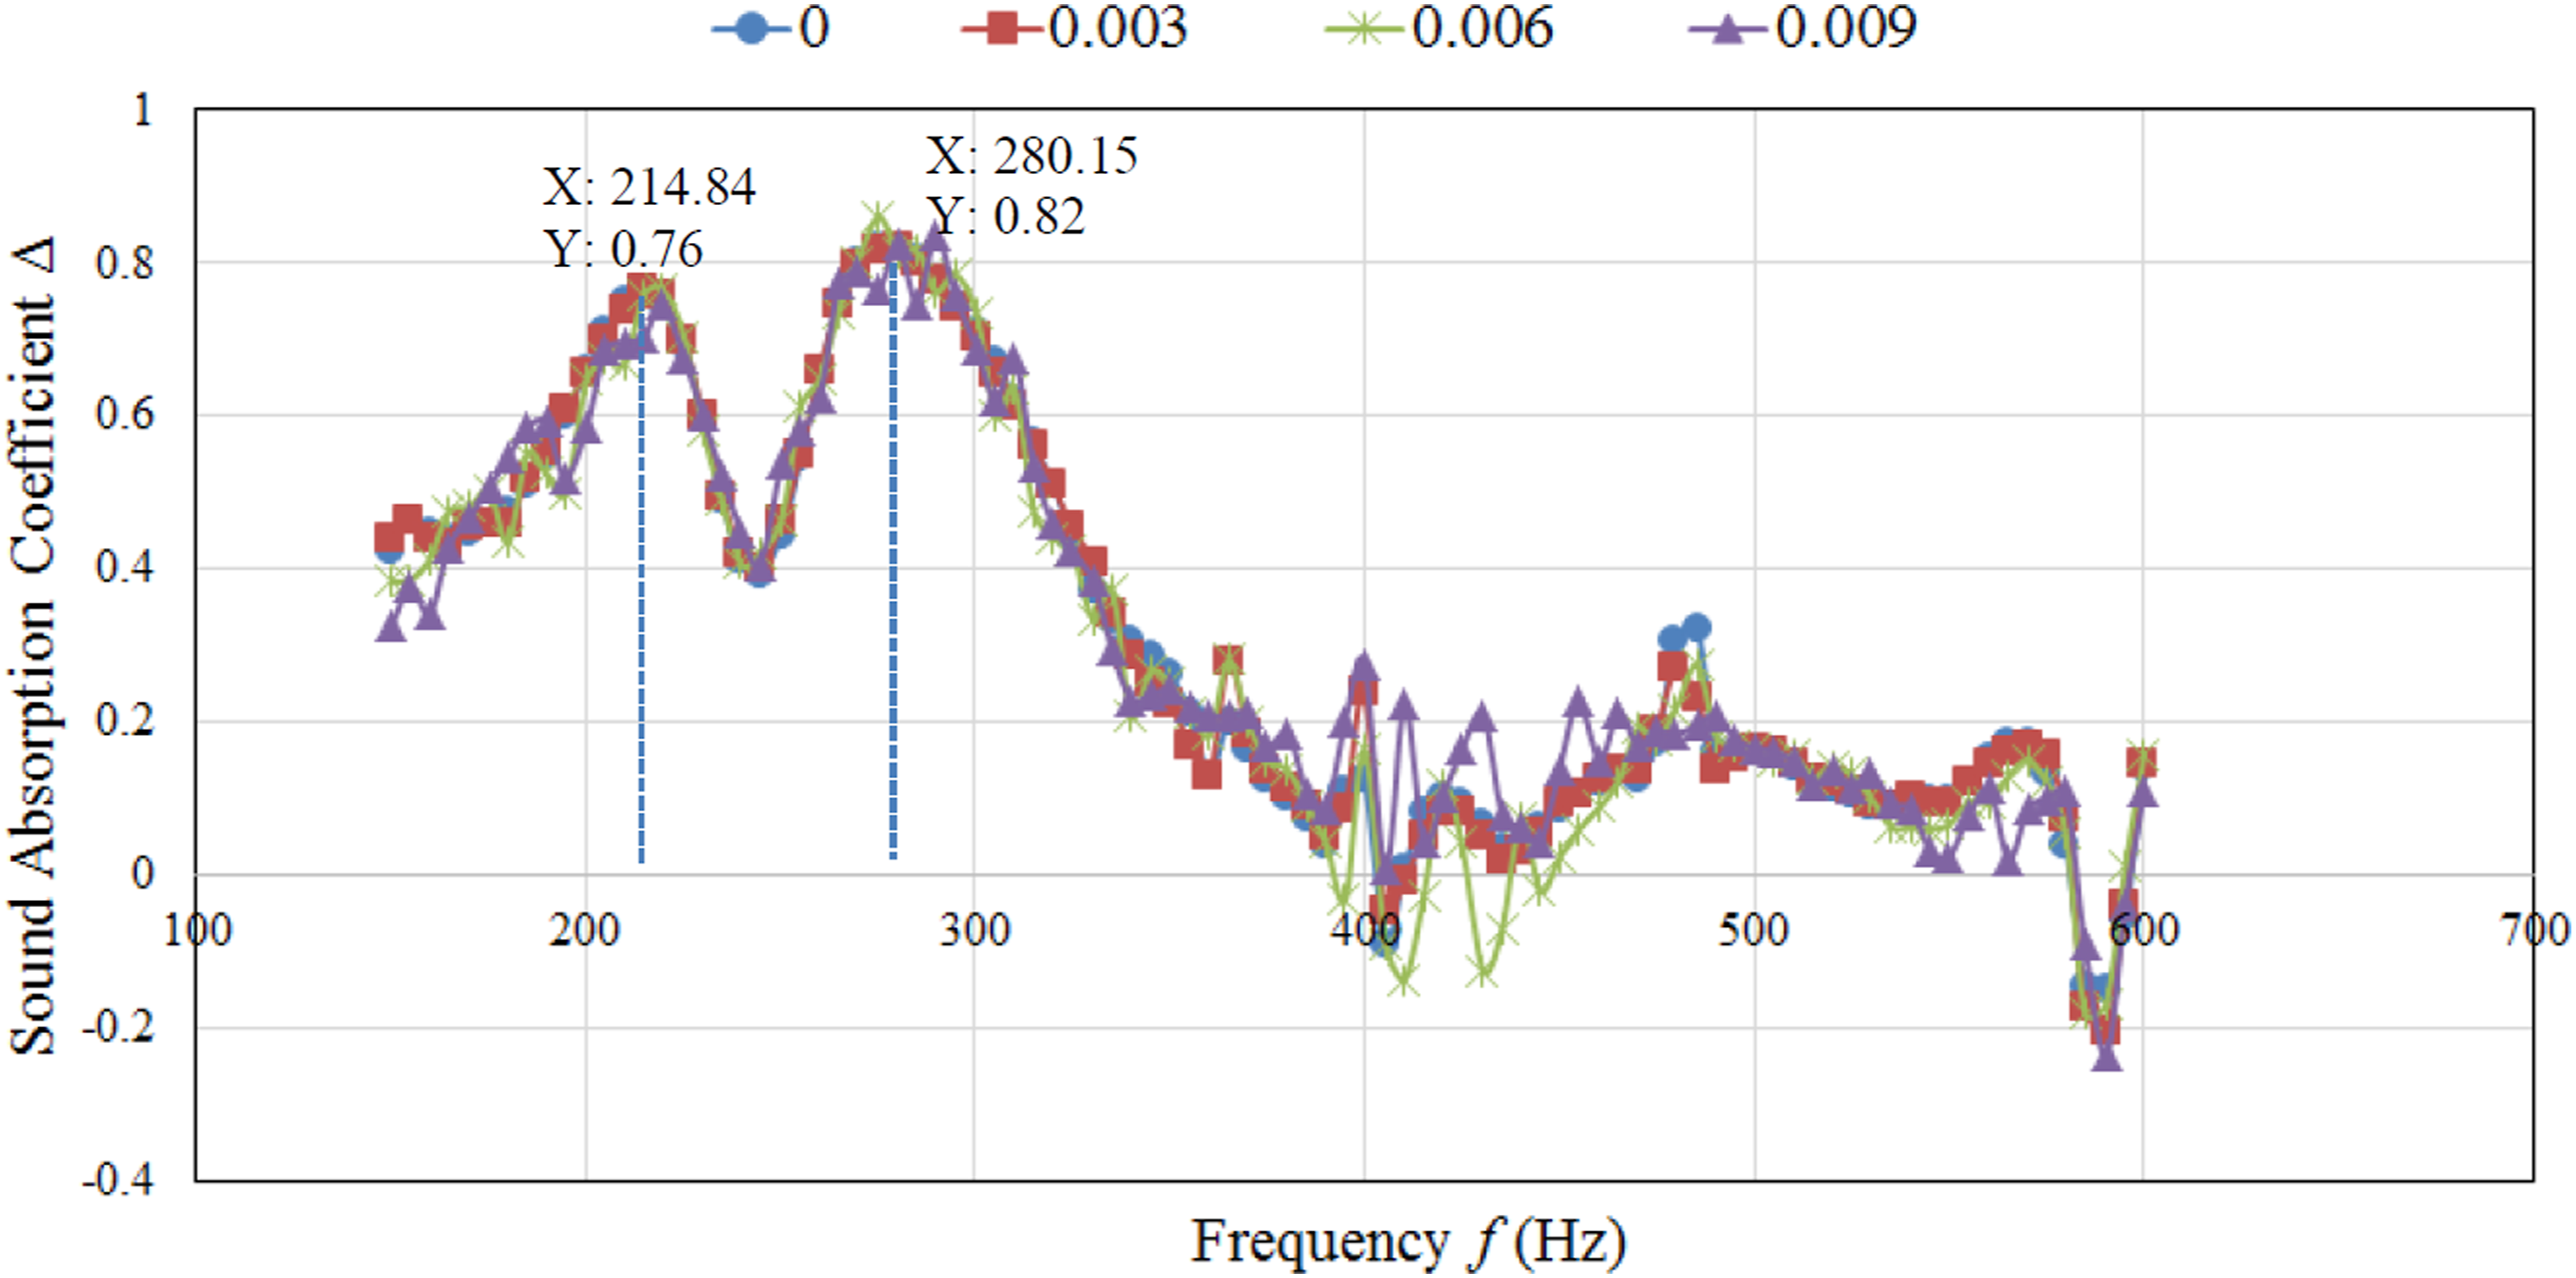
Observing both Figures 10 and 11 also reveals that the low Mach number grazing flow does not dramatically affect the sound absorption coefficient. This is probably because the grazing flow speed is negligible. Finally, the presence of the grazing flow does influence the resonant frequencies. The experimental measured resonant frequencies corresponding to the peaks of Δ are 20% different from the theoretically predicted value, as discussed in Section 3.5.
Coupled Helmholtz Resonators with no sharable plate applied
It would be interesting to know that when no sharable plate is applied to the coupled Helmholtz resonator, what would the aeroacoustics damping performance be changed? Figures 12 and 13 illustrate the variation of the sound absorption coefficient, Δ, of squared- and cylindrical-shaped coupled Helmholtz resonators varied with the forcing frequency. There is no sharable sidewall between the coupled resonators since the grazing flow Mach number is set to 4 different values. It can be seen from Figure 13 that the square-shaped coupled resonators have a large sound absorbing capacity near 500 Hz. In addition, the square-shaped resonators perform better than the cylindrical-shaped counterparts, as shown in Figure 12. Sound absorption coefficient of cylindrical-shaped resonators with no sharable plate. Variation of the sound absorption coefficient with frequency, as the square-shaped resonators are applied in the absence of any sharable plate.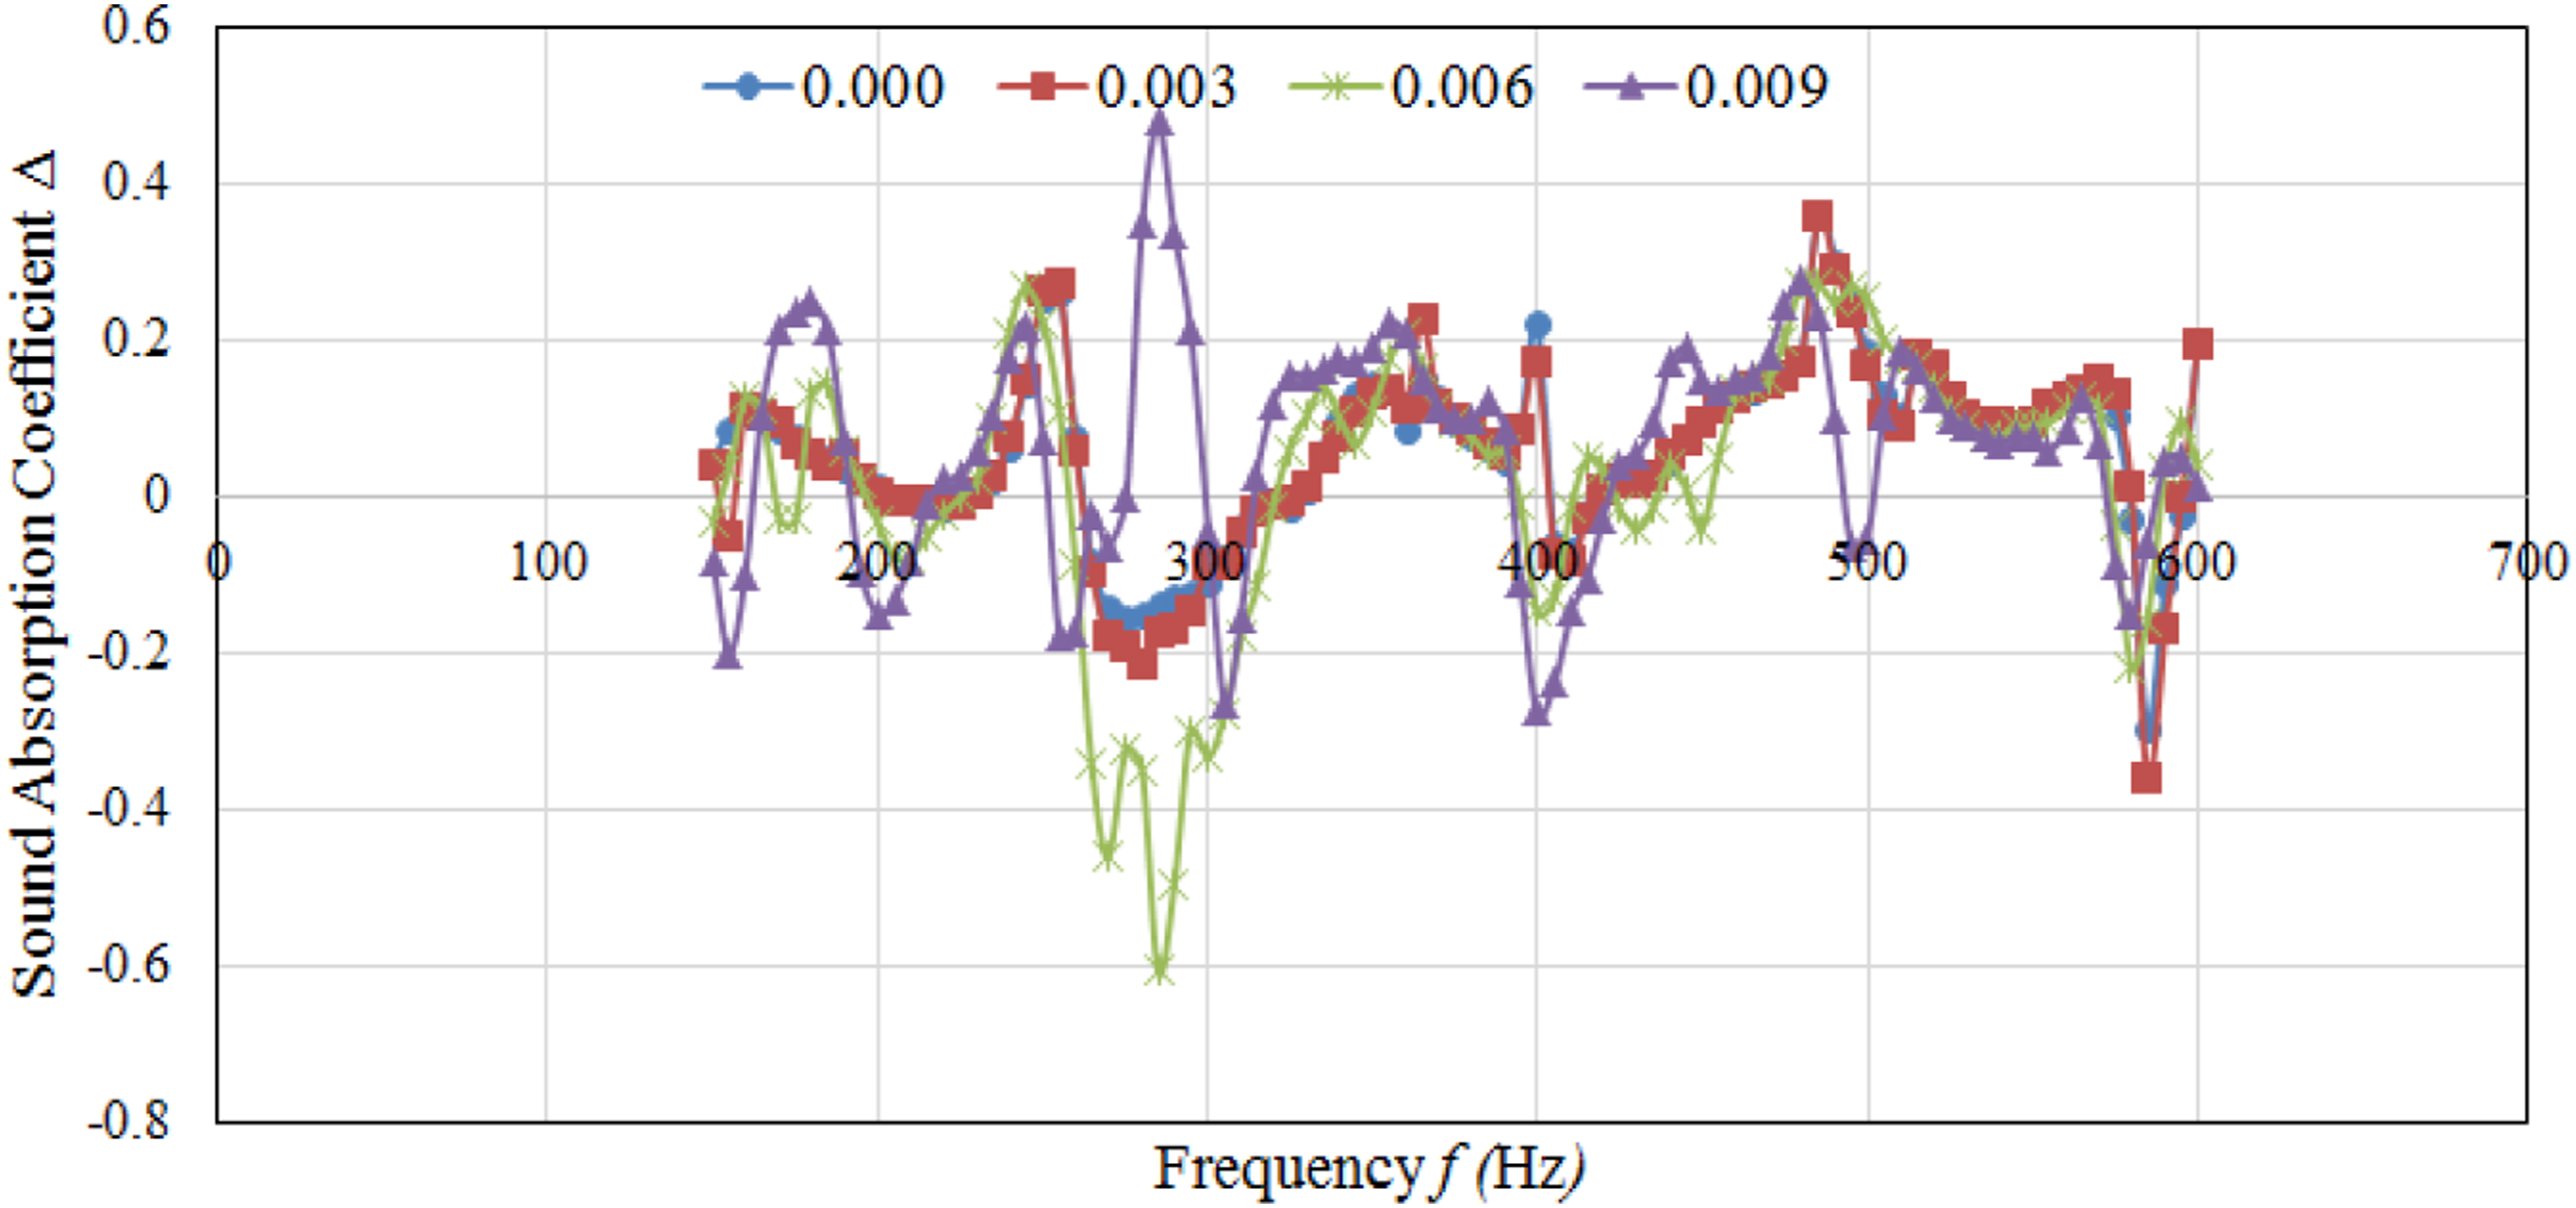
Coupled Helmholtz resonators with a sharable flexible plate
The sharable rigid plate is replaced with a flexible plate so that the two resonators are mechanically coupled. The rubber membrane is secured on the circular metal plate with adhesive. To observe the acoustic damping performance, the flexible and rigid plates are tested to compare the transmission loss when there is no air velocity flow in the air duct. Figures 14 and 15 show the transmission loss variation with the frequency, as the grazing flow Mach number is set to 0 and 0.03, respectively, and the square-shaped Helmholtz resonators are concerned. A comparison is then made between the flexible sharable plate and the sharable rigid plate. Comparison of the transmission losses of square resonators in presence of the sharable rigid and the flexible plate at Ma = 0.0. Variation of the transmission loss comparison of square resonators with frequency, as the flexible plate is applied at Ma = 0.003.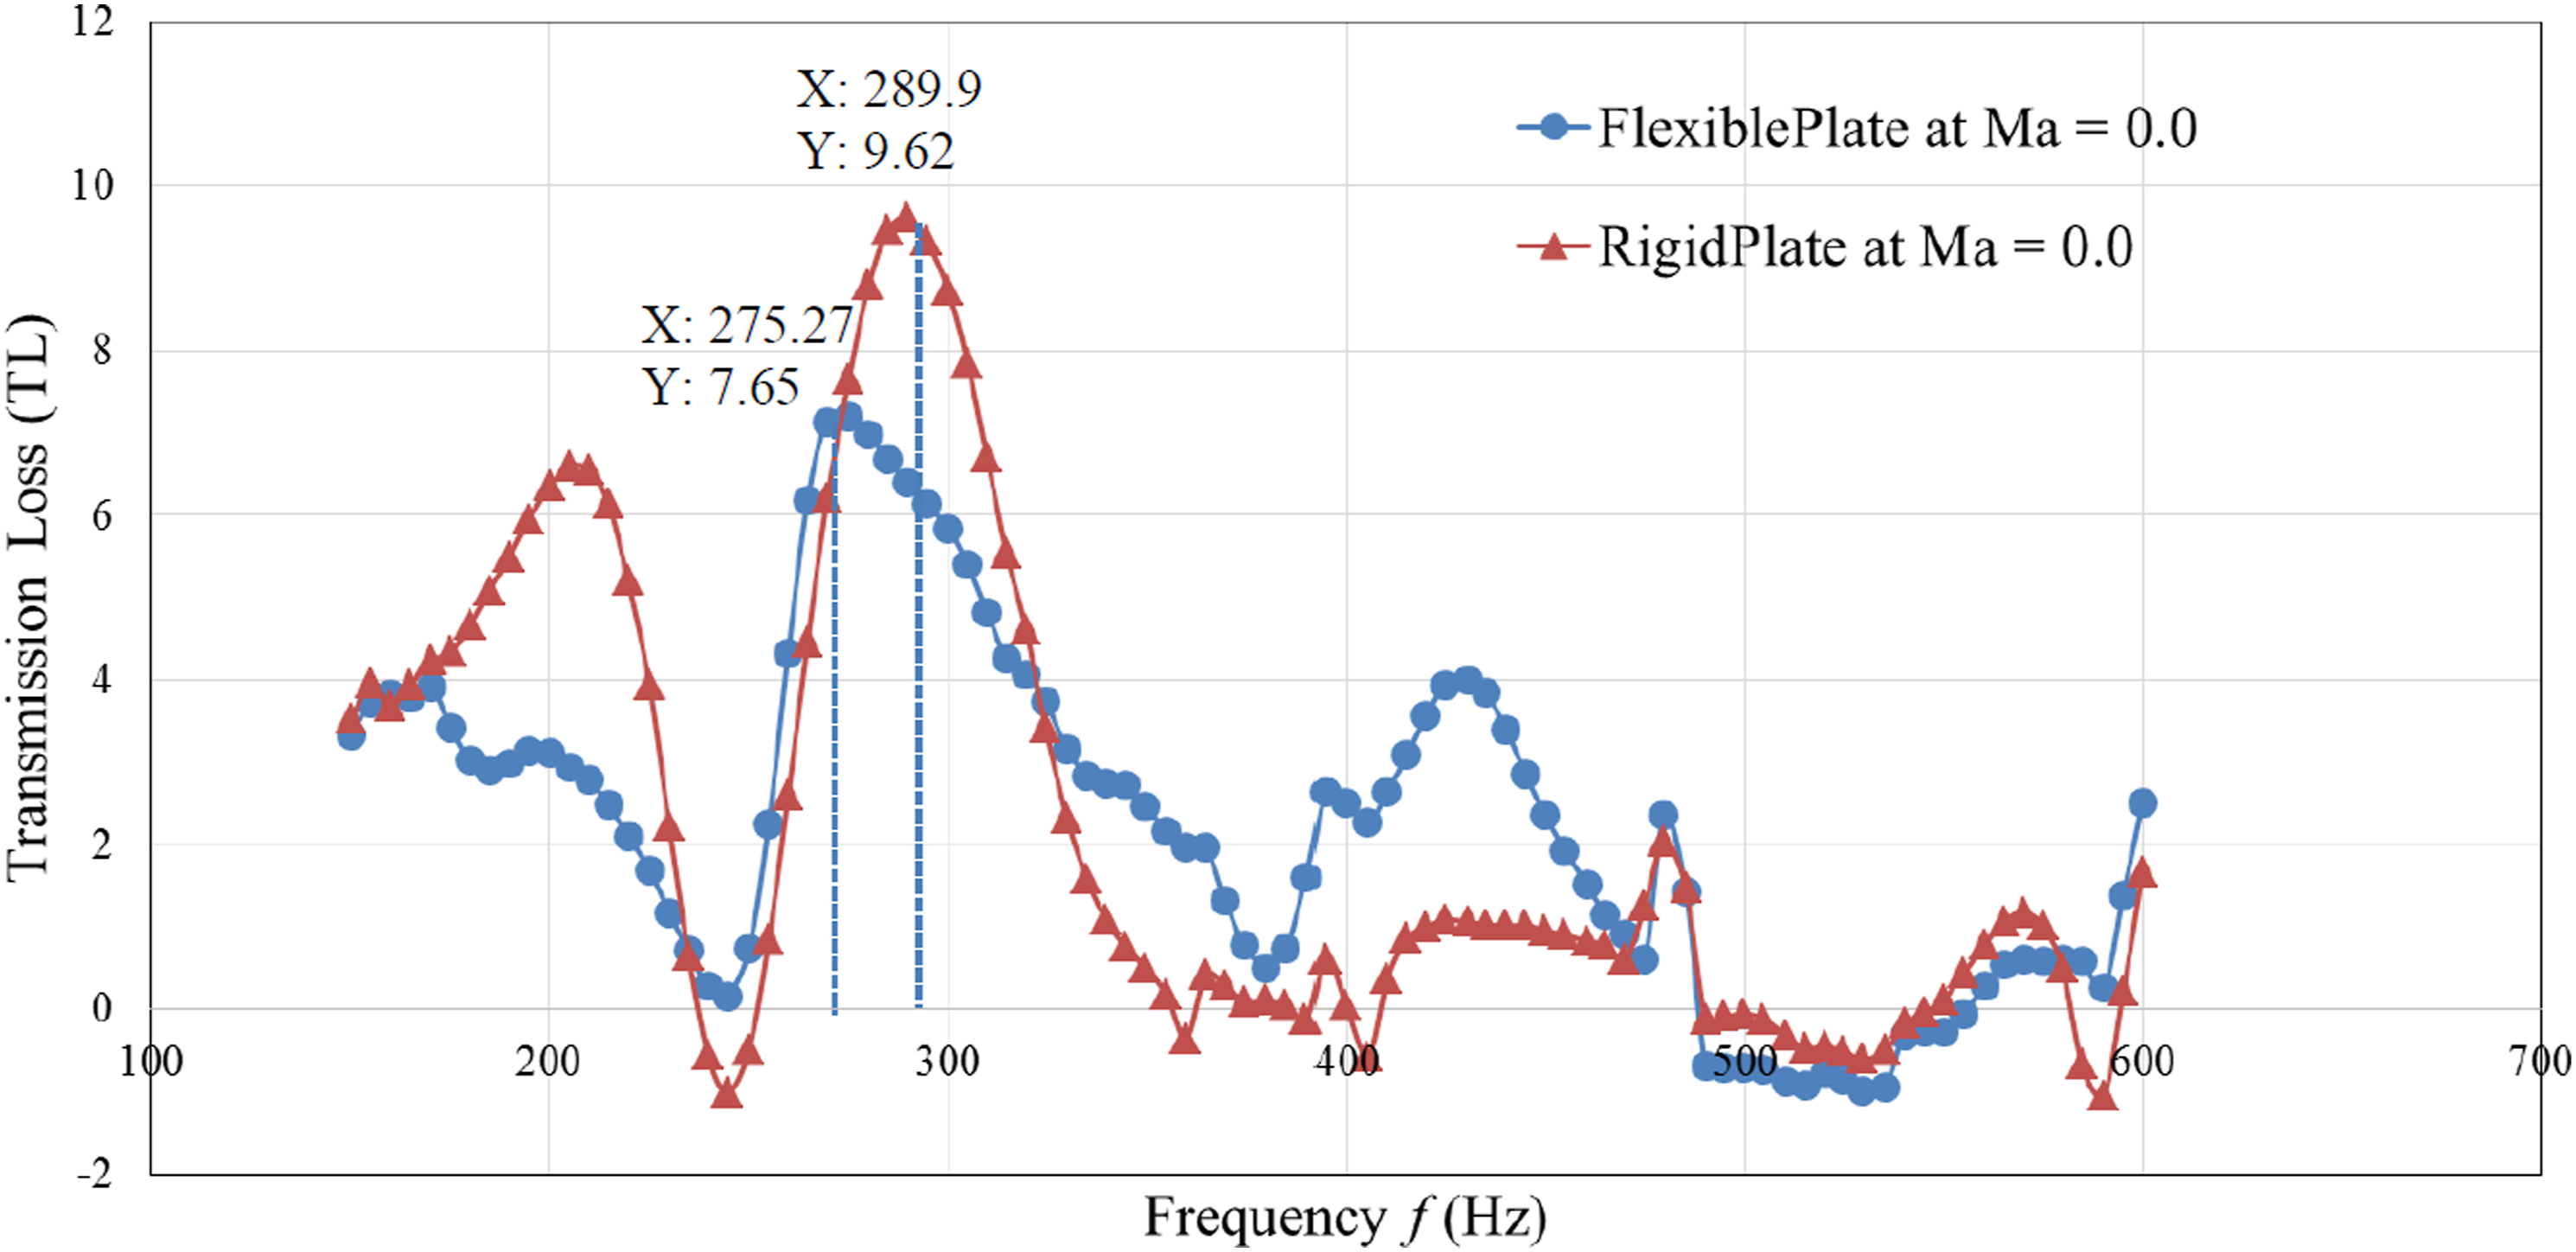
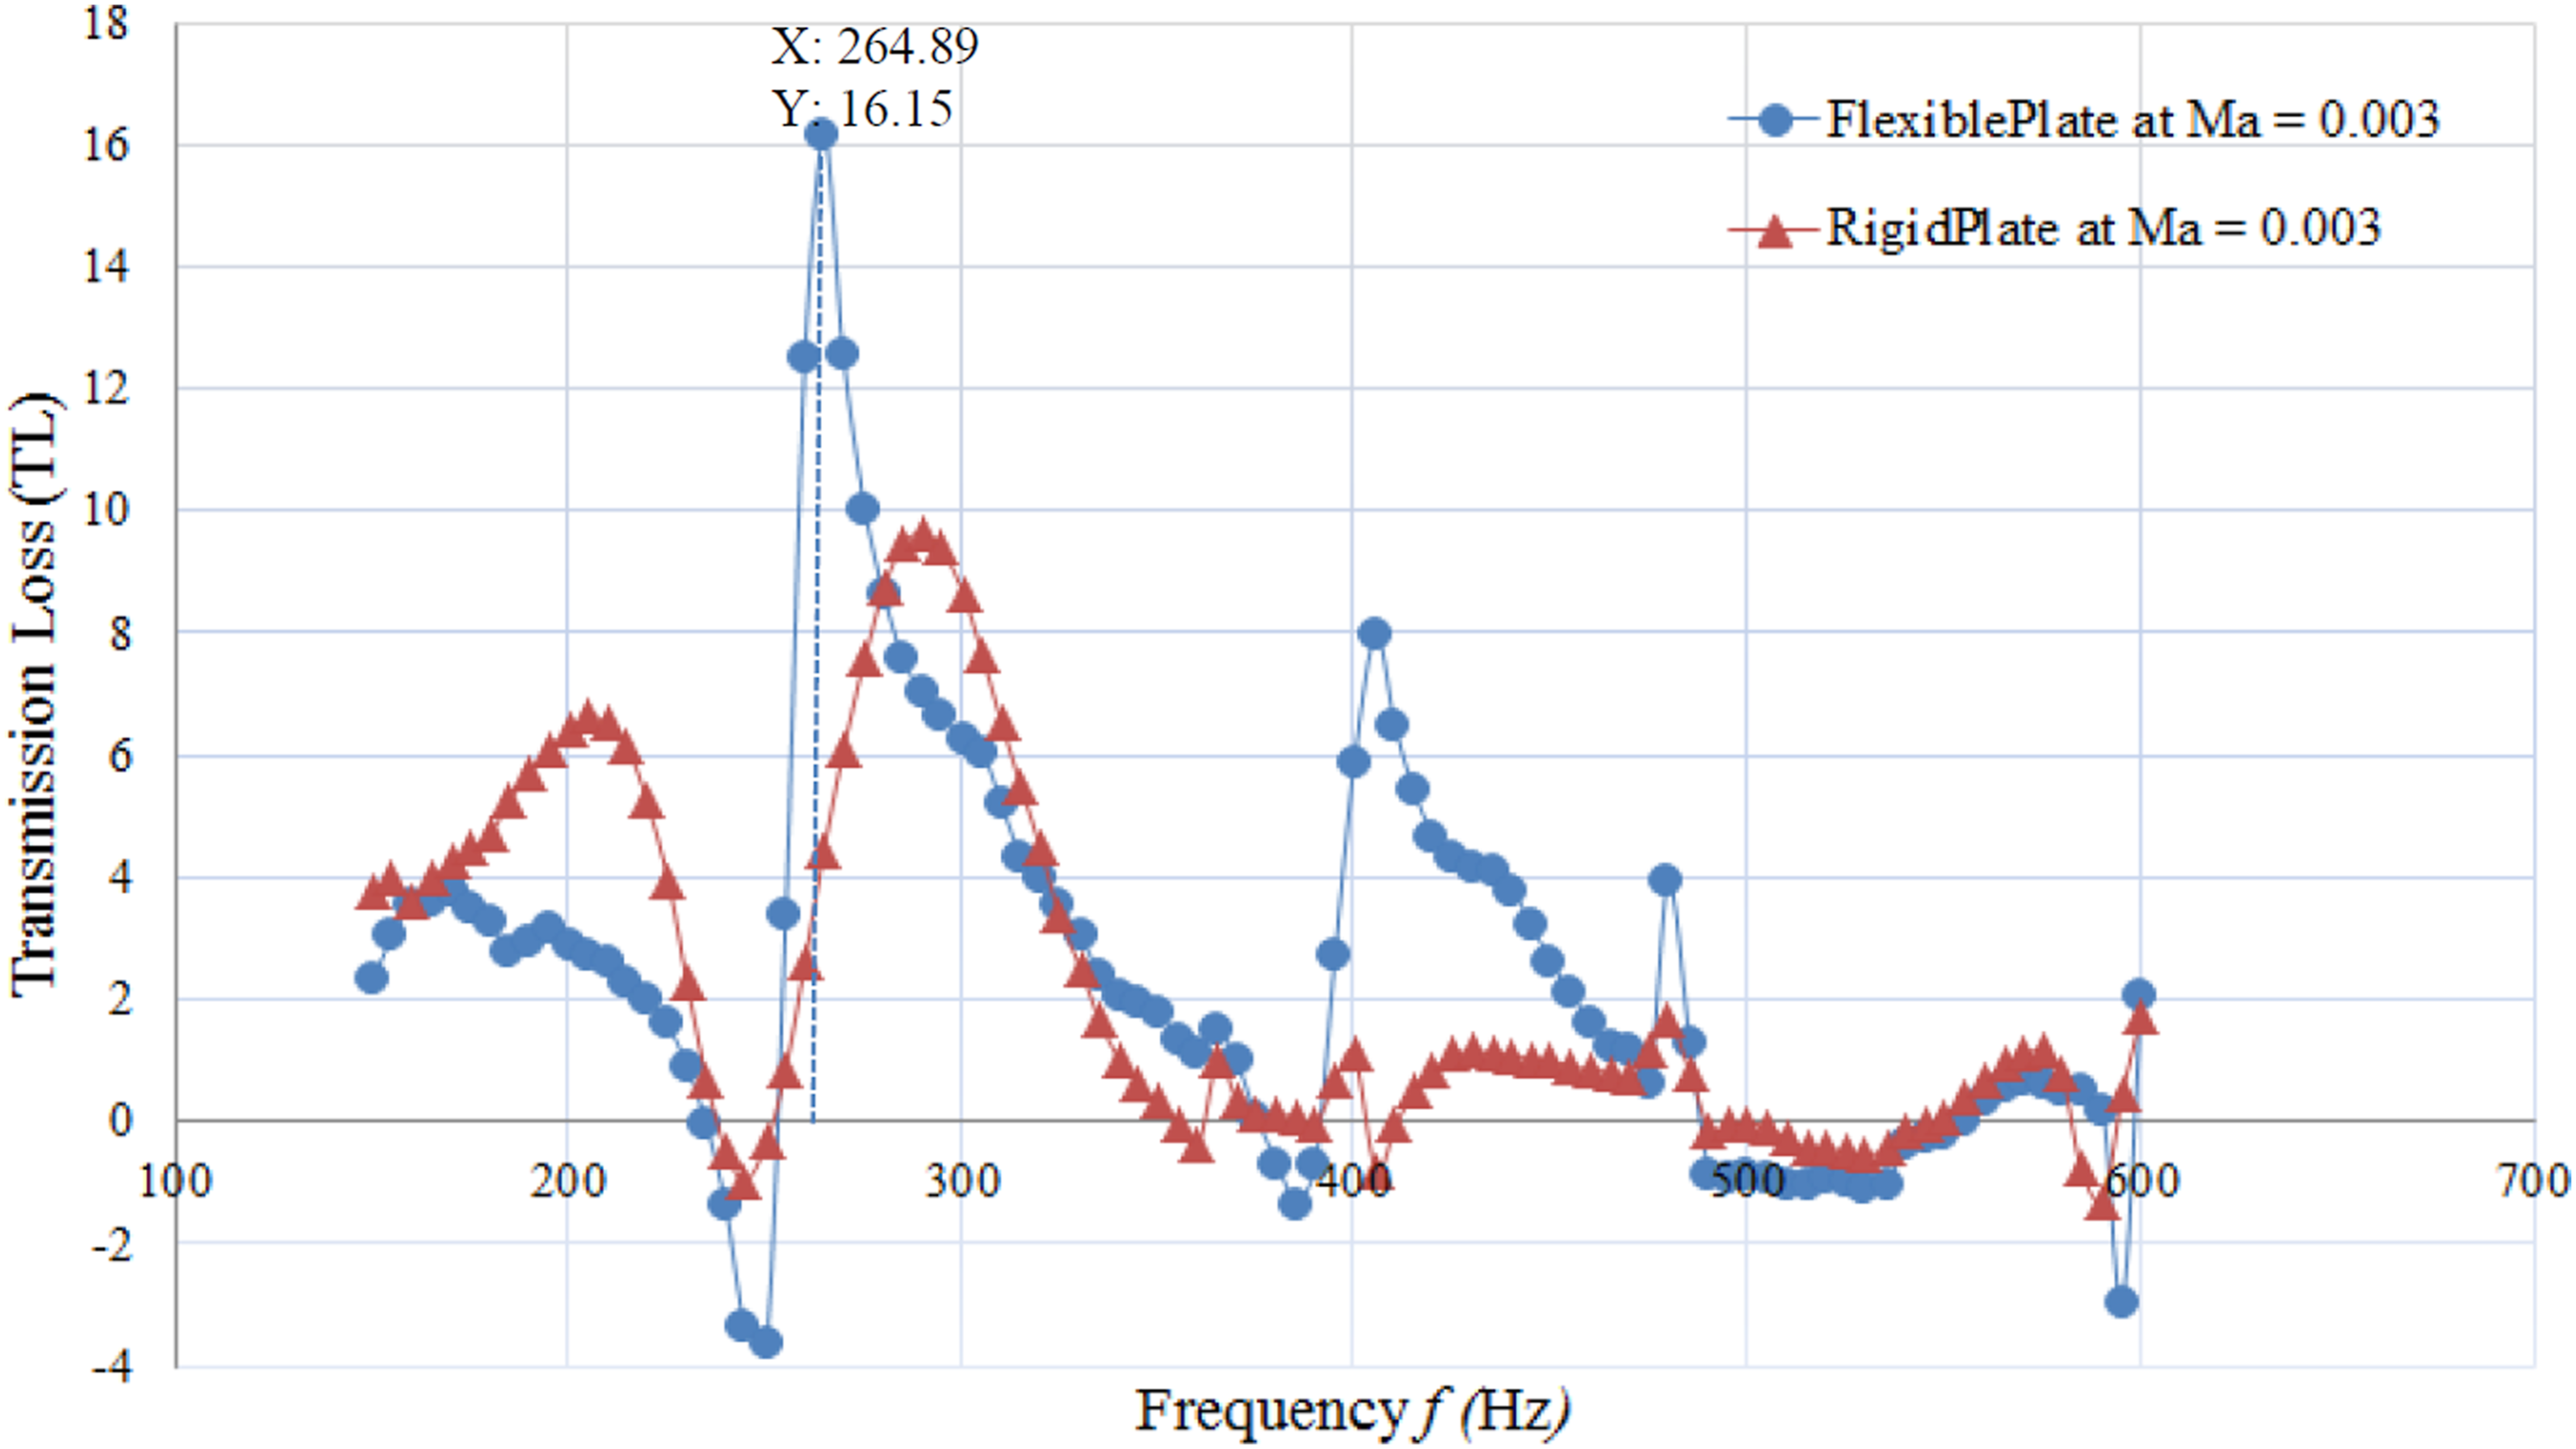
It can be seen that the maximum transmission loss for the flexible rubber plate is 7.7 dB at the frequency of 200.1 Hz in the absence of the grazing flow, that is, Ma=0.00 (see Figure 14). When the grazing flow velocity increased to Ma=0.003 (see Figure 15), the peak transmission loss value of 16.1 dB is obtained at 264.9 Hz. It means that the flexible plate leads to a much more significant transmission loss compared to that of the rigid plate.
Coupled resonators filled with acoustic foam and wool
The experiment is carried out with noise damping materials such as acoustic foam and wool filled into the resonators’ necks. Since the necks are filled up, tests were conducted for a frequency range between 150 Hz and 1000 Hz under velocity flow and no-flow conditions. Figures 16 and 17 show the results of the cylindrical-shaped Helmholtz resonators, as the acoustic form and acoustic wool are inserted, and the grazing flow Mach number is set to 2 different values. Variation of the sound absorption coefficient of coupled cylindrical-shaped resonators filled with noise damping materials at Ma= 0.0 and 0.003. Transmission loss of the cylindrical-shaped coupled Helmholtz resonators filled with Noise Damping Materials at Ma= 0.0 and 0.003.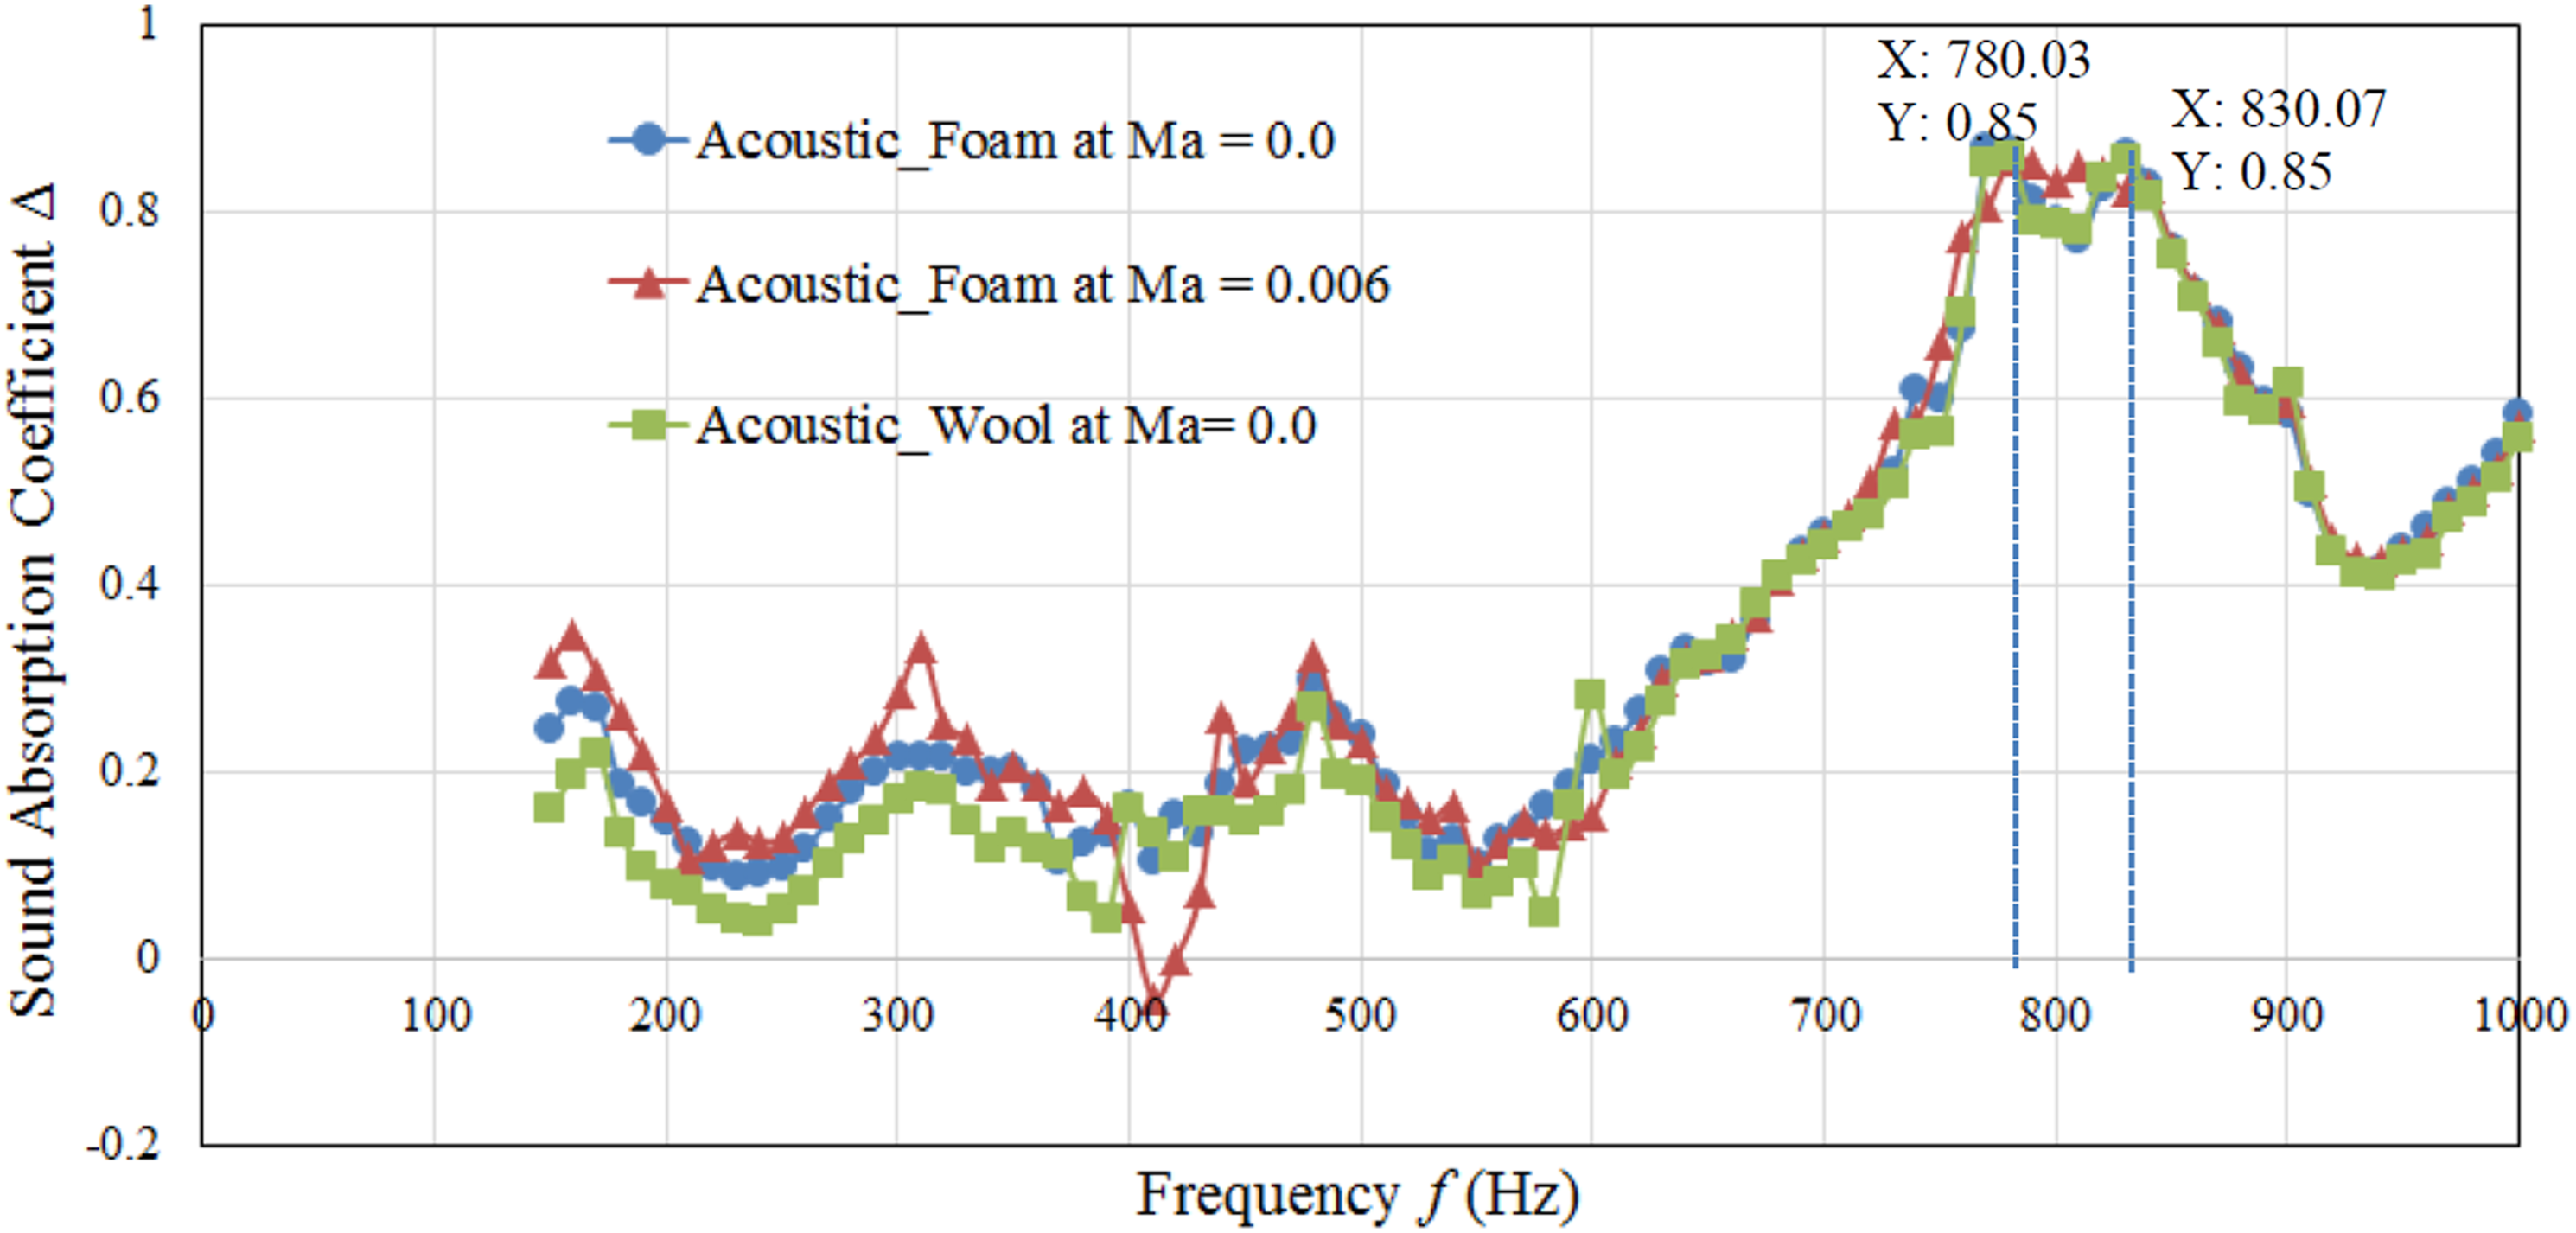
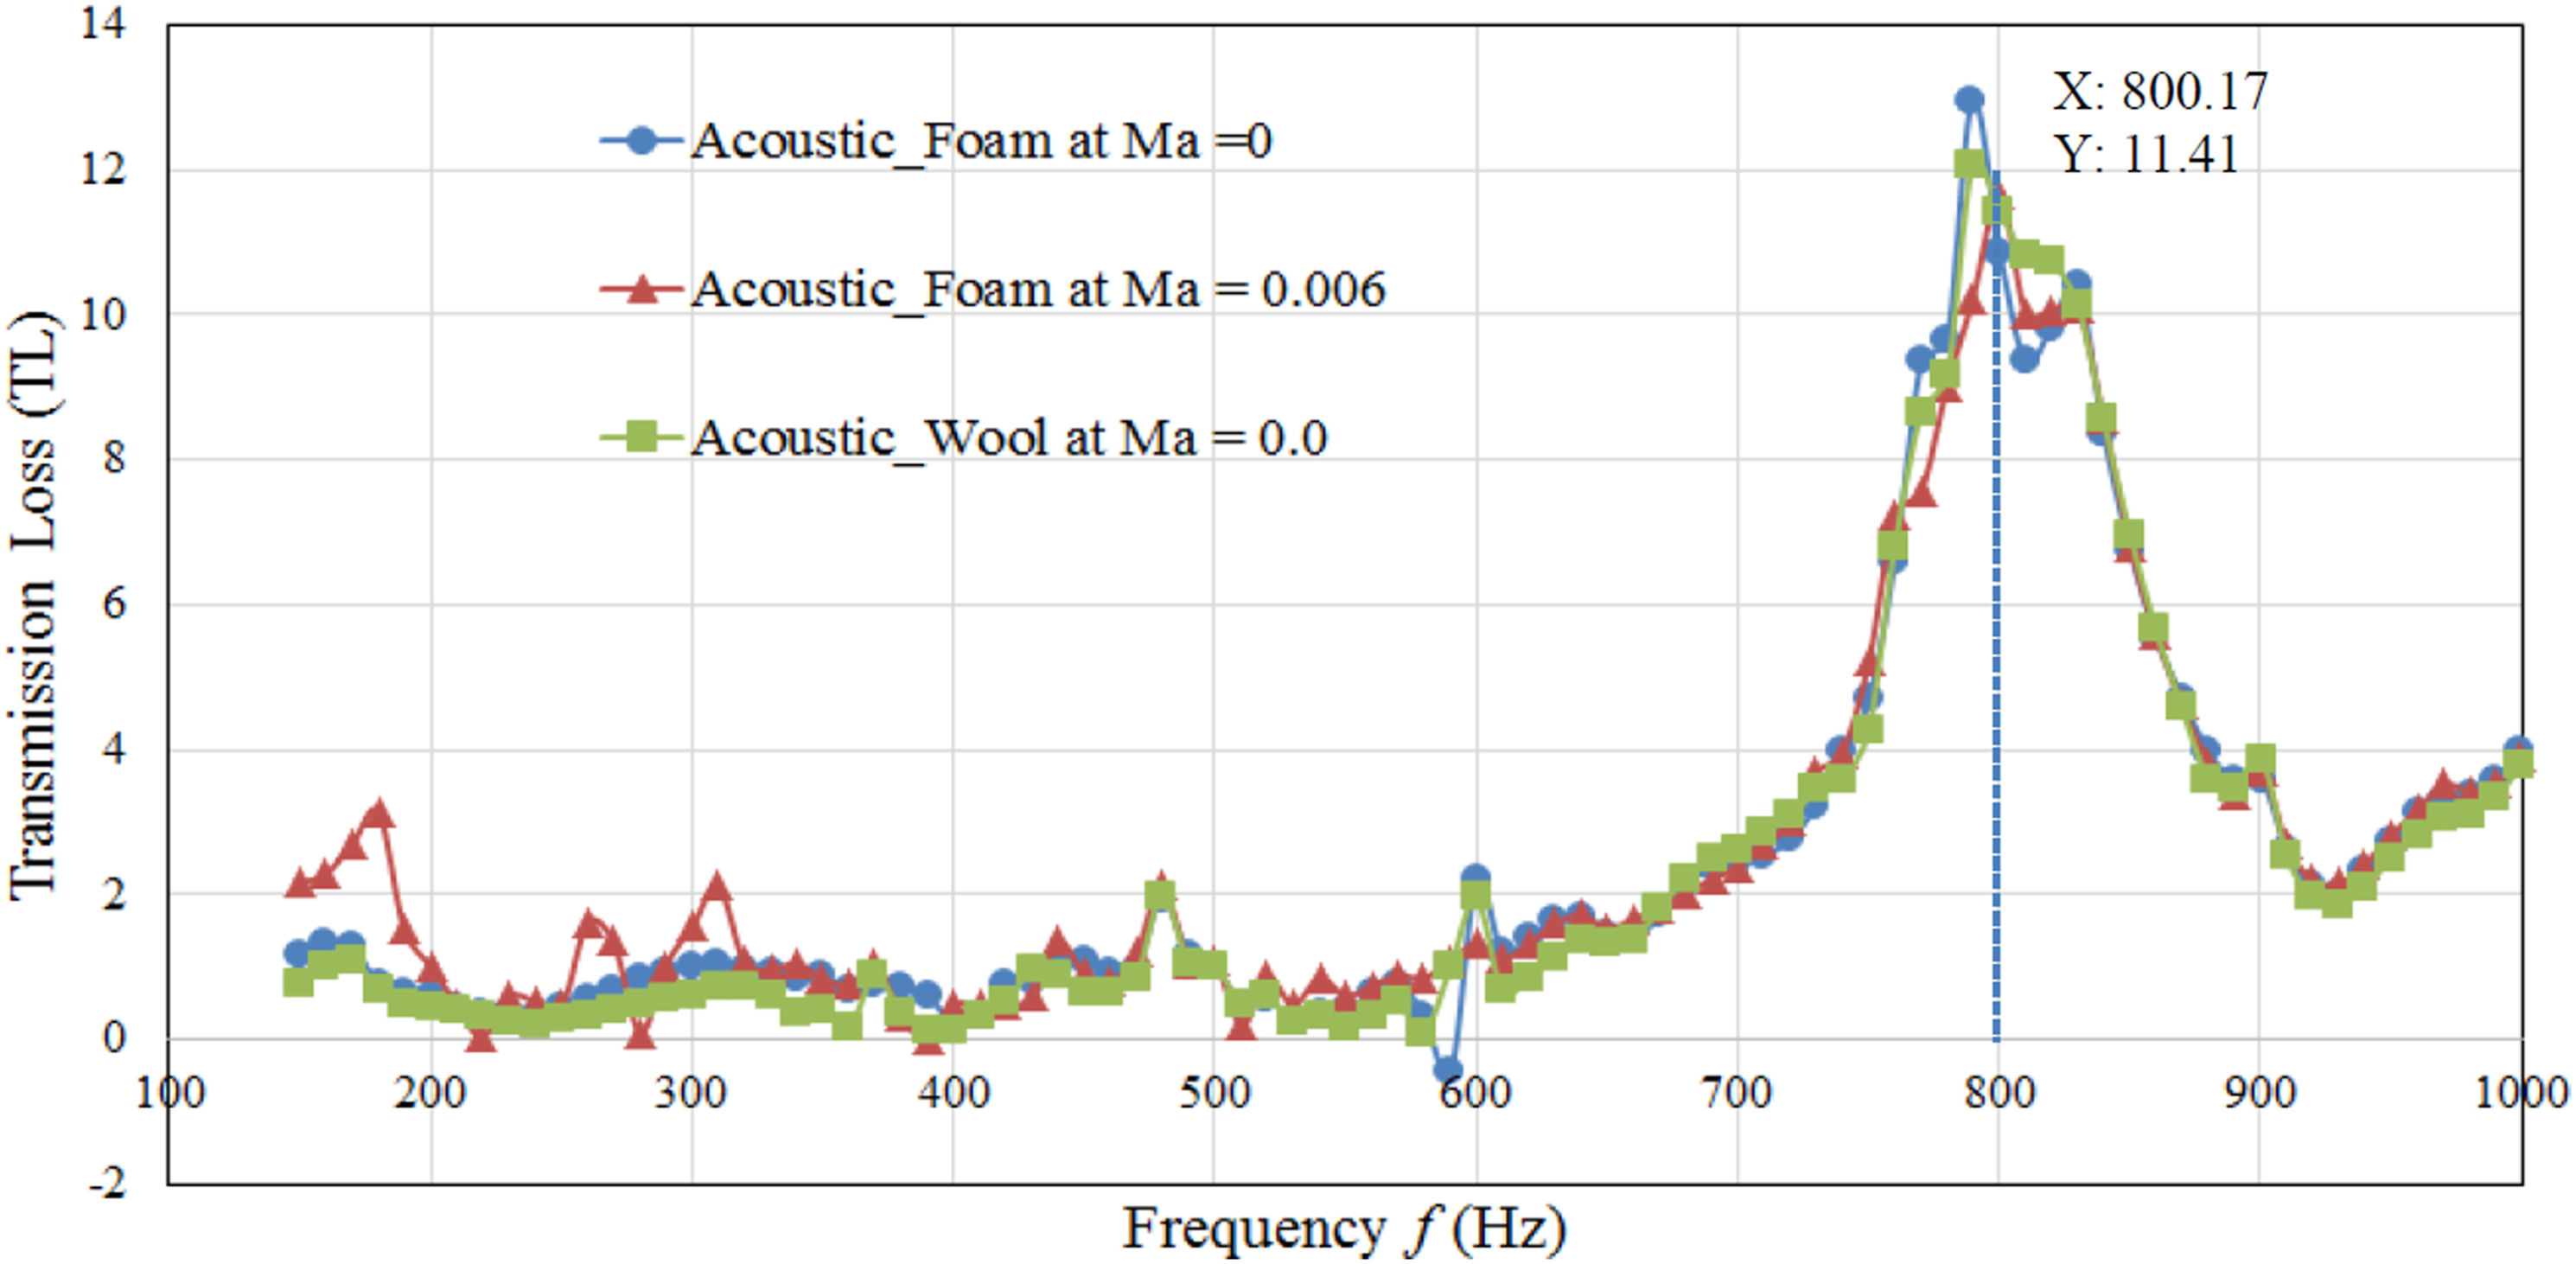
As seen below in Figure 16, acoustic foam and wool would give the transmission loss at 800.1 Hz, at the peak pressure amplitude of 11.4 dB. The plotted graph for absorption coefficient had some trade-offs between 780 Hz and 830 Hz in the test. Keeping the same neck’s diameter with a slight variation in the length of the neck up to 10 mm, the overall results for the no velocity flow condition would be the same. The sound transmission losses in the resonators are quite consistent for different damping materials.
Discussion of the case studies results
After conducting a series of experimental tests in our case study, there are two peaks of transmission loss for both rigid plates, the cylindrical- and square-shaped Helmholtz resonators, which agree well with the theoretical prediction. Additionally, the experimental results are found to be matched for both the cylindrical- and square-shaped resonators, when there is no plate shared between the two resonators. When there is no plate attached between the coupled resonators, it has been found that the distinct transmission loss peaks are located at higher frequencies than the natural resonant frequency of the resonators. For the acoustic damping materials, only one visible peak was seen before 1 kHz, that is, most likely due to the sound waves being reduced in the amplitude of pressure oscillations as the result of the dissipation in resonators. In the absence of the grazing flow, the flexible plate with the cylindrical-shaped resonators configuration resulted in a larger transmission loss than the square-shaped resonators. Further comparison of the rigid plate case of the cylindrical- and square-shaped coupled resonator in the absence of the grazing flow shows that the cylindrical-shaped resonators are performing better than square-shaped resonators in terms of the aeroacoustic damping performances.
Overview of numerical modelling of coupled Helmholtz resonators
Governing equations of the numerical model
The system equations of a pipe with an aeroacoustic damper applied consist of the mass, momentum and energy conservation.1,8 Air is the working medium, and it is assumed to be a perfect gas. The systems equations of Navier–Stokes in the time-domain can then be described as


The thermodynamic state equation also holds as

The fluctuating parts of the air density, flow velocity and acoustic pressure can be expressed in terms of Fourier series expansion as

These quantities,
Substituting Equations (39a) into (38a)–(38c) gives


Equations (40a)–(40c) describe the spatiotemporal evolution of the fluctuating quantities:


These frequency-domain–governing equations (58)–(60) are iteratively determined via COMSOL 5.4. Here, UMFPACK (a set of routines for solving unsymmetric sparse systems) direct solver and Menter’s Shear Stress Transport (SST) turbulence model are applicable due to the non-negligible duct/grazing flow since it introduces much less numerical diffusion and leads to a better prediction of the eddy viscosity. The SST model is a combination of the k-ε model in the free stream and the k-ω model near the solid surface of the duct to capture the turbulence attenuation in details.
Model validation
The unstructured meshes are illustrated in Figure 18. A mesh independence investigation is conducted first. In order to better capture the vortices and the shear layer at the duct-neck joint sections, a finer mesh with 1,260,360 cells is chosen. The selected mesh is enough by benchmarking the present predictions with the available experimental data in Refs. [26–28]. The frequency step is set to 5 Hz and remains the same in all simulated cases. It will be confirmed that the frequency step is fine enough to produce good solutions. Note that the step could be decreased; however, a small frequency step gives rise to a significantly increased computational time and cost. Meanwhile, a smaller step is found to have a negligible effect on the transmission loss variation.21,22 Therefore the frequency step is set to 5 Hz. Computational unstructured mesh of the 2D modelled duct with the modified Helmholtz.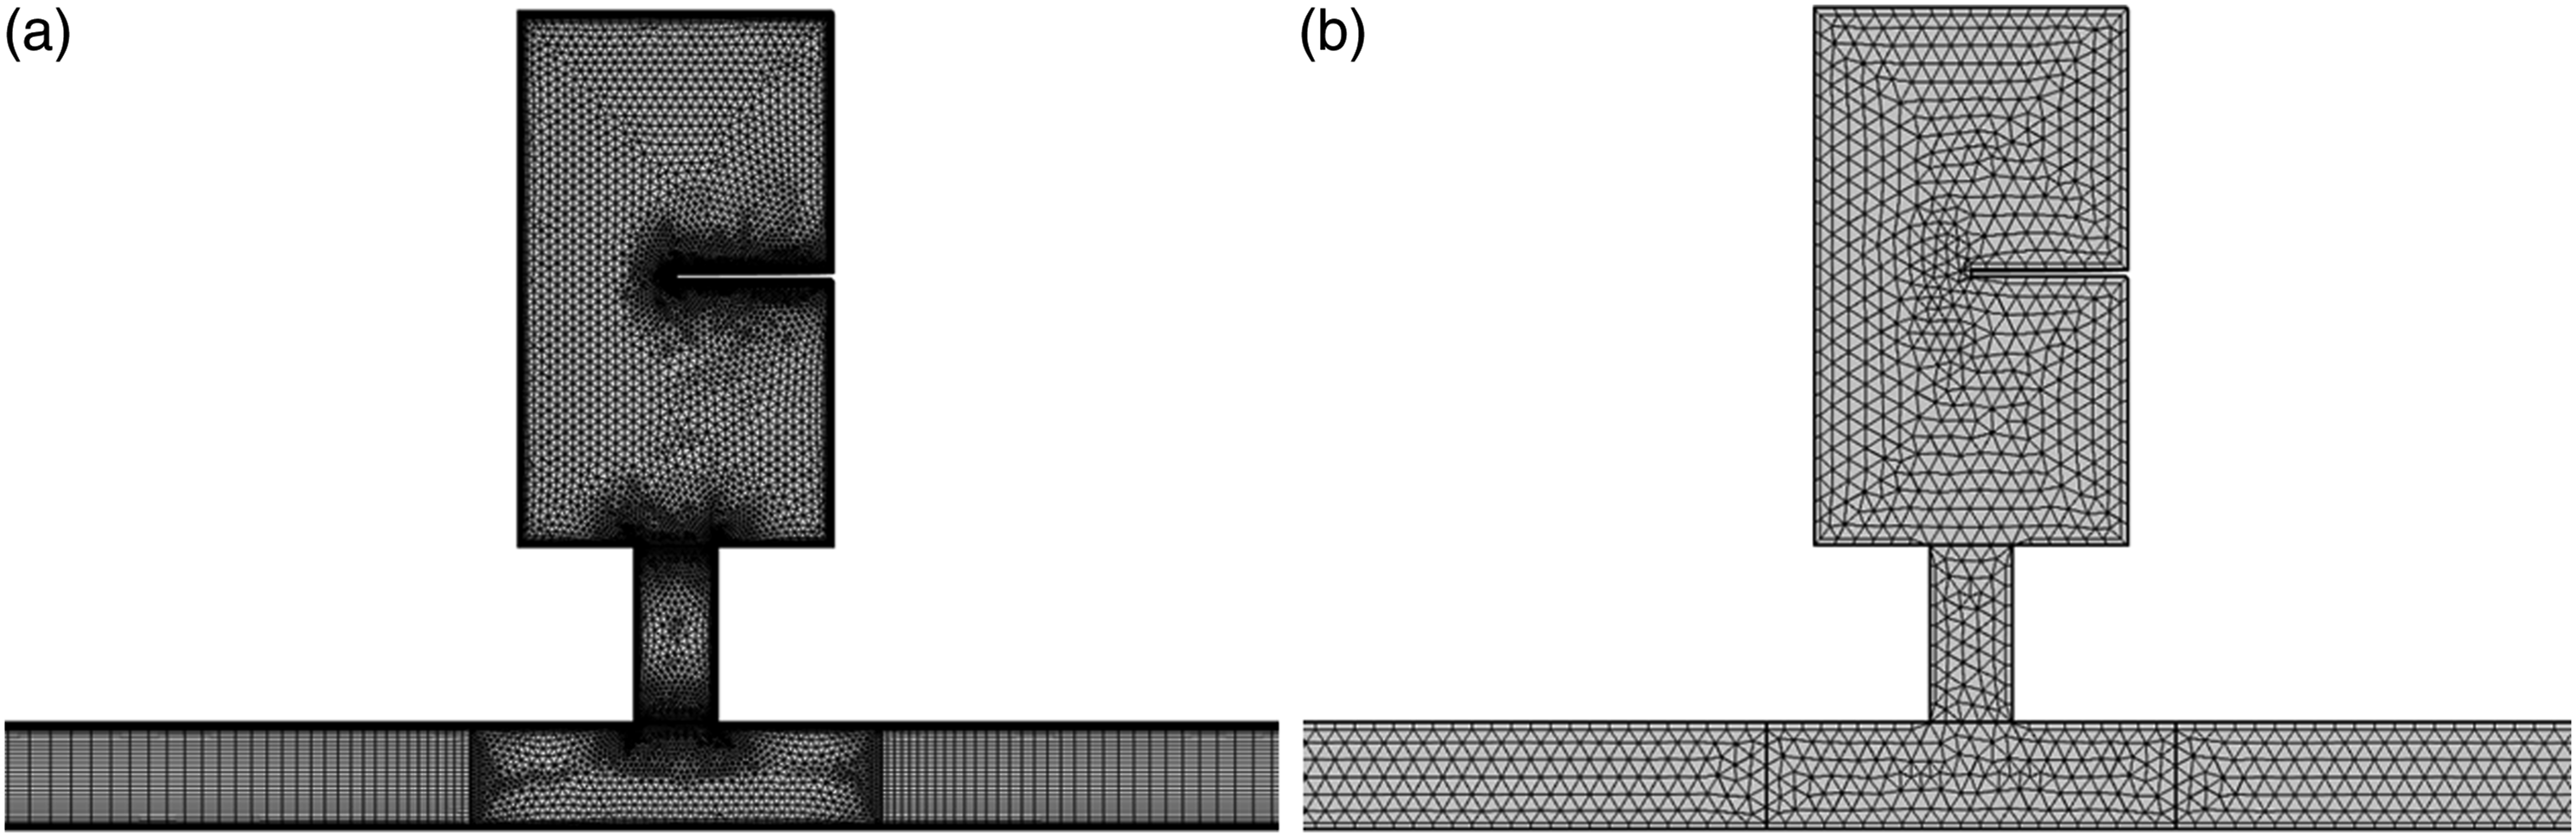
In order to benchmark the developed model, comparison investigations are conducted on a 2D rectangular duct, as a grazing mean flow is present and a conventional Helmholtz resonator is implemented. Our numerical predictions are then compared with the experimental data available in Ref. [1], and the 3D simulation results of the cylindrical duct and the cylindrical resonator. Note that all variables in the current numerical studies are chosen to be the same as the experimental investigations, for example, the geometry and physical dimensions of the HR and the duct and the grazing flow conditions. To be consistent with the experimental measurements, the studied frequency range is set to be between 50 and 250 Hz. Figure 19 shows the comparison of transmission loss varied with the acoustic frequency between the present numerical, 3D time-domain simulation (STAR-CD Ref. [1]) and the experimental results, as the grazing flow Mach number Mu is set to 3 different values. It can be seen that for a given Mu, a good agreement between the numerical, 3D simulation and the experimental results is obtained in general. As the grazing flow Mach number is increased, the maximum transmission loss is found to be reduced dramatically. The corresponding resonant frequency is found to be shifted from 88 Hz to ∼100 Hz, as Mu is increased from 0 to 0.1. This investigation reveals that the developed numerical tool is applicable to evaluate the acoustic attenuation performances of a Helmholtz resonator,34,35 as there is a grazing mean flow.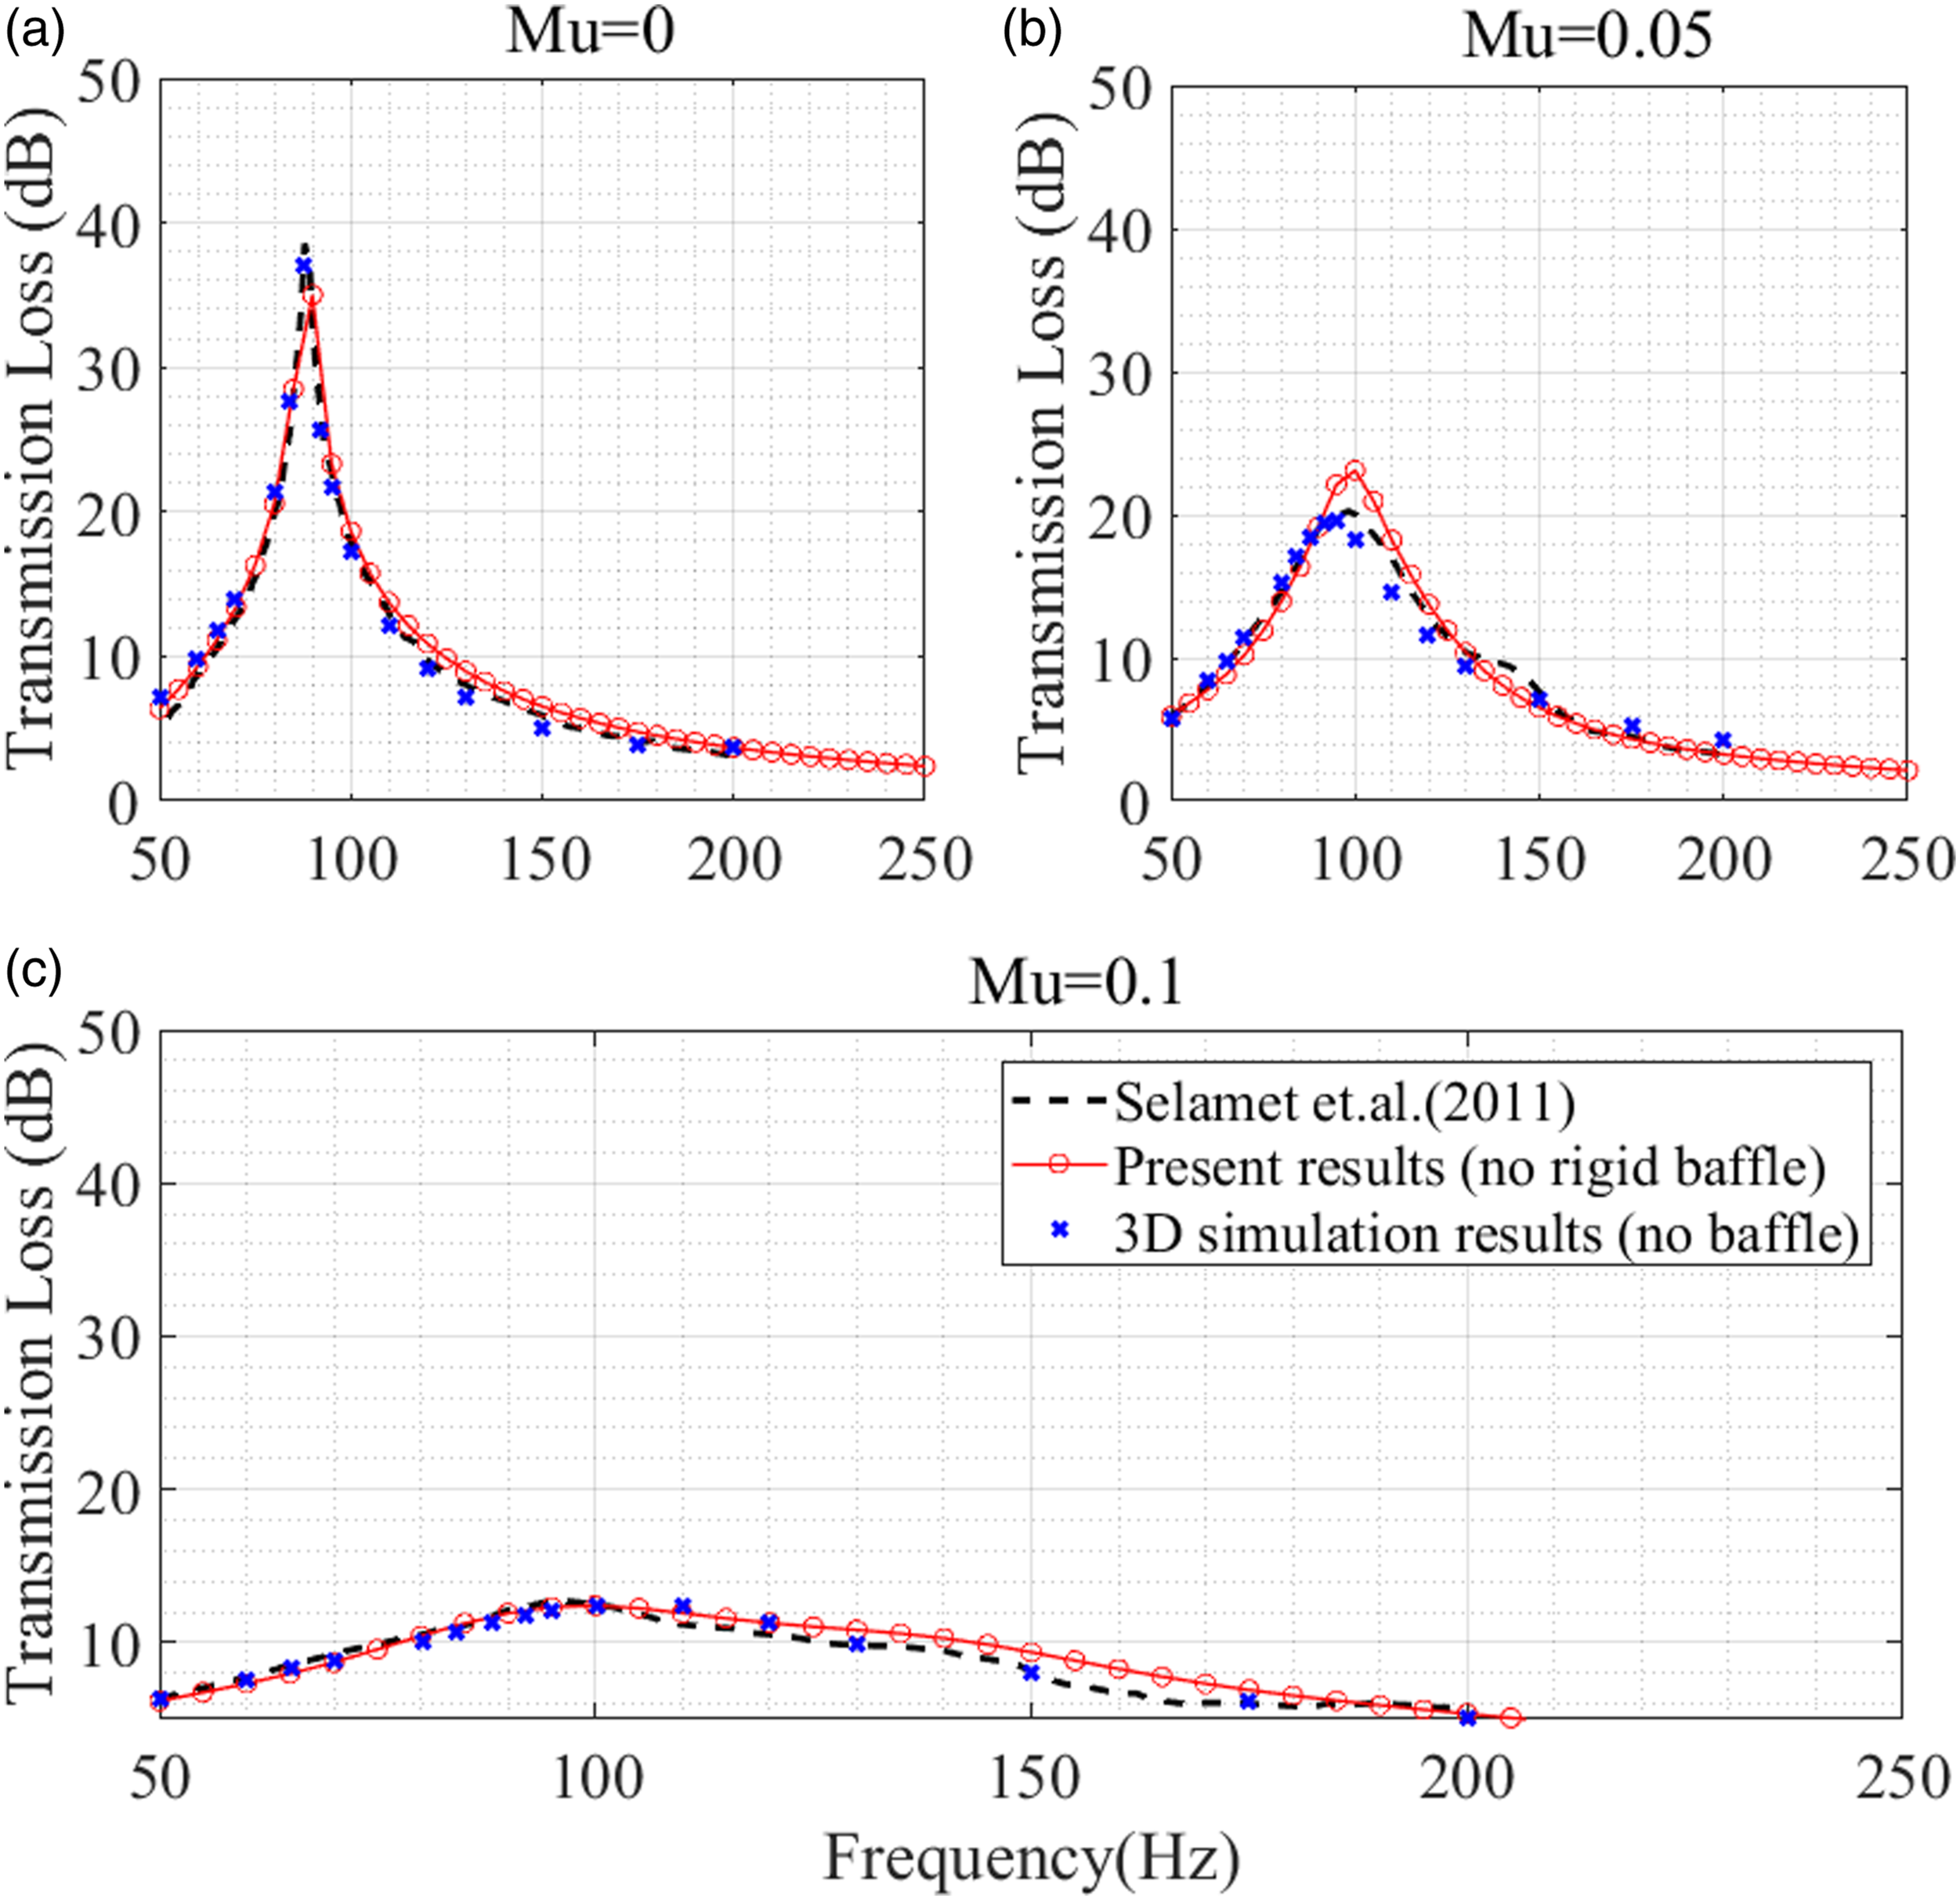
To simulate the experimental tests as reported in the case study, a 3D numerical model is developed and meshed, as shown in Figure 20. There are three boundary conditions specified to use in this model. Firstly, at the solid boundaries, the outer walls of the resonators and air duct are defined as the hard (wall) boundary conditions. Representation of mesh in cylindrical and square resonators.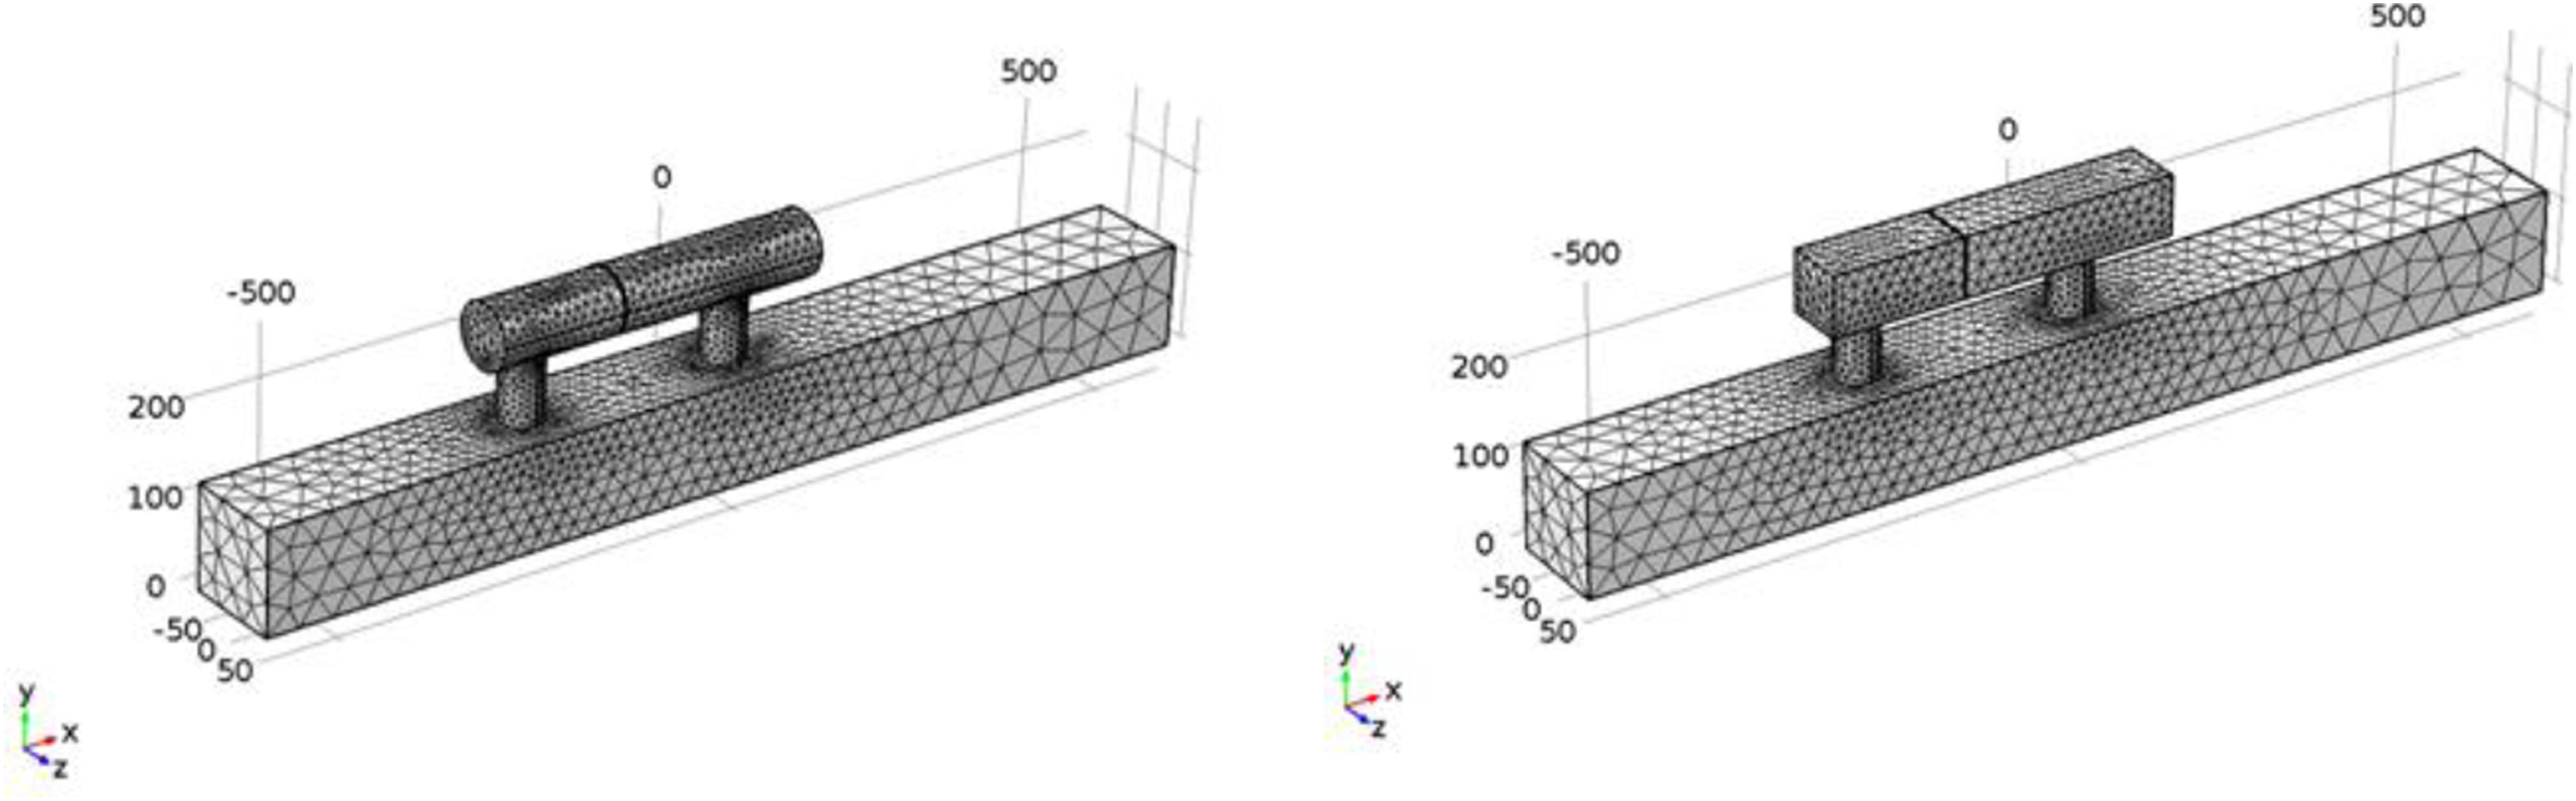
Superposition of incoming imposed plane waves and exiting plane waves. This condition is validated, if the frequency is maintained below the cut off frequency for the second propagating mode. Also, it is important that enough meshes must be sized correctly to allow the proper resolution of pressure waves, since the mesh frequency cut off is related to the mesh size. The figure below shows the mesh for the cylindrical resonators comprises 36,907 elements in domain, 4456 elements in boundary, and 463 edge elements. In contrast, square resonators consist of 47,568 elements in domain, 5090 elements in boundary, and 445 edge elements. It is seen that the mesh in the cylindrical resonators is finer than of the square resonators. Mesh can be calculated by using [
Other boundary conditions are named plane wave radiation at the inlet and outlet. The wave implies consistent pressure across the air duct in which it propagates. The plane wave can be seen as a rigid piston at the outlet and considered in a 2D situation, where boundary condition implies termination in specific acoustic impedance of the medium. Thirdly, the incident pressure field at the inlet with |p’|max= 20 Pa plane waves.
After the previous discussions on three boundary conditions, the surface acoustic pressure field simulation is carried out, as shown in Figure 21, at 250 Hz; the sound levels for HR1 are quite close to one another. When the frequency is set to 500 Hz (see Figure 22), acoustic pressures appear to be similar for HR2 as well. Besides, the frequencies are selected to approximate values, and the results are then compared with the mathematically results. Representations of acoustic pressure field level for resonators at 250 Hz.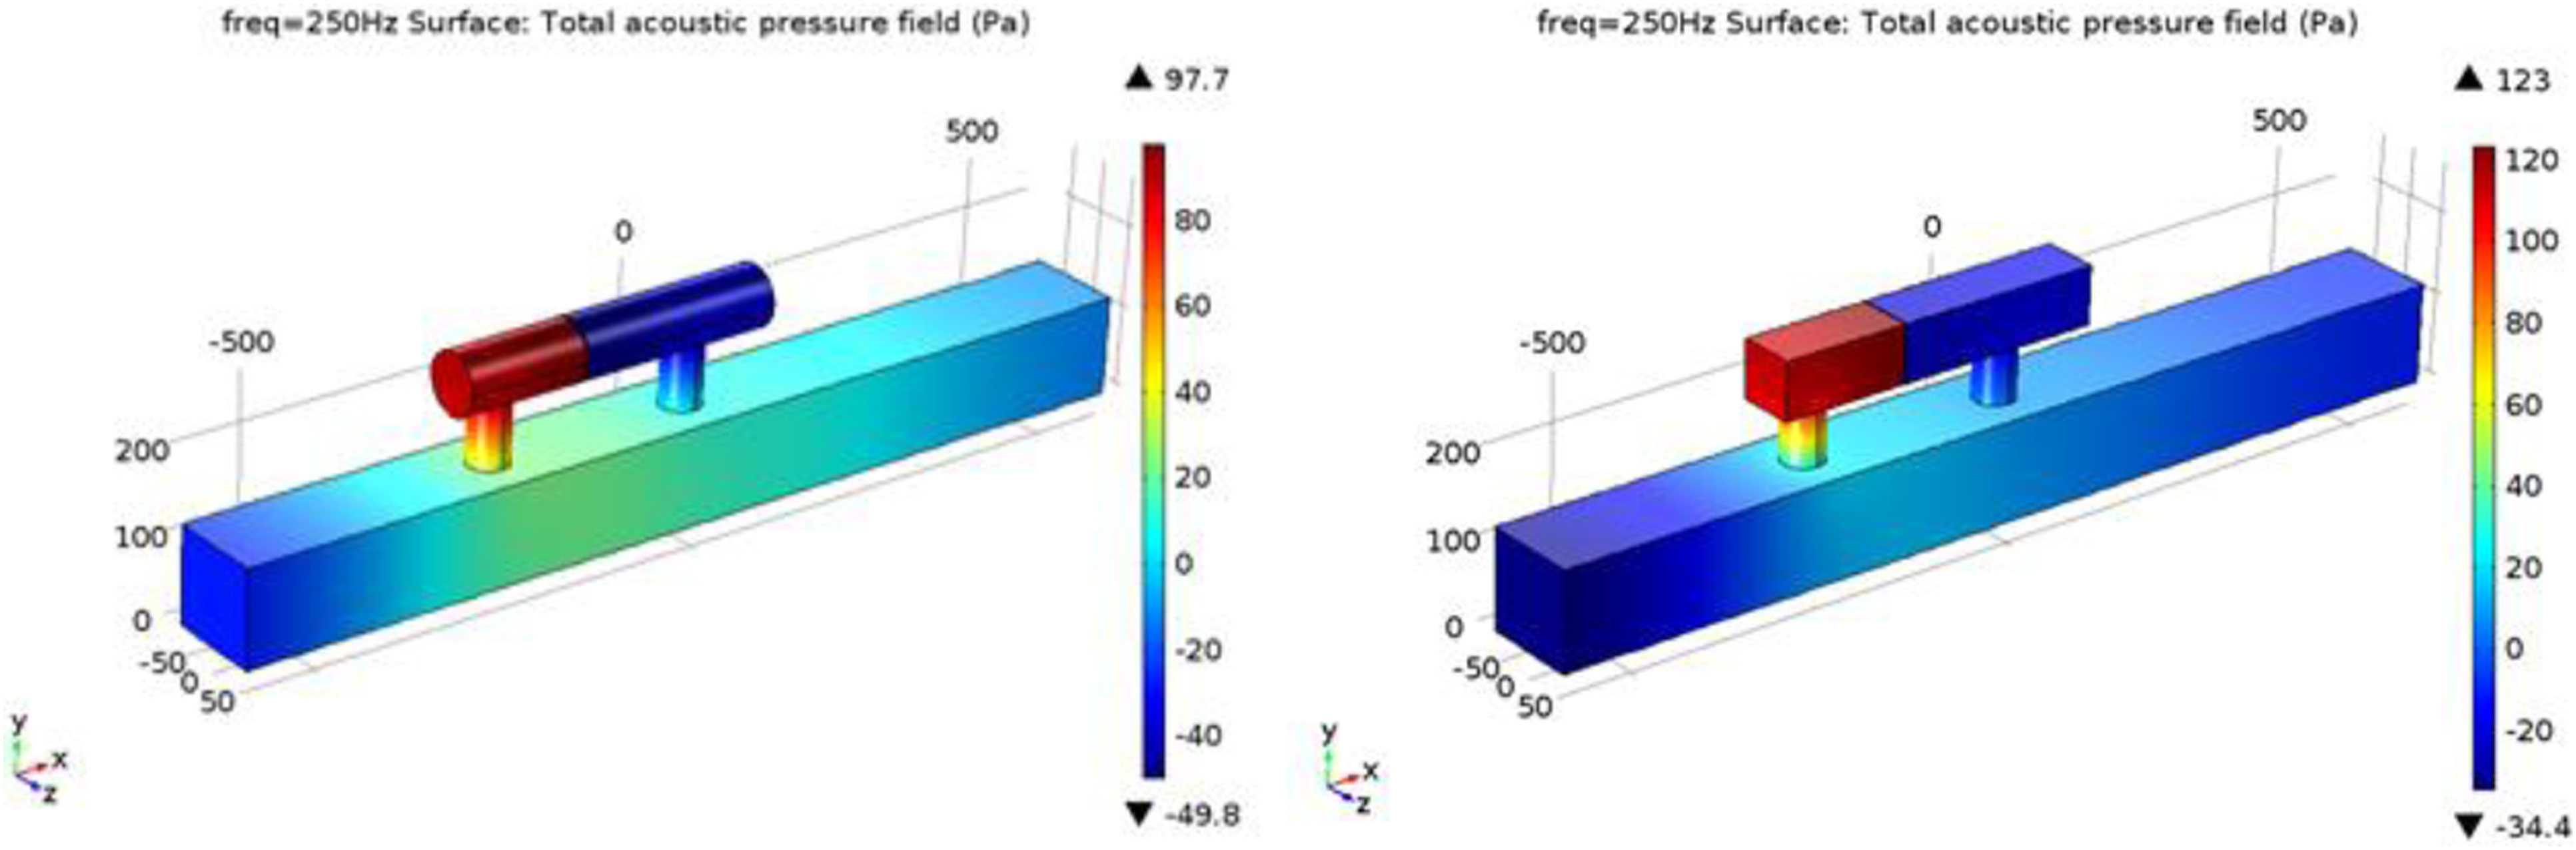
In general, with a proper validation, the frequency-domain model coupled be applied as a prediction tool to determine the acoustics damping performances of coupled Helmholtz resonators. It has great potential to be implemented in combustion-involved engines.103–114 The acoustic damping performance of such coupled Helmholtz resonators is also related to the structures.115–119 The conventional theoretical model120,121 may not be applicable like the experimental122,123 and numerical approaches124,125 as discussed in the present work.
Conclusions and future works
In practice, coupled Helmholtz resonators are applicable to broaden the effective noise damping range.126,130 In this work, we conduct a brief overview of the design and the evolution of coupled Helmholtz resonators. Helmholtz resonator design and optimization can be achieved by two typical approaches. One is the experimental test, and the other is numerical modelling. For this, the recent research and development of the experimental and numerical prediction methods are reviewed. With the proper calibration of acoustic pressure sensors, the experiments could be performed to determine the transmission loss profiles with respect to noise damping materials, the geometry of the resonators and dimensional variations in Helmholtz resonators. The numerical approach could also be applied in either time- or frequency domain. Comparison between the experimental and numerical predictions can then be conducted to validate the model and to optimize the design of coupled Helmholtz resonators.
In this paper, a case study of the transmission loss of geometrical differences in resonators, reduction of neck length, and partition formation between HR1 and HR2 with rigid, flexible plate and noise damping materials have been studied experimentally. It is observed that the mean flow velocity has an insignificant impact in operational ranges of 150–600 Hz regardless of the square- and cylindrical-shaped resonators. More transmission loss peaks are observed in the cylindrical type than the square type, as well as the geometry, which affects the noise damping performances. Besides, the volume of the resonator is inversely proportional to the resonant frequencies. Increasing the cavity volume capacity results in a decrease in the resonant frequency in this case study. The unexpected observation is a shift of the resonant frequency with no rigid plate to the higher value relative to that of the flexible plate and rigid plate when Ma=0.0.
Further experimental and numerical researches could be conducted. It has been shown in our case studies that the cylindrical resonator is experimentally confirmed to perform better in terms of transmission loss than the square resonator. The set-up is done with the air supply pump, which can go up to the maximum mean velocity of 3.2
Footnotes
Acknowledgements
The first and corresponding authors would like to thank Zhejiang University of Science and Technology and Tongji University for providing the financial support. (The National Natural Science Foundation of China, 51776188).
Declaration of conflicting interests
The author(s) declared no potential conflicts of interest with respect to the research, authorship, and/or publication of this article.
Funding
The author(s) disclosed receipt of the following financial support for the research, authorship, and/or publication of this article: the National Natural Science Foundation of China, 51776188; Natural Science Foundation of Zhejiang Province; LQ21E06001 and Natural Science Foundation of Zhejiang Province; LQ21E06003.