
Abstract
Herein, the performance and inner flow characteristics of a single-stage single-suction centrifugal pump with multi-malfunctions (broken blade and seal ring abrasion) were determined through tests and numerical simulation. The vibration, inner flow, pressure, and radial force of the centrifugal pump were analyzed in detail. Compared with those of a normal pump, the head and efficiency of the pump with multi-malfunctions decreased by 10.56 and 10.09%, respectively, under the design flow rate. The general vibration level most significantly increased at the foot of the pump. The axial passing frequency of each measuring point increased in varying degrees, and new characteristic frequencies appeared at 5, 2, and 3 axial passing frequencies. The simulation results showed that in the pump with multi-functions, the pressure gradient near the broken blade was distinctly reduced, and the periodicity of the impeller radial force became weaker and more concentrated, thus exhibiting different performance than the normal pump. The peak-to-peak value of the pressure pulsation near the tongue increased by 8.5%, whereas that at the pump outlet decreased by 6.8%. Moreover, a vortex appeared at the inlet and another at the middle of the impeller, and the low-pressure zone near the impeller inlet expanded to the middle of the impeller. The results of this work can be used as reference for pump fault diagnosis.
Keywords
Introduction
As a type of general machinery, centrifugal pumps are widely used such as in mechanical engineering, aerospace, and petrochemical industries. Most studies on centrifugal pumps have mainly focused on energy performance and inner flow; however, only a few have investigated their malfunction, which has become increasingly important for pump operations.
Previous research on rotating machinery faults mainly focused on the mechanism and fault diagnosis. Zhu 1 analyzed the impeller clogging, impeller fracture, and seal ring abrasion on a multistage centrifugal pump and proposed a new method to monitor the efficiency of a multistage centrifugal pump based on vibration parameters. Zhang and co-workers2–4 introduced some common malfunctions in centrifugal pumps and generalized certain relative treatments to solve them. Zhao et al. 5 presented a vibration extraction method and experimentally validated its reliability; a recurrence quantification analysis and Elman neural networks were also implemented. Mele et al. 6 studied the relationship between vibration and inner flow in centrifugal pumps by varying the frequencies and concluded that flow-induced vibrations can increase with the rotational speed. By testing a marine centrifugal pump, Chen et al. 7 studied the influence of the shifting load on vibration and indicated that the vibration level of the centrifugal pump was proportional to the 4th–9th power of the rotational speed. Srivastav et al. 8 found that vibrations decreased with the decrease in the radial gap between the impeller and diffuser. Sohre 9 classified the typical symptoms and malfunctions of the rotating machinery into nine categories of 37 species. Samanta 10 monitored, analyzed, and processed the malfunction signal of an induction motor based on the Hilbert and Park transforms. Chen et al. 11 developed a method for diagnosing the mechanical malfunction of pumps by local mean decomposition. Wang et al. 12 classified the regular diagnosis methods of pumps and provided a malfunction diagnosis system, introducing the signal processing method and spectral band technique. The accuracy of the diagnostic method was verified by long-term monitoring. Based on a centrifugal pump with an inducer, Xiao et al. 13 studied the influence of the seal ring gap of a centrifugal pump and concluded that the gap size can significantly influence the cavitation performance.
Previous research works on centrifugal pumps were mostly based on the single-malfunction condition; however, only a few studies with a multi-fault analysis have been conducted. To provide a reference for the diagnosis of a pump with multi-malfunctions, a single-stage single-suction marine centrifugal pump was chosen herein as the research model. Moreover, the multi-malfunctions, including single-blade breakage and seal ring abrasion, were analyzed by simulation and experiment.
Experimental analysis
Model
The research was based on a vertical single-stage single-suction centrifugal pump whose design flow rate, head, speed, and specific speed were Q0 = 25 m³/h, H = 34 m, n = 2950 r/min, and ns = 66.7, respectively. The impeller inlet diameter (D1), impeller outlet diameter (D2), number of impeller blades, diameter of volute (D4), and front seal ring clearance (f) were 65 mm, 165 mm, 6, 50 mm, and 0.15 mm, respectively.
Multiple malfunction scheme
In this research, the multi-malfunctions include the broken impeller and front seal ring abrasion. Figure 1 shows the comparison between the normal and broken blades. The broken impeller blade was cut at 1/4 of the length near the outlet. In Figure 2, the clearance of the normal seal ring is 0.15 mm; to introduce a malfunction condition, the clearance of the front seal ring is changed to 0.75 mm. For convenience, the models of the normal pump and pump with multi-malfunctions are denoted herein as the NP and MP, respectively.
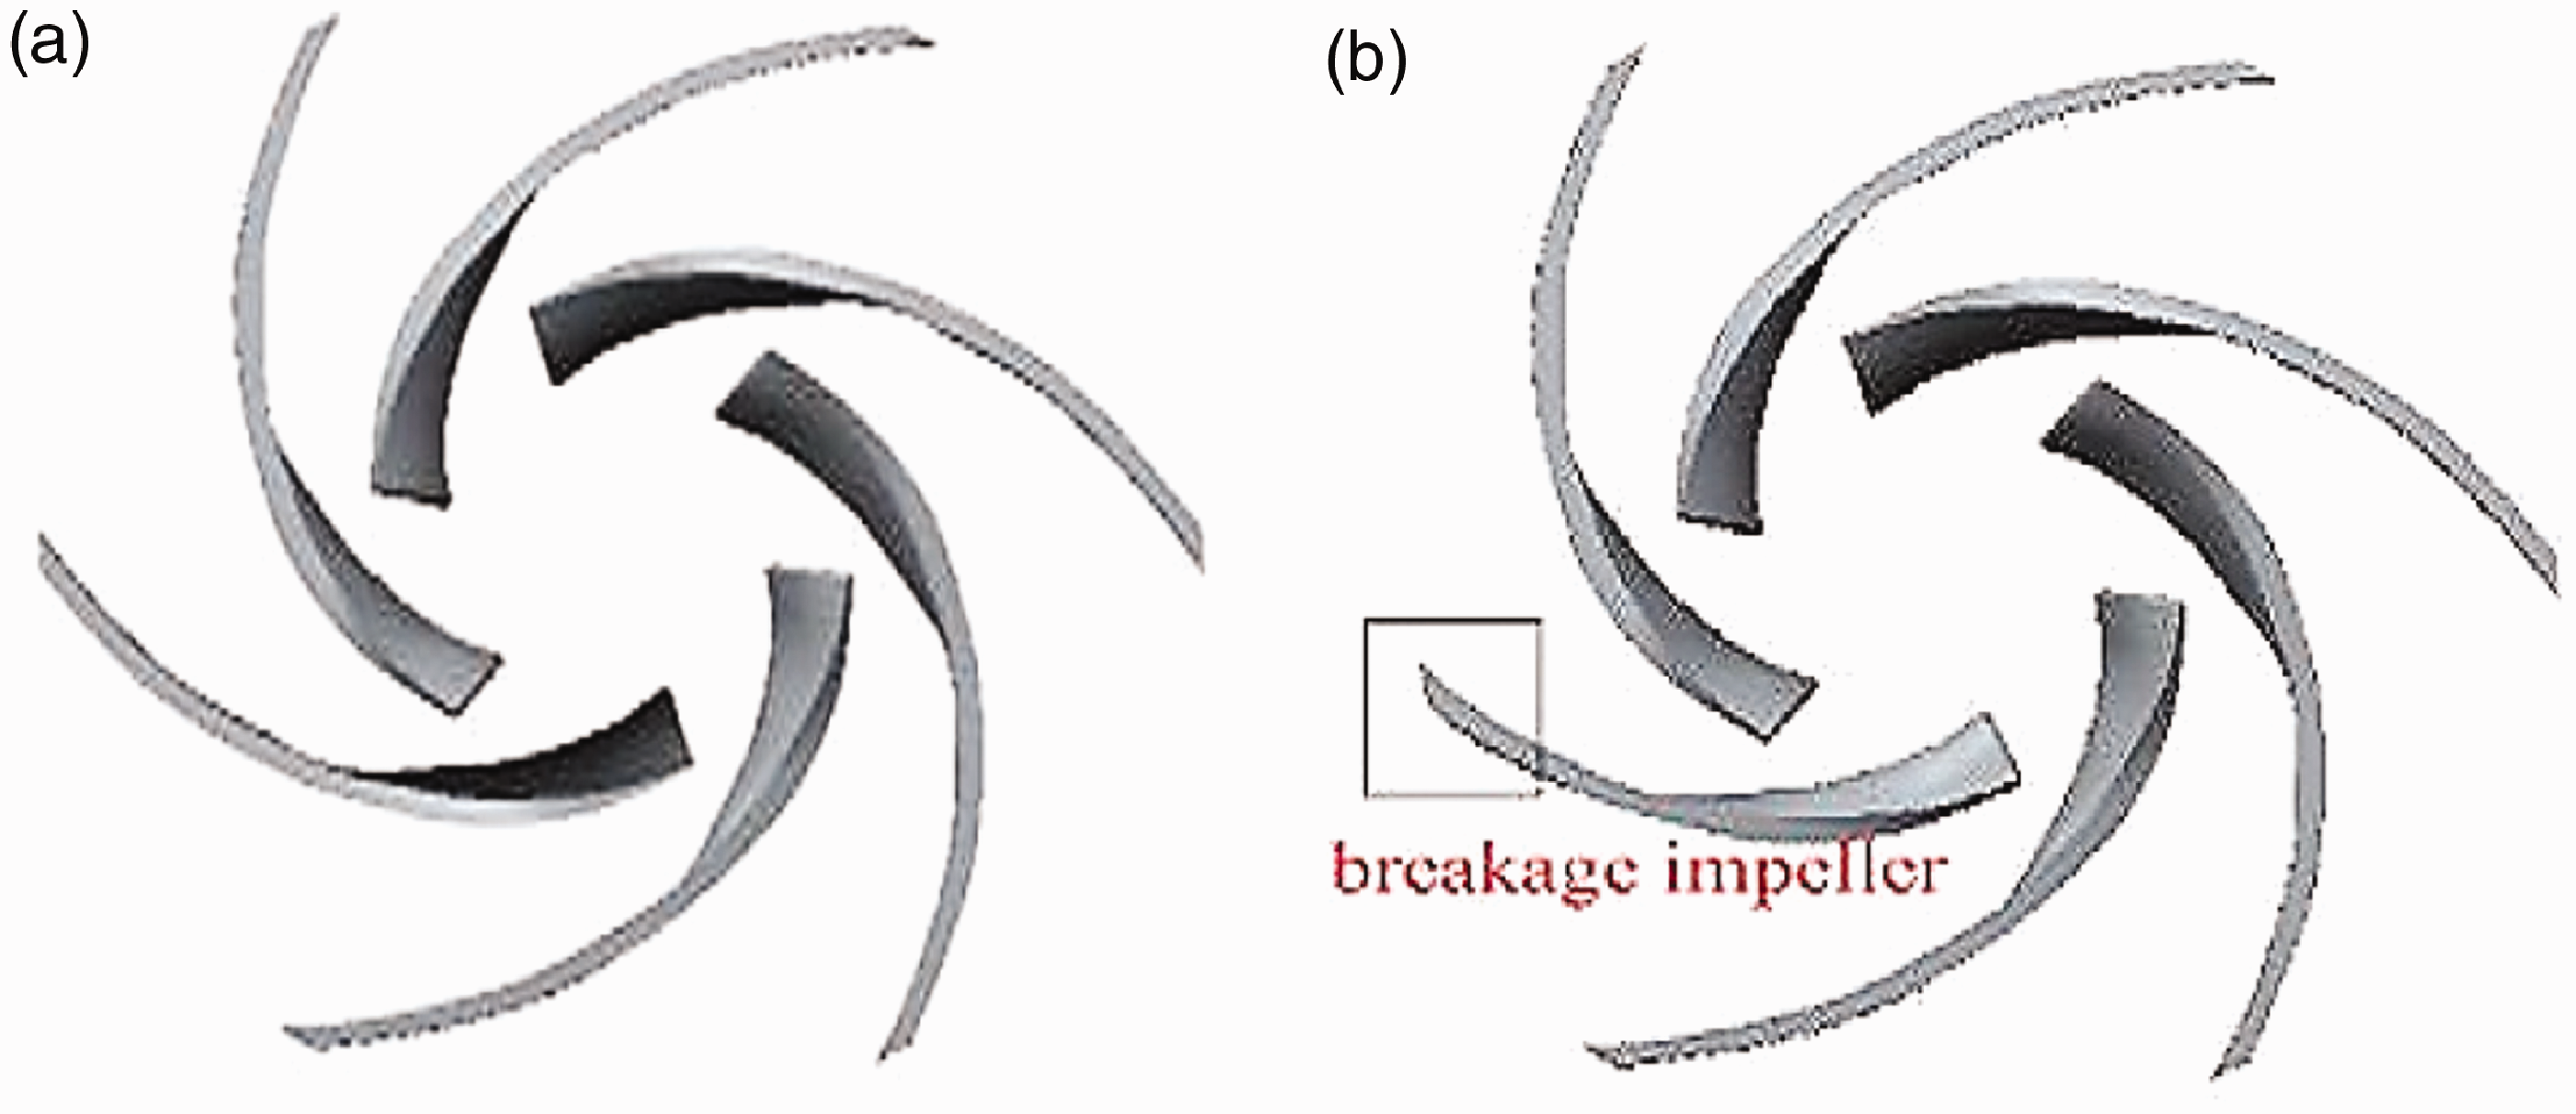
(a) Normal and (b) broken impellers.
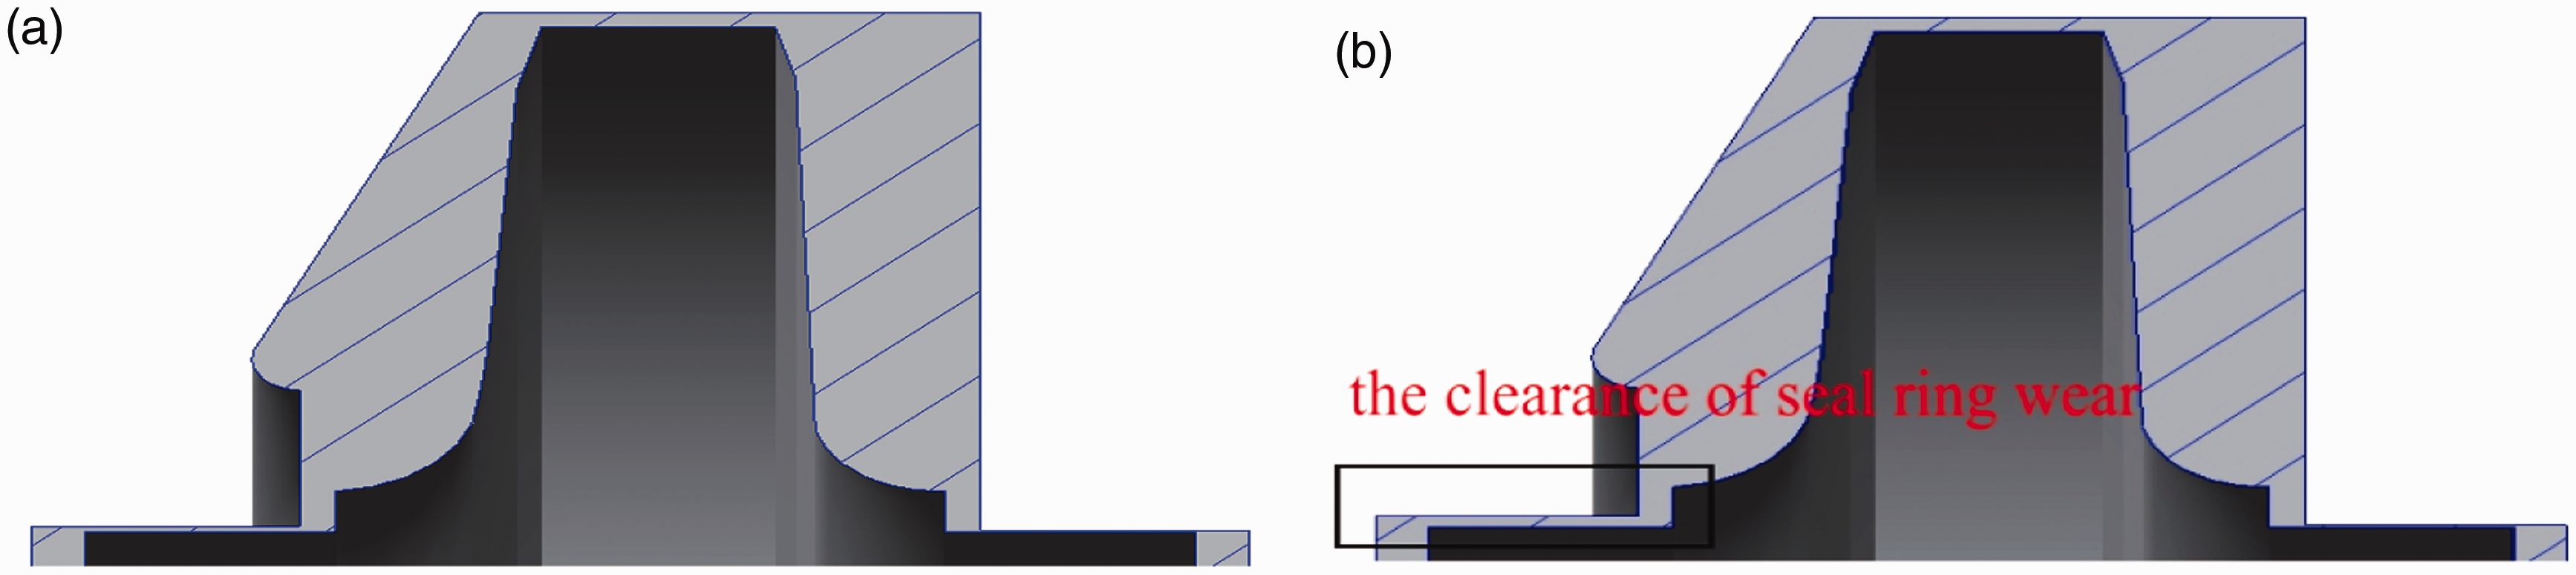
(a) Normal seal ring and (b) worn seal ring clearance.
Measurements
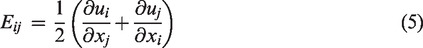
The test rig consisting of a model pump, an inlet pipe, an outlet pipe, a water pool, four vibration transducers, and a computer is shown in Figure 3. The torque was measured using a hall-effect sensor, and the flow rate was controlled by a flow valve installed downstream of the outlet pipe. The flow rate was measured by a turbine flowmeter, and the mean static pressure was obtained using two piezoresistive pressure sensors installed at the pump inlet and outlet. The measuring range of the sensor was from −100 to 100 kPa. A PXI-6251 data acquisition module was employed to monitor and transform the electric signals into digital signals. The data were analyzed using LabVIEW. Finally, four vibration transducers were placed at different locations, as summarized in Table 1 and shown in Figure 2. The pressure pulsations at the pump outlet and tongue were measured using a pressure transmitter.
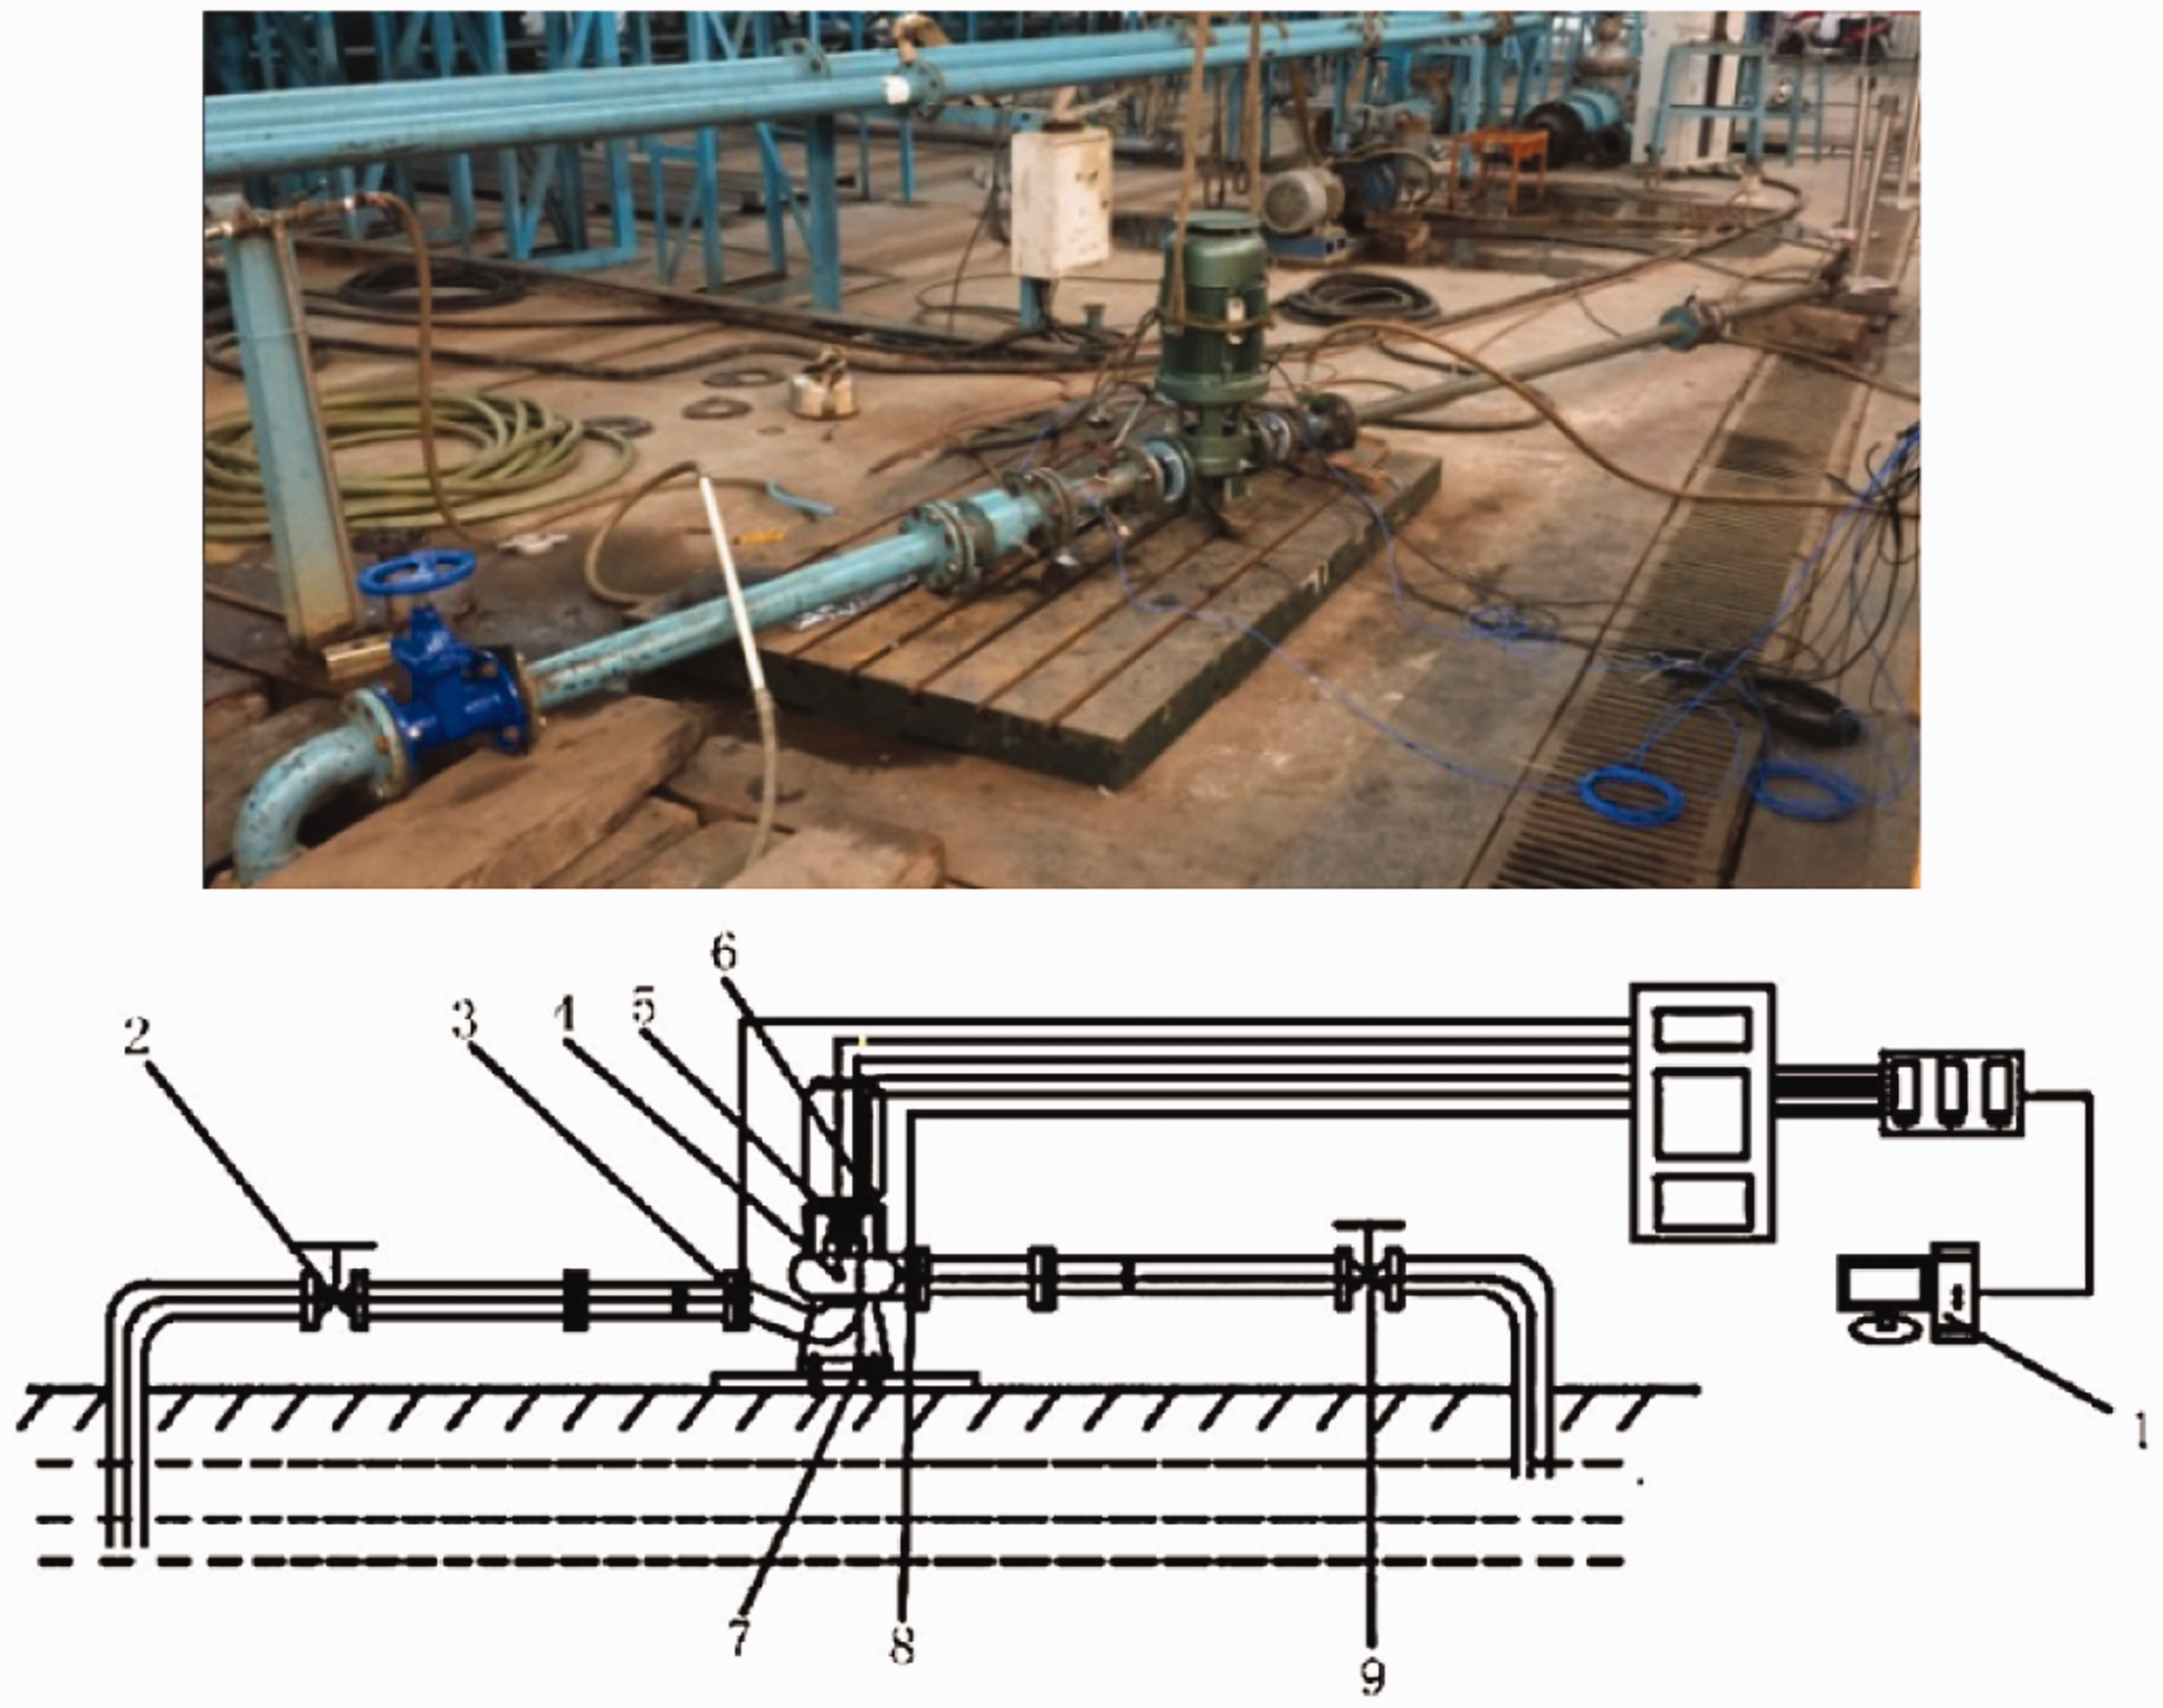
Test rig. 1—computer, 2—inlet valve, 3, 4, 5, 6, 7, 8—vibration inductors, 9—outlet valve.
Location of monitoring points.

The test rig satisfied the requirements of GB/T3216-2016 (rotodynamic pumps–hydraulic performance acceptance tests, grades 1 and 2). The measurement uncertainties of the hall-effect sensor, piezoresistive pressure sensor, and turbine flowmeter were ± 1.5%, ± 0.5%, and ± 0.5%, respectively.
Numerical calculation method
The numerical model can provide detailed unsteady flow information, which is difficult to obtain through tests.
Governing equations
The full flow field of the pump, including the volute, impeller, inlet pipe, seal ring clearance, and outlet pipe, was created using Creo2.0. To reduce the influence of boundary conditions, the lengths of the outlet and inlet pipes were extended by four times the pipe diameter. The Reynolds-averaged Navier–Stokes equations were solved using the renormalization group k–ε turbulence model, as follows14,15

Numerical settings
It was clearly specified that the total pressure at the inlet boundary was to be set to 1 atm, and the outlet boundary was to be an elongated section with a mass flow boundary.
A multi-coordinate system was used in the numerical calculation. There was impeller water in the rotating region and static region.
The interface between the dynamic and static components was set to a frozen rotor interface and transient interface in the steady and unsteady calculations, respectively. The grid connection was in the generalized grid interface mode, and the wall surface was set to be non-slip with 50 µm roughness.
As for the broken blade malfunction condition, the fluid remained in the rotating impeller, and its boundary condition was the same as that in the NP impeller.
In the steady calculation, a high-precision first-order upwind solution in which the convergence accuracy was set to 10−4 was adopted. In the unsteady calculation, the time step was set to Δt = 0.000113 s; the calculation of the primary flow field of the impeller was set at every 2° of rotation. A total of six revolutions were simulated, and the data of the last revolution were used for the analysis (Figure 4).
Monitoring points.
Computational grid
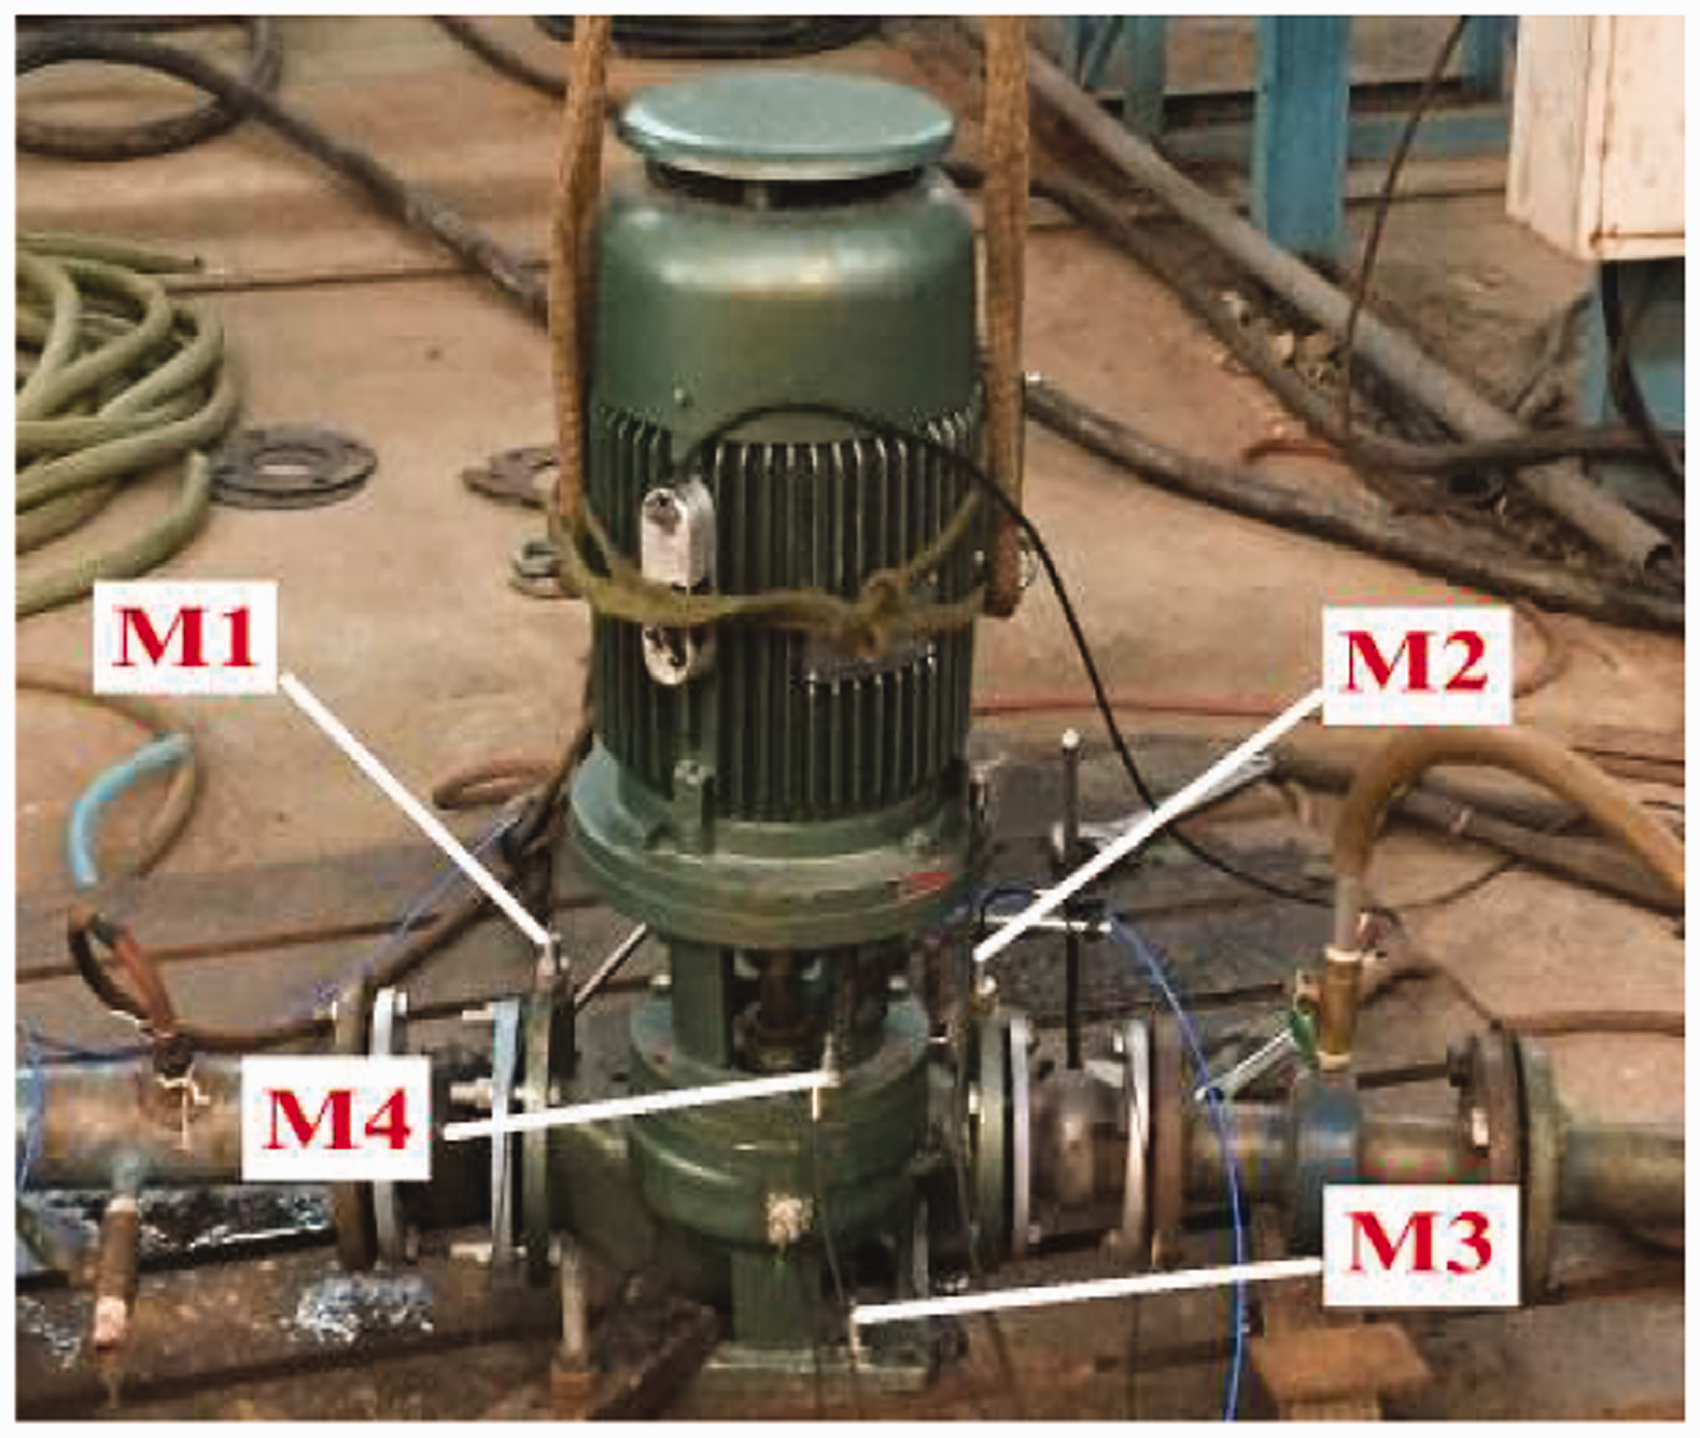
The grid generation was performed using the ANSYS-ICEM software. For a better accuracy and less calculation time, the hexahedral block mesh technique was used. Figure 5 shows the grid of the entire computational domain.
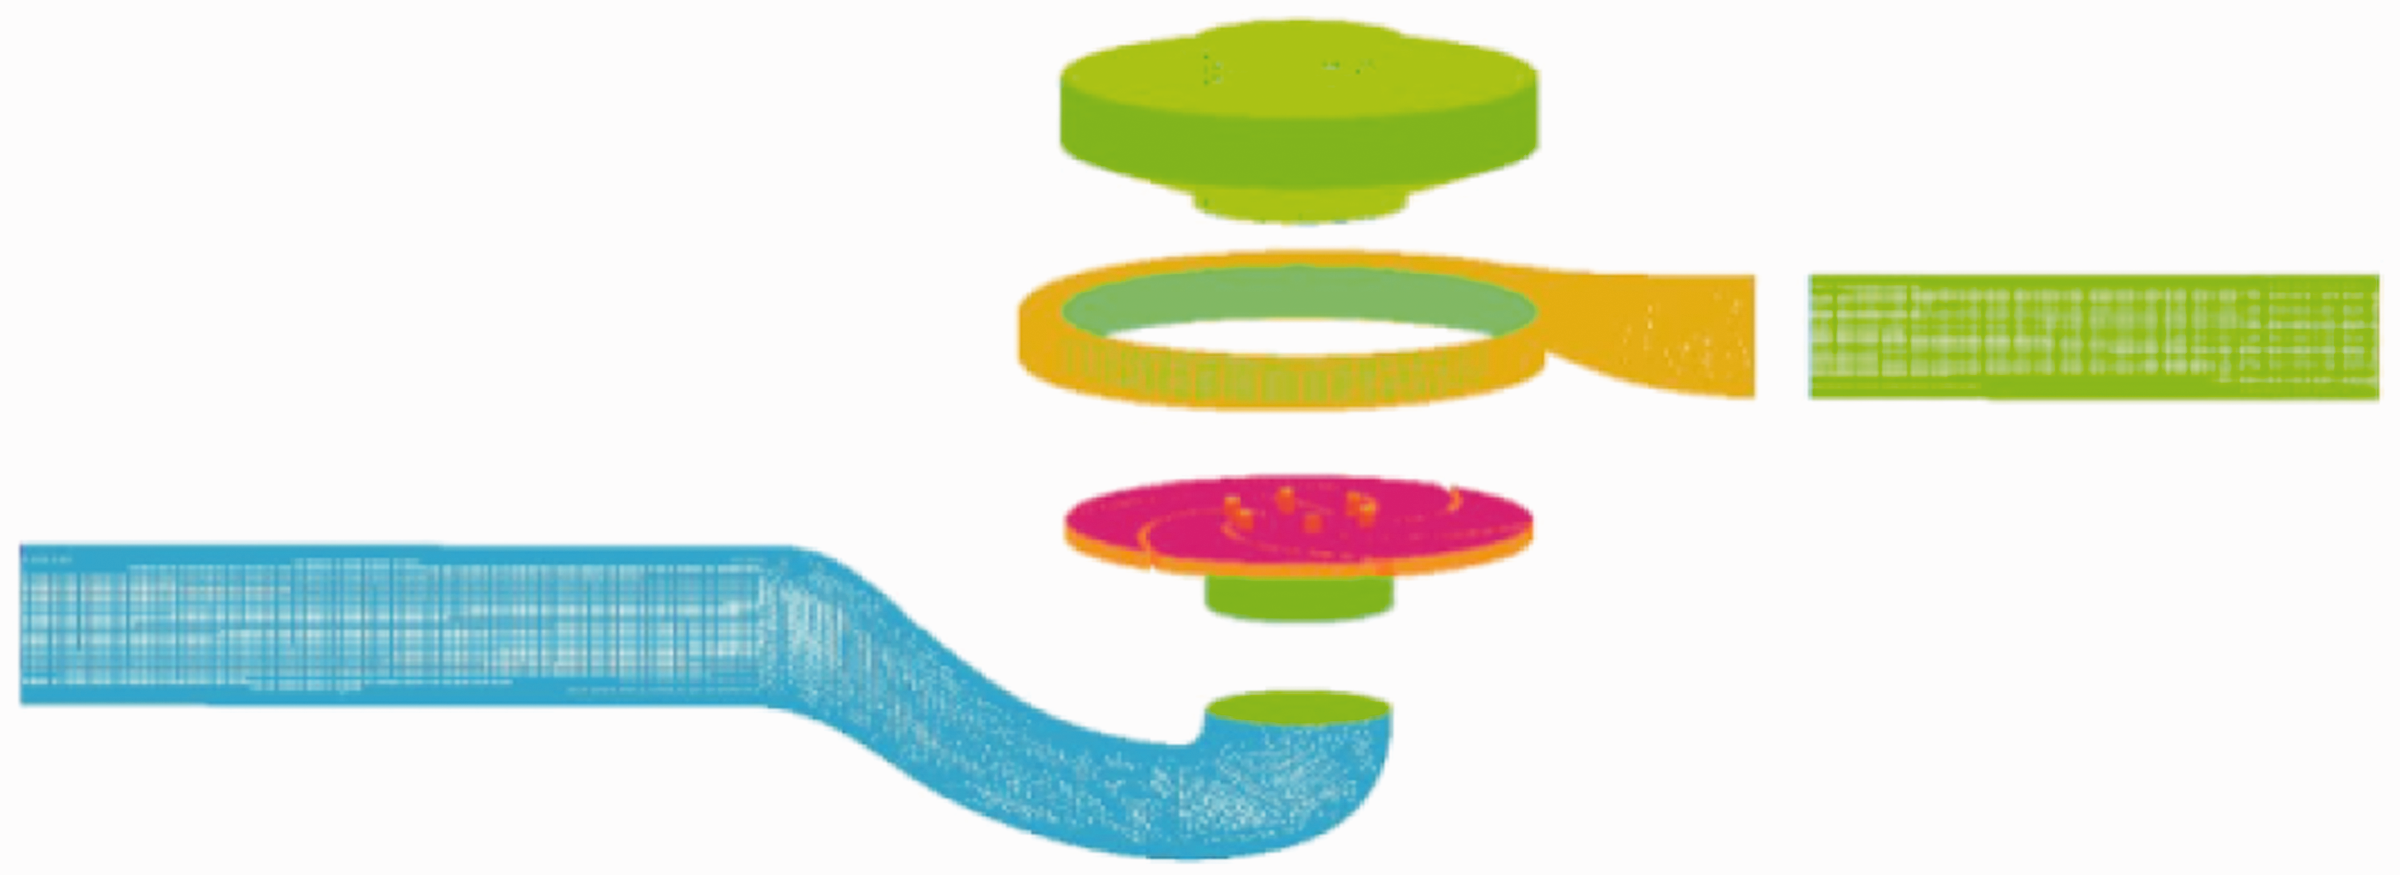
Grid of entire computational domain.
To avoid the influence of grid quantity on the calculation results, five sets of grids were generated to check the grid independence, and the head corresponding to the design flow rate was used as the criterion; the results are summarized in Table 2. It can be observed that with 2.9 × 10⁶ grids, the head remains practically constant. Considering the computational complexity and calculation accuracy, scheme 3 was finally selected.
Grid dependency check.
To improve the convergence, the results of the steady simulation served as the initial conditions for the unsteady flow calculations.
Experimental verification
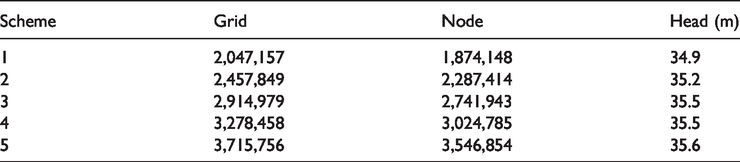
The comparison between the results of the model pump energy performance test and numerical simulation is shown in Figure 6.
Performance comparison.
As shown in Figure 6, the numerical simulation results are in good agreement with the test results. Under the design flow rate, the prediction deviations of the head and efficiency are 1.90 and 4.34%, respectively. In theory, the head and efficiency obtained by the numerical simulation must be higher than the experimental values. This may be because the friction between the bearing and seal ring is not included in the numerical simulation. In general, under all conditions, the errors between the calculation and test results are all within 5%. Therefore, the numerical simulation method is reliable for the research.
Results
Energy performance
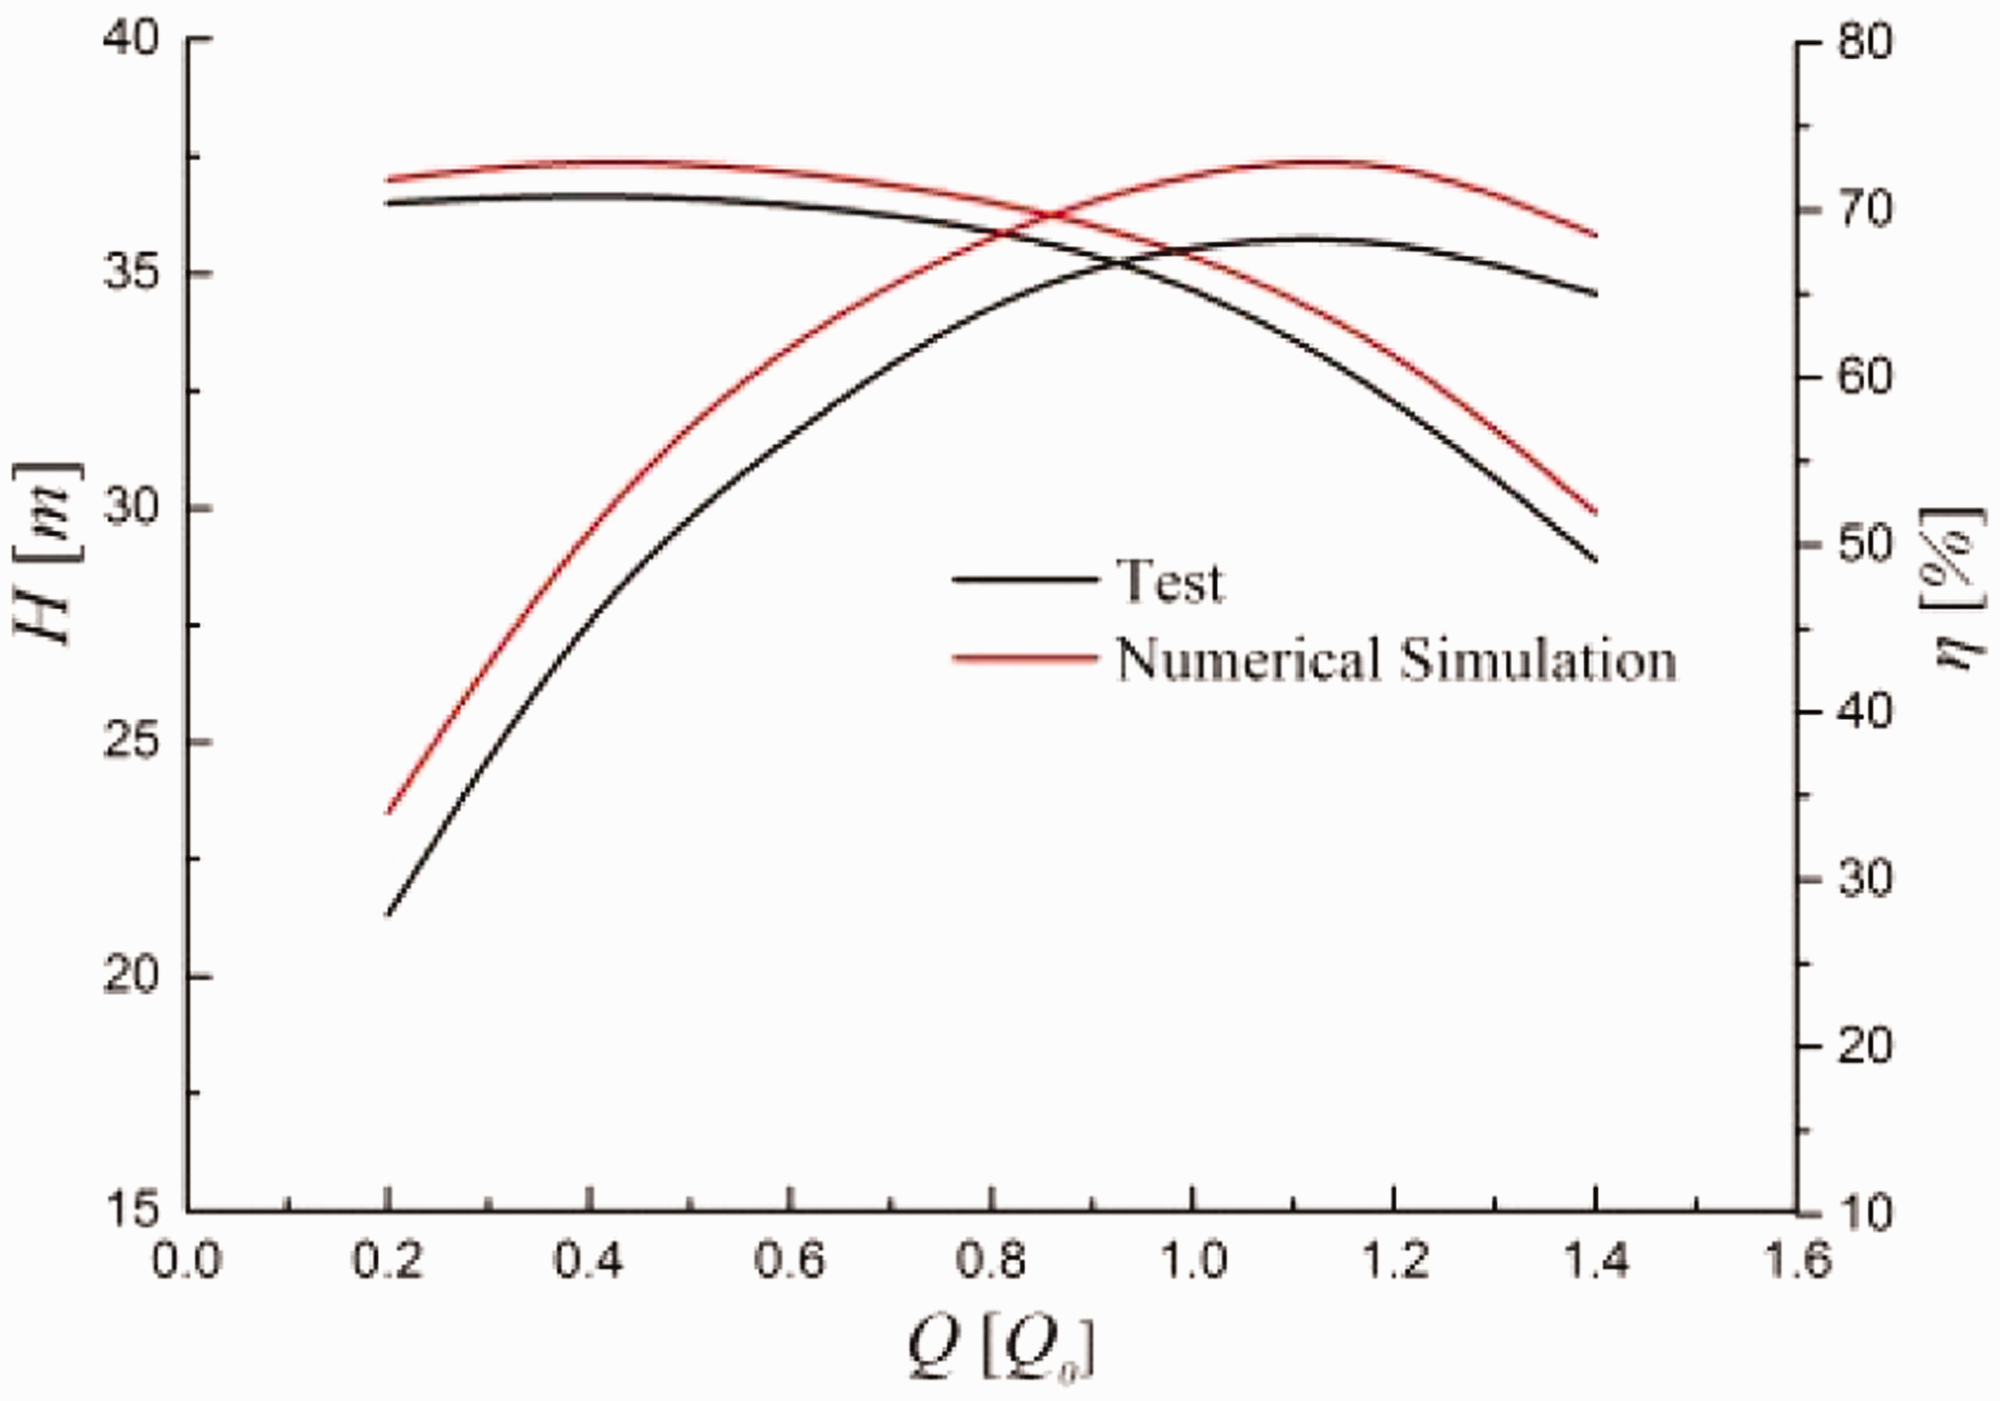
Figure 7 shows a comparison of the energy performance between the MP and NP. It can be observed that the head and efficiency of the MP are considerably lower than those of the NP. Under the design flow rate, the head and efficiency decrease by 10.56 and 10.09%, respectively. With an increase in the flow rate, the reductions in the head and efficiency become more significant. This is mainly because the broken blade cannot provide sufficient energy to the liquid as the impeller rotates, and liquid escapes from the volute through the worn seal ring clearance.
Energy performance comparison.
Vibration analysis
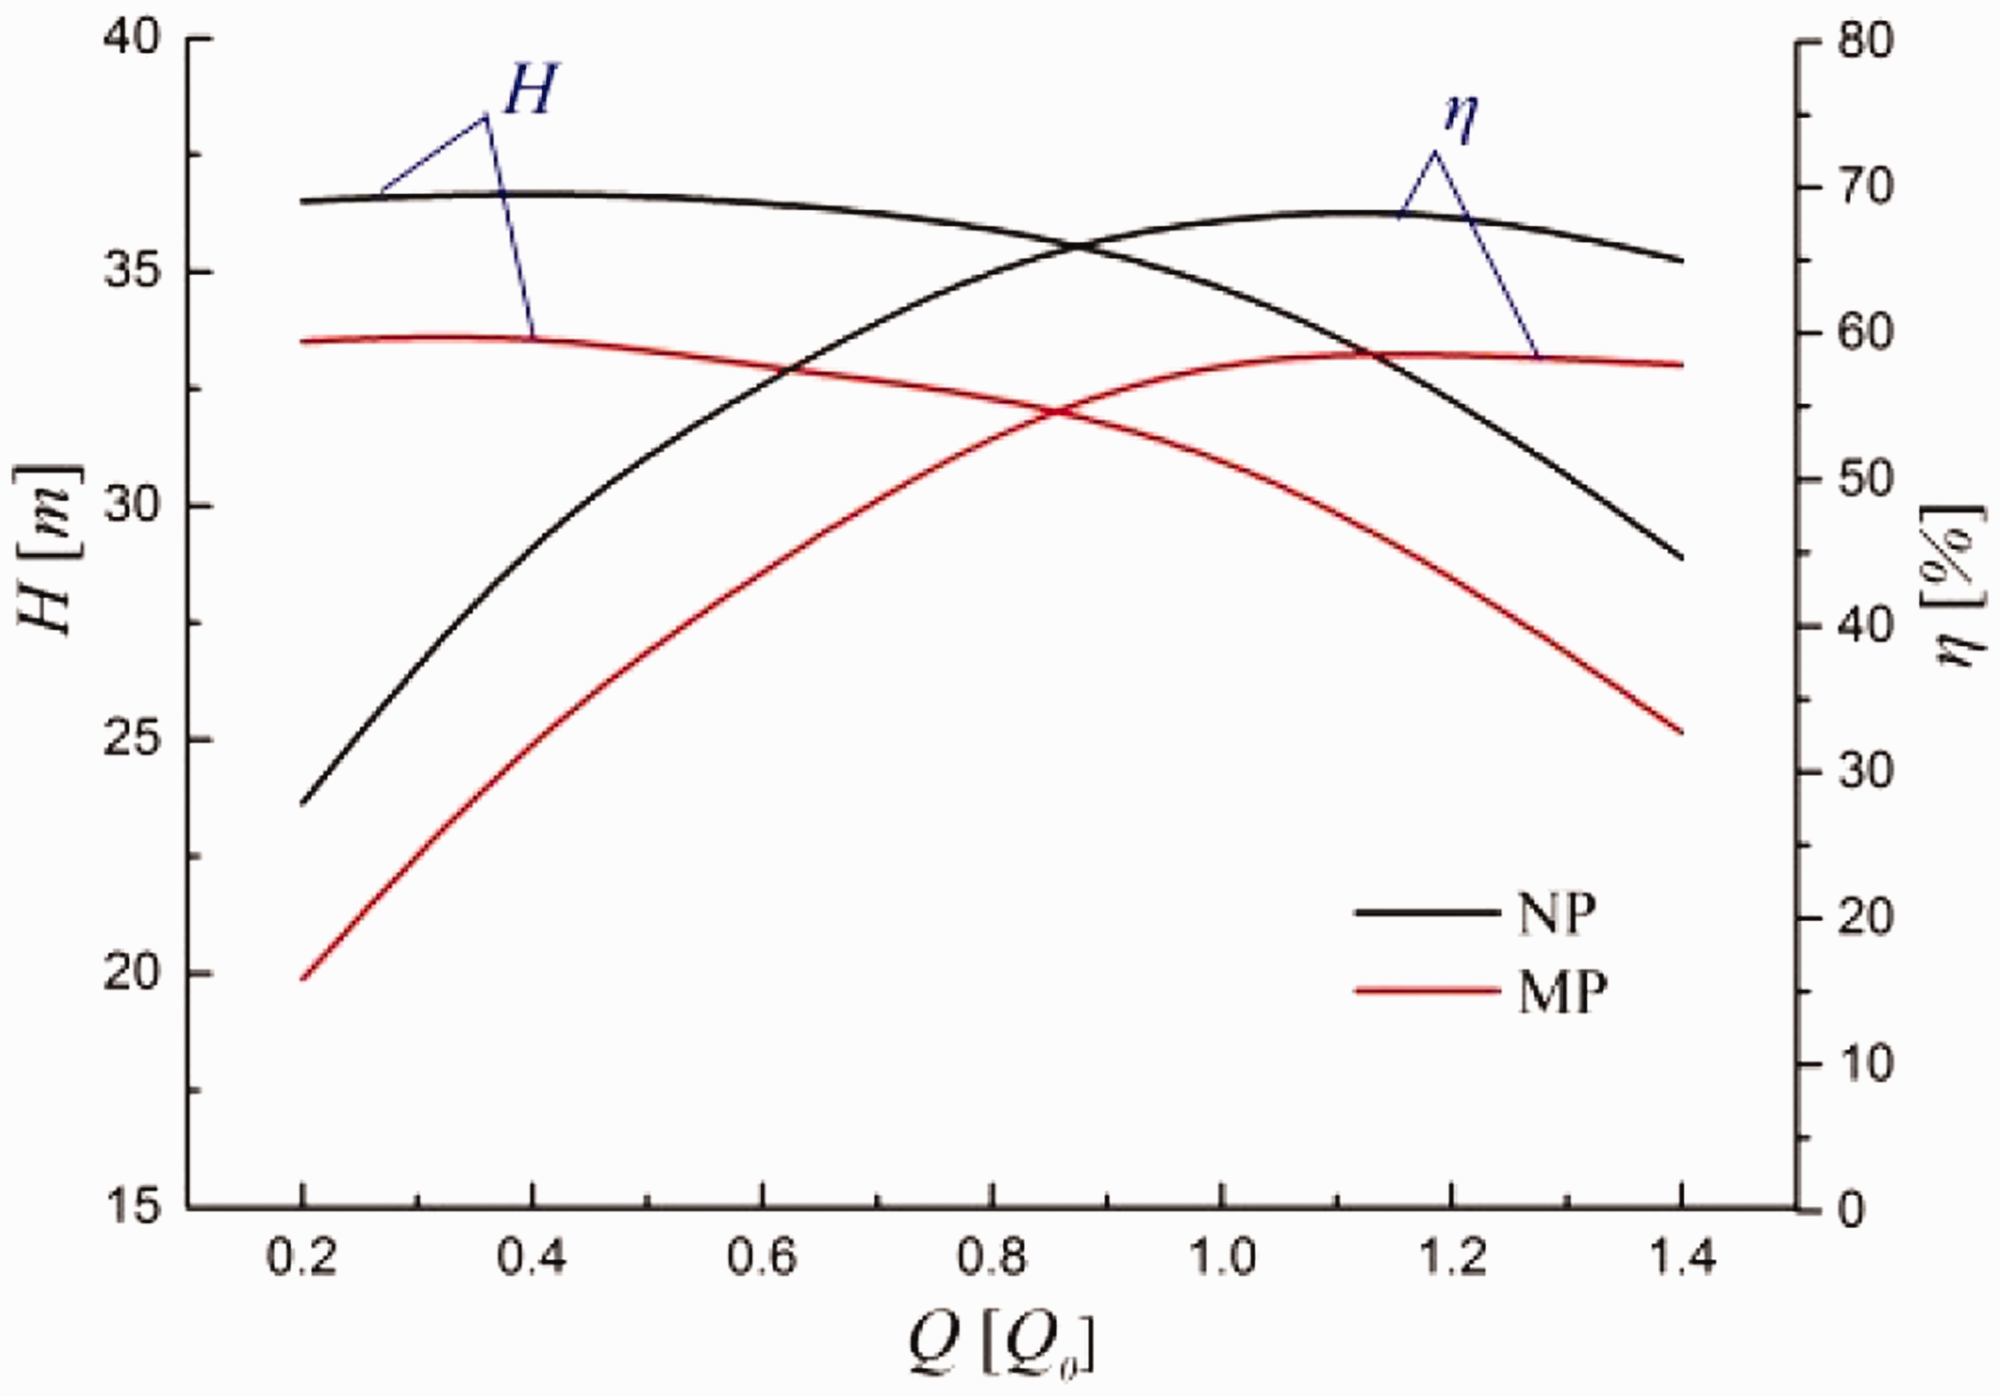
The analysis of the vibration characteristics of the NP and MP is based on the vibration amplitude shown in Figure 8. It can be observed that when the flow rate increases from 0.8Q0 to 1.4Q0, the change in the vibration amplitude of the MP is low but considerably higher than that in the vibration amplitude of the NP. With the flow rate increase, the vibration amplitudes decrease. This may explain why the unsteady flow in the pump was aggravated after the occurrence of a malfunction under a low flow rate, which can intensify the pump vibration.
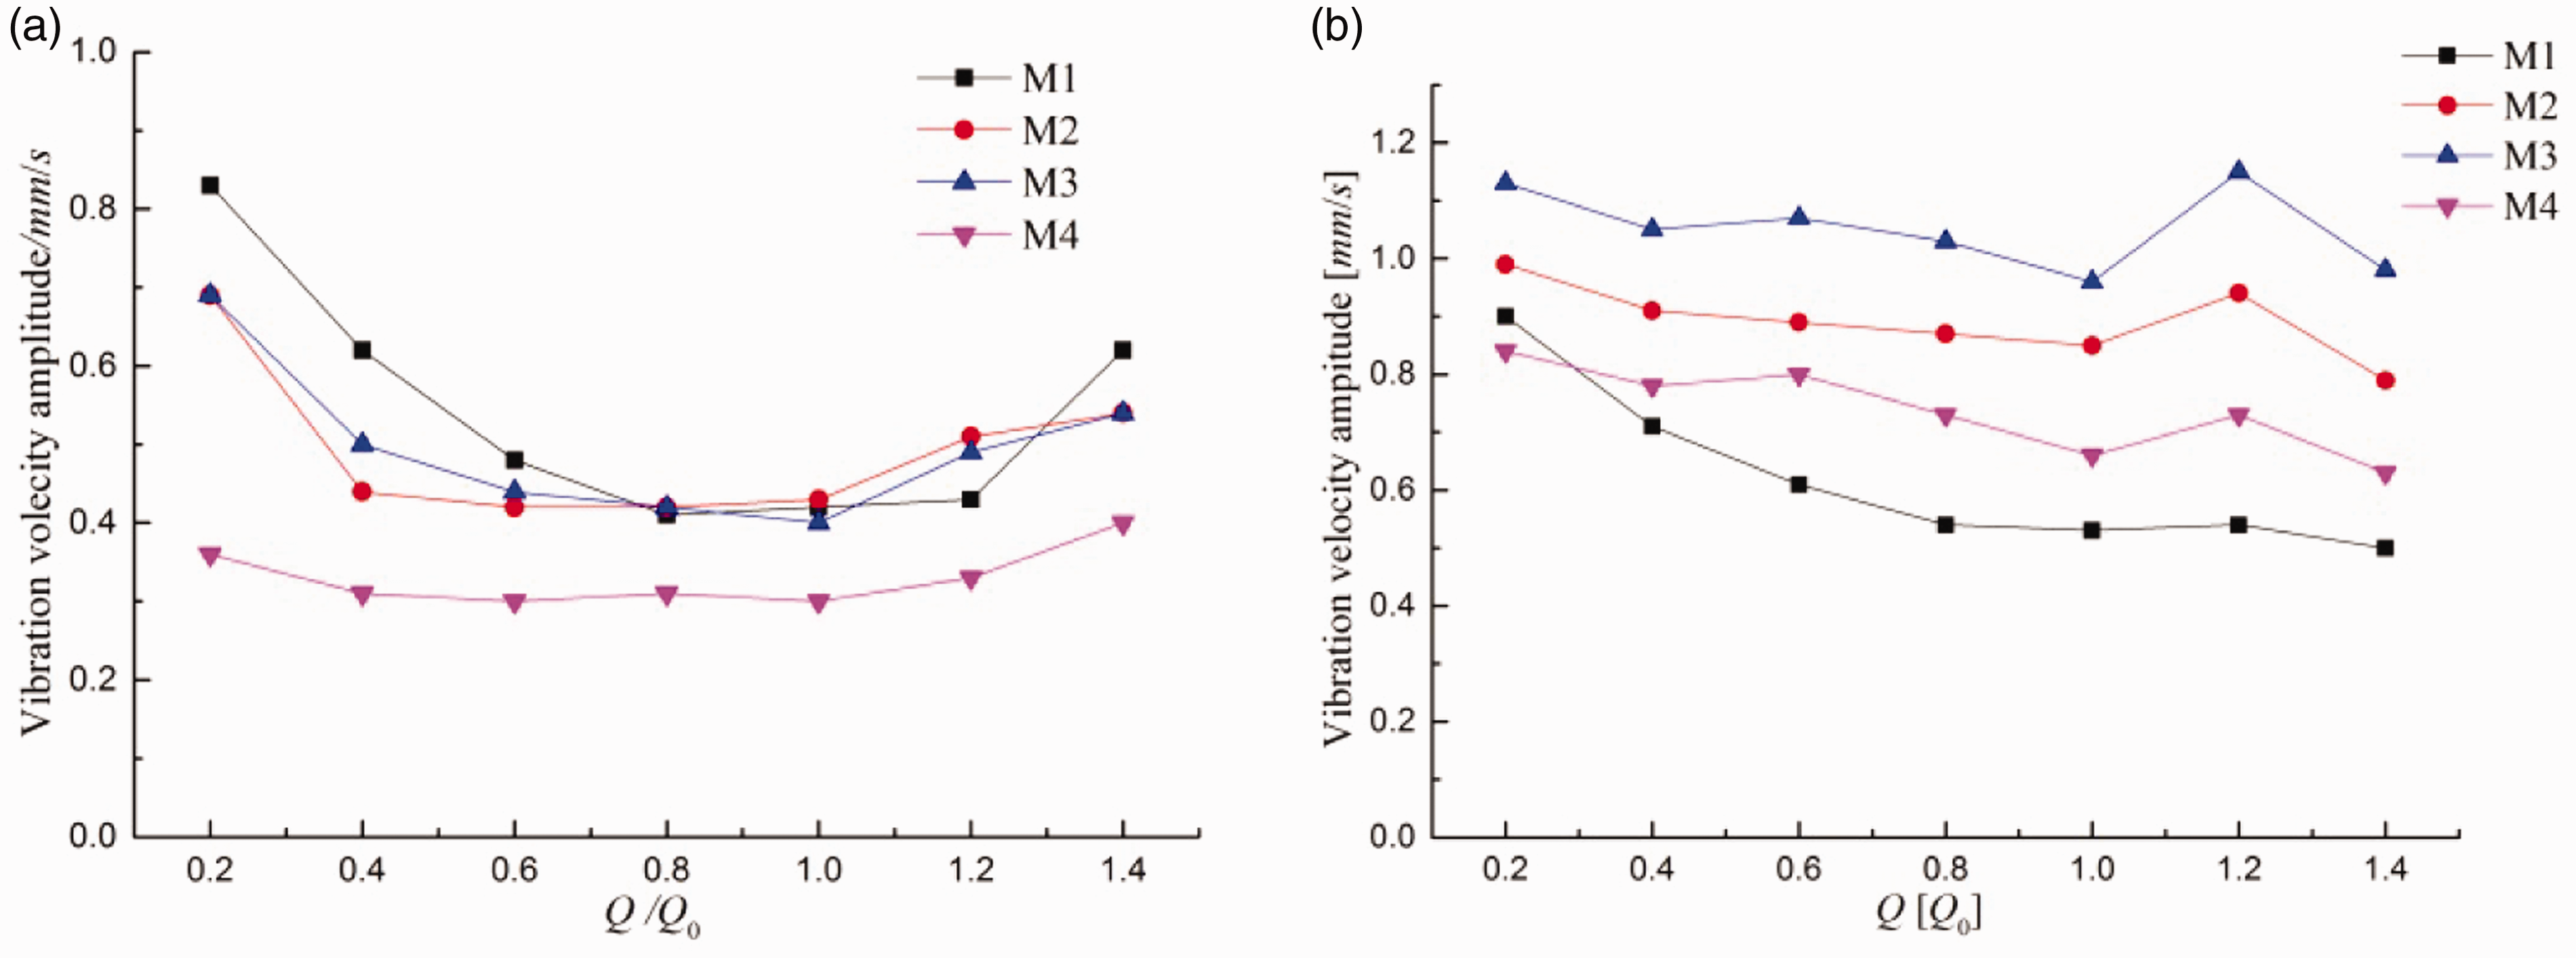
Vibration amplitude. (a) MP model and (b) NP model.
Further analysis of the vibration magnitude at each measuring point under the 1.0Q0 condition shows that the order of vibration magnitude in the NP is M1 > M3 > M2 > M4 and that in the MP is M1 > M2 > M4 > M3. At M4 (pump bracket), the vibration magnitude increases by approximately 63.3%.
The general vibration amplitude comparison between the NP and MP under 0.8Q0, 1.0Q0, and 1.2Q0 is shown in Figure 9. Under all flow rates, the general vibration amplitudes in the NP and MP at M4 are the lowest. The increase in the vibration level in the MP at M3 is approximately 6.89 dB, which is the most distinct under 0.8Q0. The increase in the vibration level under 1.0Q0 at M3 is slightly lesser than that under 0.8Q0, i.e. approximately 5.11 dB. Under 1.2Q0, the increase in the vibration level in the MP is the minimum value, i.e. approximately 3.66 dB. Based on the foregoing analysis, it can be concluded that the multi-malfunctions most significantly affect the vibration level at the foot of the pump (M3).
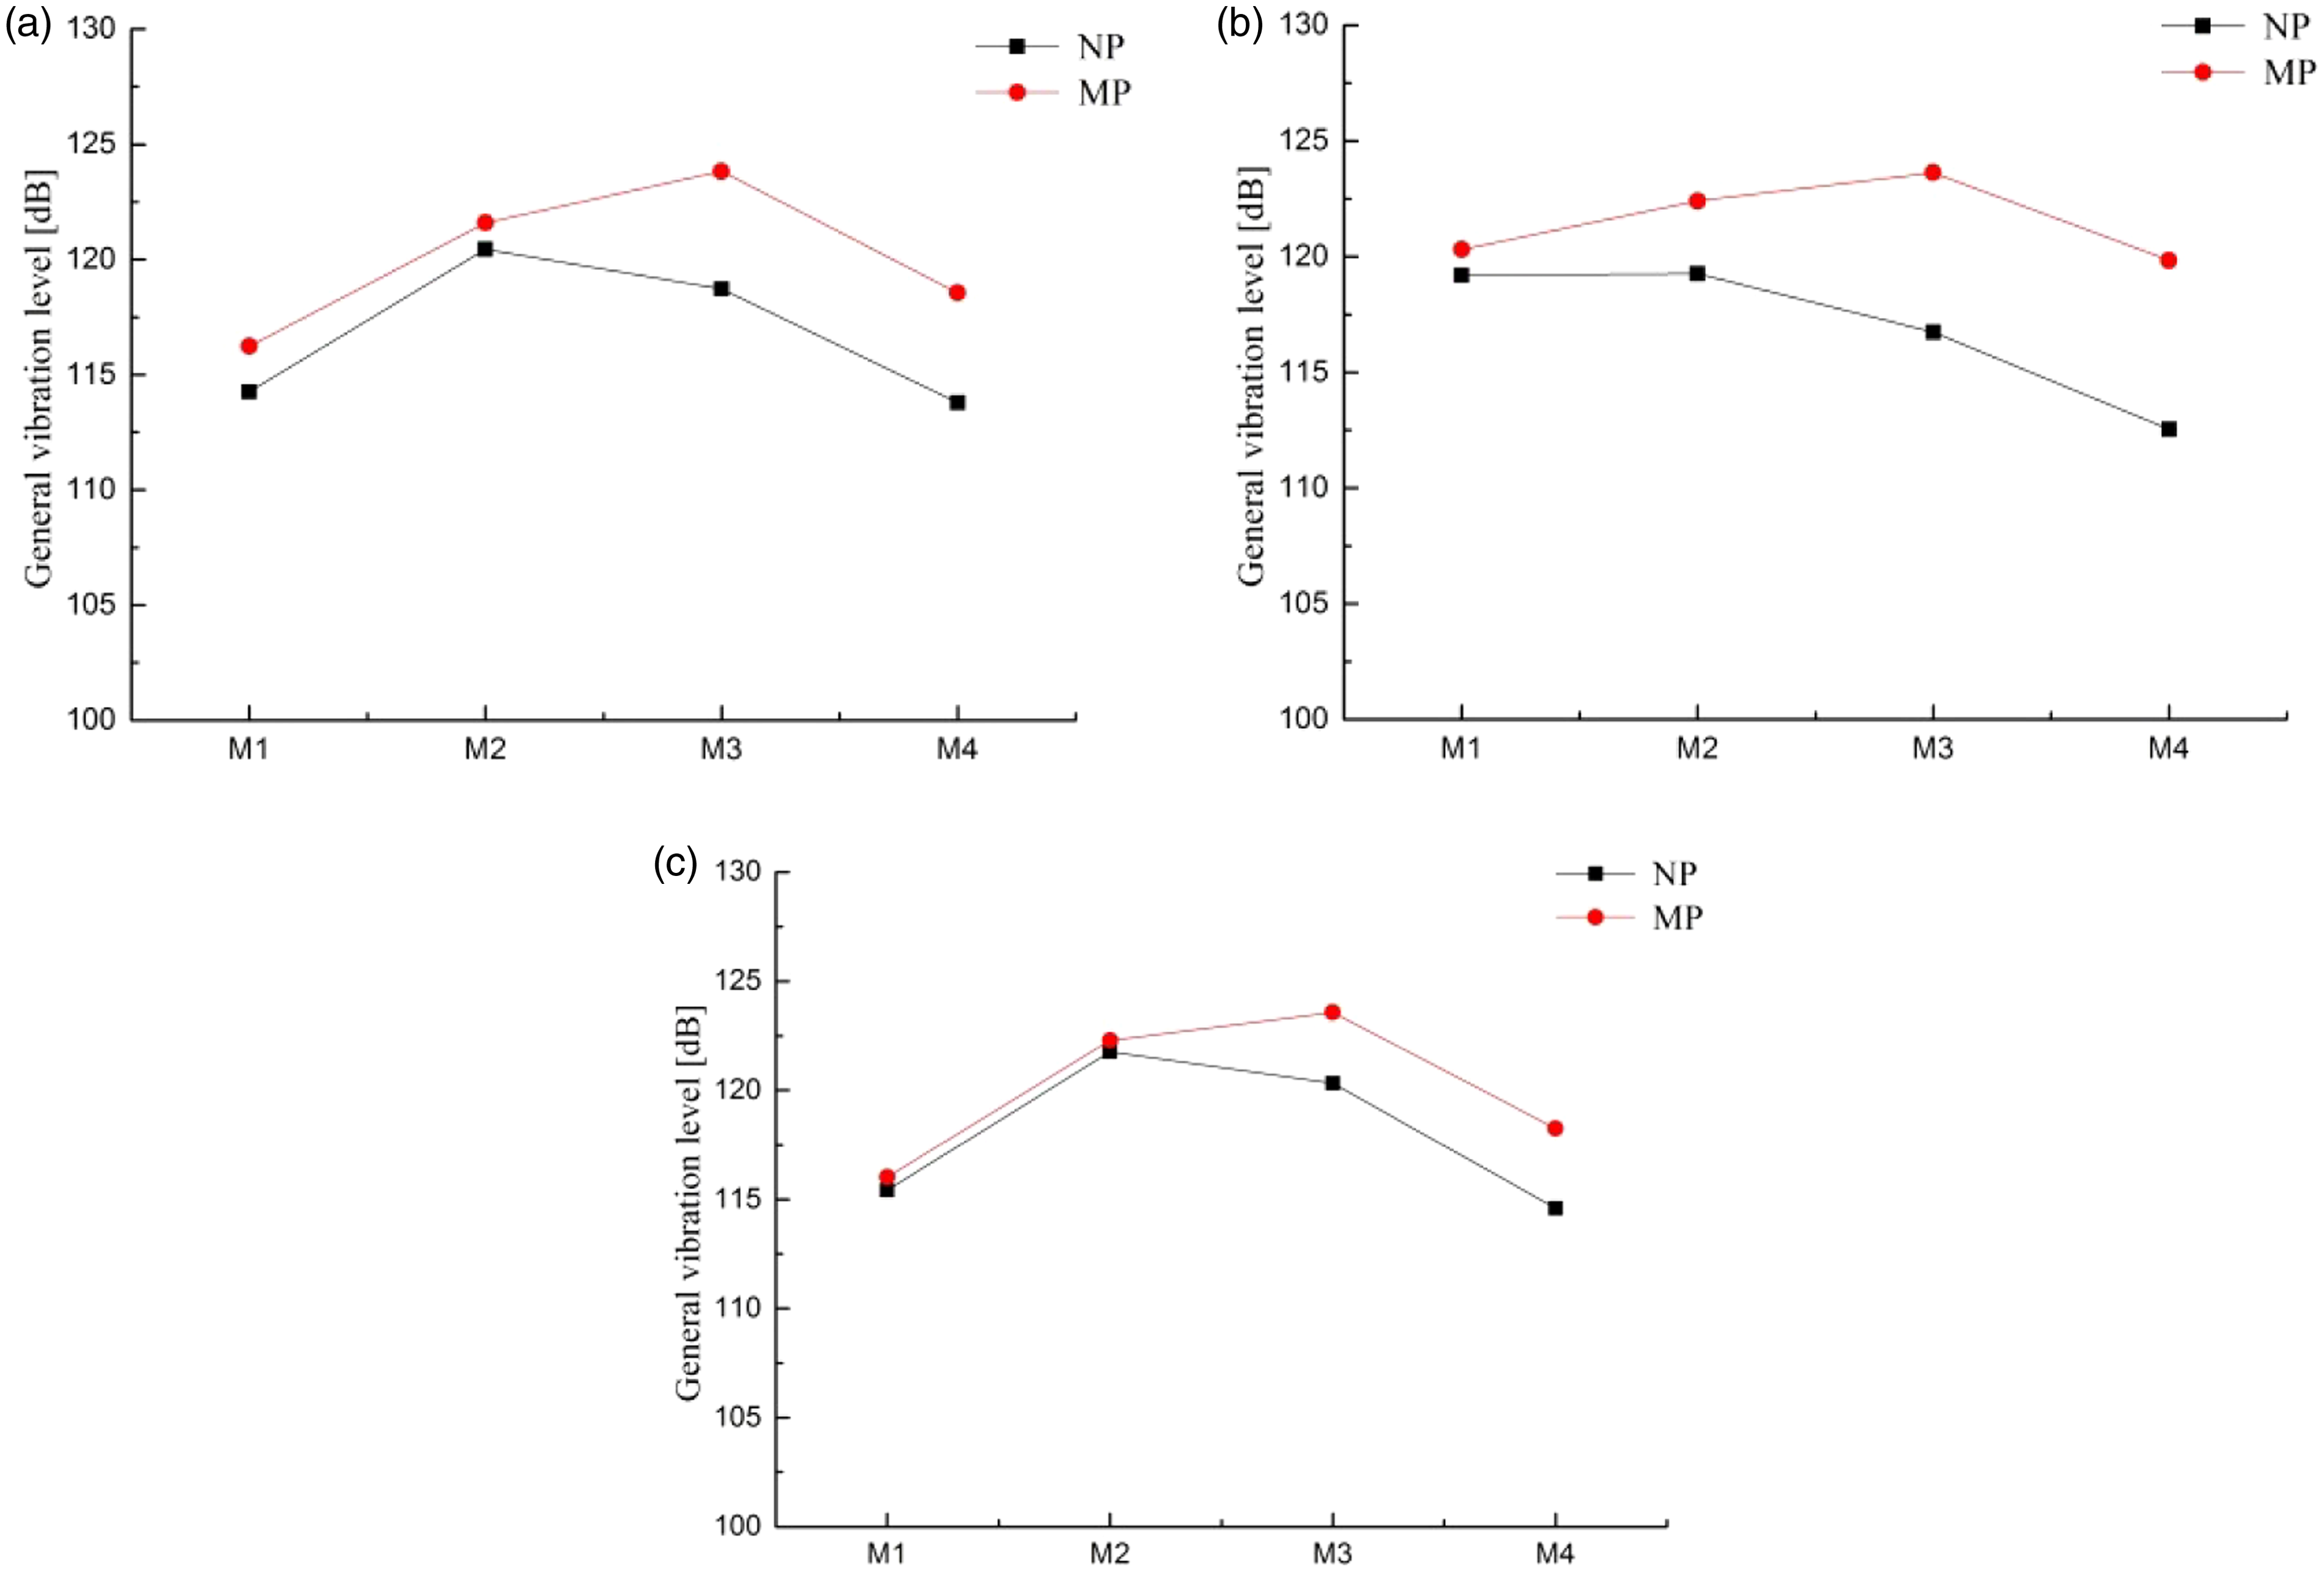
General vibration level comparison. (a) 0.8Q0, (b) 1.0Q0, and (c) 1.2Q0. MP: pump with multi-malfunctions; NP: normal pump.
In summary, multi-malfunctions considerably affect the vibrations at the pump foot but only has a minimal effect on the pump inlet flange. Therefore, if the vibrations at the foot of the pump significantly increase, it is probable that the pump has multi-malfunctions.
The vibration spectrum in the frequency domain is shown in Figure 10. It can be observed that all vibration amplitudes at the axial passing frequency (APF) distinctly increase under each flow rate when the pump has multi-malfunctions. Under 1.0Q0, the APF amplitudes in the MP compared with those in the NP at M1, M2, M3, and M4 increase by 52.1, 207.5, 163.2, and 161.5%, respectively. The APF vibration amplitude increment reaches its maximum at M2.
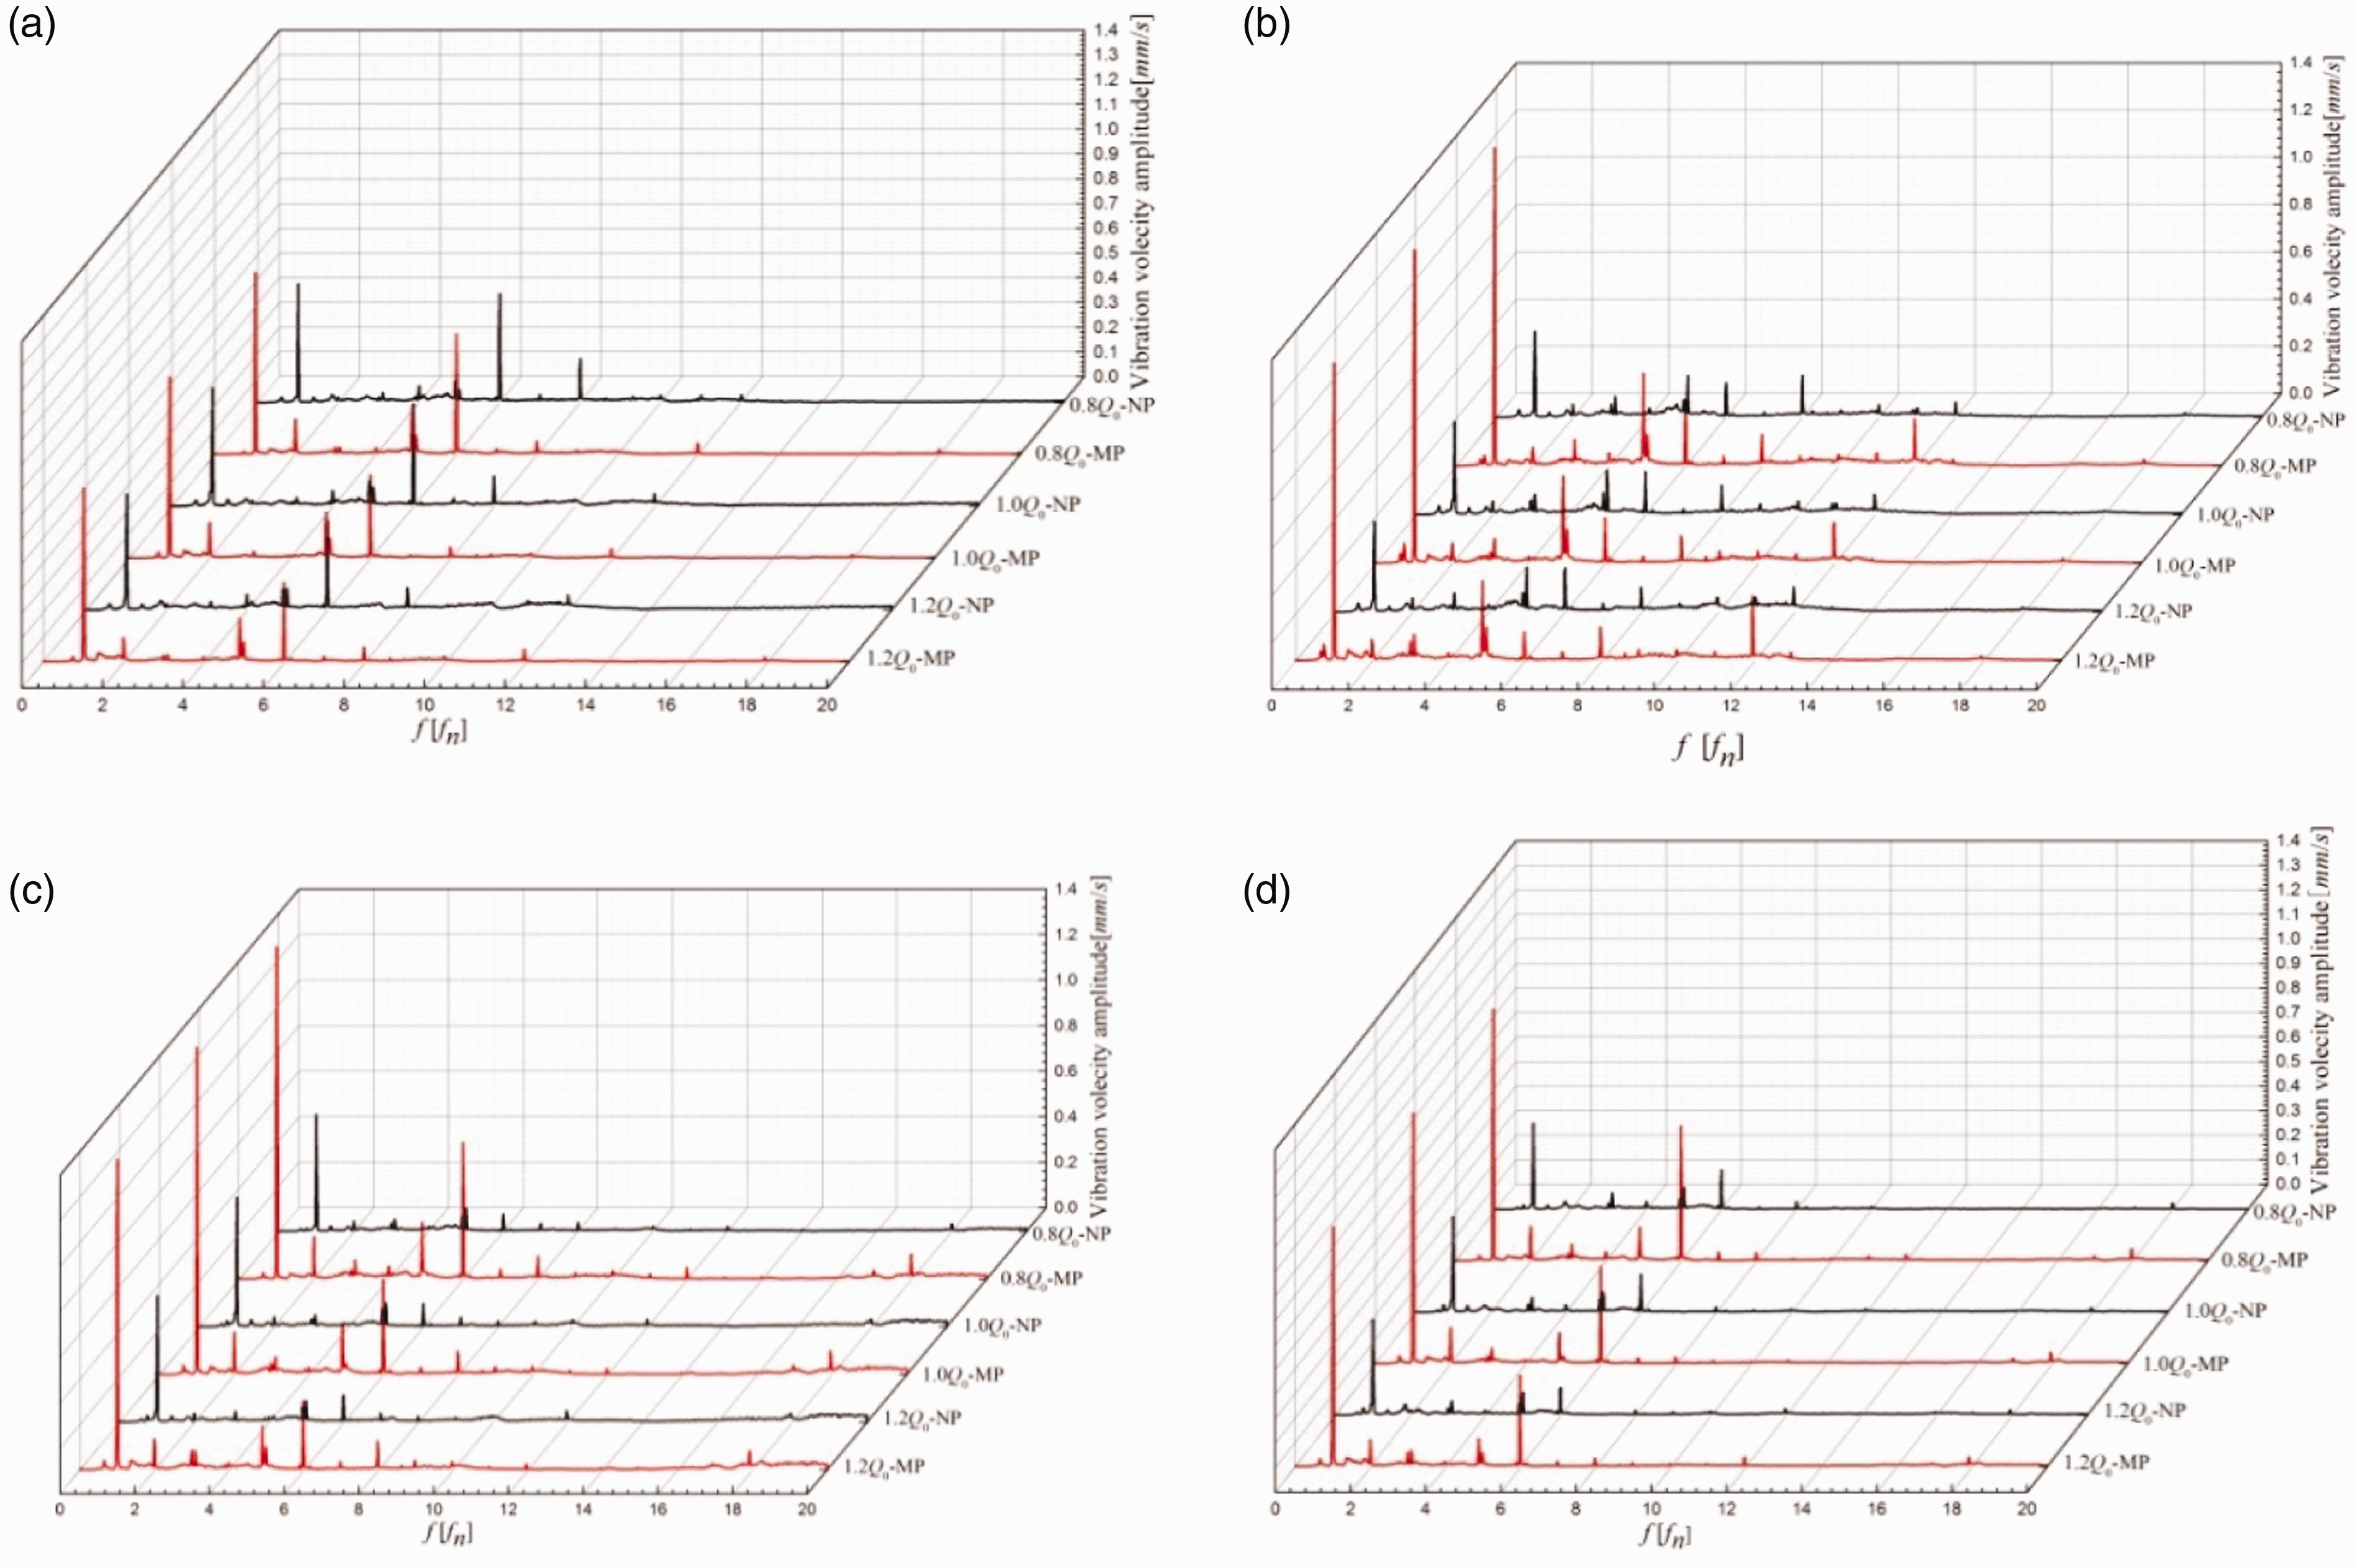
Vibration in frequency domain. (a) M1, (b) M2, (c) M3, and (d) M4.
The frequency spectrum of the MP compared with that of the NP has the characteristic frequencies of 2, 3, and 5APF; among these, 2 and 5APF are more distinct. Therefore, it can be used to determine the main frequency in the multi-fault diagnosis of the broken blade and worn seal ring. Under 1.0Q0, the 3APF vibration amplitudes at M1, M2, M3, and M4 are 0.01, 0.04, 0.04, and 0.03 mm/s, respectively; those at 5APF are 0.04, 0.07, 0.03, and 0.02 mm/s, respectively.
Based on the figure, as the frequency increases, the characteristic frequency at each measuring point decreases, and the APF amplitudes at M2 and M3 increase compared with those at M1 and M4. This shows that the model with multi-malfunctions has the greatest influence on the axial frequency of each measuring point, and its influence on other characteristic frequencies gradually decreases.
Therefore, when the new characteristic spectrum appears at 5, 3, and 2APF, it can be reasonably speculated that the cause of failure is the simultaneous occurrence of multi-malfunctions. Among the new characteristic frequencies, the 5APF must be caused by the broken blade because the number of blades should be six, whereas 3 and 2APF may be caused by the wear in the seal ring because of the vortex around the shaft.
Numerical calculation results
The radial forces in the impeller of the NP and MP are shown in Figure 11; the comparison of radial force between the two pumps is shown in Figure 11(a). The radial force in the NP impeller exhibits a distinct periodicity. In one cycle, there are six wave peaks and troughs according to the number of blades. In the MP, the radial force is disordered, and its peak-to-peak value is approximately 1.8 times that in the NP. The average radial force in one circle increases by approximately 28.95 N, which may indicate an unbalanced impeller rotation caused by multi-malfunctions in the pump. This can eventually lead to a large and unsteady radial force distribution in the impeller.
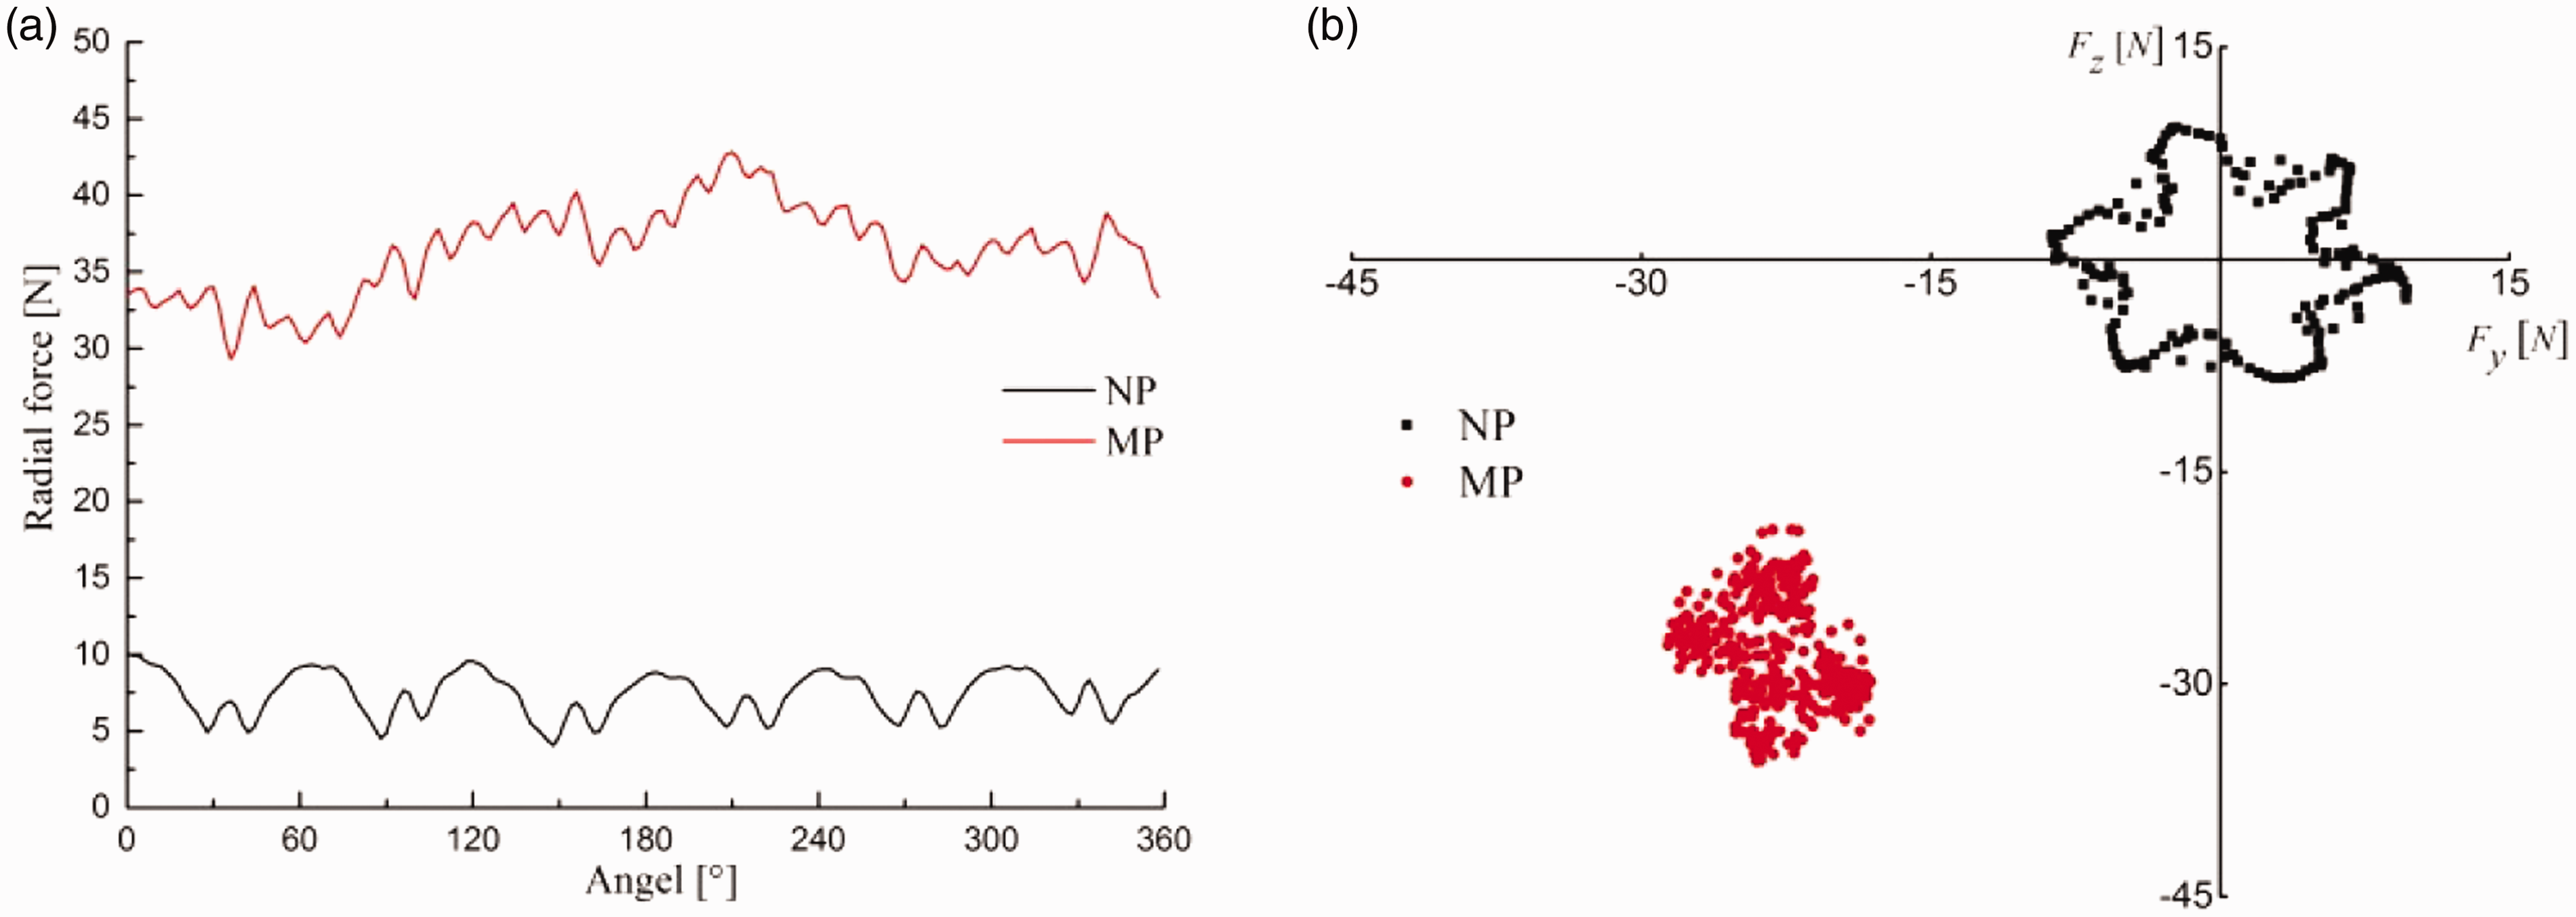
Impeller radial force in time and vector diagram. MP: pump with multi-malfunctions; NP: normal pump.
Figure 11(b) shows the radial force vector distributions in the NP and MP. For the NP, the vector of the radial force has a symmetric hexagonal distribution corresponding to six cycles in the time domain curve. In the MP, the radial force vector direction is approximately 45° with respect to −y and −z axes, pointing to the sixth section of the volute. This phenomenon may add to the wear in the impeller and seal ring and reduce the service life of the centrifugal pump.
In general, the MP has a greater and more concentrated radial force; it is also more prone to damage when multi-malfunctions occur.
Pressure pulsation analysis
To better study the distribution of pressure pulsations, the pressure pulsation monitoring points are shown in Figure 12. In the figure, P1 represents the pressure monitoring point at the tongue of the volute, and P2 is the pressure monitoring point located at the volute outlet.
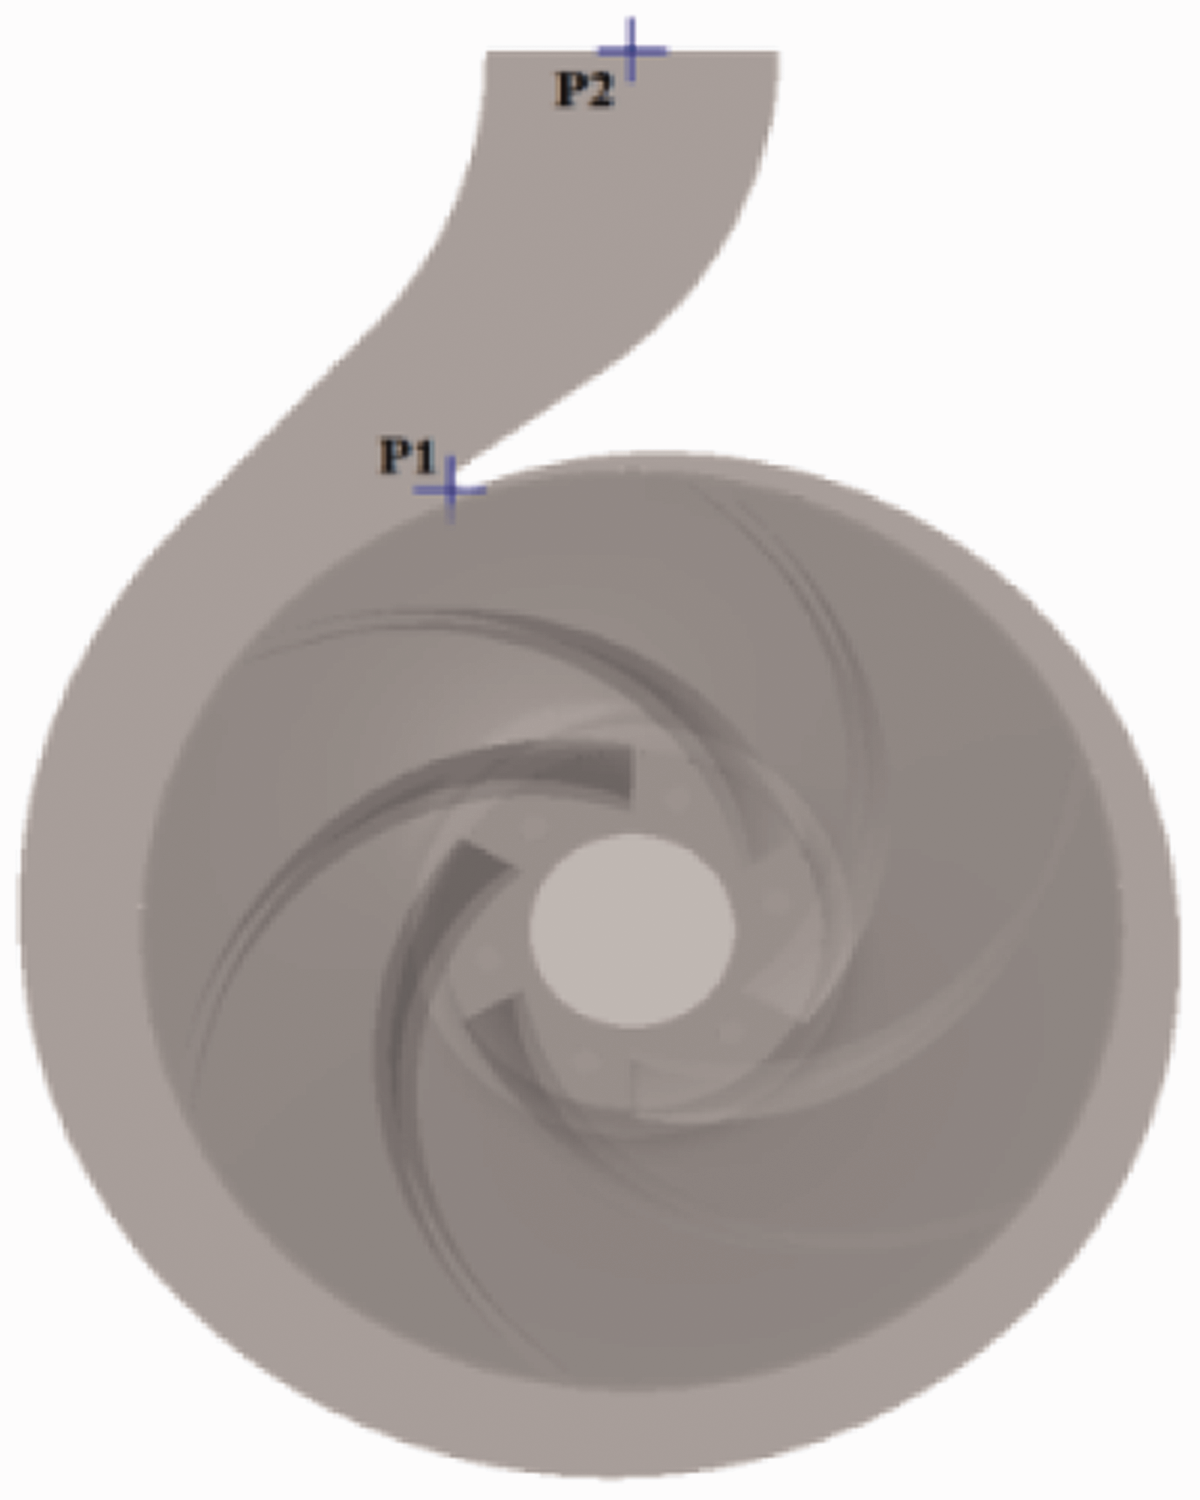
Location of monitoring points.
The pressure pulsation curves in the time domain are shown in Figure 13. In contrast to the vibration results, the pressure pulsation waveform in the time domain is extremely erratic because one of the blades is broken. For the MP, the peak-to-peak value of pressure pulsation at P1 increases by 8.5% and that at P2 decreases by 6.8%. Compared to that in the NP, the MP pressure pulsation at P1 increases. This may explain why the flow in the impeller of the MP is more non-uniform. The clearance between the tongue and impeller outlet intensifies the rotor–stator interaction between the volute and impeller.
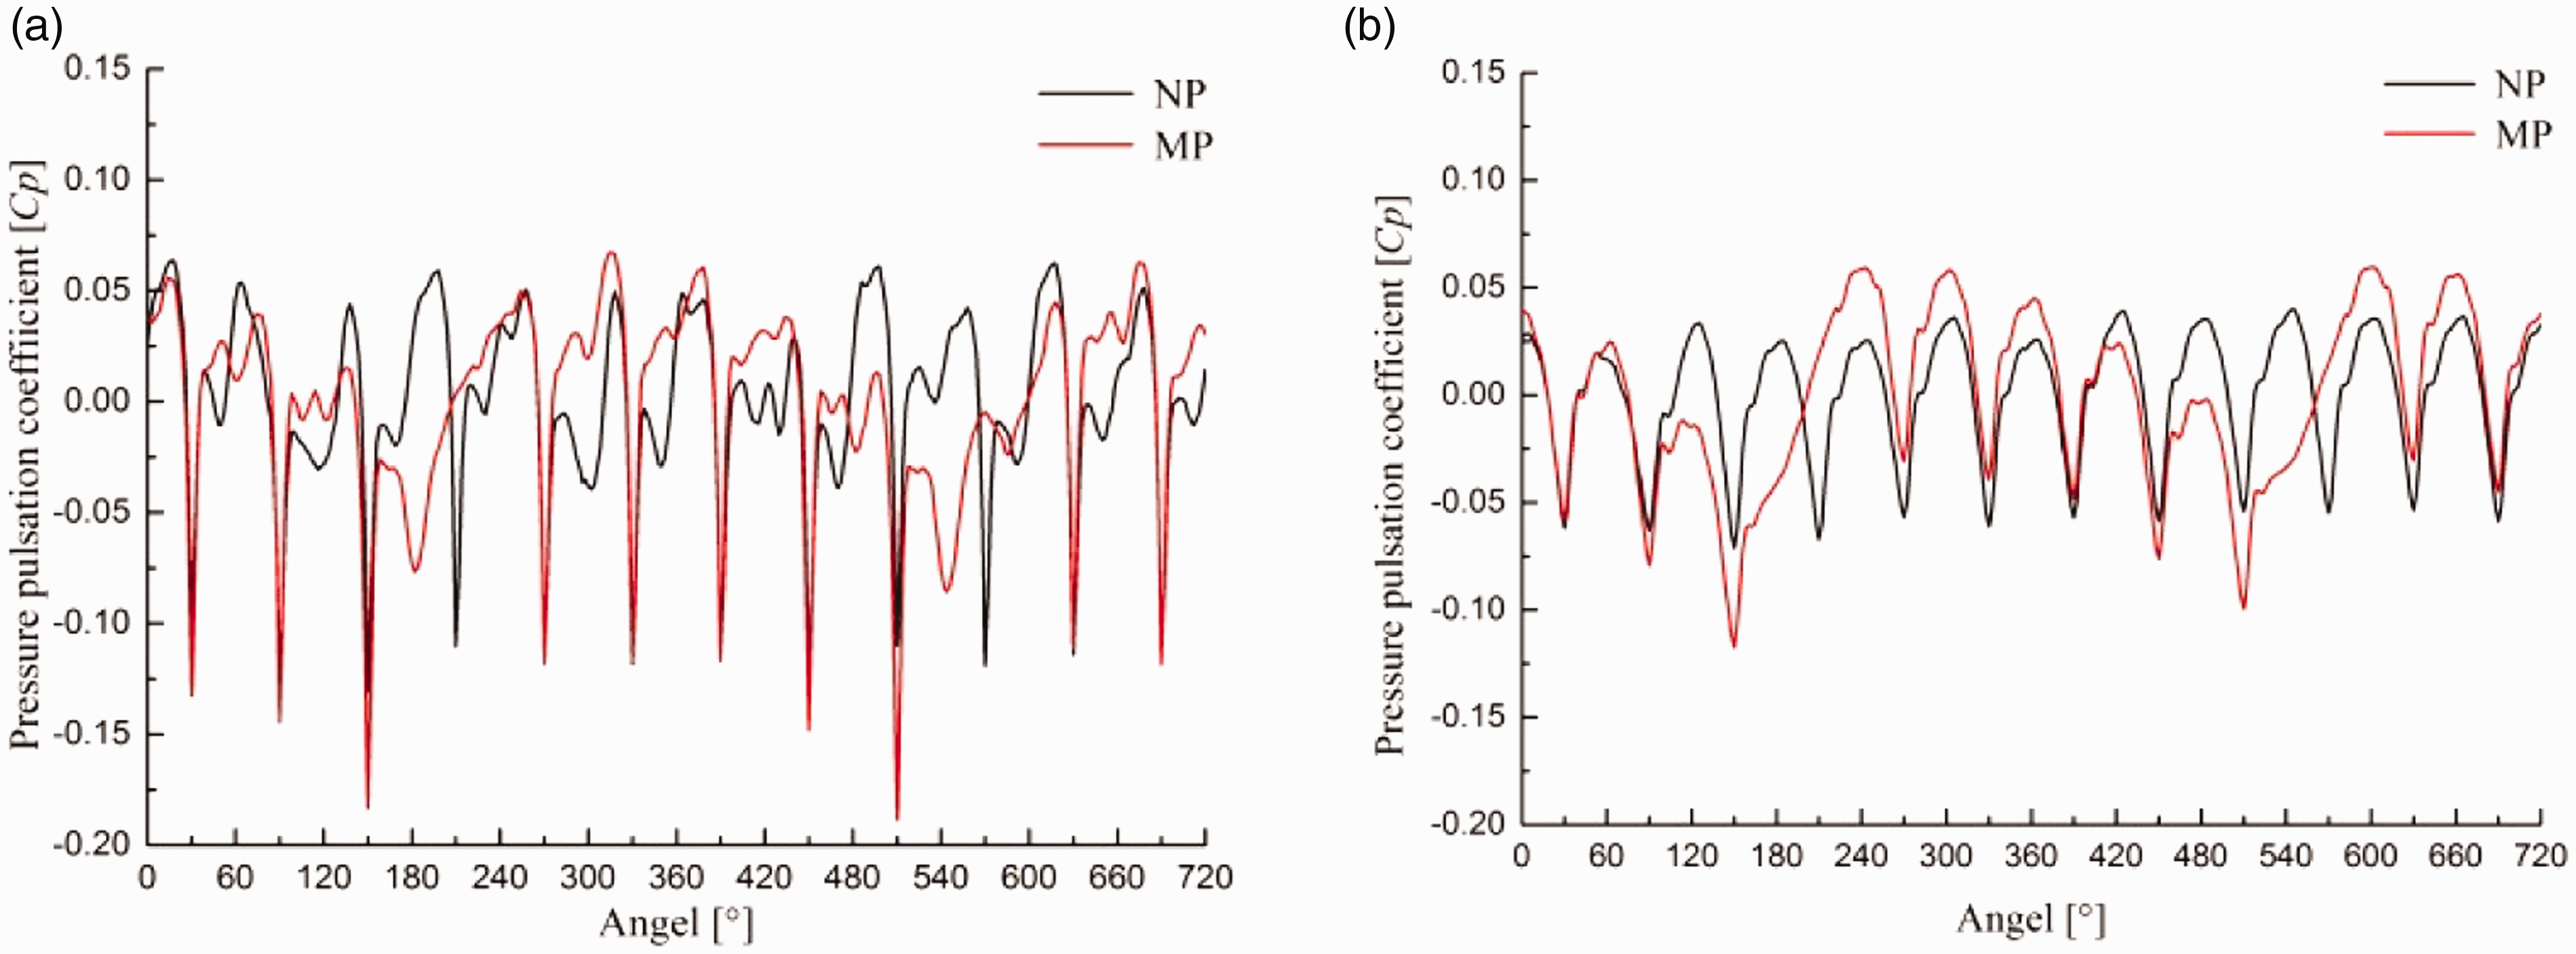
Pressure pulsation in time domain. (a) P1 and (b) P2. MP: pump with multi-malfunctions; NP: normal pump.
Figure 14 shows the pressure pulsation curves in the frequency domain. The multi-malfunctions have a significant influence on the APF pressure pulsation and its harmonic frequency; however, it has a minimal effect on the pressure pulsation at the BPF. The difference between the two models is in accordance with the regularity of theoretical analysis. At P1 and P2, the amplitudes at the APF increase by 10.56 and 18.17 times, respectively. This can be attributed to the existence of multi-malfunctions, such as the broken blade, leading to the imbalance in the impeller and shaft.
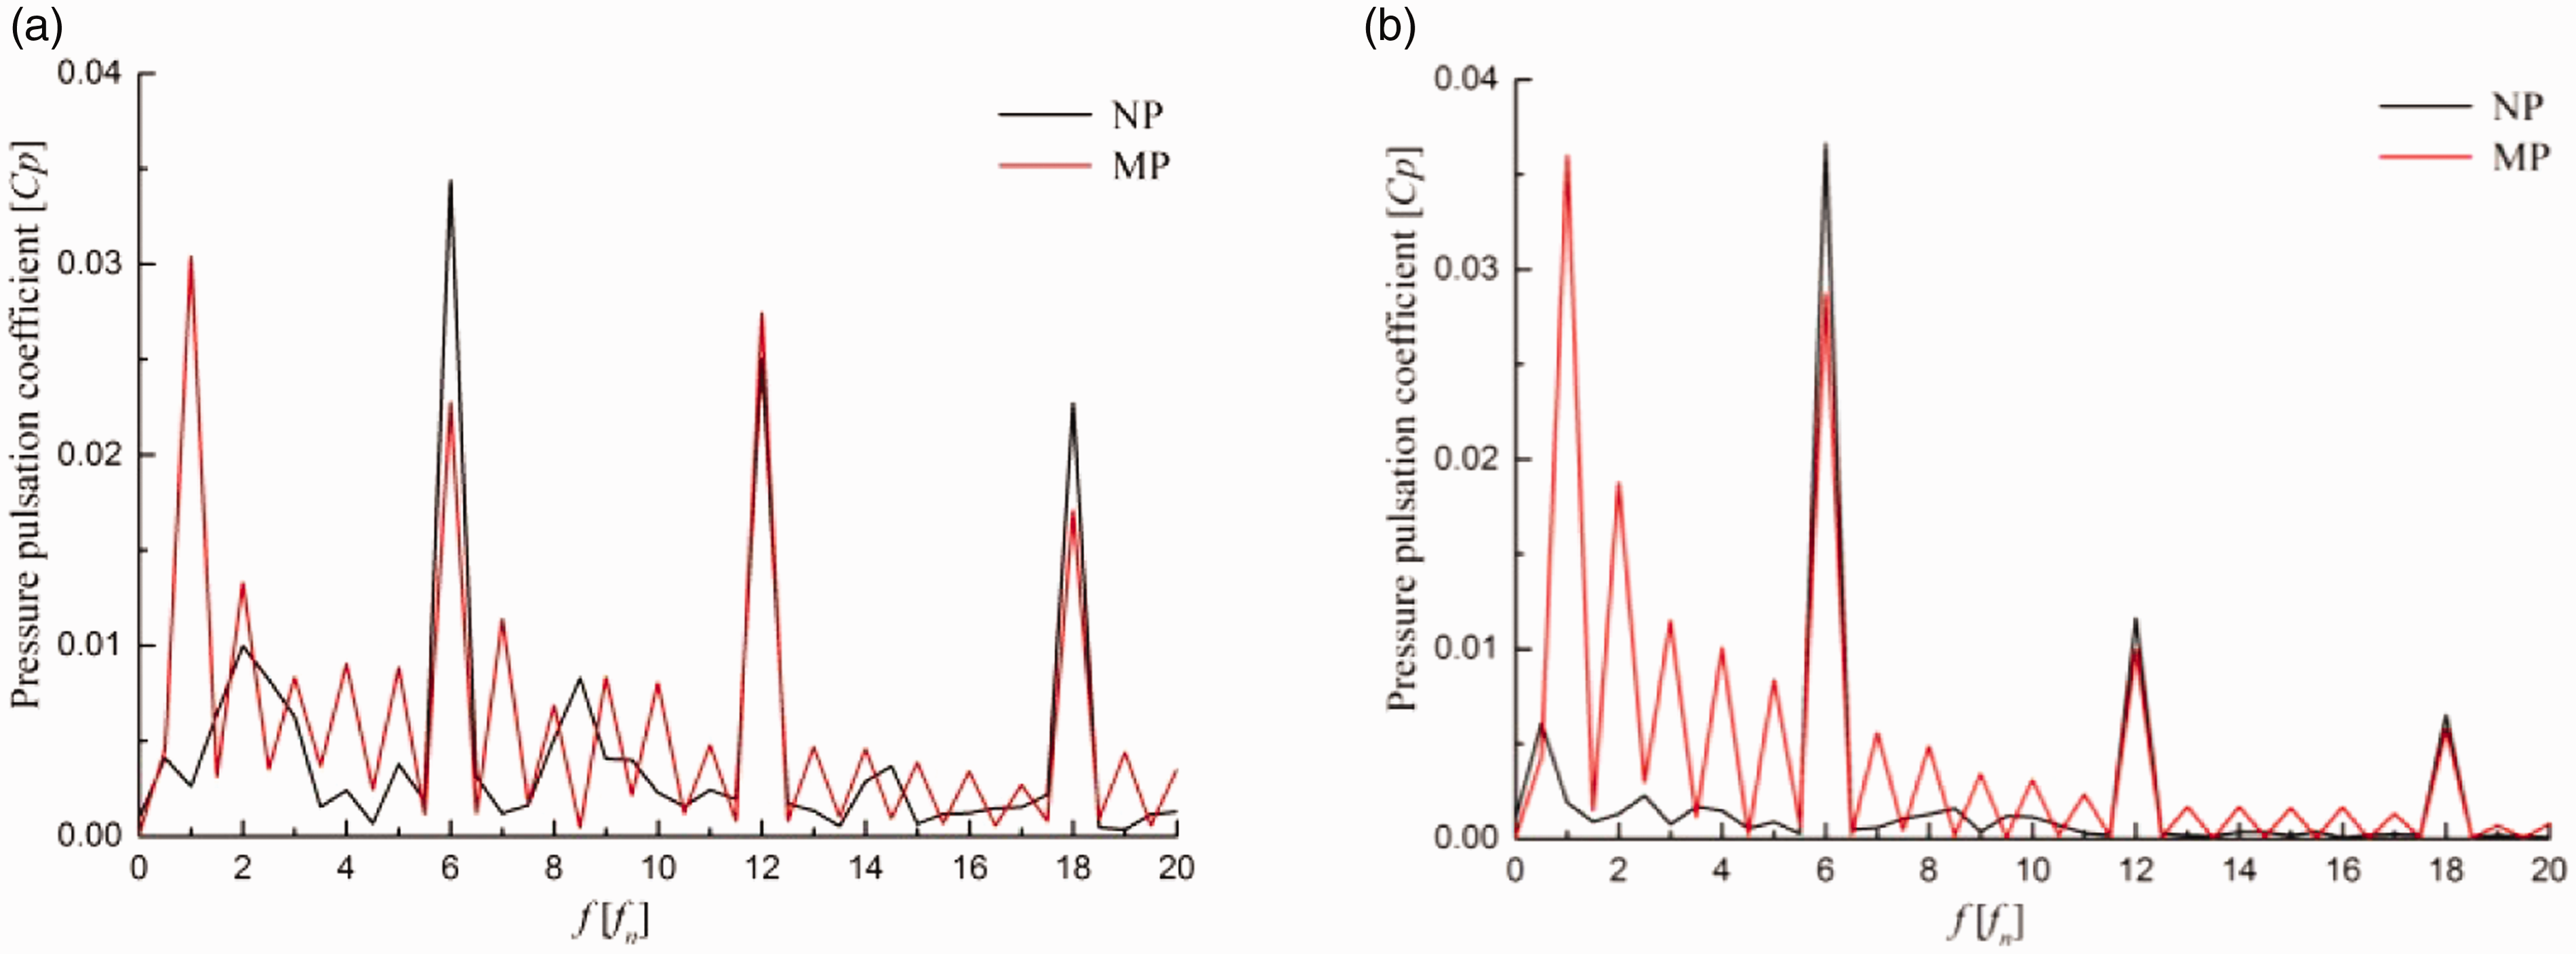
Pressure pulsation in frequency domain. (a) P1 and (b) P2. MP: pump with multi-malfunctions; NP: normal pump.
Inner flow analysis
To analyze the change in the inner flow after the malfunction, the flow fields in the impeller of the NP and MP are compared.
The relative velocity distribution in the impeller is presented in Figure 15. The velocity distribution in the NP impeller is uniform, and the low-velocity zone regularly appears near each blade pressure side. In the MP, an enlarging lower-velocity zone appears near the suction side of the broken blade.
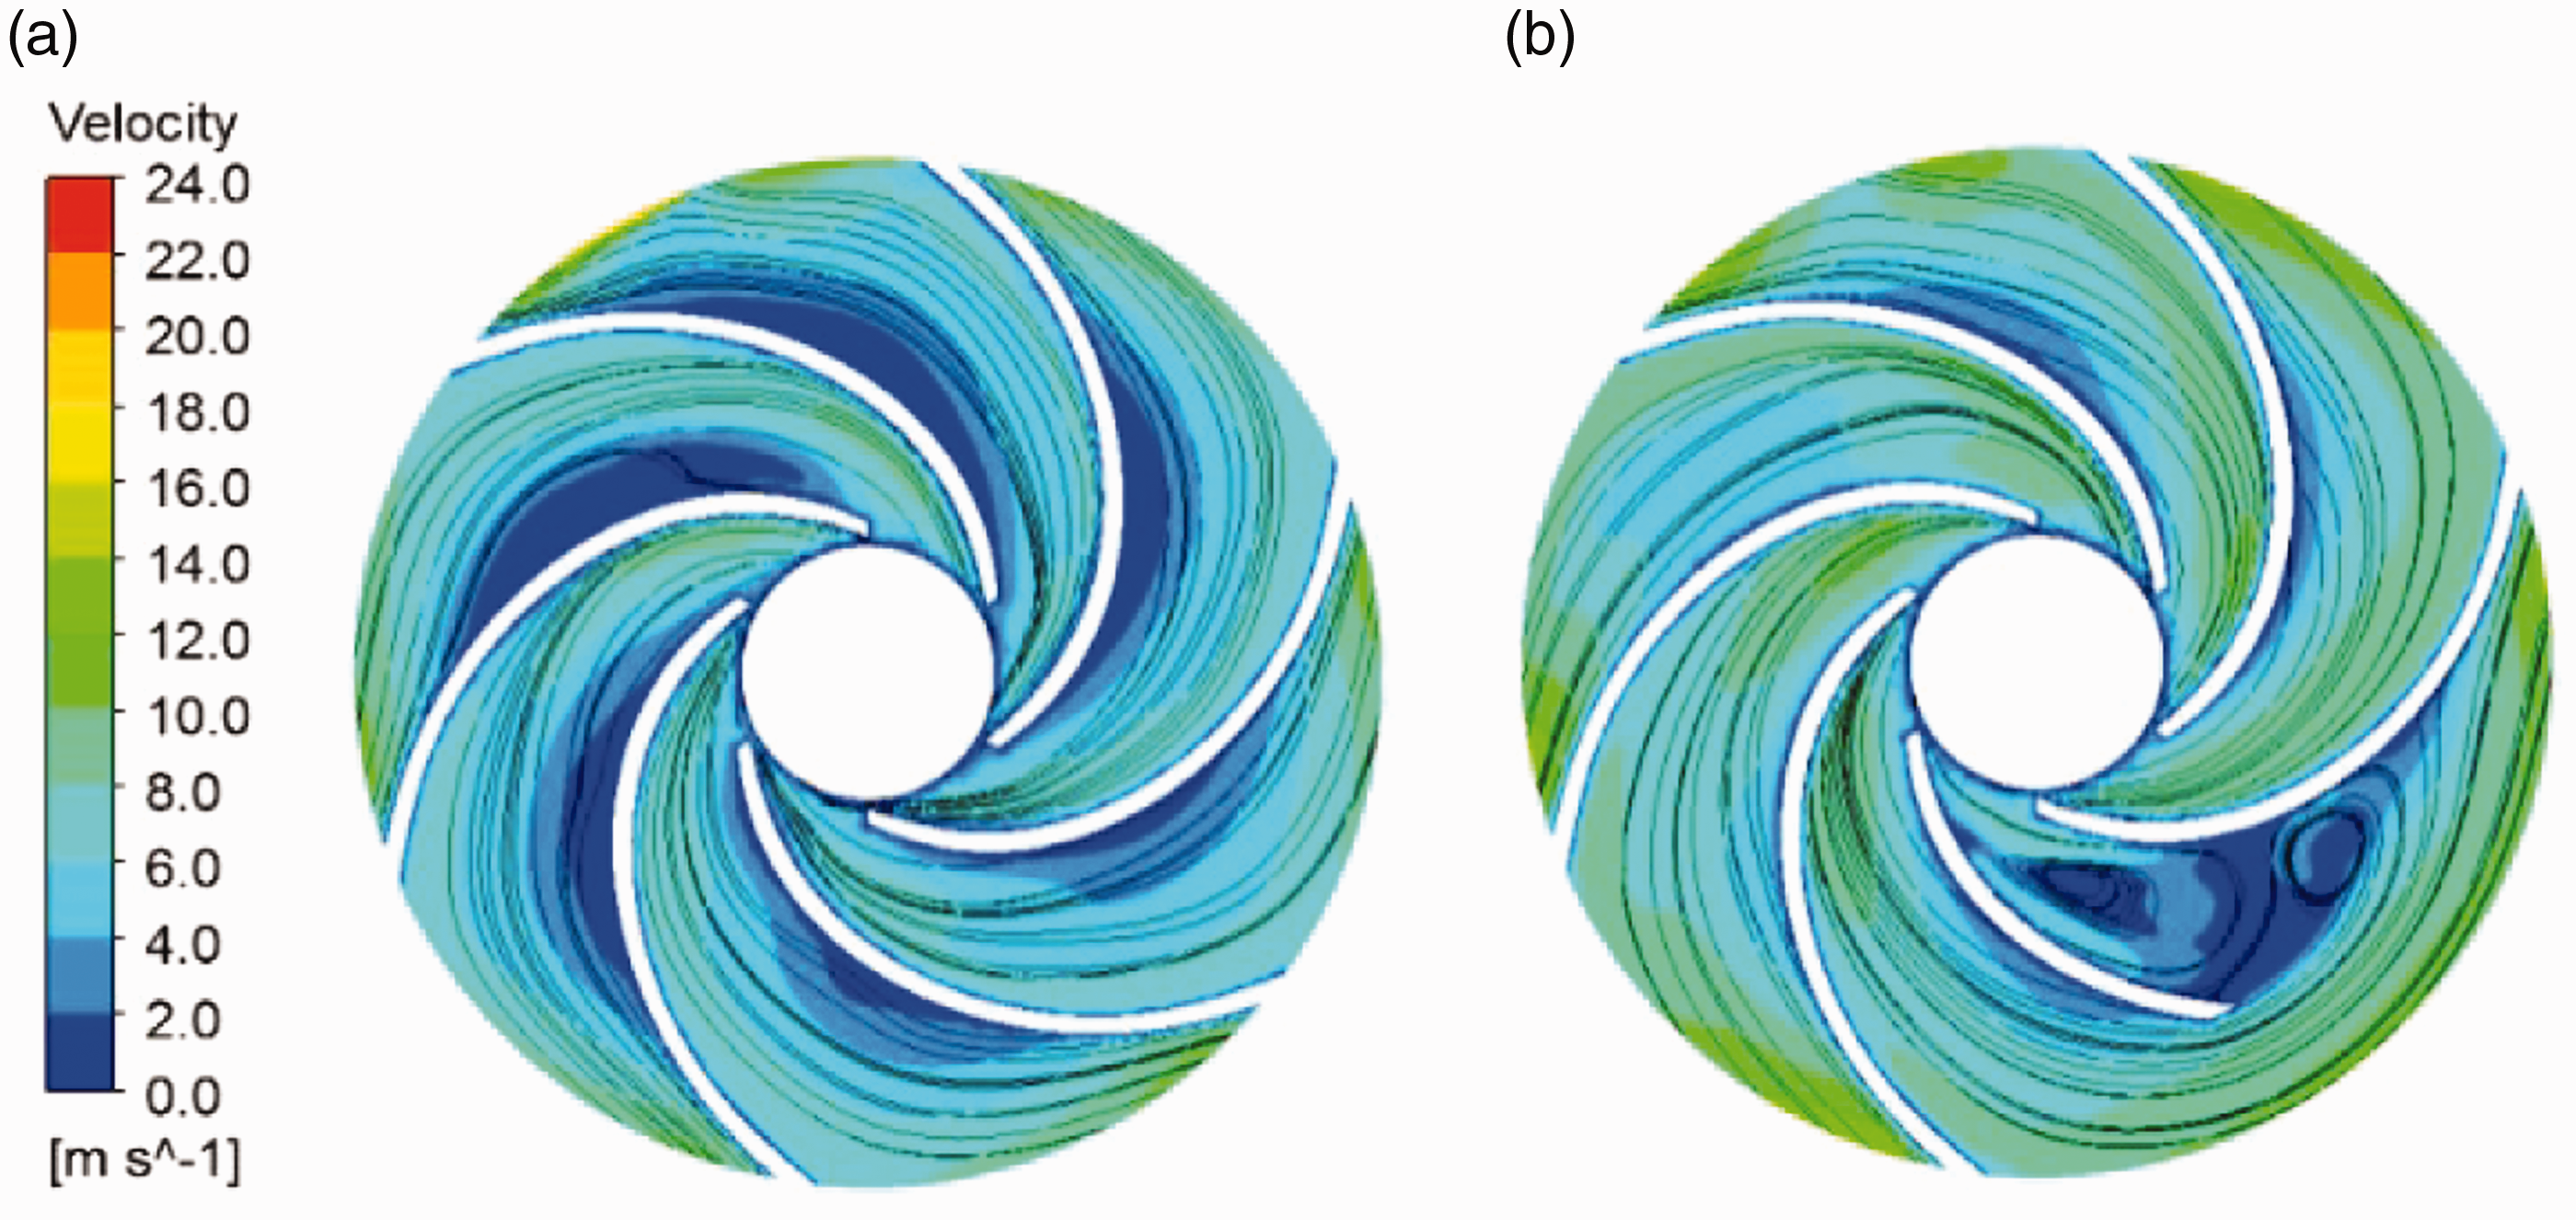
Relative velocity in impeller (1.0Q0). (a) Normal pump and (b) pump with multi-malfunctions.
The flow in the NP impeller is uniform. However, in the MP, a greater amount of the fluid on the impeller pressure side of the broken blade flows into the suction side, whereas a steady vortex appears at the inlet and middle sides of the passage. More energy is therefore wasted in the channel, leading to further hydraulic loss and reduction in pump performance.
Figure 16 depicts the absolute velocity in the pump axial section. By comparing the MP and NP, it is found that a greater amount of high-pressure fluid from the impeller outlet of the MP flows into the inlet through the front seal ring gap, causing the velocity acceleration at the inlet. As a result of the seal ring abrasion, the flow pattern at the impeller inlet distinctly deteriorates with the appearance of many vortices.
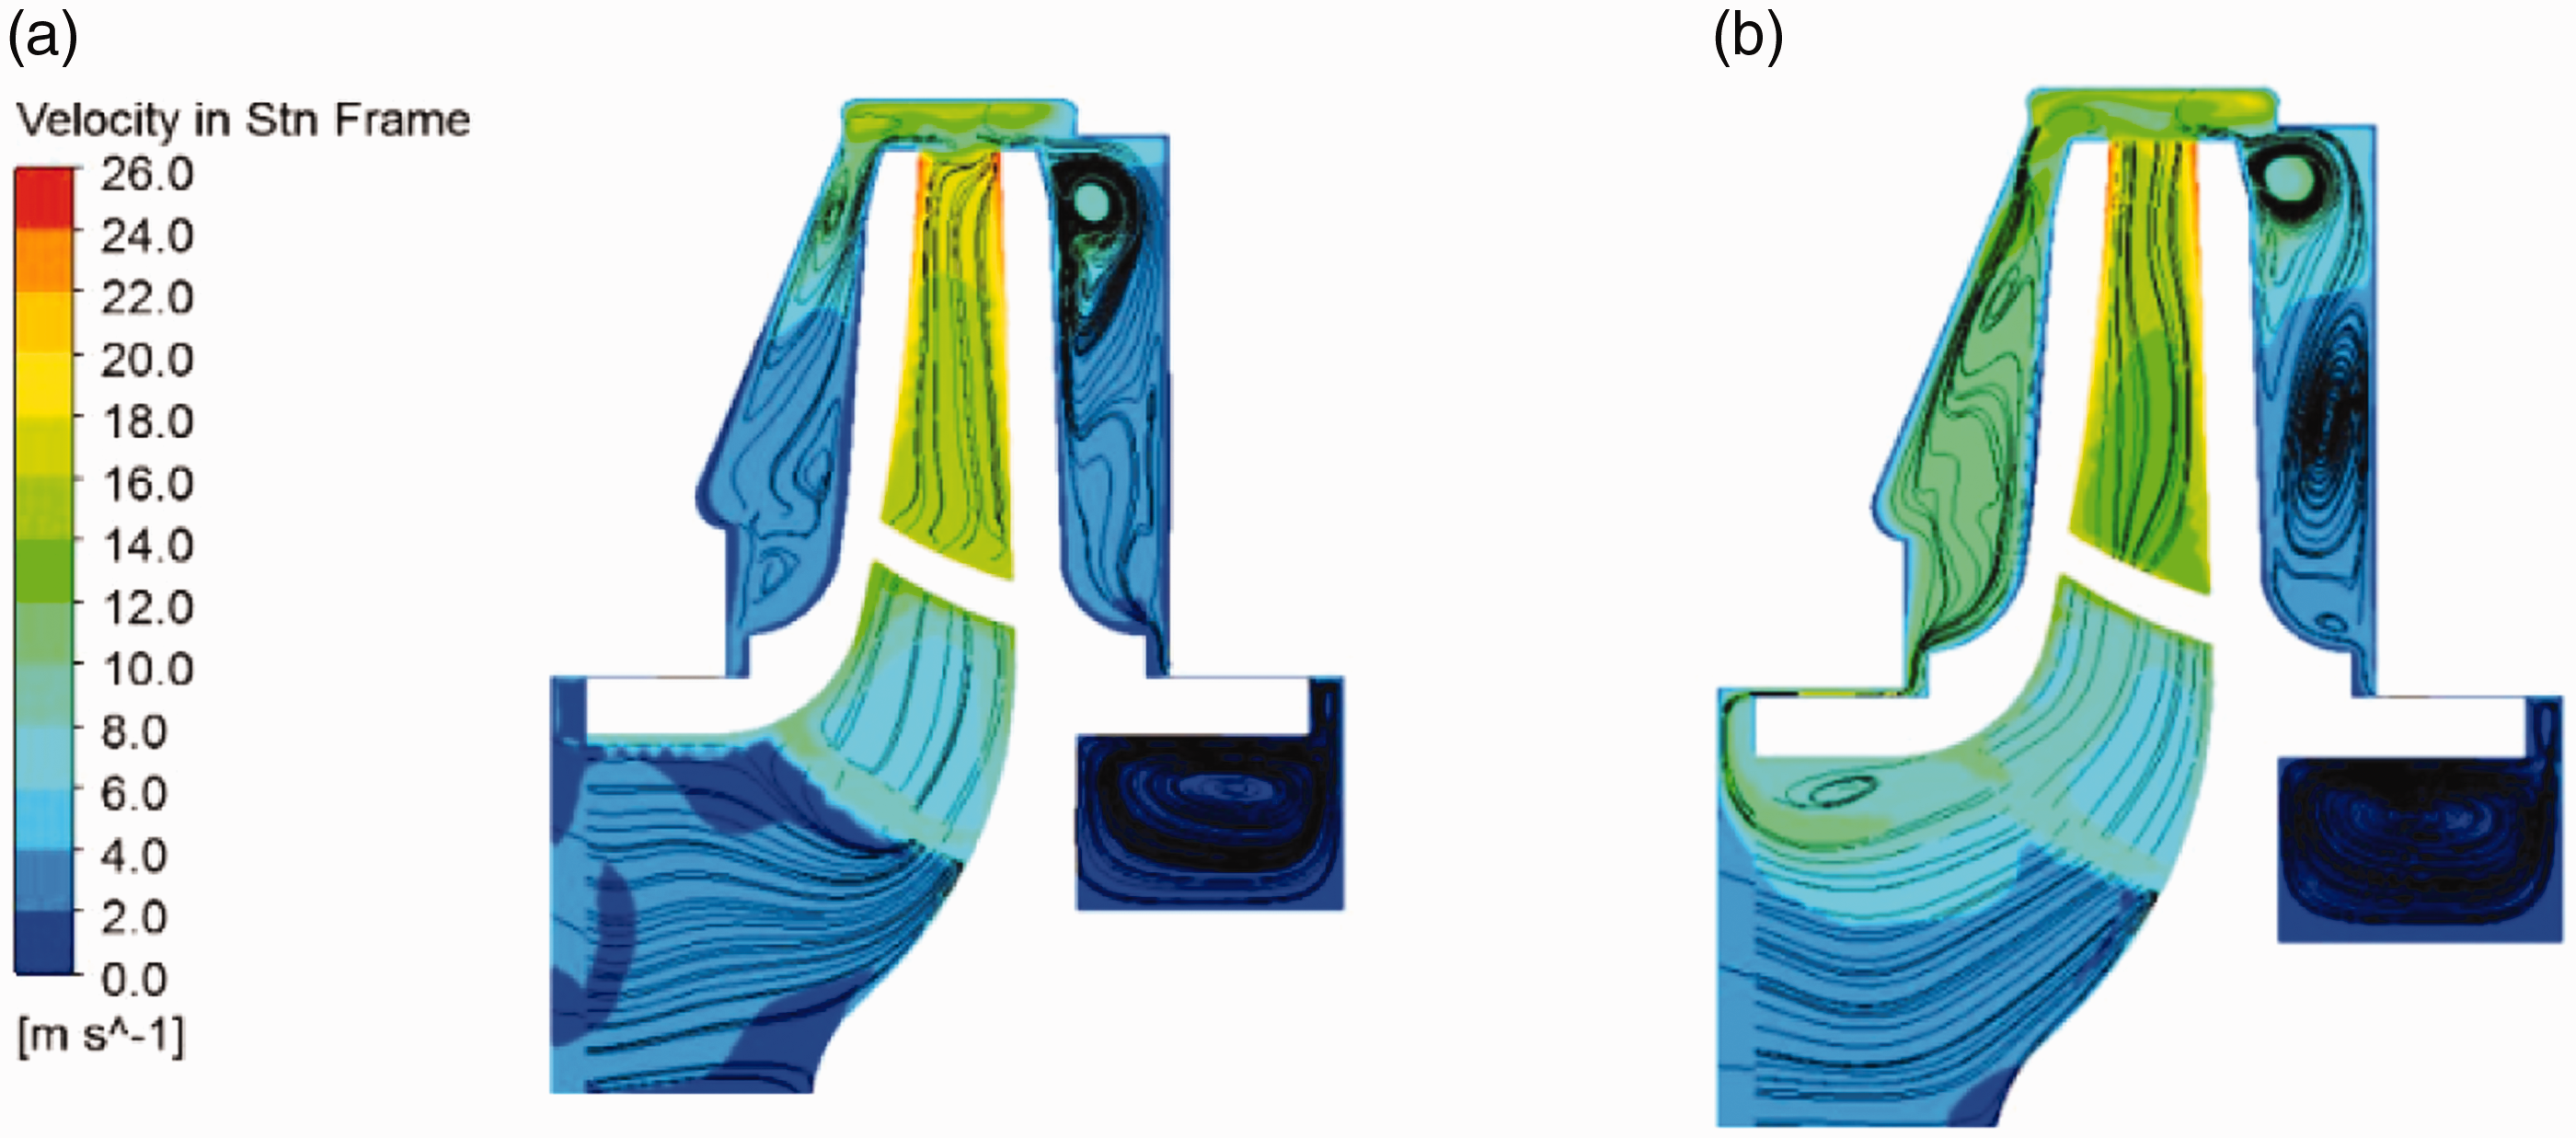
Absolute velocity in axial section (1.0Q0). (a) Normal pump and (b) pump with multi-malfunctions.
Conclusions
In this paper, the test and numerical simulation results of a centrifugal pump with a broken impeller and worn ring seal are presented. These results may be used as reference to formulate a model pump for multi-fault diagnosis and comparison with fault diagnosis theory. In the study, a quarter of the blade was cut to create a broken impeller, and 0.75 mm of seal ring was worn. By analyzing the energy performance, pressure pulsation, radial force, and inner flow of the pump in detail, the following results are obtained. The energy performance curve showed that the occurrence of multi-malfunctions generally resulted in the decrease in the pump head and efficiency. Under the design flow rate, the head and efficiency decreased by 10.56 and 10.09%, respectively. The multi-malfunctions primarily affected the vibrations on the foot of the pump. All the APF vibration amplitudes distinctly increased under each flow rate. New characteristic frequencies, i.e. 5, 2, and 3APF, appeared in the frequency structure because of the broken impeller and large seal ring clearance. The periodicity of the radial force in the MP was no longer distinct, and the curve became disordered. The radial force vector was mainly directed to the sixth section of the volute. The peak-to-peak value of the pressure pulsation increased at the tongue, but decreased at the outlet of the volute because of the multi-malfunctions. The relative velocity distribution in the MP was non-uniform, and a vortex occurred at the suction side of the broken blade. This indicated that the fluid pressure and velocity distribution were significantly influenced by the multi-malfunctions.
Footnotes
Declaration of conflicting interests
The author(s) declared no potential conflicts of interest with respect to the research, authorship, and/or publication of this article.
Funding
The author(s) disclosed receipt of the following financial support for the research, authorship, and/or publication of this article: The authors gratefully acknowledge the support of the National Natural Science Foundation of China (Nos. 51679110, 51779108, 51979124), Jiangsu Province Foundation (Grant No. BE2017356), and Priority Academic Program Development of Jiangsu Higher Education Institutions (PAPD).