
Abstract
Shaft combined misalignment is the main form of shaft misalignment fault in a marine centrifugal pump. To investigate the influence of shaft misalignment on the vibration and noise of marine centrifugal pumps, a marine pump is experimentally measured under normal condition and shaft combined misalignment condition. In this paper, the frequency domain characteristics of vibration and noise are analyzed by Fast Fourier transform technique. The characteristics of axis orbit, the spectral characteristics of vibration and noise, and the One-Third octave spectral distribution characteristics are also comprehensively compared. Results show that after shaft combined misalignment occurs, the maximum amplitudes of 1APF (axial passing frequency) in the X and Y directions at M1 increase by 35.06% and 24.04%, the maximum amplitudes of 2APF in the X and Y directions at M1 increase by 2.61 times and 2.61 times, and the axis orbit shows a clockwise variation of the “8” shape. As the flow rate decreases, the shape of an “8” of the rotor axis orbit becomes progressively flatter. The maximum Overall vibration velocity level (OAVL) of M2 and M5 decreases by 12.03% and 1.79%, and the maximum OAVL of M3 and M4 increases by 6.52% and 2.27%. The frequency domain amplitude of M6 increases significantly in 1APF and 2APF, and the maximum increases are 12.41% and 2.24% at different flow rates. The overall sound pressure level of M6 increases by 0.42% at 0.6Qd. These findings indicate the vibration energy of M1-M5 and noise energy of M6 are related to the running condition. The axis orbit of M1 shows the shape of 8, which can significantly judge the misalignment of the shafting. Then, combined with the amplitude variation of 1APF and 2APF of the M2-M6 spectrum, the comprehensive misalignment of shafting can be further judged. The above discoveries provide reference to the diagnosis of shaft combined misalignment fault that occurred for the marine pump.
Keywords
Introduction
Marine centrifugal pumps play a vital role in the operation of ships, which are widely used in ship power plants, bilge ballast, safety firefighting, circulating cooling, life sanitation and other ship maintenance systems. 1 Due to the limited space inside ships, the excessive vibration and noise generated by the pump during operation will cause pollution to ship environment and seriously affect the health of seafarers.2,3 Therefore, reducing pump vibration and noise levels has become a hot research topic.
The abnormal vibration and noise of centrifugal pumps are mainly induced by rotor system fault, and rotor misalignment accounts for more than 60% of them.4,5 Rotor misalignment includes bearing misalignment and shaft misalignment. Bearing misalignment can be automatically eliminated according to the structural characteristics of the bearings themselves.6,7 Shaft misalignment, also known as coupling misalignment, refers to the fact that the centerlines of the two connected shafts do not coincide in the actual running process. 8 It is difficult to eliminate completely by changing the coupling structure. As a kind of centrifugal pump, marine pumps inevitably have shaft misalignment in the actual operation process. Therefore, it is significant to study and master the vibration and noise performance of shafting misalignment fault, which contributes to the design of vibration and noise reduction in the marine centrifugal pump.
In recent years, several works of literature have been reported about the vibration and rotor axis orbit of rotating machinery under the shaft misalignment fault. Zhang et al. 8 comparatively analyzed the natural frequencies of the bearing-rotor systems with two different types of misalignment errors and found that angular misalignment caused by non-concentric bearing seats had a larger impact on the dynamic characteristics of the rotor system. Patel et al. 9 experimentally studied e vibration response of misaligned coupled rotors supported on rolling element bearings. This result showed that the unique vibration features exhibited in the full-spectra could effectively display the fault characteristics of diagnosing misalignment. Xia et al. 10 analyzed the dynamic responses and orbits of two rigid rotors connected by a hexangular flexible coupling under angular misalignment conditions and parallel misalignment conditions. The results showed that under the parallel misalignment conditions, the first order imbalance force and second-order misaligned force were the primary excitation sources of the system and the rotor orbit concaved “8” shape. Wan et al. 11 experimentally and theoretically studied the dynamic response of a multi-disk rotor system with coupling misalignment and acquired spectrum and main profiles of the “8”-like orbit shape. However, the results above focus more on the characteristics and causes of the pressure pulsation and the vibration characteristics of the rotor of non-hydraulic machinery, but there is little research on the relationship between the pressure pulsation and the vibration of the shafting of the mixed-flow pump. The above results are more focused on the analysis of the rotor axis orbit characteristics for non-hydraulic mechanical rotors, but there is litter research about the rotor axis orbit and vibration characteristics of the centrifugal pump. Li et al. 12 experimentally studied the shaft system vibration and rotor axis orbit of the mixed-flow pump under design flow condition. The results showed that the axis orbit was like concaved “8” shape, which indicated that the arcuate rotary whirl and misalignment phenomenon existed. Xue et al. 13 developed a method using support vector machine, statistic filter, possibility theory, and Dempster-Shafer theory to analyze and process vibration signals. These methods could detect cavitation, impeller unbalance, and shaft misalignment in the centrifugal pump at an early stage. Lu et al. 14 studied the axis orbit and the vibration spectrum of the multistage centrifugal pump at 0Qd, 1.0Qd, and 1.5Qd. They obtained the axis orbit curve and the displacement time-domain diagram with unbalance and misalignment faults by using the Butterworth filter. Then, the FFT technique was used to analyze the frequency spectrum of axis orbit. Muralidharan et al. 15 proposed a fault detection method based on vibration signal. They used the continuous wavelet transform (CWT) and J48 algorithm to analyze the impeller fault, cavitation, bearing fault and coexisting bearing and impeller faults. Sakthivel et al. 16 using the C4.5 decision tree algorithm to distinguish the bearing and impeller faults. Song et al. 17 developed a vibration signal based the Mahalanobis distance using a combination method of statistical filtering and the ant colony optimization to diagnose the impeller unbalance, shaft misalignment, and cavitation in the pumps. After review of the literature, we can find that most of the above investigations on the vibration and rotor axis orbit of the centrifugal pump under misalignment fault are mostly based on the method of signal processing for vibration analysis, identification and fault diagnosis. After review of the literature, we can find that most of the above investigations on the vibration and rotor axis orbit of the centrifugal pump under misalignment fault is mostly based on the method of signal processing for vibration analysis, identification and fault diagnosis. However, there is little research on the vibration of the pump under shaft misalignment conditions. This is not conducive to the evaluation of the overall vibration level of the pump group.
In addition, we may pay attention to the noise characteristics under shaft misalignment conditions, so as to judge whether the excessive noise affects the stealth performance of the pump unit. The existing literature mostly studies the air-induced noise focus on the rotating machinery.18,19,20 According to centrifugal pumps, Al-Obaidi 21 analyzed the influence of inlet valve opening on pump cavitation performance. He also analyzed the relationship between the cavitation and noise characteristics. Cudina et al. 22 experimentally studied the noise spectra characteristic of cavitating pumps and then used them to detect the incipient of cavitation and its development. Dong et al. 23 compared with solid vibration and liquid noise methods to identify cavitation. They found that liquid noise signals to identify cavitation are more sensitive and reliable. Guo et al. 24 explored the flow-induced noise propagation mechanism of centrifugal pumps from the concept of flow and sound field synergy and deduced the transient synergetic relationship between flow and sound. Tan et al. 25 experimentally studied the influence of the number of blades on flow-induced vibration and noise in a centrifugal pump. The above results mostly focus on centrifugal pump design parameters, cavitation, the effect of different flow rates on noise, and cavitation diagnosis by using noise signals. After review of the literature, we can find that there are few studies on the noise characteristics of the pump in the case of shaft misalignment.
Therefore, the objectives of this study reveal the vibration and noise for the marine centrifugal pumps with shaft misalignment. In actual operation, marine pumps mostly appear in the form of combined misalignment. So, shaft combined misalignment of the marine centrifugal pump is selected to be researched. In this paper, under normal conditions and shaft combined misalignment conditions, a marine centrifugal pump is experimentally measured and analyzed at the same flow rates. The kalman filter, Fast Fourier transform (FFT), and One-Third octave analysis method are used to process the vibration and noise data, and the spectral characteristics of the vibration and noise are analyzed.
Research protocols and experiment systems
Marine centrifugal pump
The structure of the marine centrifugal pump in this study is shown in Figure 1, which contains pump foot, inlet elbow, impeller, bracket, pump casing, bearing pedestal, pump shaft, rigid coupling and motor. The parameters of the marine centrifugal pump are illustrated in Table 1. The design flow rate Qd=100m
3
/h, head H=80m, rotating speed n=2950r/min, and specific speed n
s
=67.09. Structure of a marine centrifugal pump. Main structure parameters.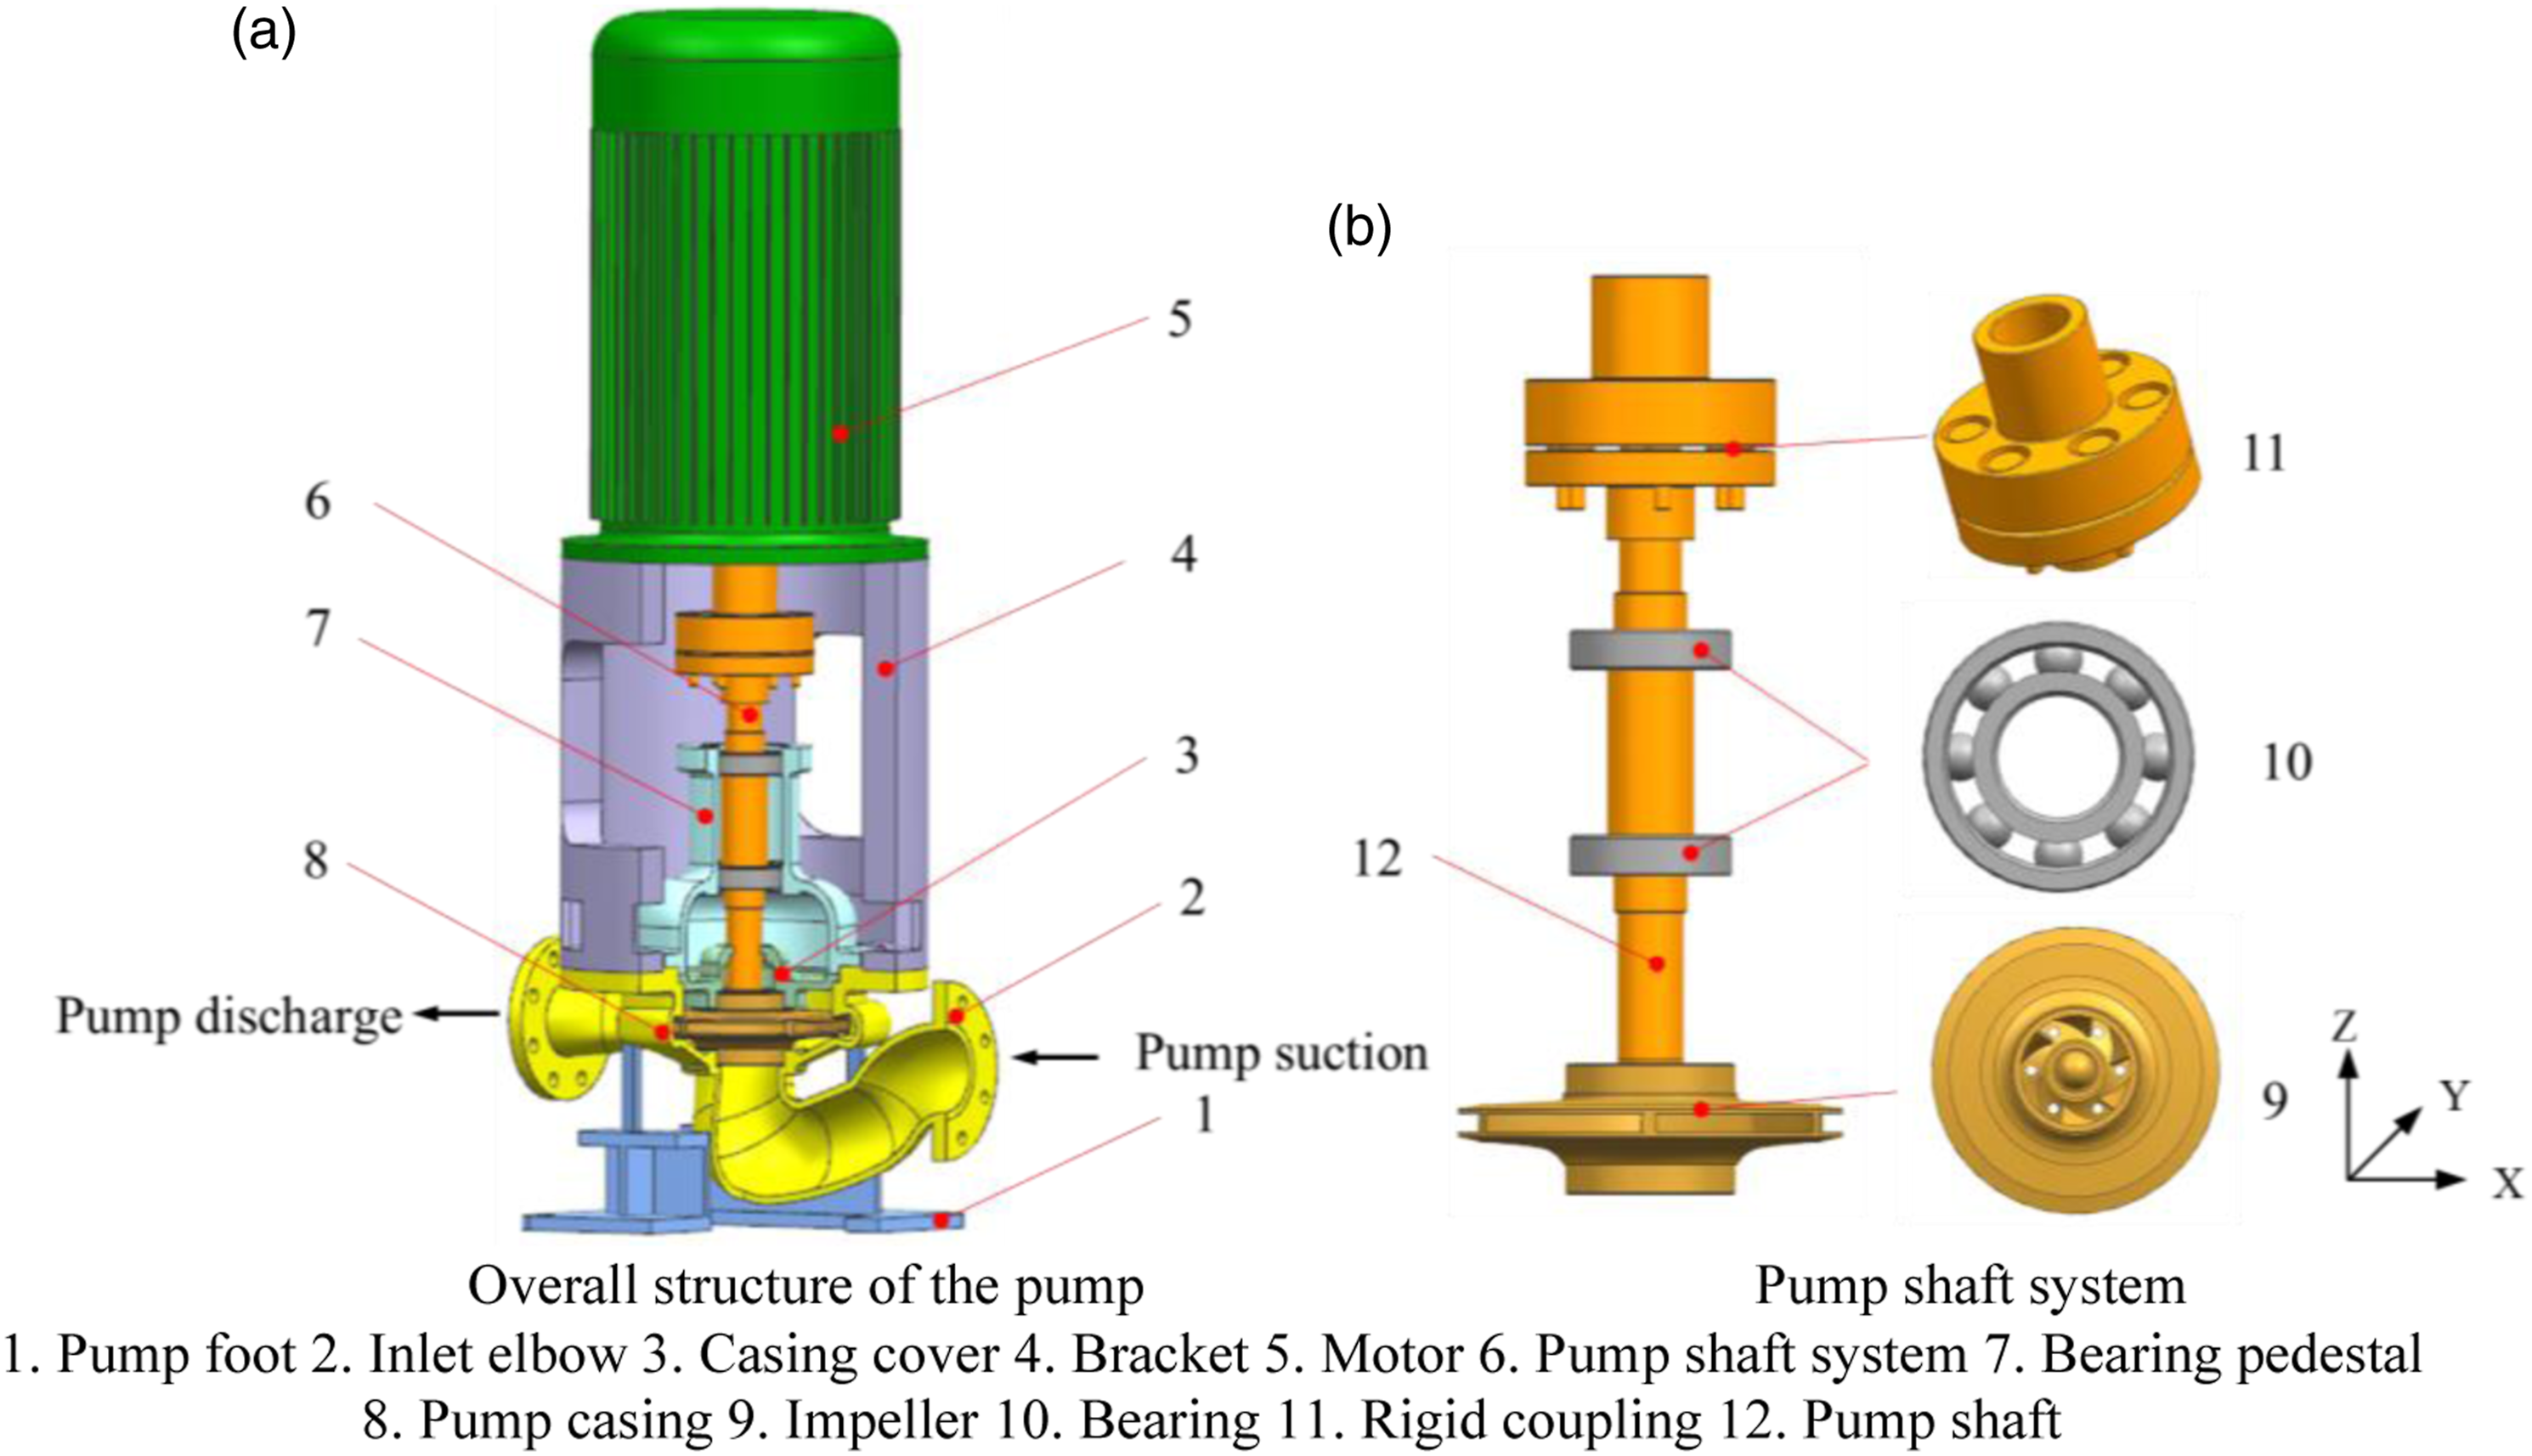
Research protocols
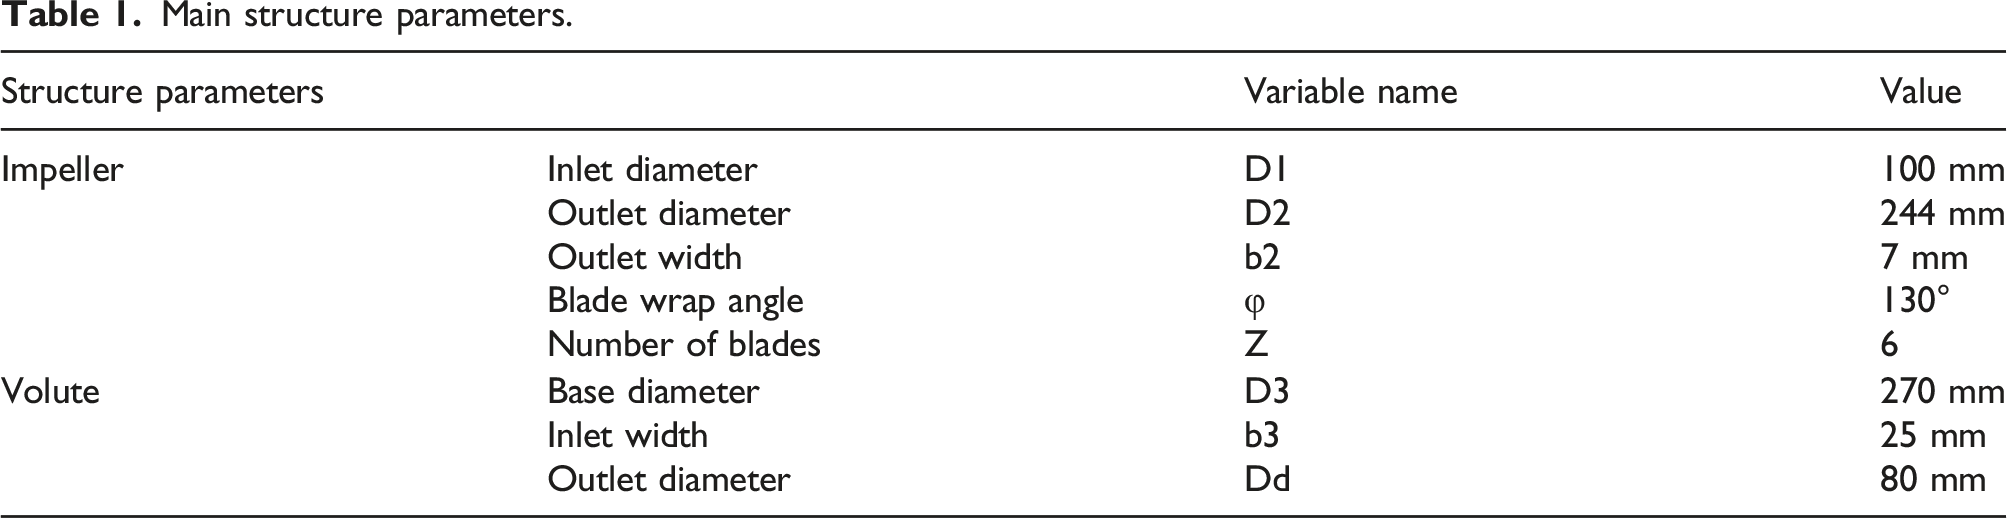
As shown in Figure 2, the shaft misalignment fault generally includes parallel misalignment, angular misalignment, and combined misalignment.
12
This paper investigates the shaft combined misalignment of the pump, which accords with the actual situation. Adding a steel ruler to the clearance between the motor and the bracket causes shaft combined misalignment of the marine pump. The thickness of the steel ruler is 0 and 2 mm, respectively. The thickness of the steel ruler is 2 mm, corresponding to the normal condition of the pump shaft system, which is recorded as scheme A. The thickness of the steel ruler is 2 mm, corresponding to the comprehensive misalignment of the pump shaft system, which is recorded as scheme B. Classification of shaft misalignment.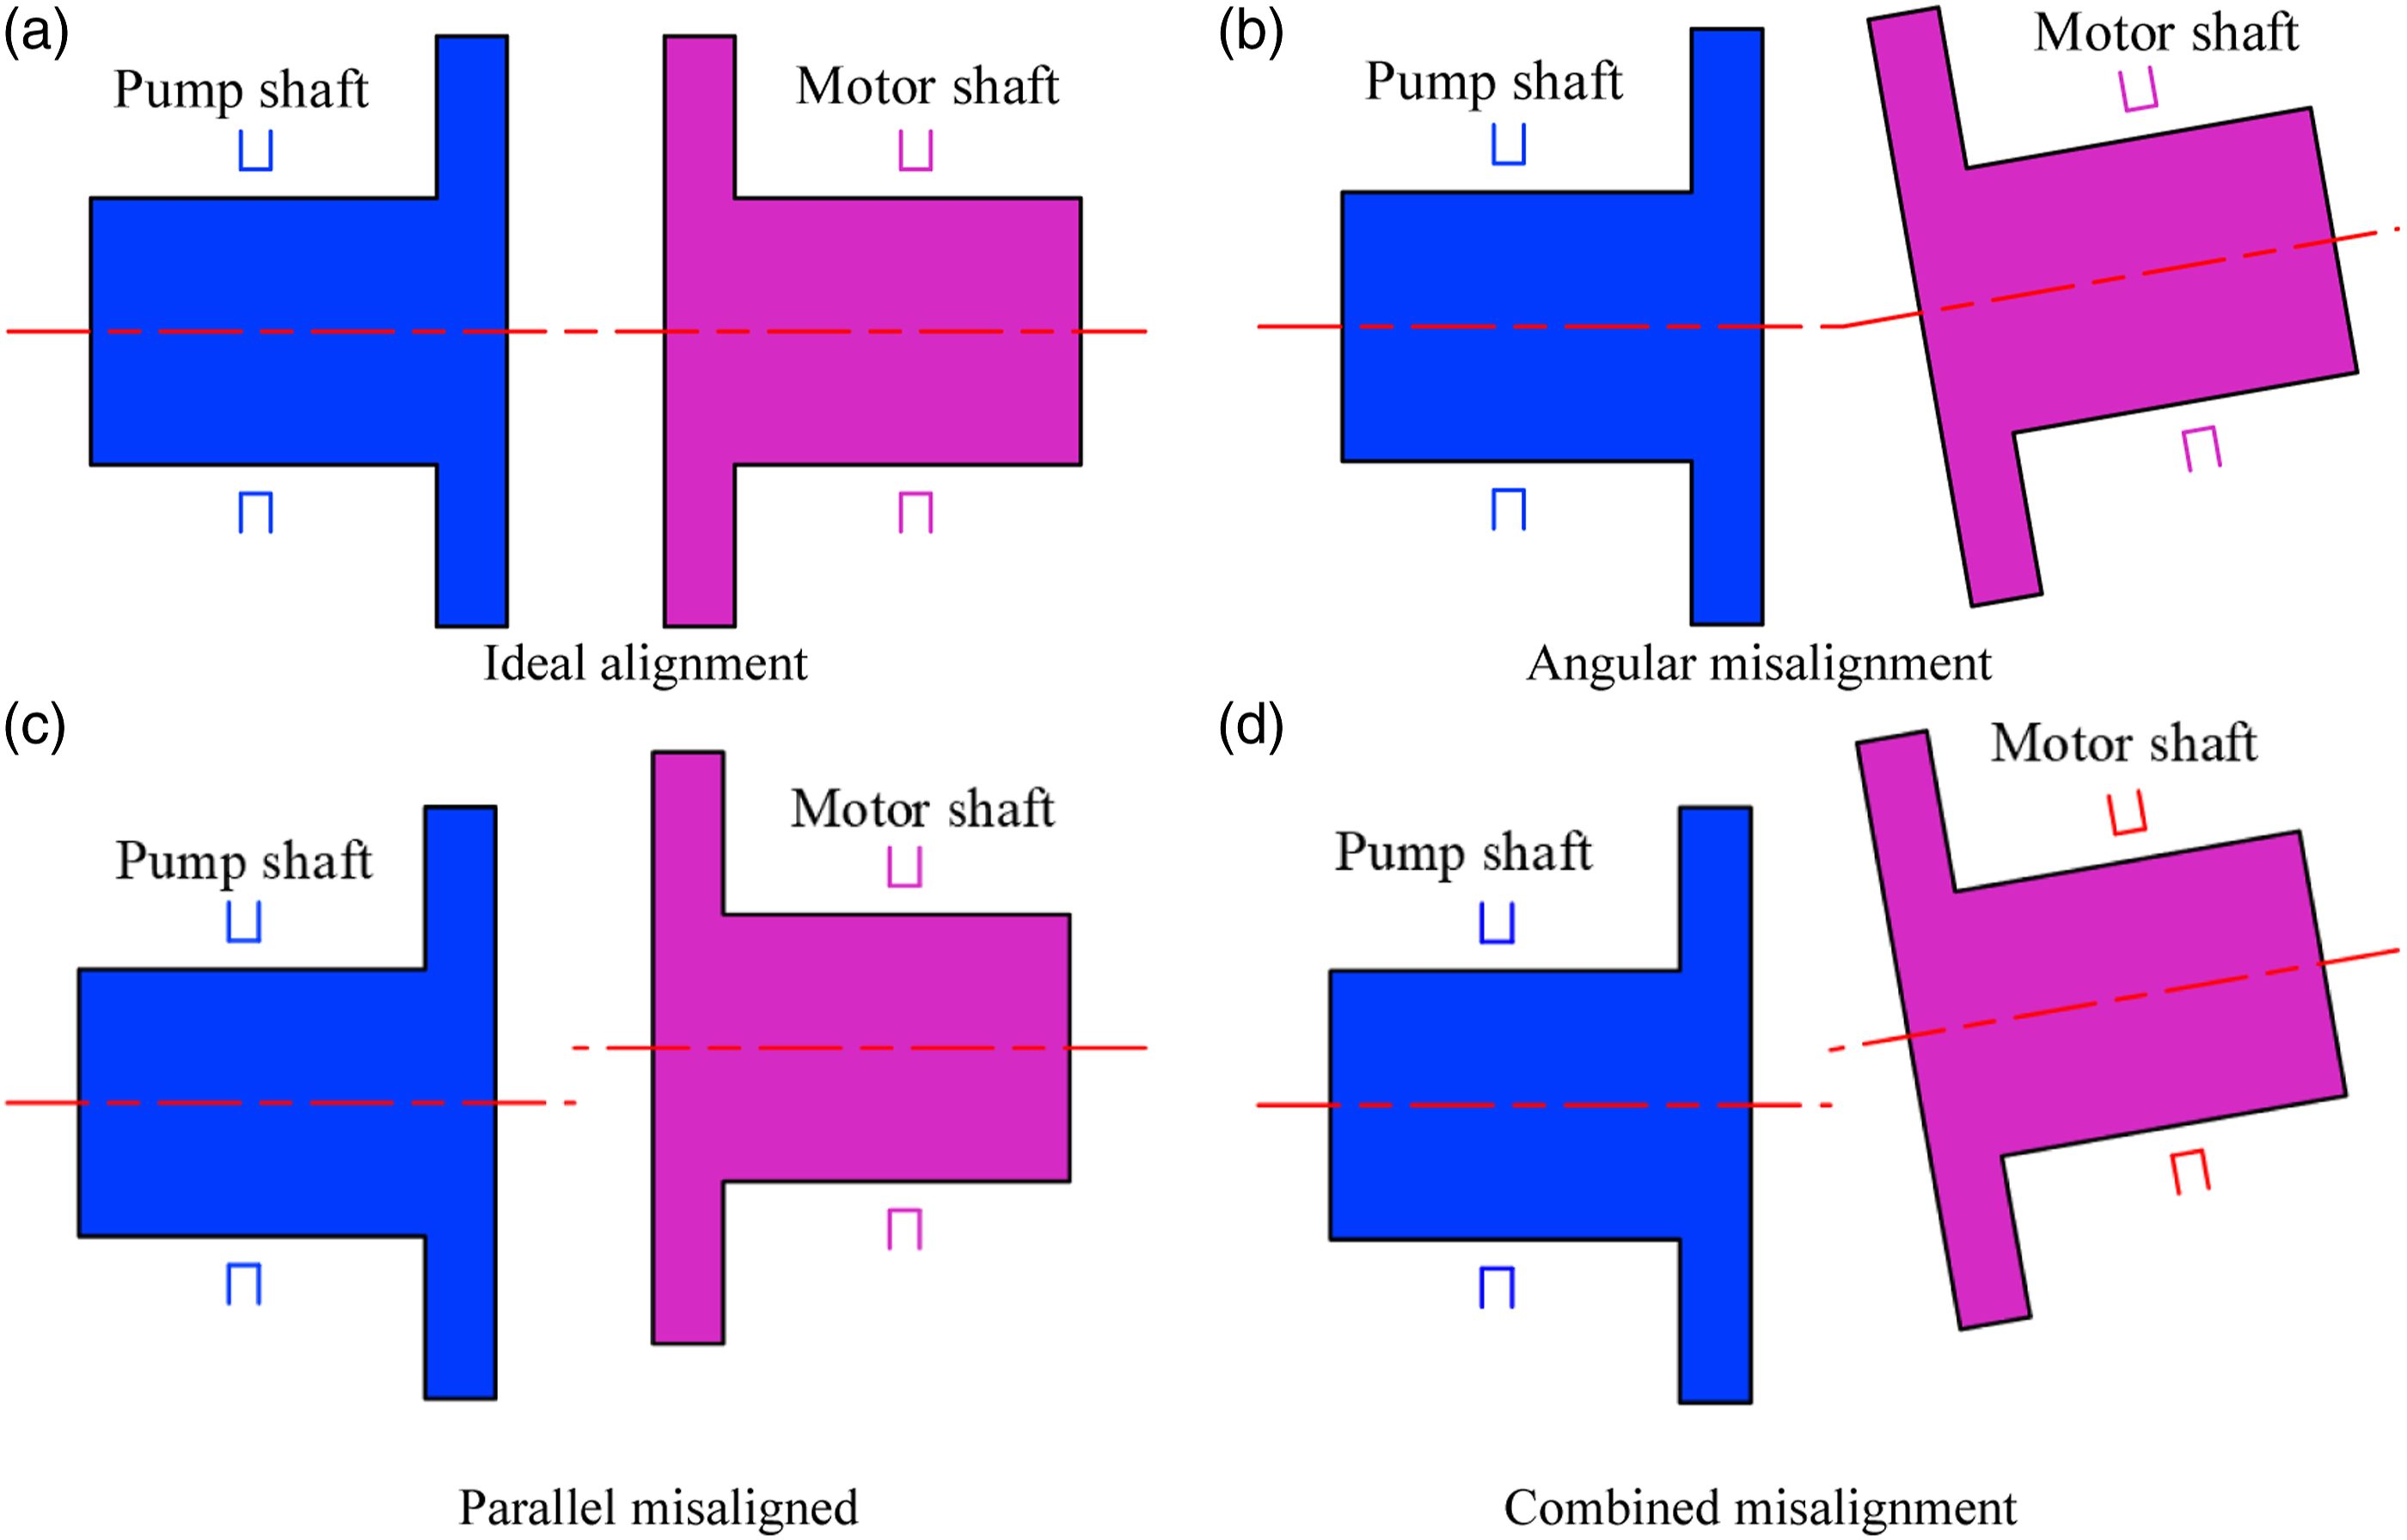
Experiment systems
The marine pump performance experimented in the closed experiment bench is shown in Figure 3. It mainly includes an electromagnetic flowmeter, control valve, regulator tank, pressure sensor, marine centrifugal pump, motor, signal data acquisition instrument, and computer. The electromagnetic flowmeter is installed one meter from the outlet pipe. The flow is controlled by the control valve. The pressure sensor measures the inlet and outlet static pressure. The vibration acceleration of the pump tested by the uniaxial voltage type (IEPE) LZD1 acceleration sensor, whose sensitivity is 10mv/(m/s2). Pump hydrodynamic noise is tested by PHS-10 standard hydrophone. The vibration displacement of the pump shaft is tested by the LD980-Y integrated eddy current displacement transducer with a frequency response range of 0–10 kHz. Schematic diagram of vibration and noise experiment bench in the marine centrifugal pump.
The characteristic frequency of vibration and noise of marine pumps is generally lower than 1000 Hz. Therefore, this paper sets the sampling frequency as 10240 Hz. The data acquisition and signal processing software is DASP V10 engineering version, and the measurement point arrangement complies with the regulations in GB/T 29531–2013. Vibration and noise measurement points are set in the marine pump, as shown in Figure 4. M1 is the vibration displacement measurement point for the pump shaft, which sits near the drive end of the coupling pump shaft. The horizontal and vertical eddy current displacement sensors obtain the horizontal and vertical displacement value for rotor axis’ orbits with time. M2∼M5 are vibration acceleration measurement points of the pump. M2 is set at the pump foot. M3 is set at the inlet flange. M4 is set at the outlet flange. M5 is set at the pump casing. M6 is the noise measurement point, which is set at four times the diameter of the pump outlet pipe. When conducting data analysis, the DASP integration function is used to convert vibration acceleration to vibration velocity. Physical layout of sensor measuring points.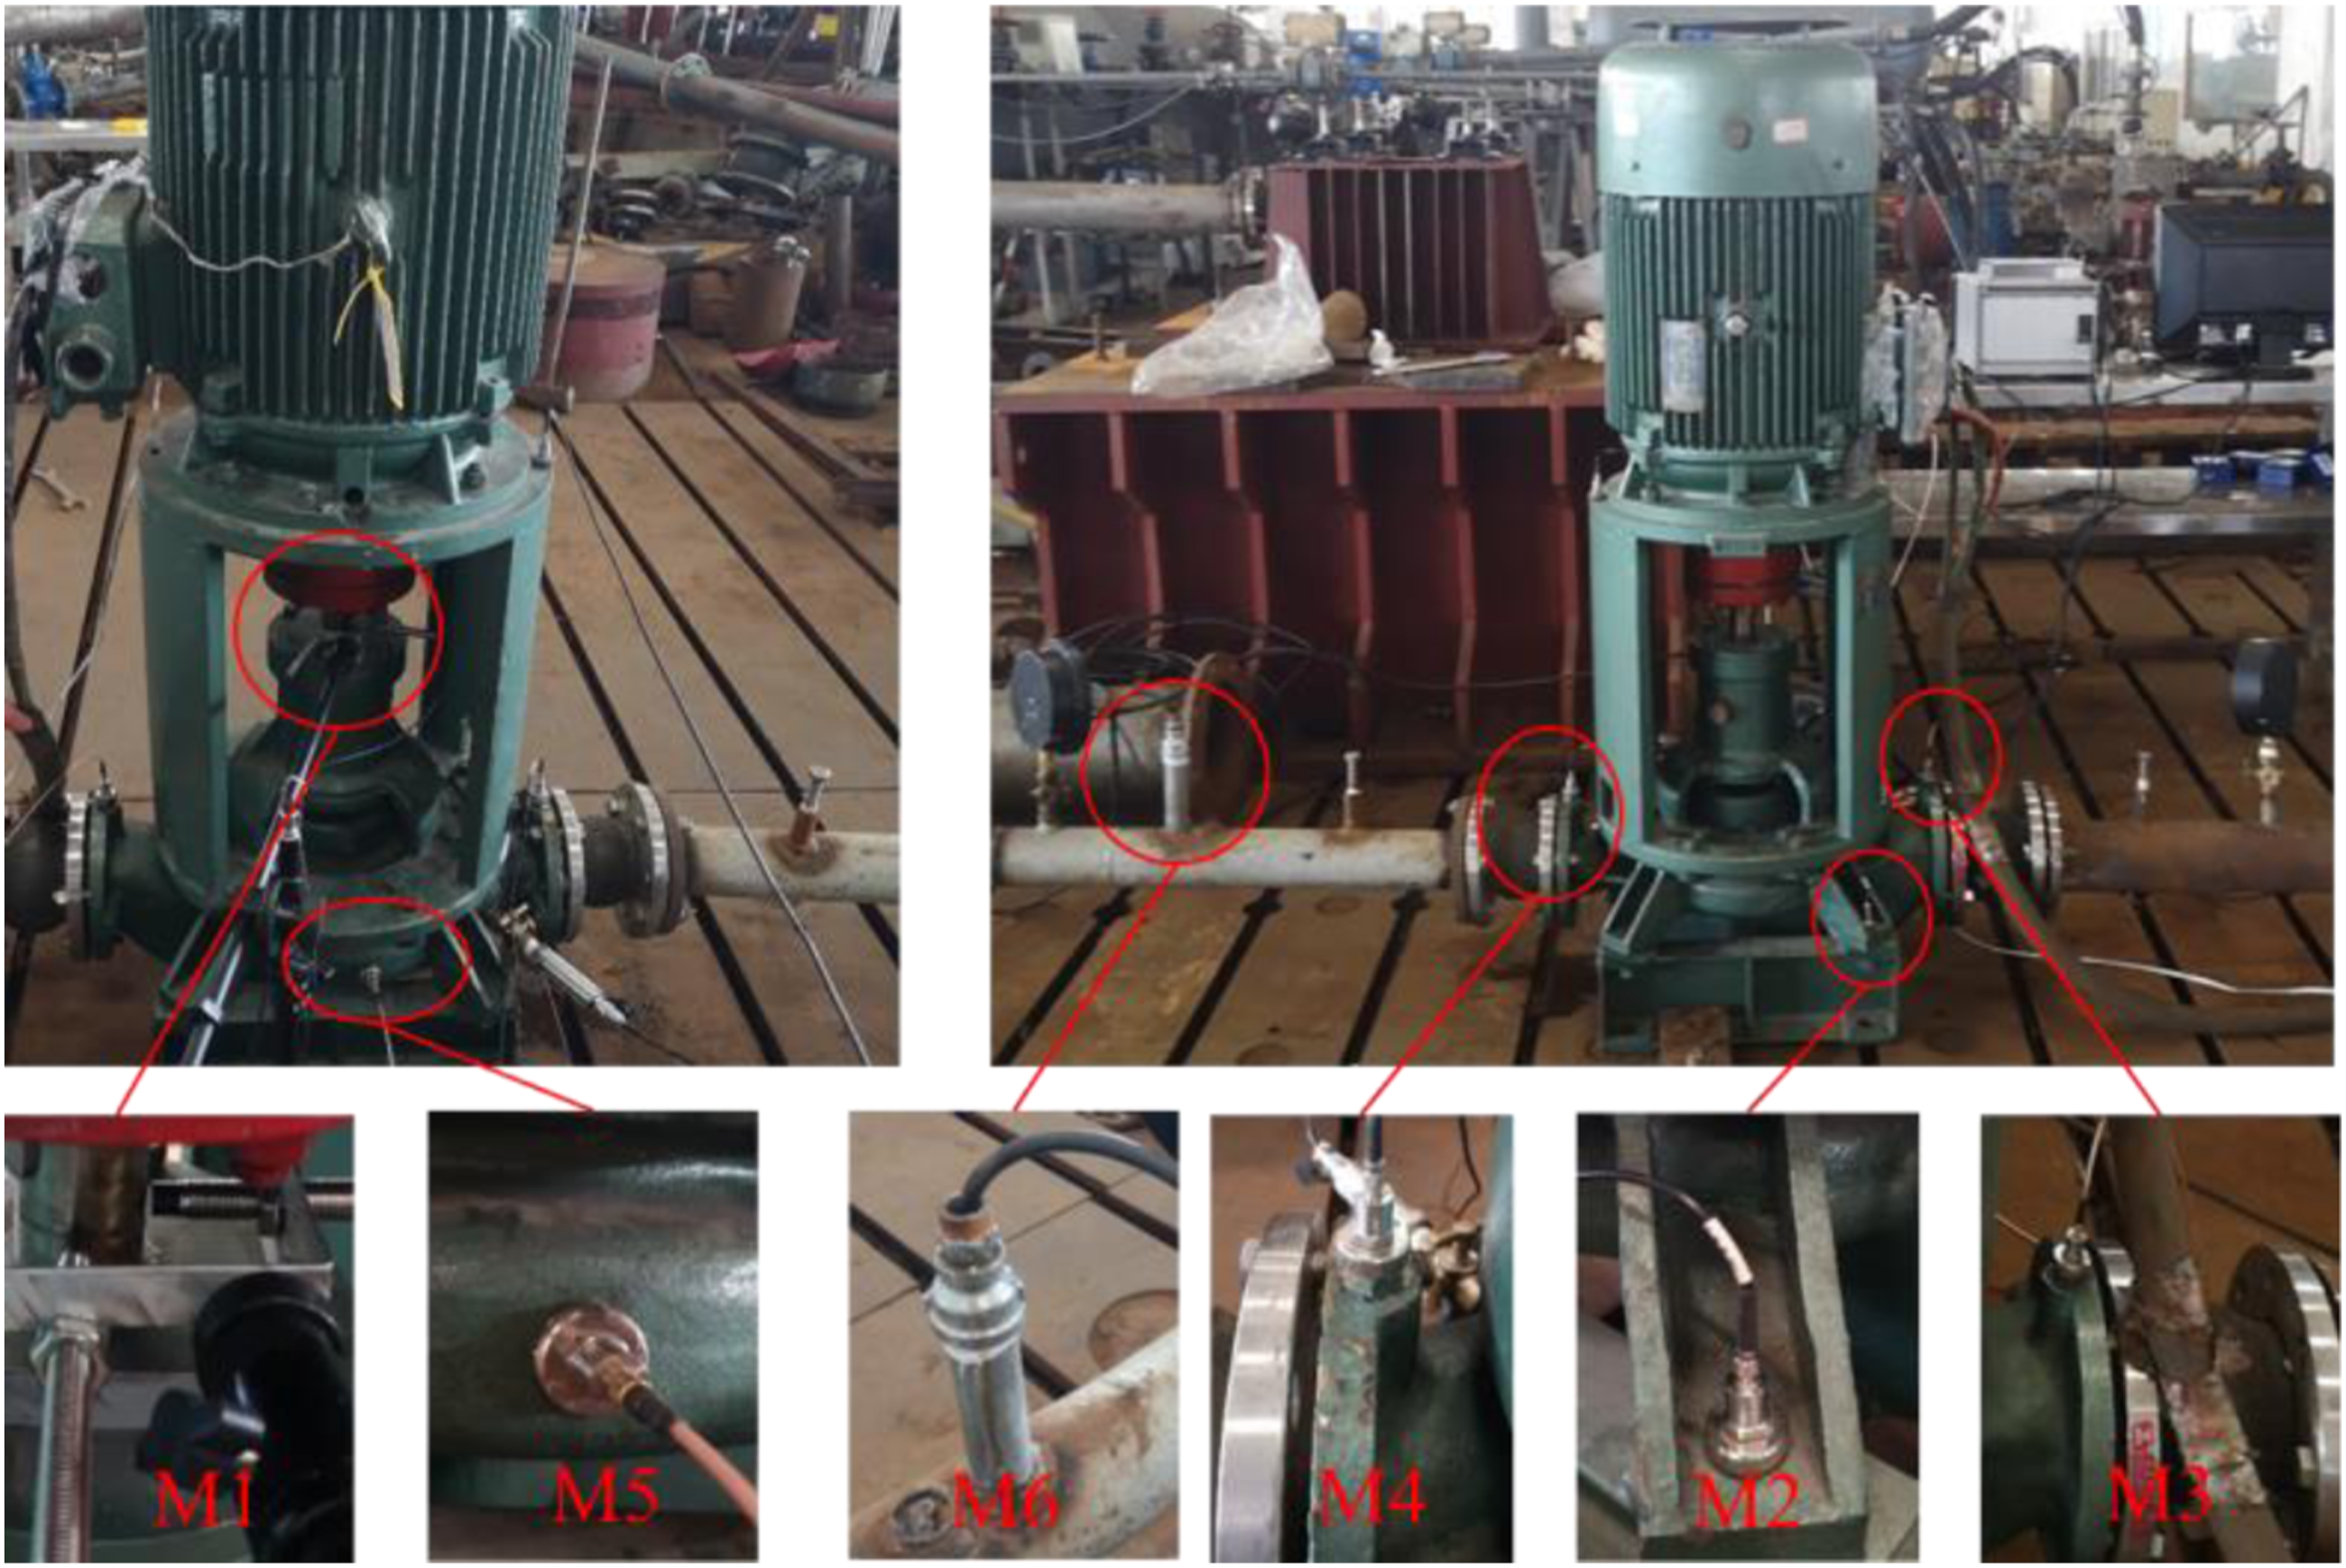
Analysis methods and data processing
Frequency domain analysis
Techniques for vibration and noise analysis
Tone et al. 26 pointed out that the vibration and noise signals of the centrifugal pump are usually obtained by test for fault diagnosis. Al-Obaidi 27 further pointed that the fault diagnosis system through the use of vibration and noise signals consists of six parts in the centrifugal pump. These parts contain pumps, vibration sensor and microphone sensor, data acquisition system, computer, the interface software, and MATLAB code. However, before fault diagnosis, we need to fully grasp the vibration and noise characteristics caused by the fault in order to suit the remedy to the case. Because the collected time-domain signal contains many components, it is often necessary to use frequency domain analysis technology to check the sensitive fault frequency band of the pump. Gülich 28 points that the frequency domain characteristics of vibration and noise are obtained mainly by FFT, Short-time Fourier transform (STFT), the continuous wavelet transform (CWT), the discrete wavelet transform (DWT), discrete wavelet packet analysis (DWPA), and time-frequency-scale domain (TFS). The FFT is the basis of other frequency domain analysis techniques and is widely used in frequency domain analysis of vibration and noise signals.29,30 The STFT, CWT, DWT, DWPA and TFS belong to time-frequency analysis techniques31,32 Time-frequency analysis is to map a one-dimensional time-domain signal to the two-dimensional time-frequency plane, which fully reflects the time-frequency joint characteristics of the non-stationary signal. Birajdar et al. 33 used the FFT technique to well explain the pump imbalance and misalignment faults. He also found the main frequency of the pump under misalignment faults conditions occurs in 1APF and 2APF. Al-Obaidi 34 used the FFT technique to identify the APF, BPF, and their harmonic characteristics of the vibration signal in the centrifugal pump. This shows that the FFT technique can explain the comprehensive misalignment of shafting studied in this paper. Considering the fast and convenient characteristics of FFT, this technique is selected to study the vibration and noise characteristics of the pump under the shaft combined misalignment condition in this paper.
Fast Fourier transform
The Fast Fourier transform (FFT) is an efficient algorithm for calculating discrete Fourier transform. Its function is to convert discrete time-domain signals into discrete spectrum signals.
35
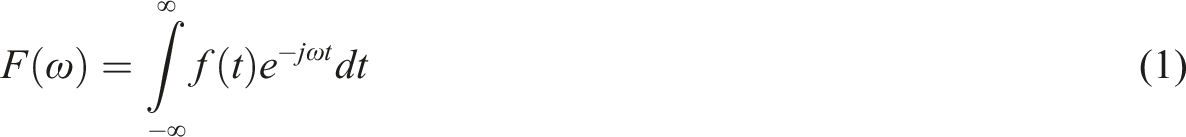
The Fourier transform is a common method to extract various characteristic information from complex signals. It converts the time-domain signal to the frequency domain signal for analysis, so as to observe the changes of frequency and amplitude. From a mathematical point of view, the Fourier transform decomposes any function f(t) into a linear combination of sinusoidal basis functions, and its equation is as below
28
Its inverse of FFT is defined as below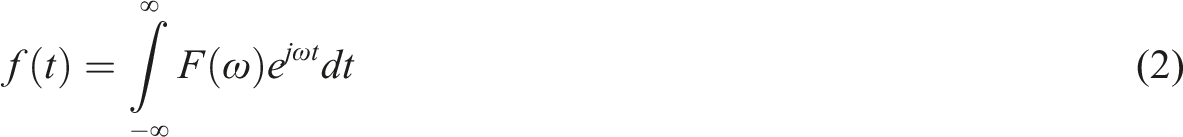
In this paper, the time domain of the vibration and noise is converted into the frequency domain by FFT.
One-Third octave analysis
The One-Third octave analysis is an important spectrum analysis method. Because it can directly display the energy distribution of broadband signal at each frequency, it is widely used in the fields of noise measurement, acoustic analysis, and random vibration analysis. 36 The One-Third octave spectrum analysis method expands the energy of vibration and noise signals along the frequency domain axis. It is convenient to observe the macroscopic energy distribution of vibration and sound signals. Moreover, it also eliminates the influence of small changes in signal frequency or phase information on the observation results. In the rotating machinery, this method is often used for vibration and noise spectrum analysis.37,38 Dong et al. 23 successfully identifies the Cavitation Fault of the centrifugal pump by using the octave spectrum analysis method. Therefore, it is feasible to use this method to analyze the vibration and noise spectrum of the marine pump under shaft combined misalignment conditions.
The One-Third octave spectrum contains a series of frequency points and the power spectrum values of the signals in the frequency band near these frequency points. These frequency points are called the center frequency fc. According to the recommendations of the International Electrotechnical Commission (IEC), fc is defined as follows:
The relationship between the upper limit frequency fu, lower limit frequency fd, and center frequency fc of the One-Third octave band is as follows:
The One-Third octave bandwidth is
Waite 39 proposed an octave analysis method based on multi-sampling rate FFT to improve the analysis accuracy. The theoretical basis of this method is the Plancherel theorem, 40 which indicates that the energy contained in a signal is equal to the sum of the energy of each component of the signal in the complete orthogonal function set. Based on the above method, the One-Third octave spectrum of vibration and noise is obtained by programming with Python.
Analysis method of pump energy performance
The energy characteristics of pumps are often measured by head H, efficiency η and shaft power P. Their calculation formulas are as follows.
In this test, the head H of marine pump is calculated with the value of inlet and outlet pressure sensor, and the calculation formula is as follows
41
:


According to the Chinese standard “Centrifugal, mixed flow and axial pumps-Code for hydraulic performance tests-Precision class (GB/T 18149-2000),” the shaft power is measured by Electrometric method. In the test, the input power of the motor is measured. Then, the efficiency value under different input power is found out according to the calibrated load characteristic curve of the motor. The shaft power of the pump (output power of the motor) is obtained according to the following formula
The calculation formula of pump efficiency η is as follows
42
:
Evaluation methods of vibration and noise
Vibration velocity level (VL) uses the valid velocity value to measure the average vibration energy. It visually compares the change of vibration level at each measurement point under the stable and shaft combined misalignment conditions.
43
Its calculation formula is as follows:
Sound pressure level (SPL) reflects the strong and weak characteristics of sound pressure pulsation. It also uses the valid value of sound pressure to measure the average energy size of the noise.
44
Its calculation formula is as follows:
Data processing
In the experiment, the vibration and noise signal acquisition are susceptible to external and piping systems and other self-excited loads. It results in an acquired signal with both smooth white noise and random noise that causes many spikes or abrupt changes in the waveform, which affects the analysis of vibration and noise characteristic frequencies. Therefore, it is necessary to filter the acquired signal to improve the signal-to-noise ratio. The kalman filter is a recursive form of state estimation method that uses the minimum mean square error as the estimation criterion to obtain the optimal value by correcting the predicted value of the system based on the current observations. 45
There are five equations in the recursive calculation process of Kalman filter algorithm, 46 as follows.
Predictive state equation
Prediction mean square error equation
Kalman gain calculation equation
State estimation equation
Mean square error estimation equation
In this paper, we take the vibration displacement signal in the Y-direction of pump M5 at 1.0Qd under shaft alignment conditions as an example and compare and analyze the effect of time domain and frequency domain waveforms before and after noise reduction. Figure 5 shows the waveforms before and after filtering for the vibration displacement signal of M5, where the horizontal coordinate represents the time, while the vertical coordinate represents the vibration displacement. The waveform of the original vibration displacement signal contains many spurious components, and there is a certain degree of clipping and double-peak phenomenon at the trough. After noise reduction, the waveform becomes smoother, and the overall spurious component reduces significantly. The error after filtering is smaller than that before. Waveform of vibration signal before and after filtering.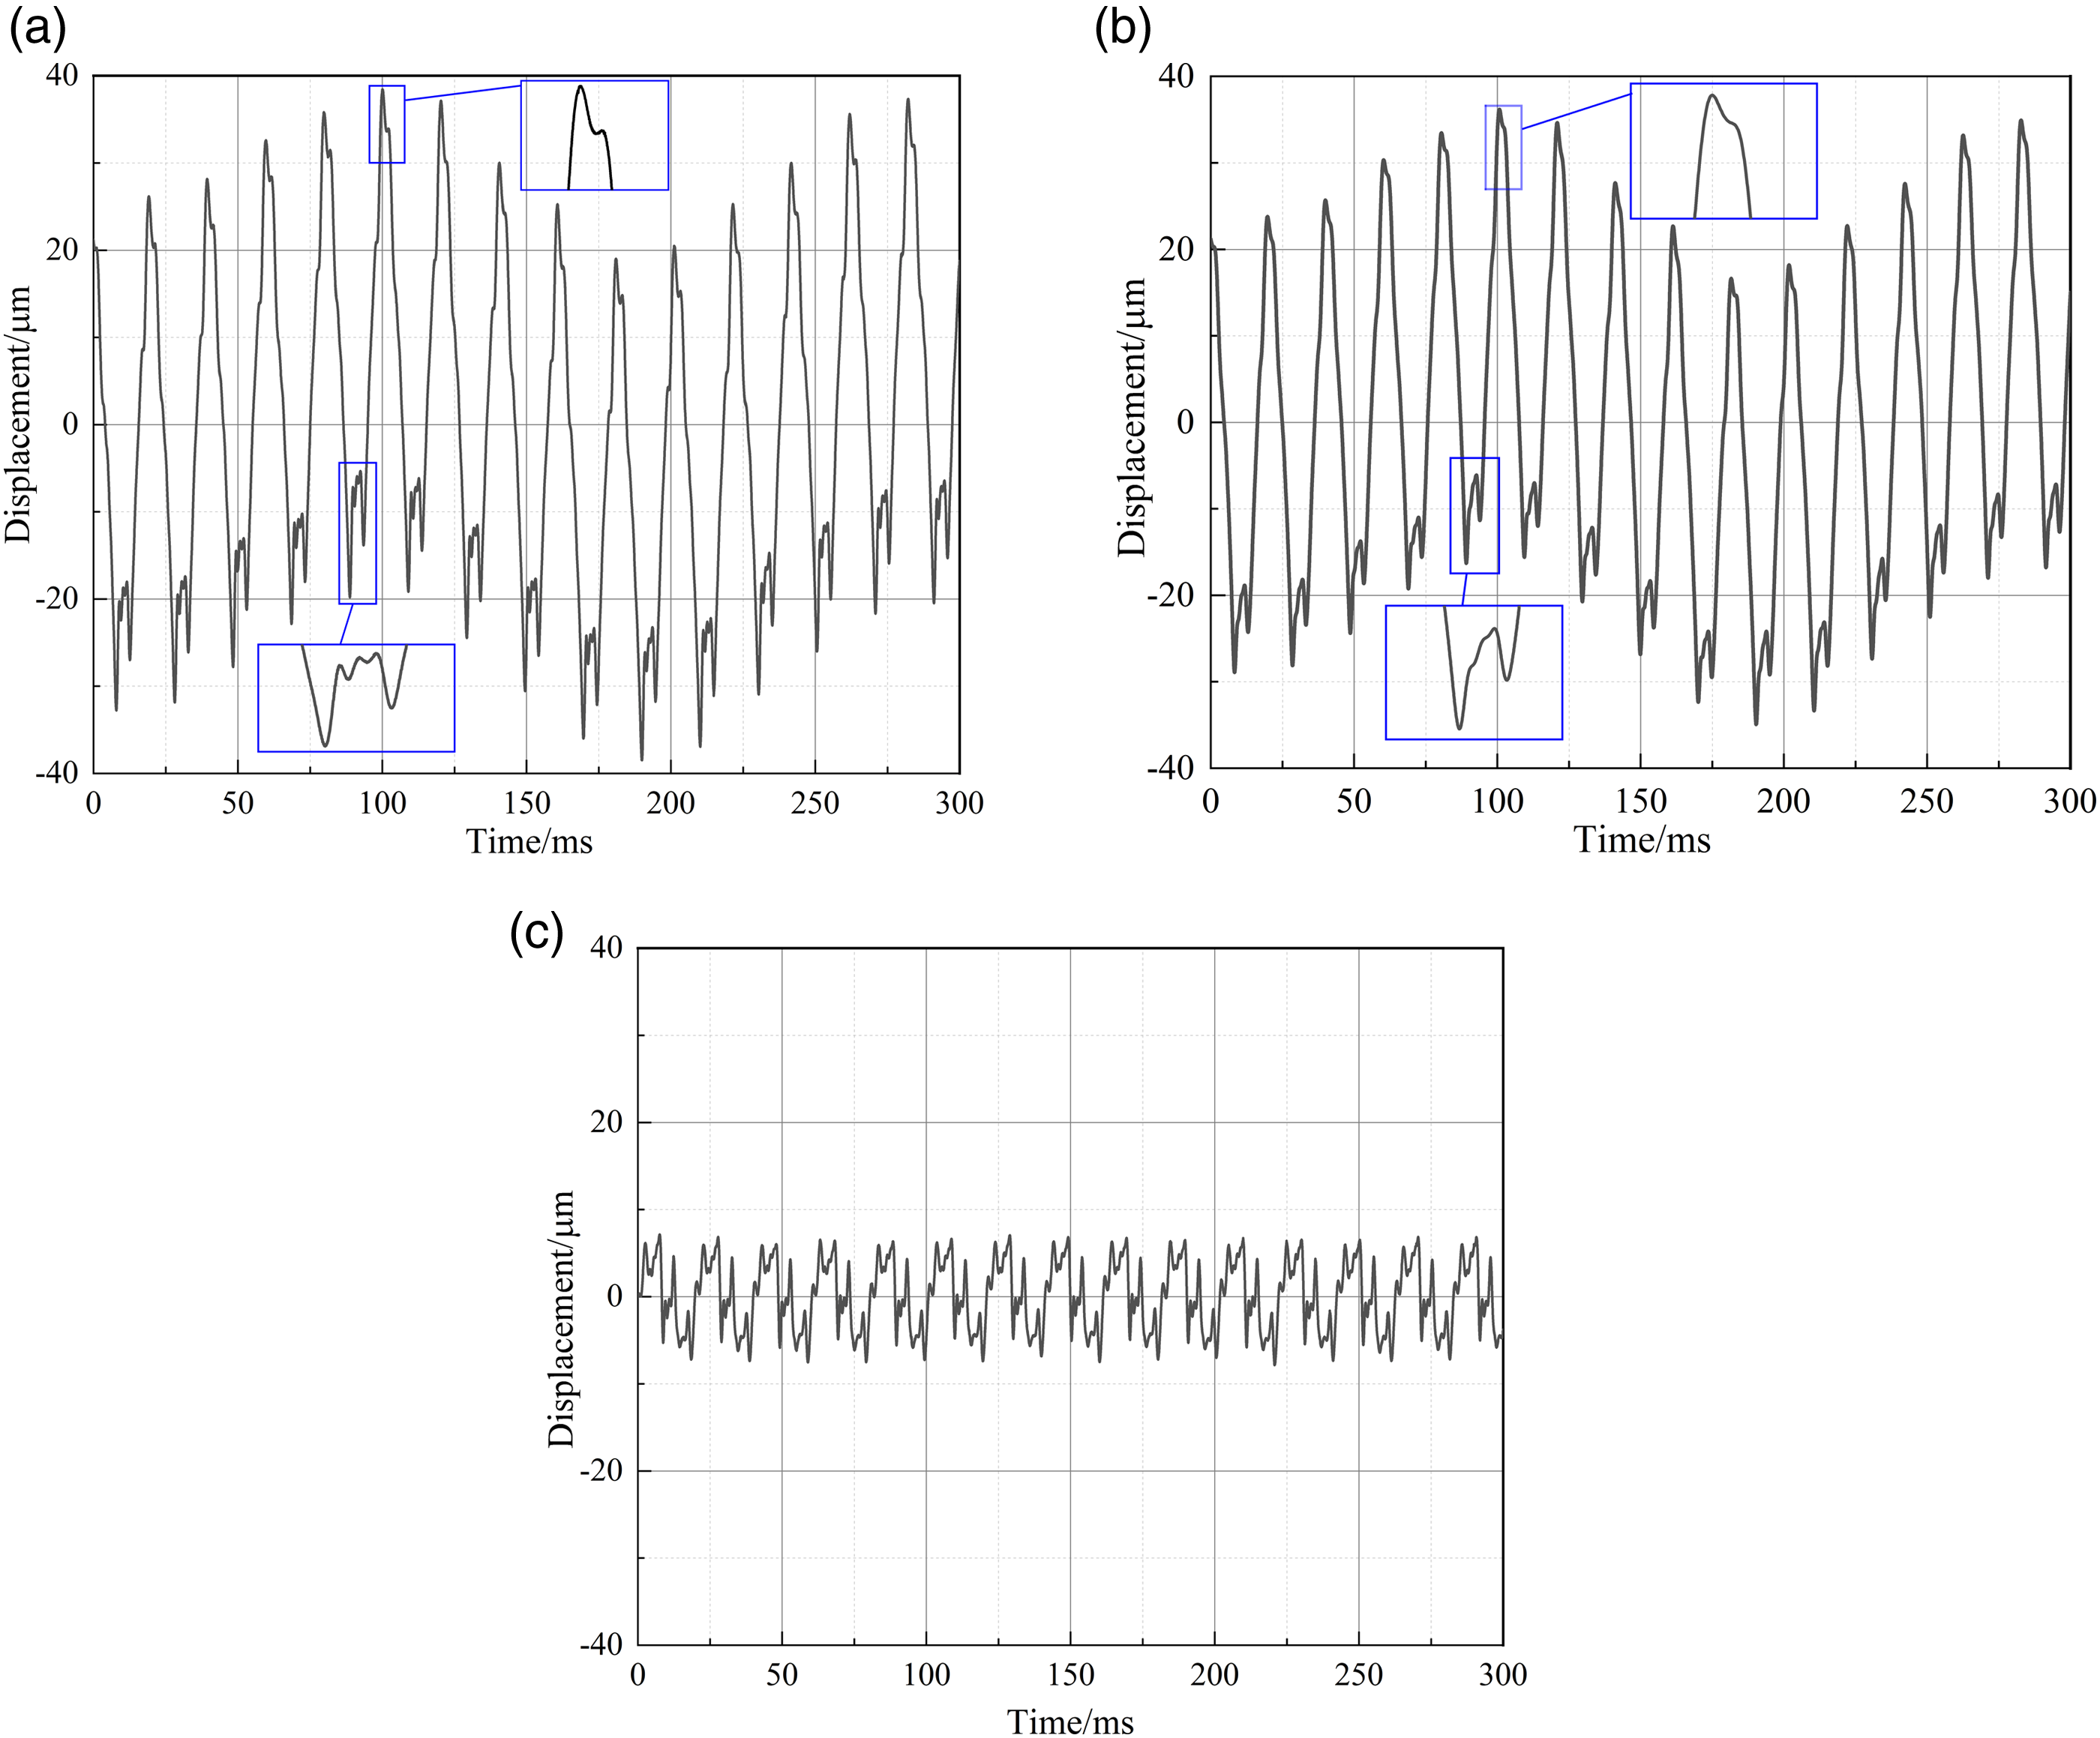
The Uncertainty Analysis Measurement Procedure
There is no doubt that uncertainty analysis is the key link in all testing analyses, which directly determines the availability of test results. In the current error analysis, the test error is usually divided into systematic error and random error.
41
The systematic error Es mainly refers to the deviation of measuring instruments, generally including the error of each sensor and the error of acquisition system error. The random error Er mainly refers to the error caused by random factors in the test process, such as temperature, and operation factors. According to the regulations of the International Electrotechnical Commission, Er is obtained by using t distribution, and the formula is as follows:

The test error E is defined as below
In this study, the test uncertainty includes energy performance test uncertainty, vibration test uncertainty, and noise test uncertainty. The uncertainty of the energy performance test generally selects the efficiency uncertainty under design conditions as the measurement index. 47 According to the literature 44, efficiency uncertainty includes the head error, flow error, inlet pressure sensor error, outlet pressure sensor error, and power error. For the sake of unity, the vibration uncertainty adopts the overall vibration speed level (OAVL) under the design condition as the measurement index, and the noise uncertainty adopts the overall sound pressure level (OASPL) under the design condition as the measurement index. A total of 9 tests have been carried out under the design flow, so t is taken as 2.2642. According to the accuracy of the test instrument and the above formula, the uncertainty of efficiency is ±0.63%, the uncertainty of vibration is ±1.7%, and the uncertainty of noise is ±1.3%.
Results and discussion
Energy performance
Figure 6 shows the energy performance curves of the marine centrifugal pump. It can be seen from the figure that with the increase of flow rate, the pump head increases first and then decreases. There is a hump on the pump head curve, and the hump value is around 0.3Qd. The maximum head of the pump is 73.20 m. This is mainly due to the unstable flow of low specific speed centrifugal pump under small flow rate, resulting in increased flow loss and hump phenomenon.
48
In other words, the head curve of low specific speed centrifugal pump is prone to hump under small flow. Compared with the hump value of the head curve of the centrifugal pump designed in literature 45 (appearing at 0.6Qd), the hydraulic performance of the pump designed in this paper is better under the small flow rate. The pump efficiency increases first and then decreases with the increase of flow rate. The maximum efficiency of the pump is under 1.2Qd, and the efficiency of the pump is 69.58%. This shows that the maximum efficiency point of the pump deviates from the large flow rate, which seems to be contrary to the law of the maximum efficiency point of the centrifugal pump under the design flow rate in the traditional and traditional sense. It is because that the low specific speed pumps are often designed with increased flow rates to avoid humping the pump performance curve, which results in a shift of the maximum efficiency point to 1.2Qd.49,50 In addition, the error of the head, efficiency, and shaft power is largest under small flow, and it is the smallest at the maximum efficiency point. The maximum error of the head, efficiency, and shaft power is 3.12%, 3.81%, and 2.21%, respectively, which occur at 0.17Qd. The minimum error of the head, efficiency, and shaft power is 0.60%, 0.51%, and 0.32%, respectively, which occur at 1.2Qd. Energy performance of the pump.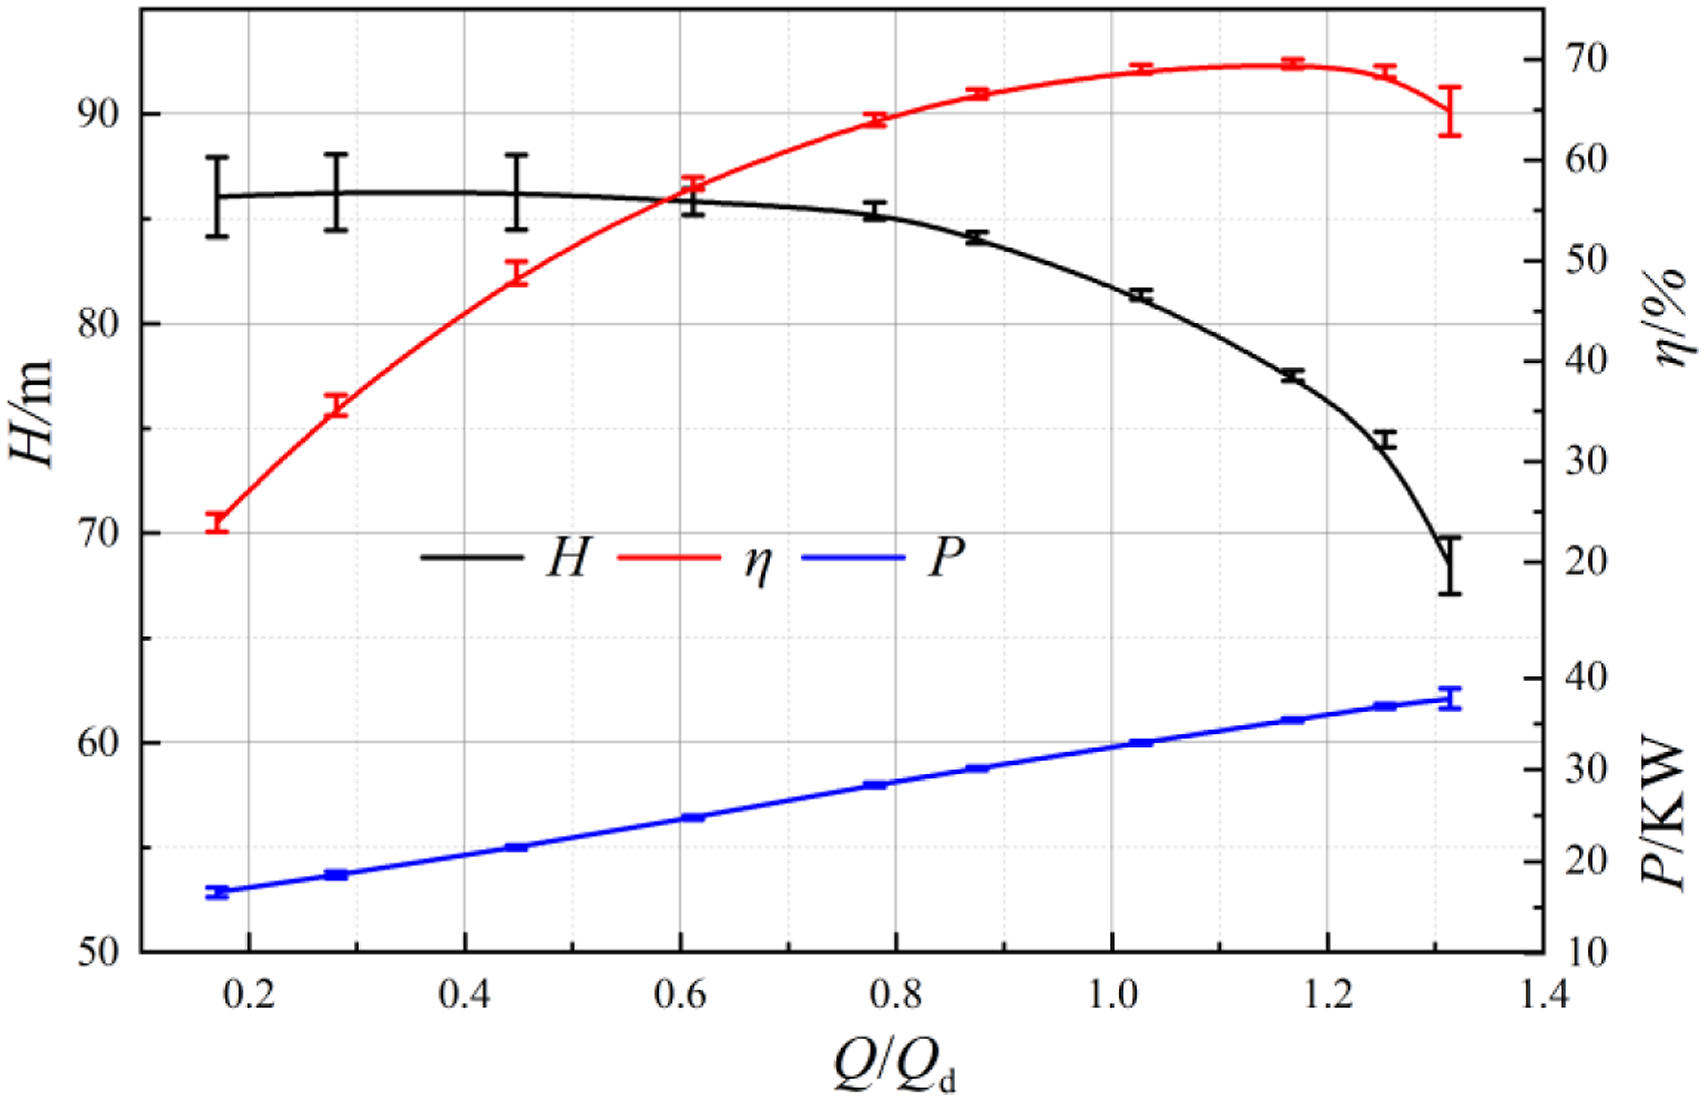
Vibration characteristics and axis orbit at M1
Vibration characteristics
The concepts of axial passing frequency (APF) and blade passing frequency (BPF) are often involved in vibration analysis, and the calculation formula is as follow
12


Figure 7 compares the vibration spectrums of M1 under scheme A and scheme B. Under scheme A, the primary frequency of vibration in the X and Y directions of M1 is 1APF, and the harmonic frequencies are 2APF, 3APF, and 4APF. The amplitude of M1 vibration gradually decreases with the increase of flow rates. The amplitude of main frequency 1APF in X and Y directions decreases by 19.37% and 20.68% among 0.6Qd and 1.2Qd. It indicates that the vibration of the pump shaft system is most intense at low flow rates and weakest at the flow of maximum efficiency. This law is consistent with the law in document 14, which is caused by flow instability under eccentric working conditions. Vibration spectrums at M1.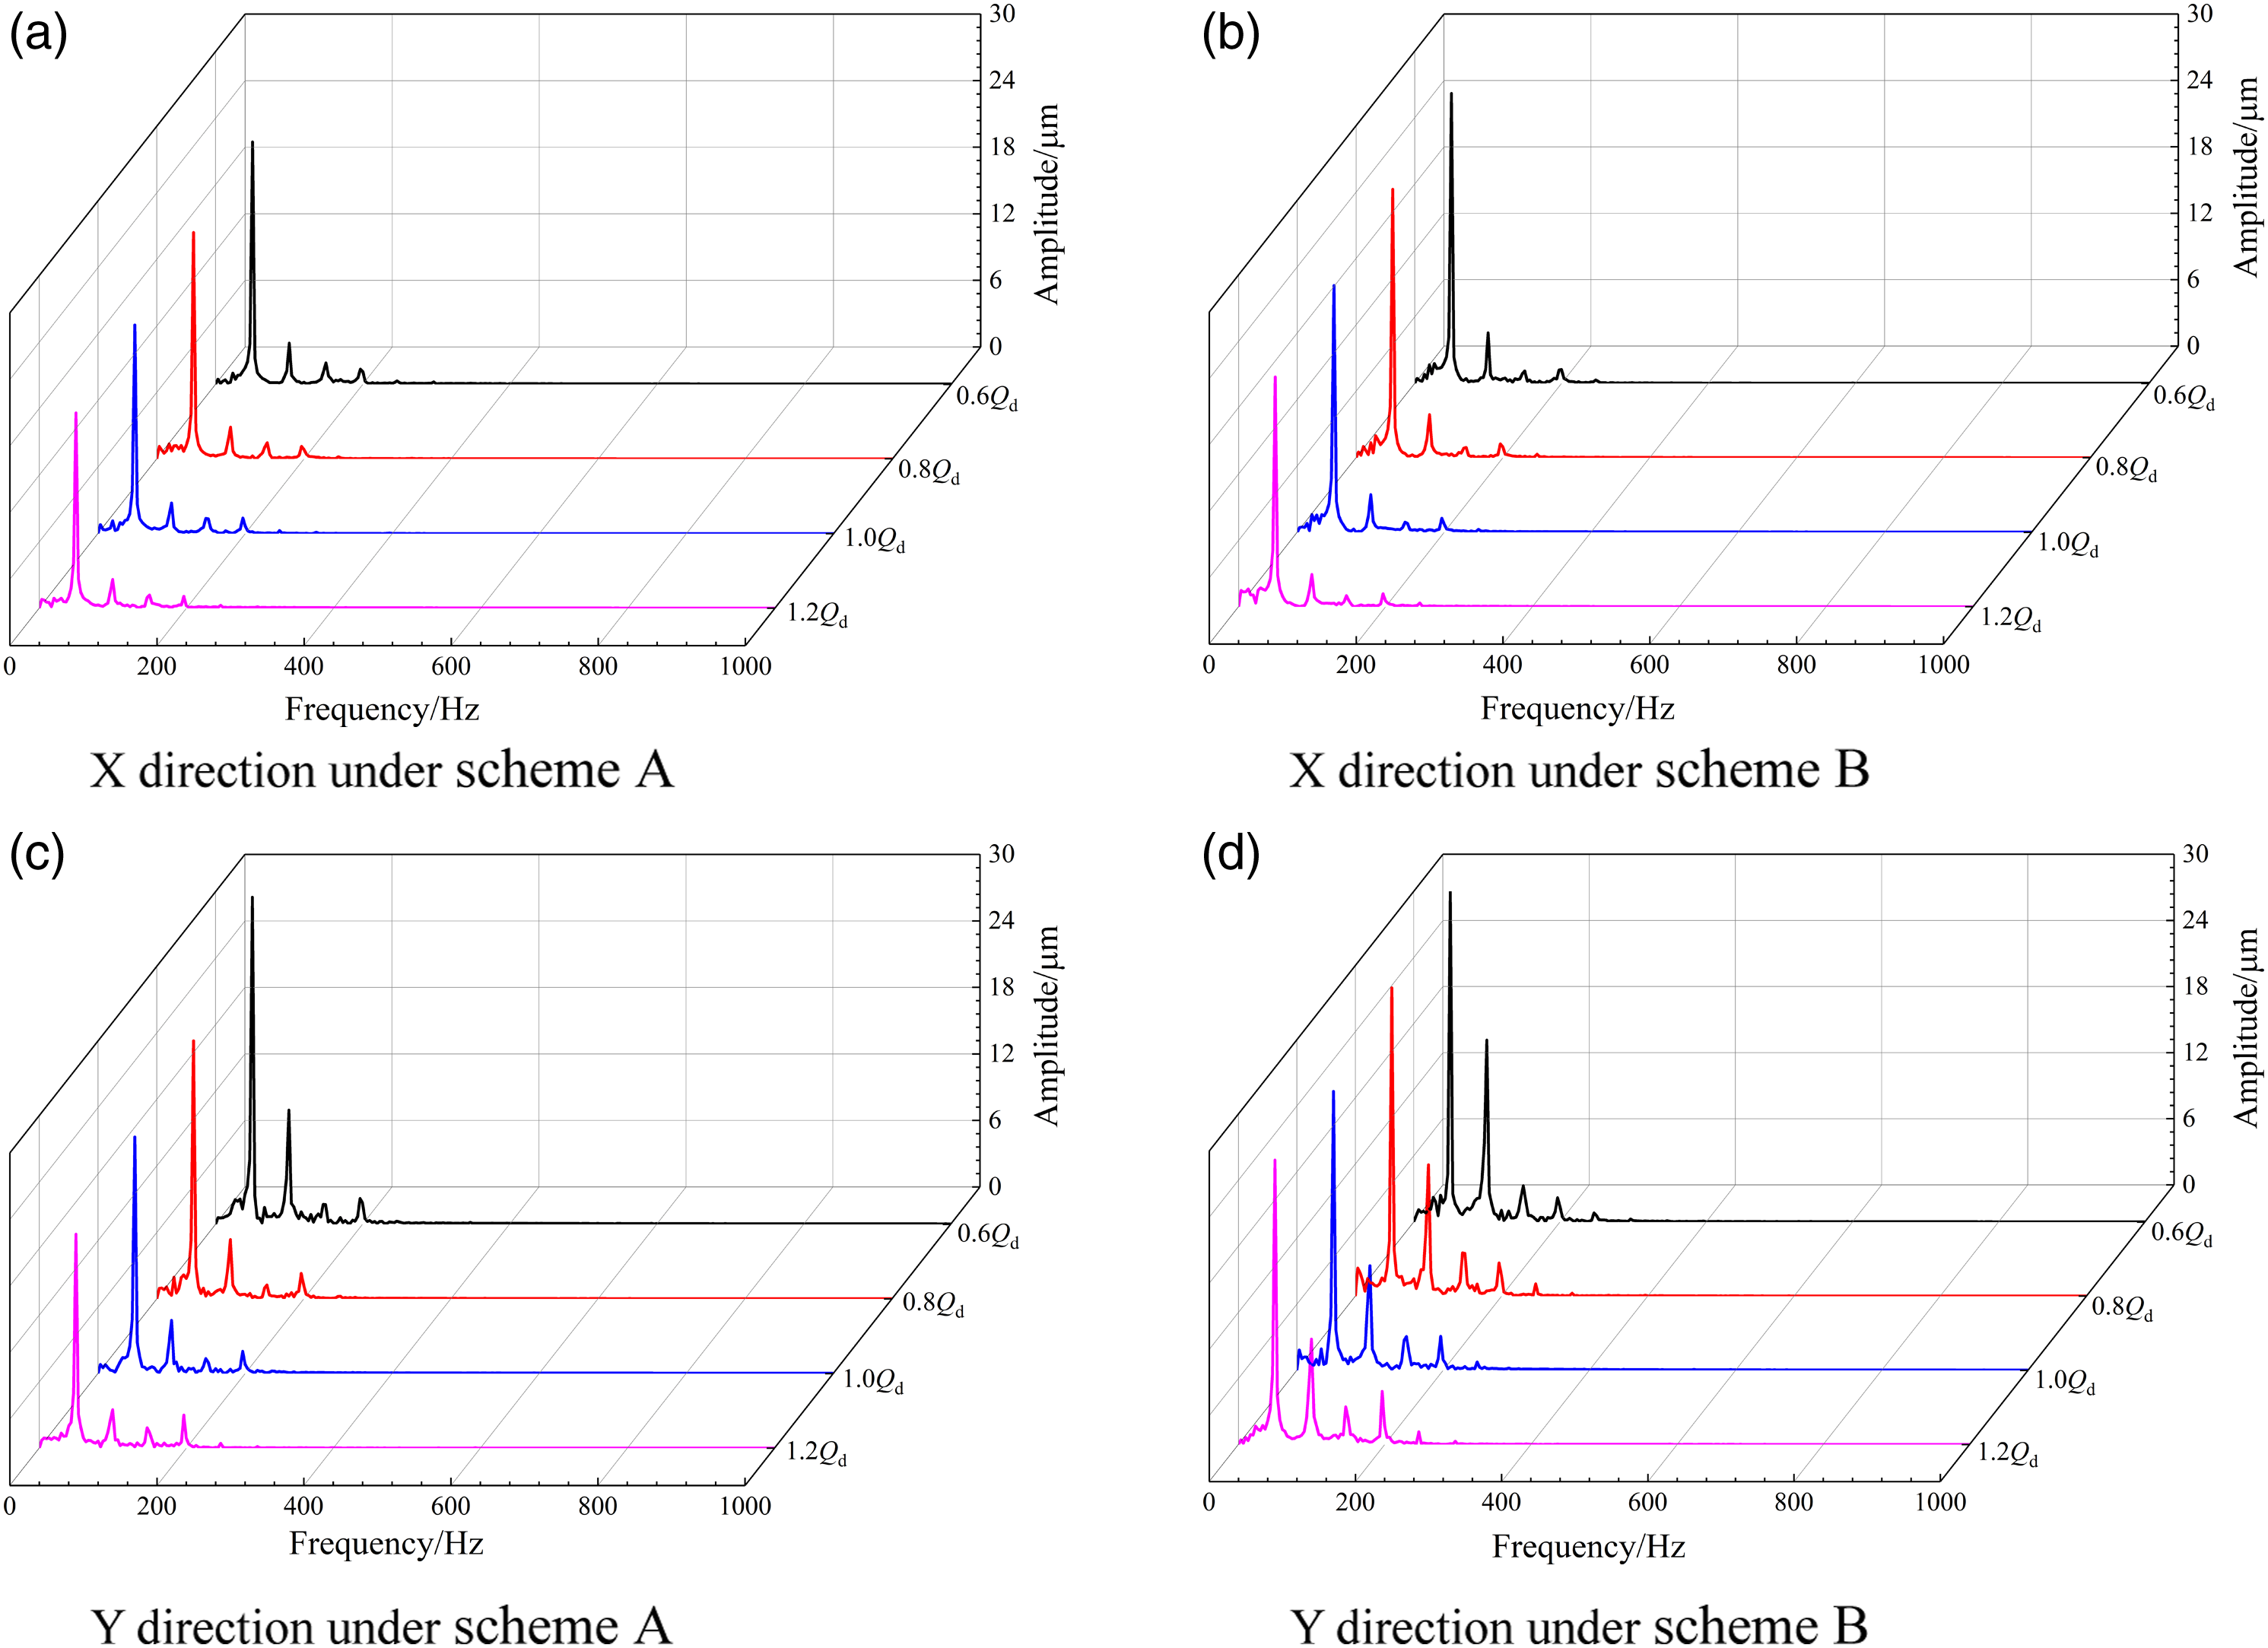
Under scheme B, the primary frequency of vibration in the X and Y directions of M1 is 1APF, and the harmonic frequencies are 2APF, 3APF, and 4APF. As the flow rate increases, the amplitude of the shaft system vibration gradually decreases, the primary frequency 1APF amplitude in X and Y directions decreases by 34.57% and 19.98%, and the 2APF amplitude decreases by 66.30% and 41.98%. It is also because the pump tends to vibrate excessively at off-duty operations. From the frequency domain characteristics of shafting, the shafting vibration characteristics under this scheme accord with the comprehensive misalignment characteristics of the shaft.7-11
Compared with scheme A, the shafting vibration under scheme B has the following characteristics. The 1APF and 2APF amplitudes of the shaft system increase significantly under scheme B. As the flow rate increases, the amplitudes of 1APF in the X directions increase by 35.06%, 14.07%, 13.47%, and 9.60%, respectively, and the amplitudes of 1APF in the Y directions increase by 14.57%, 15.28%, 13.49%, and 24.24%, respectively. Moreover, as the flow rate increases, the amplitudes of 2APF in the X directions increase by 2.61 times, 2.07 times, 1.79 times, and 2.28 times, respectively, the amplitudes of 2APF in the Y directions increase by 1.77 times, 0.88 times, 0.74 times, and 0.34 times, respectively. It can be found that the vibration amplitude of 2APF increases greatly at M1, which indicates that the shaft combined misalignment is a major factor affecting the shafting vibration.
Axis orbit
Figure 8 shows rotor axis orbit under scheme A. Under different flow rates, the rotor axis orbit presents a clockwise changing ellipse, which is opposite to the direction of rotor rotation. These results indicate that there is a dynamic imbalance fault of the rotor.
12
In addition, as the flow increases, the length of the long and short axes of the ellipse presented by the rotor axis orbit gradually decreases and reaches the minimum at the highest efficiency point. It indicates that the marine pump operation at the small flow point increases the vibration of the shaft system. It is consistent with the hydraulic machinery operating under small conditions prone to rotor system vibration instability empirical judgment.
50
Rotor axis orbit under scheme A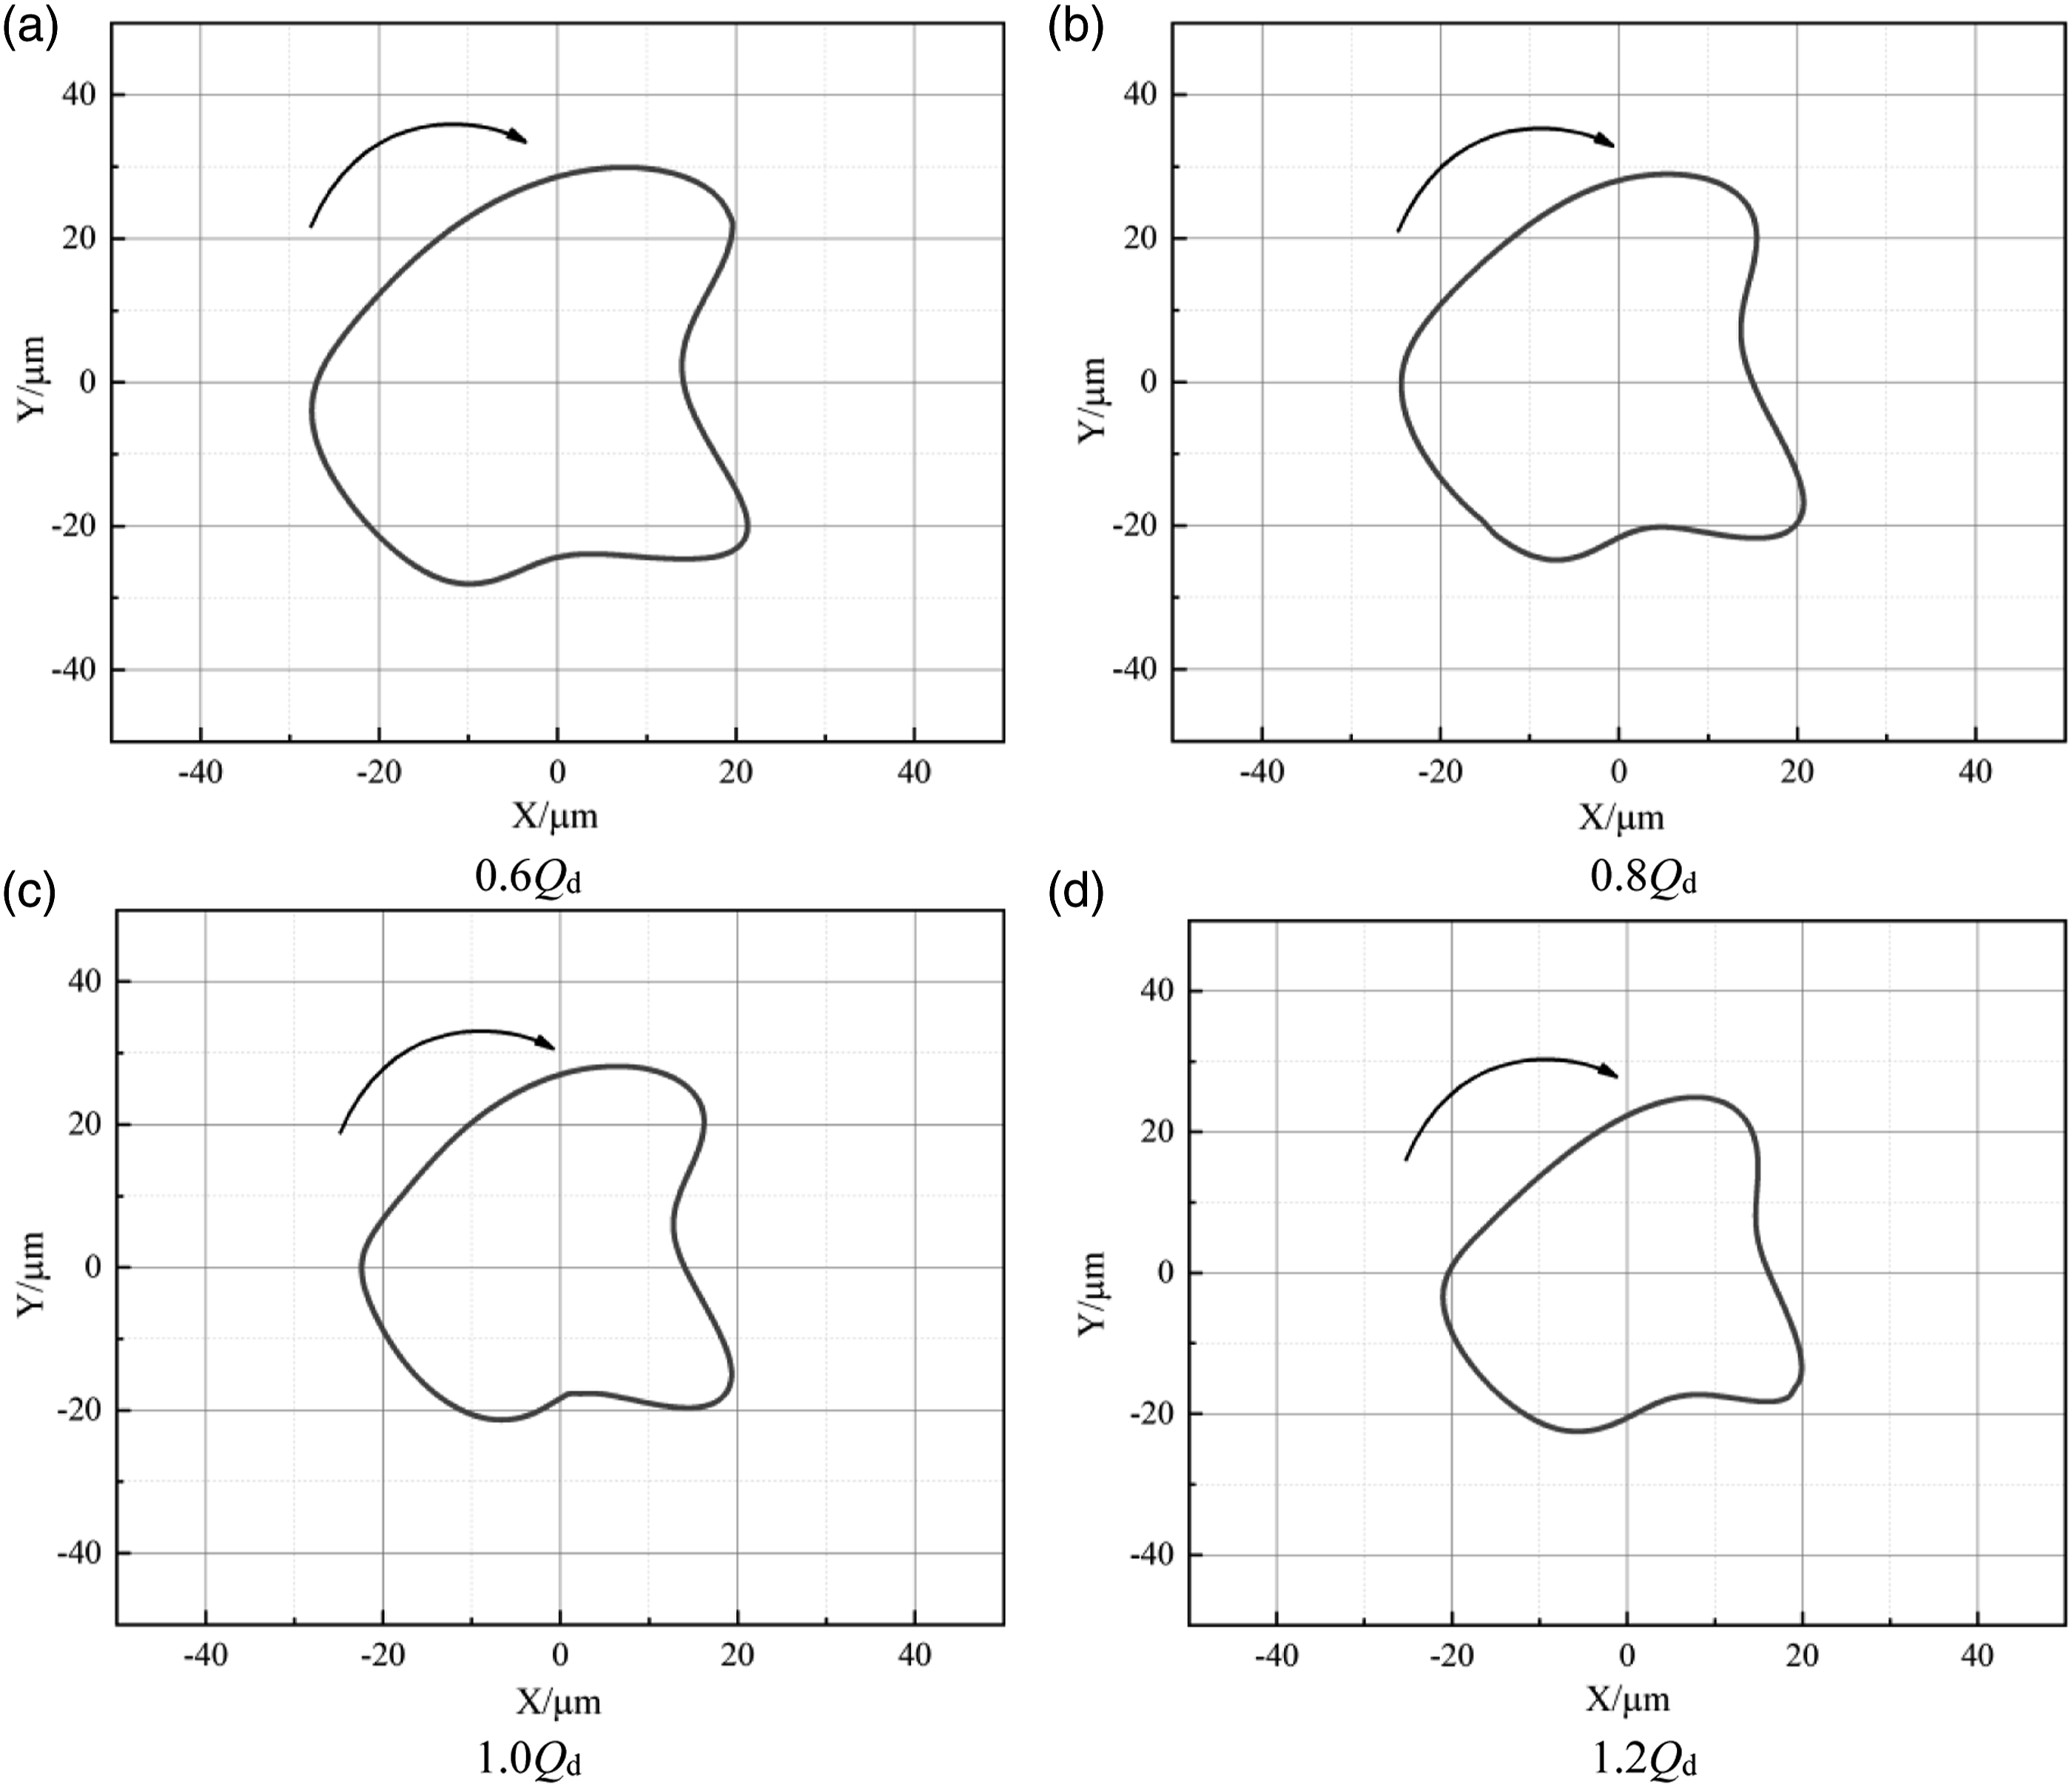
Figure 9 shows axis orbit diagram of the pump rotor under shaft combined misalignment conditions. It can be seen from the figure that the rotor axis orbit presents a clockwise variation of “8” shape at different flow rates. It is in line with the shape of the rotor axis orbit of rotating machinery under shaft misalignment conditions.8-11 Moreover, as the flow rate decreases, the shape of an “8” of the rotor axis orbit becomes progressively flatter. It is mainly because the internal of the pump with low flow rates will appear backflow, secondary flow and a variety of scale vortex.51,52,53 These unstable flows caused by high-frequency excitation force will induce the pump frequency vibration deterioration. These phenomena are consistent with the law of axis trajectory caused by shaft dislocation of the mixed-flow pump.
14
Rotor axis orbit under scheme B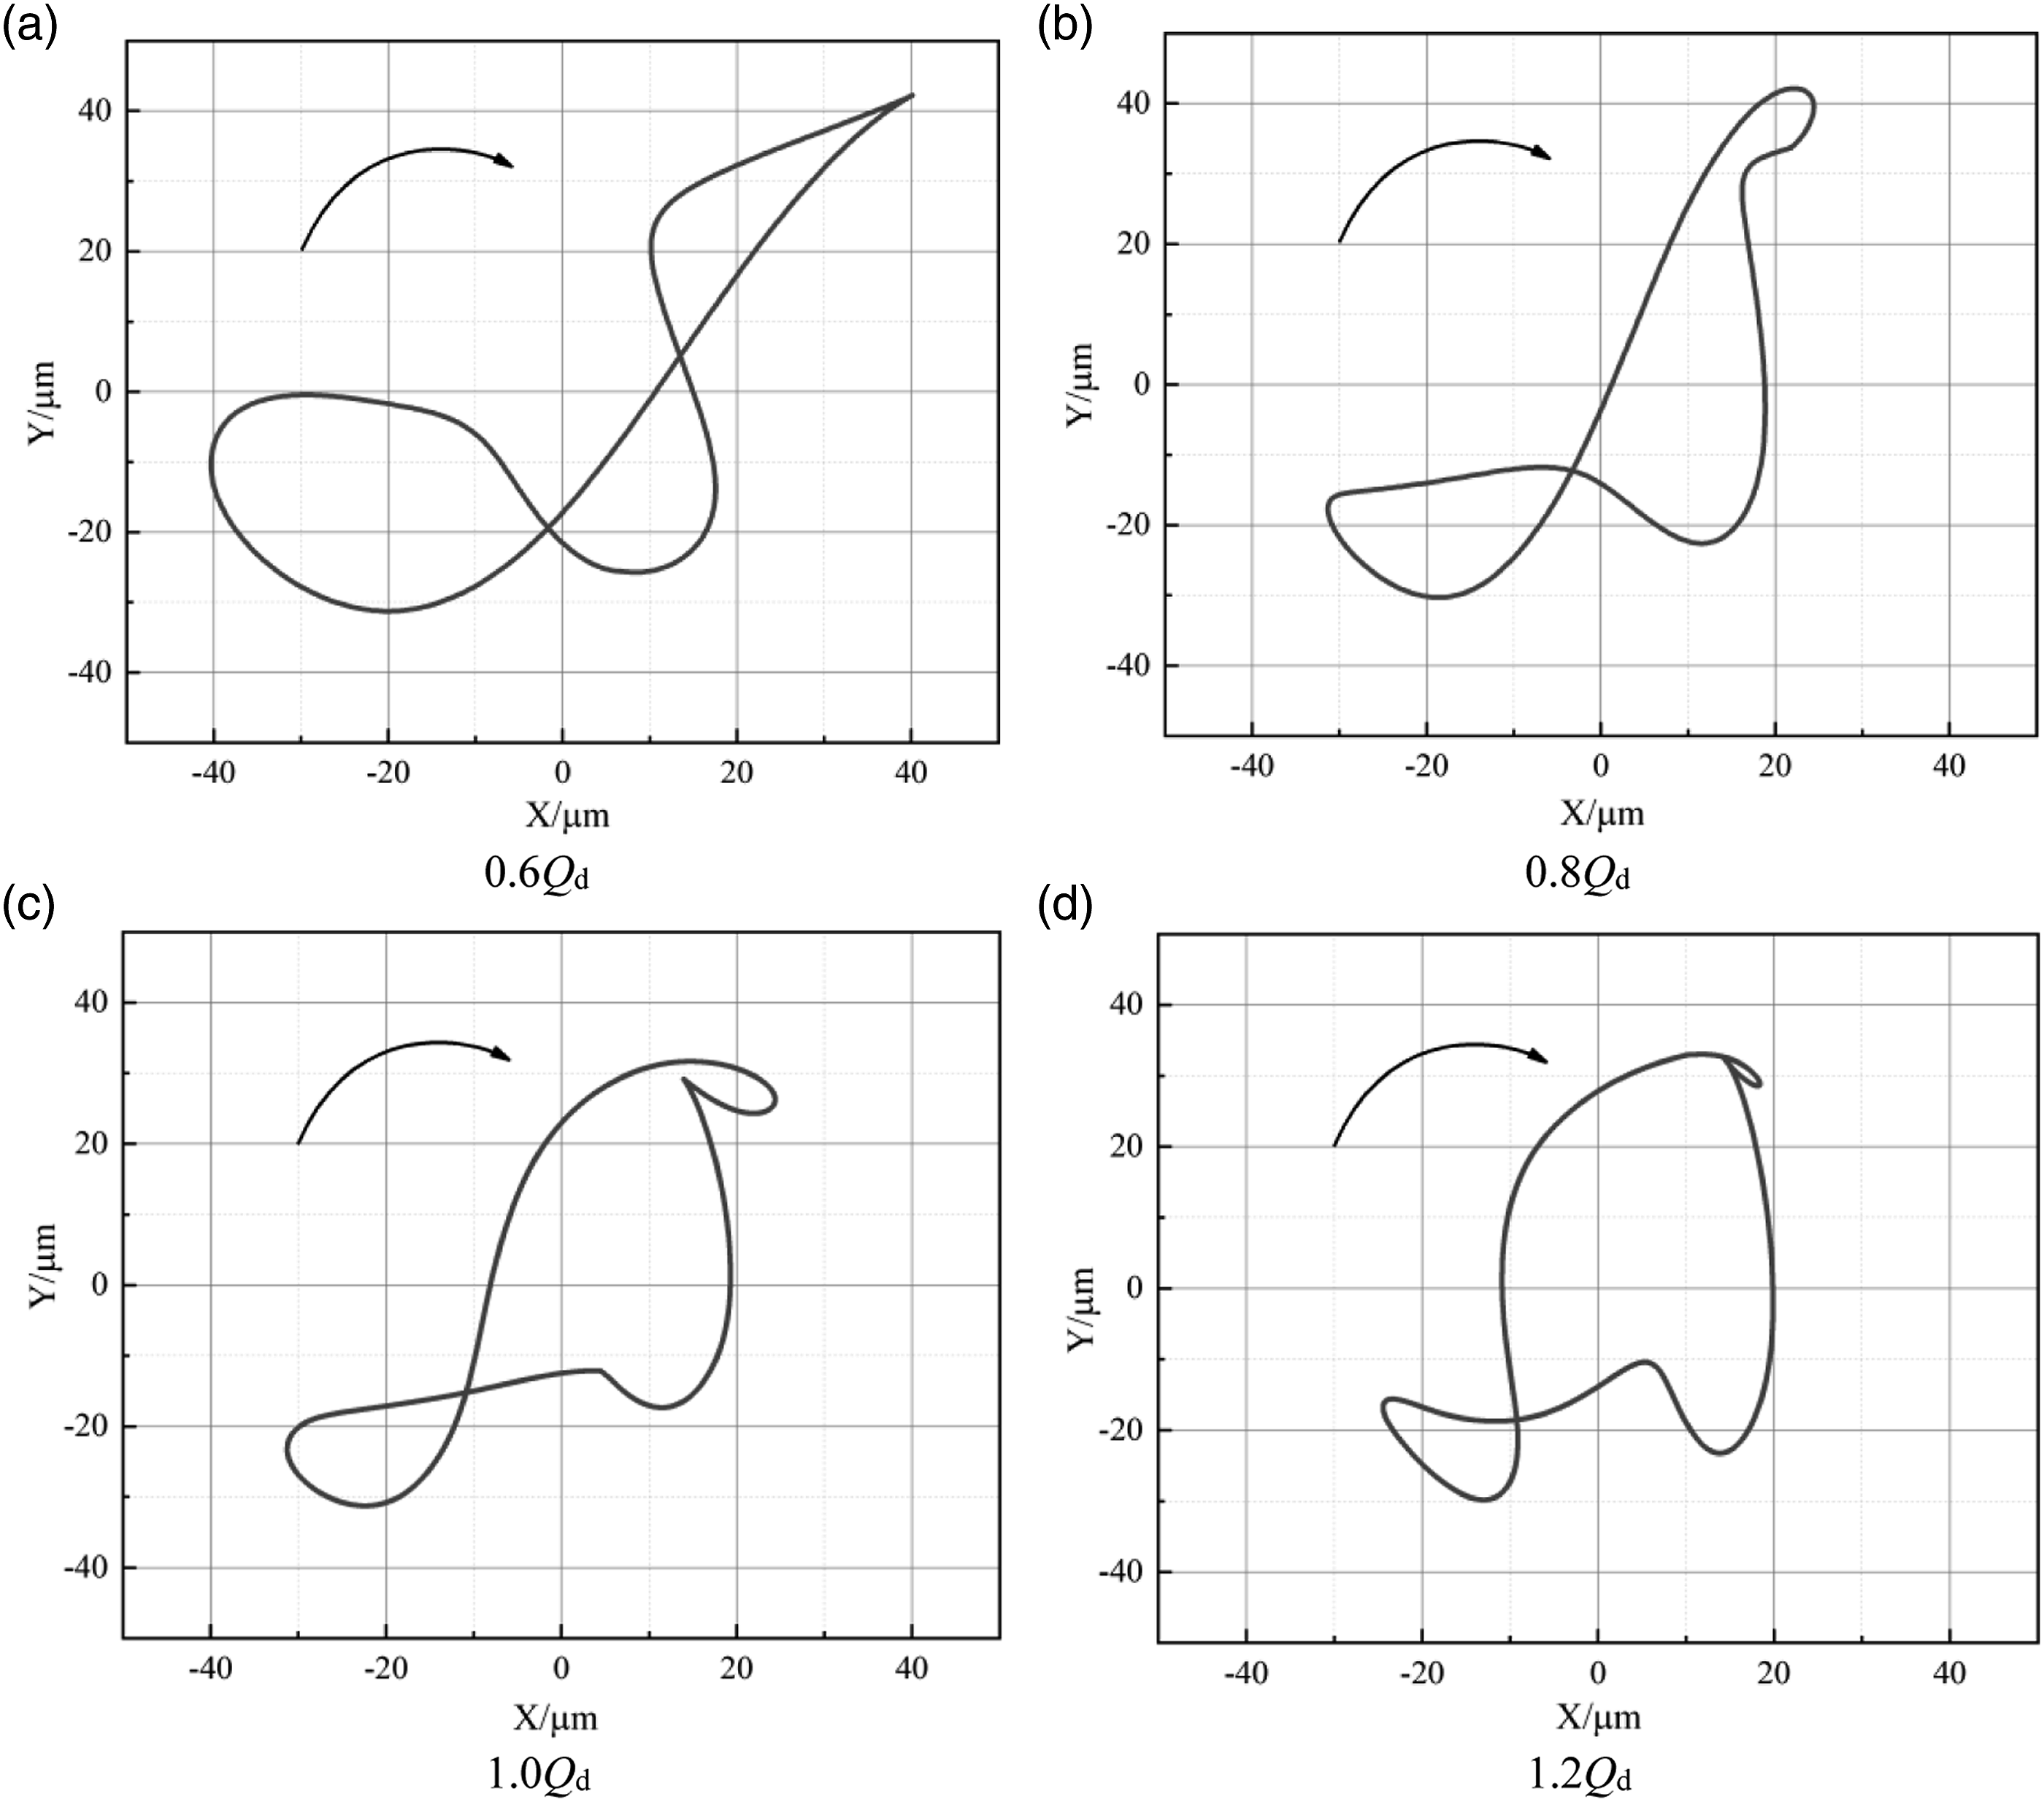
Compared with scheme A, the rotor axis orbit under scheme B has the following characteristics. The shape of the rotor axis orbit changes from ellipse to “8,” and the long axis of the rotor axis orbit becomes larger. This new discovery shows that the shaft combined misalignment intensifies the vibration of the pump shaft system. It is easy to cause damage to the shaft system. This phenomenon needs special attention in the actual operation of the pump.
Vibration characteristics at M2-M5
Vibration amplitude spectrums
Figure 10 compares the vibration spectrums of M2-M5 under scheme A and scheme B. Under scheme A, the characteristic frequencies of M2-M5 are 1APF, 1BPF, and its multiples of 1APF, where 1APF and 1BPF are the dominant components. As the flow rate increases, the amplitude of 1APF at M2-M5 gradually increases. The amplitudes of M2-M5 increase by 61.85%, 74.53%, 69.92%, and 55.31%, respectively. However, the amplitude of 1APF at M2-M5 gradually reduces with the flow rate increases. The amplitudes of M2, M3, M4, and M5 reduce by 63.44%, 82.96%, 65.97%, and 73.15%, respectively. This shows that the vibration intensity of M2-M5 is the largest at the small flow point. Moreover, the vibration intensity of M2-M5 at the highest efficiency point is the smallest. This phenomenon is consistent with the viewpoint of literature
54
. Vibration spectrums at M2-M5.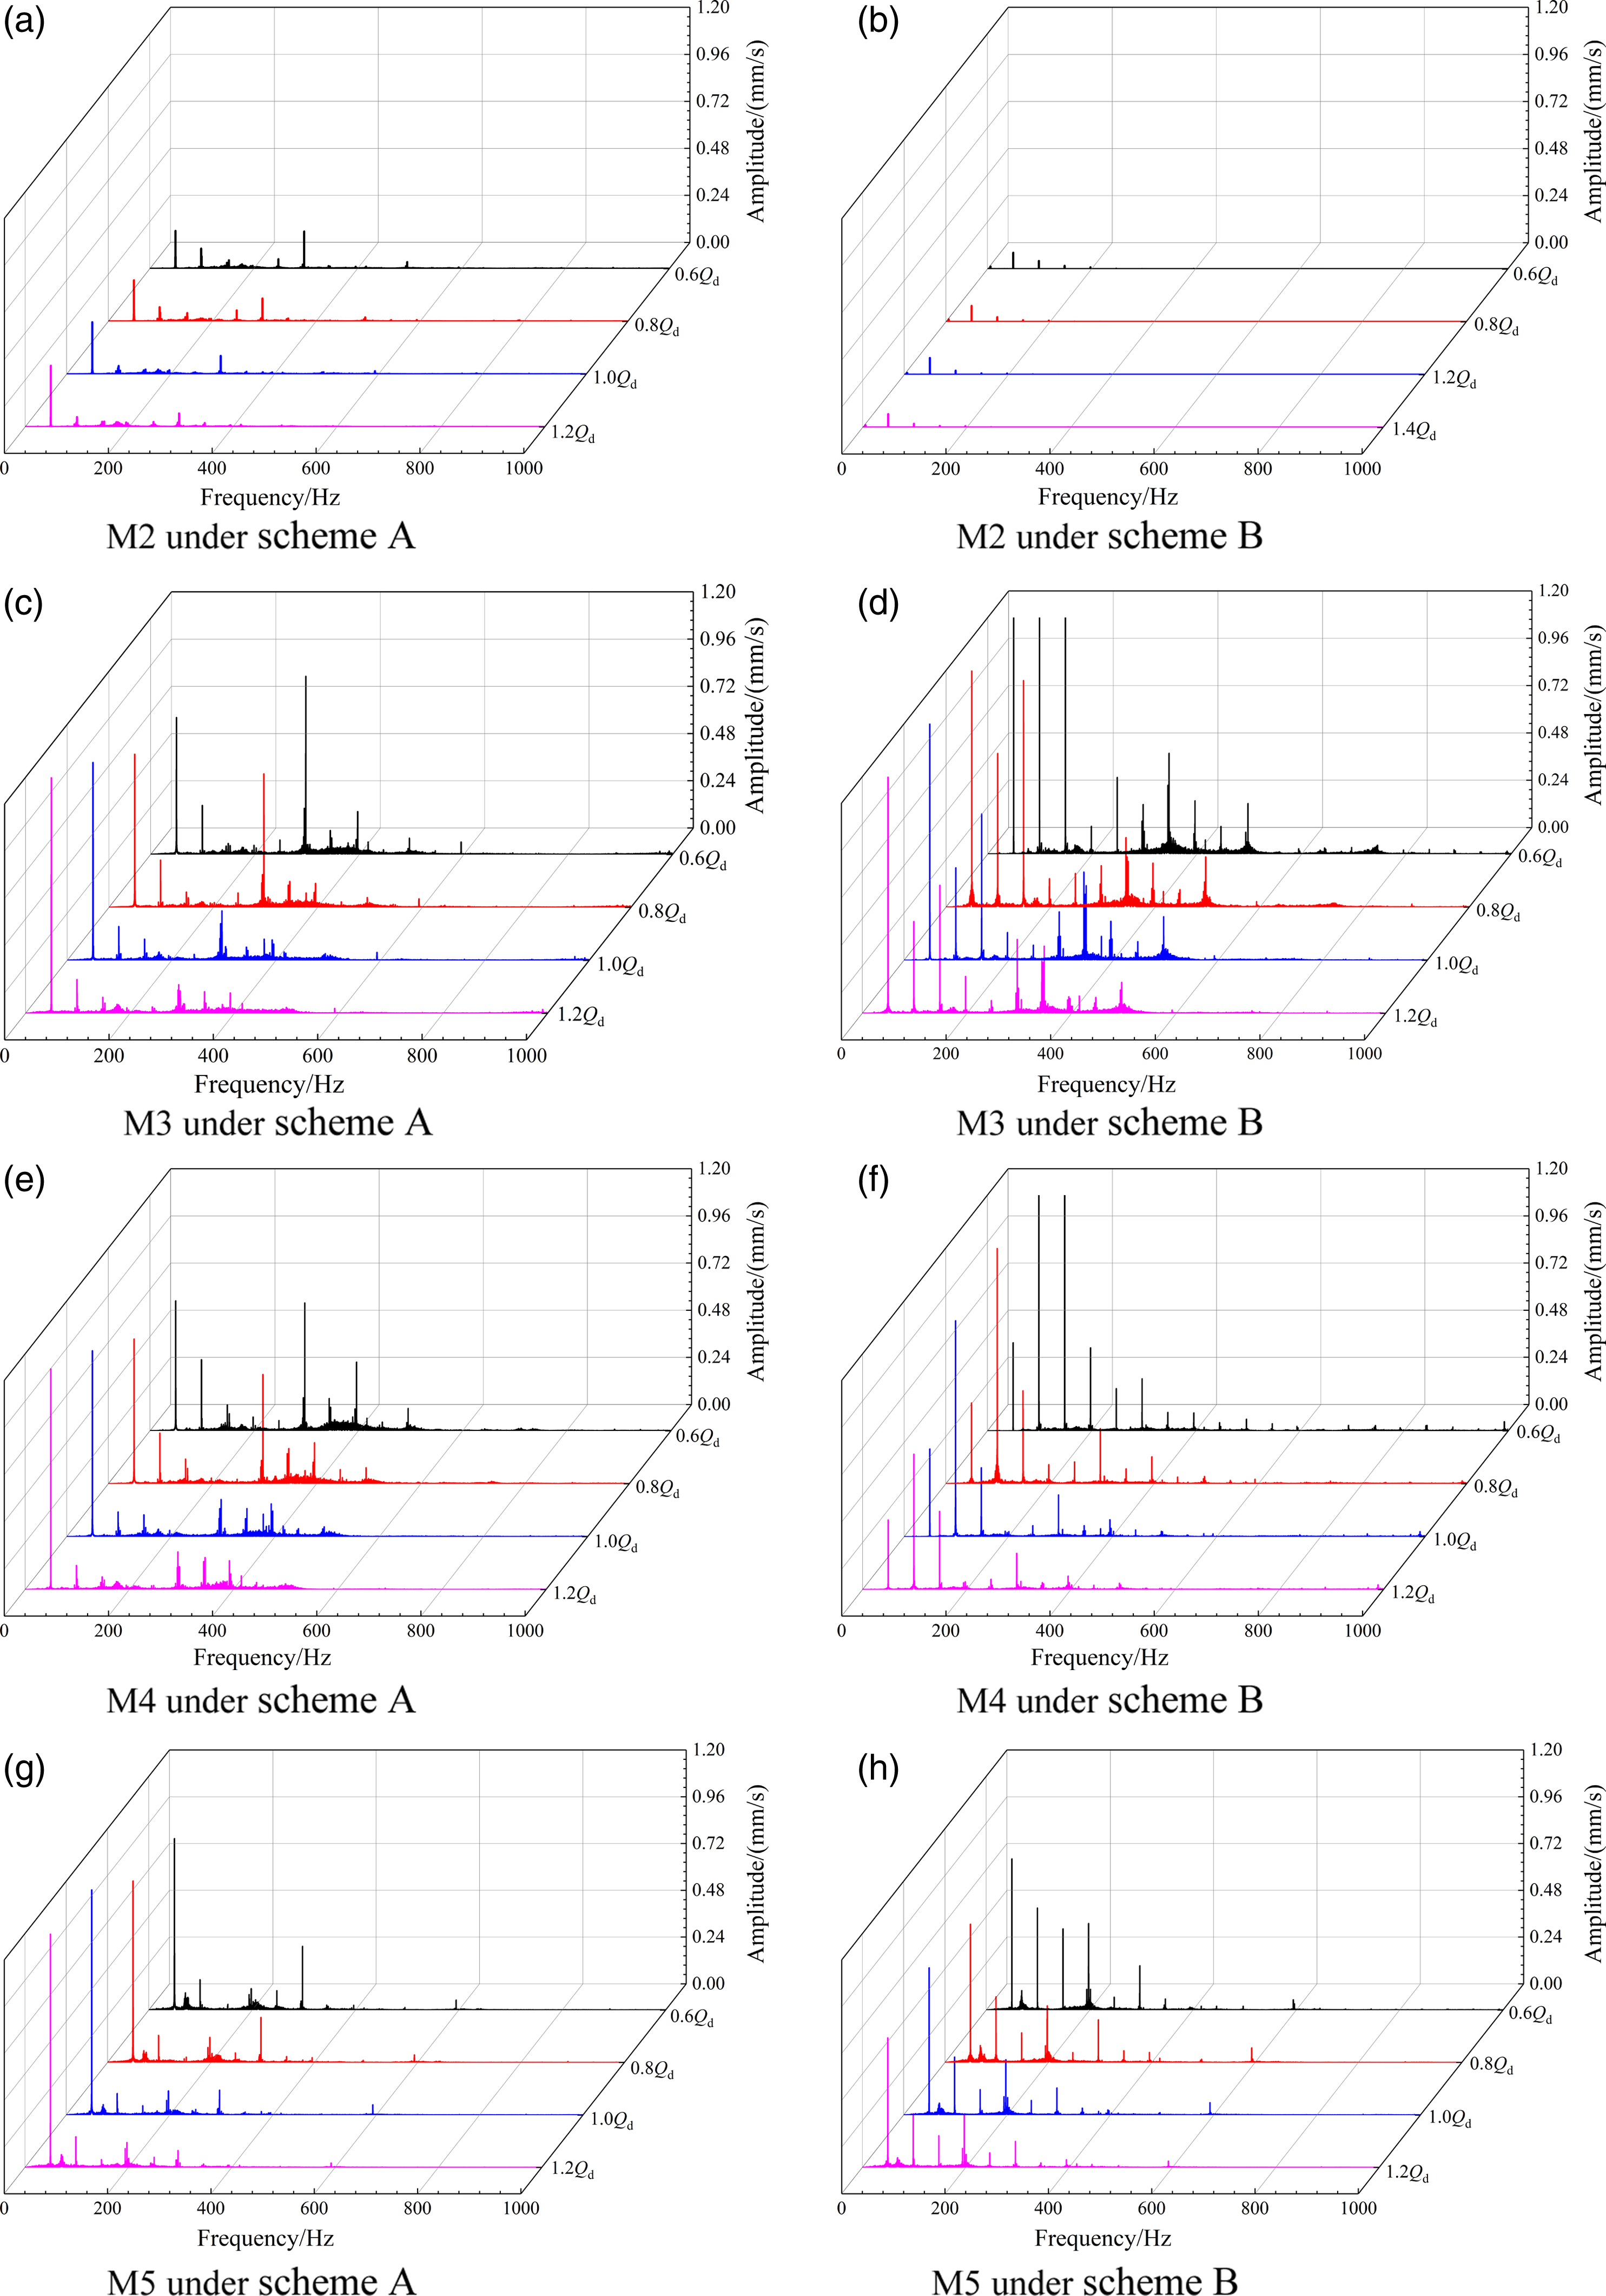
Under scheme B, the primary frequency of M2, M3, and M5 is 1APF, and the primary frequency of M4 is 2APF. As the flow rate increases, there is no obvious pattern in the amplitude change of the characteristic frequency. However, the amplitude variation of blade frequency still decreases with increasing of the flow rate.
Compared with scheme A, the vibration characteristics of M2-M5 have the following discoveries under scheme B. First, the vibration intensity of 1APF and 2APF at M2 decreases instead at different flow rates. The maximum amplitudes of 1APF and 2APF at M2 decrease by 78.01% and 59.71%, respectively. Second, the vibration amplitudes of 1APF, 2APF, and 3APF at M3 increase significantly at different flow rates. The maximum amplitudes of 1APF, 2APF, and 3APF at M2 increase by 1.67 times, 6.85 times, and 50.65 times, respectively. Third, the vibration amplitudes of 1APF, 2APF, and 3APF at M3 increases significantly at different flow rates. The maximum amplitudes of 1APF, 2APF, and 3APF at M3 increase by 1.67 times, 6.85 times, and 50.65 times, respectively. Fourthly, the vibration amplitudes of 2APF, 3APF at M4 increases remarkably at different flow rates. The maximum amplitudes of 2APF and 3APF at M4 increase by 3.71 times and 8.21 times, respectively. Then, the vibration amplitudes of 1APF at M5 decreases slightly. The maximum amplitudes of 1APF decrease by 11.81%. It is worth noting that the maximum change of the amplitude of the above measuring points at the characteristic frequency occurs at 0.6Qd. This may be due to the unstable flow of the pump under small flow, which intensifies the excitation effect of shaft combined misalignment.
From the above analysis, the shaft combined misalignment of the pump aggravates the vibration strength of the inlet flange and outlet flange. Besides, it weakens the vibration strength of the pump foot and pump casing. At present, there is no relevant literature to explain the causes of this phenomenon. It is mainly because that the inlet flange and outlet flange are the cantilever structure. The shaft combined comprehensive misalignment results in an increased load on the inlet and outlet flanges and a decreased load on the pump foot and pump casing. It leads the deformations of the inlet flange and outlet flange to add, and the deformation of the pump foot and pump casing to reduce. In the future, it is necessary to combine CFD and ANSYS to further analyze the vibration characteristics of the pump in the case of shafting misalignment, so as to find the specific reason.
One-Third vibration octave spectrums
Figure 11 compares the One-Third octave spectrums of vibration at M2-M5 under scheme A and scheme B. Under scheme A, the VL of M2-M5 is higher in the frequency band of 50 Hz and 315 Hz. It indicates that the vibration energy of each measurement point focuses around 1APF and 1BPF. As the flow rate increases, the VL of M2-M5 in the 50 Hz band gradually increases. The VL of M2-M5 in the 50 Hz band increase by 0.80%, 1.32%, 1.08%, and 0.39% at different flow rates. In addition, the VL of M2-M5 in the 315 Hz band gradually reduces with the flow rate increases. The VL of M2-M5 in the 315 Hz band reduce by 6.07%, 5.96%, 5.60%, and 5.94% at different flow rates. This indicates that the vibration energy of the dominant frequency at M2-M5 is the largest at the small flow point and the smallest at the highest efficiency point. This law is consistent with the law of the vibration spectrum analysis. Similarly, the reasons for this phenomenon are the same. One-Third octave spectrums of vibration at M2-M5.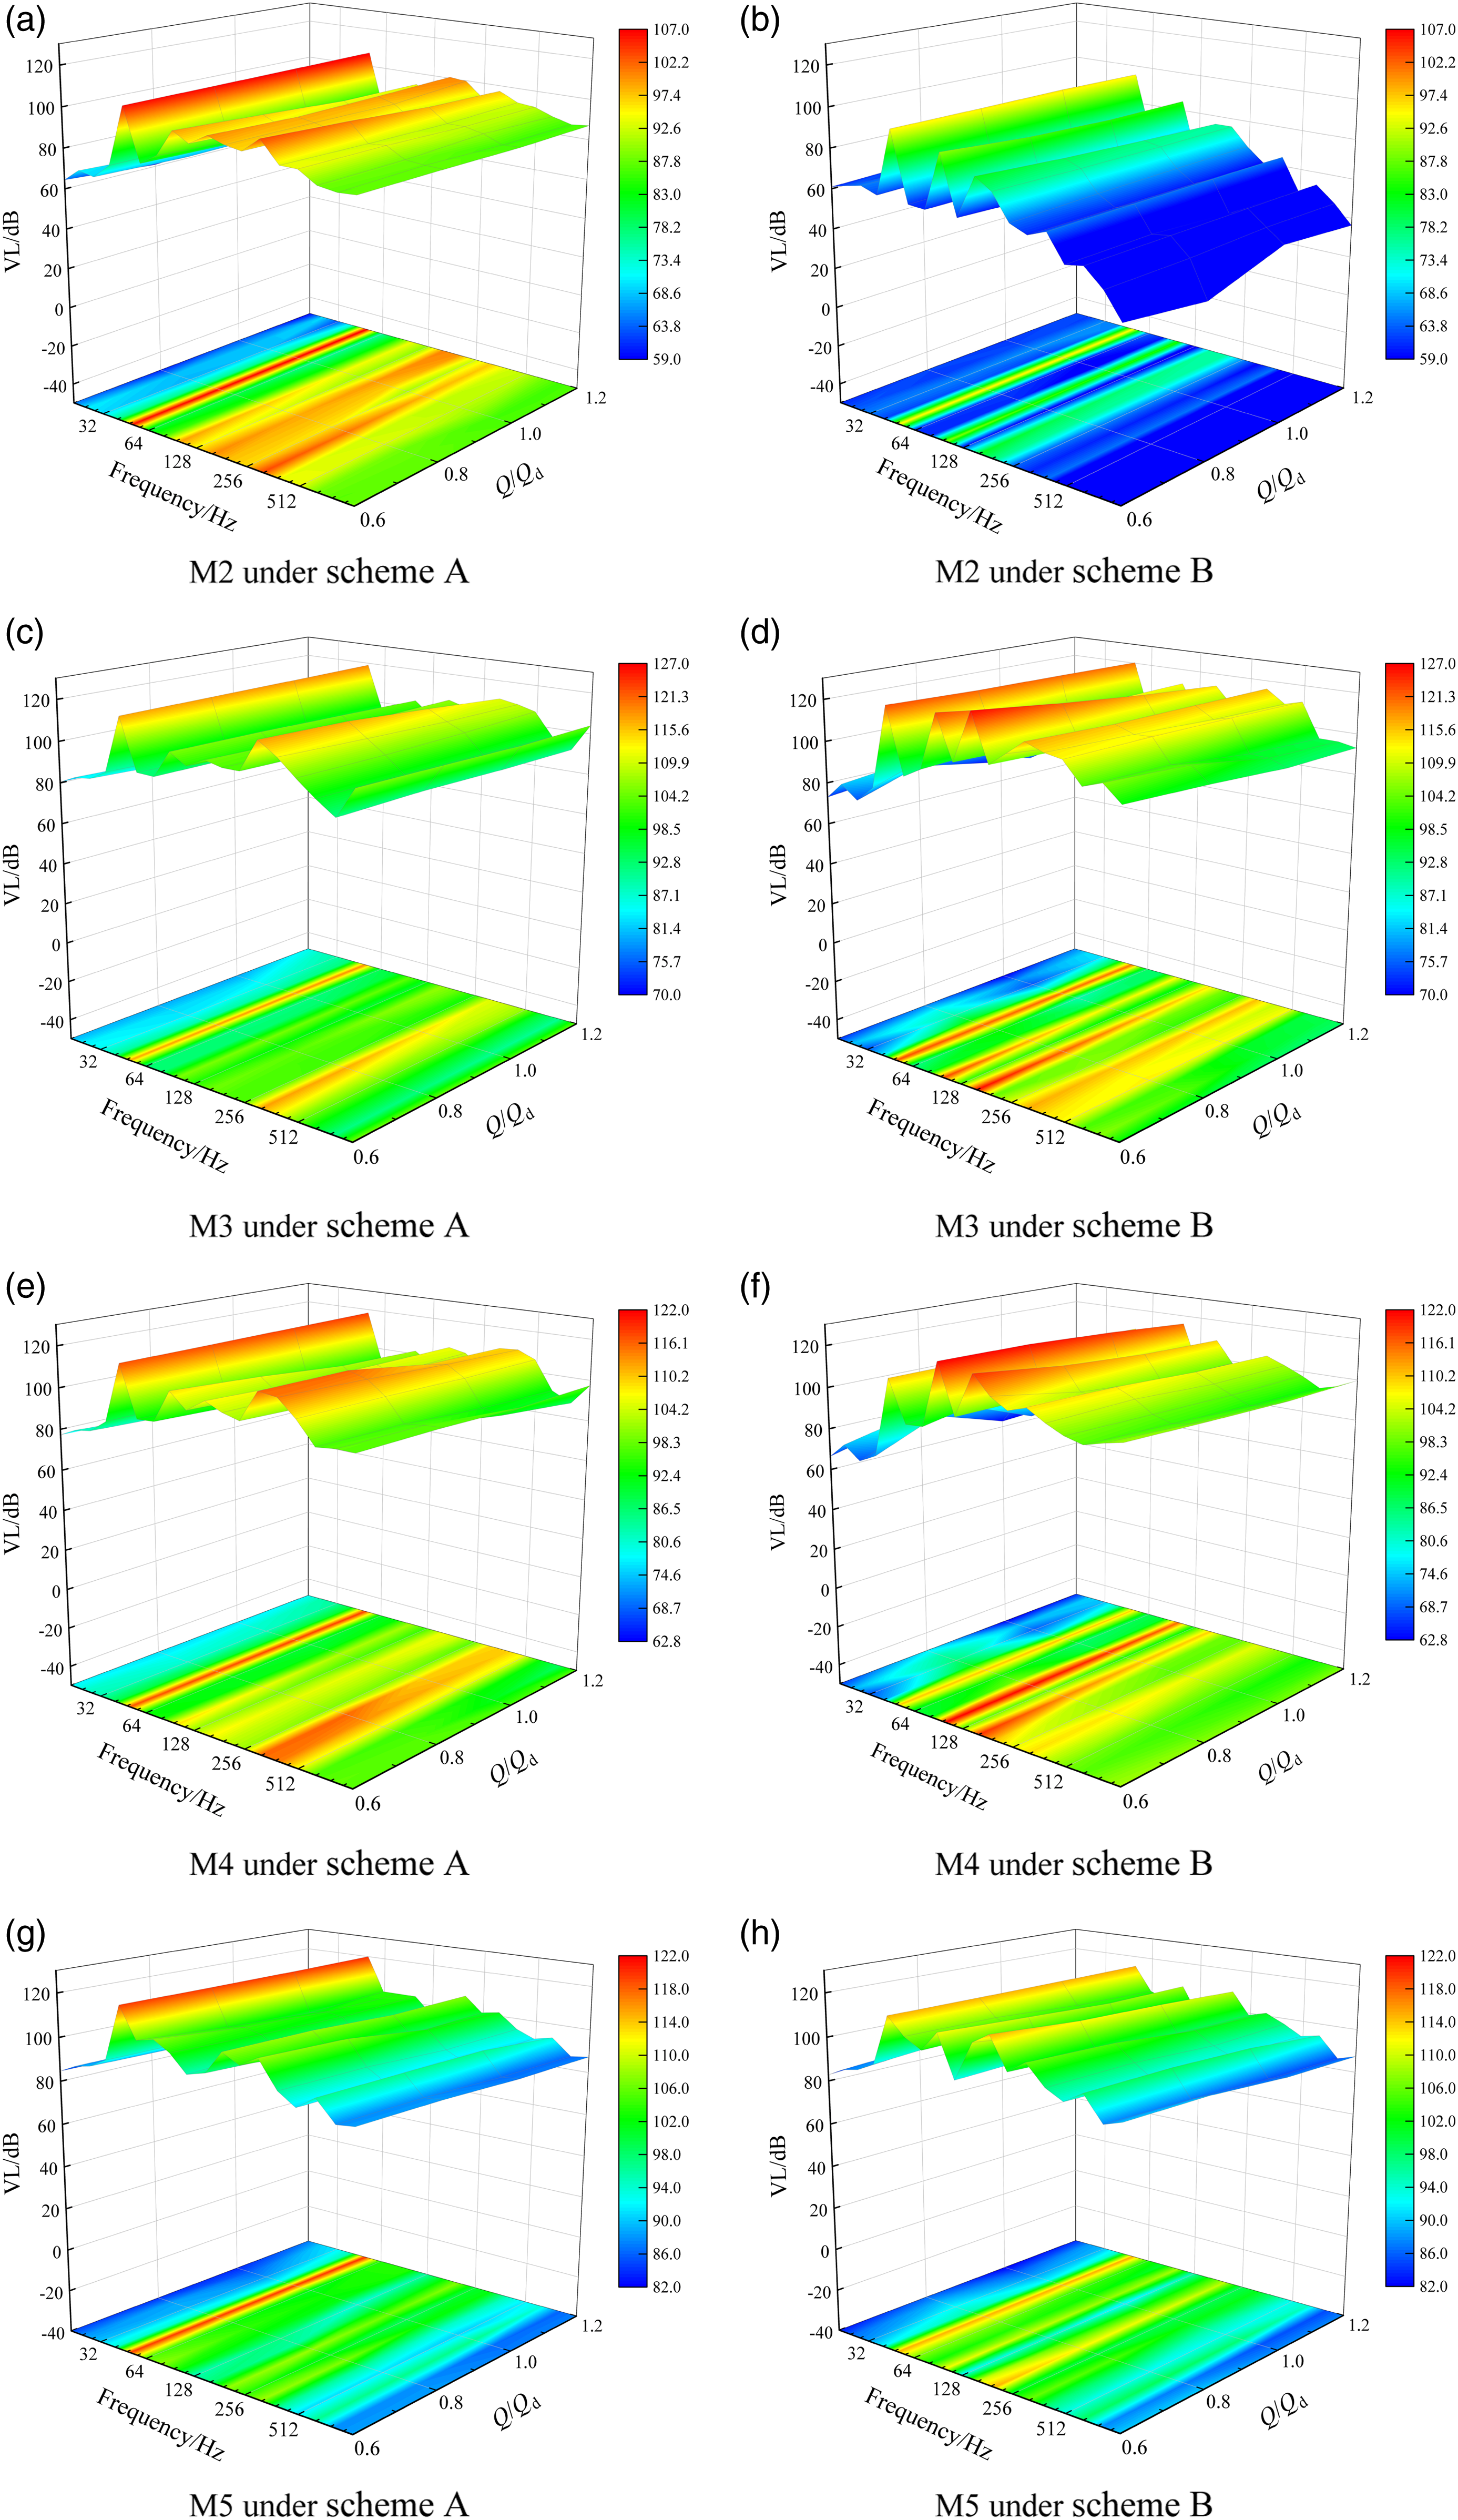
Under scheme B, the VL of M2-M5 is higher in the frequency band of 50 Hz, 100 Hz, and 160 Hz. It indicates that the vibration energy of M2-M5 around 1APF, 2APF, and 3APF. As the flow rate increases, there is also no obvious pattern in the VL change of the 50 Hz, 100 Hz, and 160 Hz band at M2-M5. This phenomenon is consistent with the appearance of the vibration spectrum analysis.
Compared with scheme A, the One-Third octave spectrums of vibration at M2-M5 have the following discoveries under scheme B. The VL of M2 in the 50 Hz, 100 Hz, and 160 Hz band decreased slightly at different flow rates. The maximum VL of M2 in the 50 Hz, 100 Hz, and 160 Hz band decrease by 11.11%, 11.17%, and 24.75%, respectively at different flow rates. The VL of M3 in the 50 Hz, 100 Hz, and 160 Hz band increases significantly. The maximum VL of M3 in the 50 Hz, 100 Hz, and 160 Hz band increase by 4.26%, 16.68%, and 20.74%, respectively, at different flow rates. The VL of M4 in the 100 Hz and 160 Hz band increases notably. The maximum VL of M4 in the 100 Hz and 160 Hz band increase by 16.19% and 11.08%, respectively, at different flow rates. Then, the VL of M5 in the 50 Hz band decreases slightly. The maximum VL of M5 in the 50 Hz band increase by 4.08% at different flow rates.
Overall vibration velocity level
Figure 12 compares the OAVL of M2-M5 under scheme A and scheme B. Under scheme A, as the flow rate increases, the OAVL of M2-M5 first decreases by 1.14%, 1.27%, 1.42%, and 0.95%, and then increases by 0.38%, 0.42%, 0.15%, and 0.11%. The smallest OAVL of M2-M5 is 108.96 dB, 120.24 dB, 119.85 dB, and 119.59 dB, respectively. And, the smallest OAVL of M2-M5 is at 1.0Qd. This law seems to be inconsistent with the amplitude variation law of the primary and secondary frequencies of the vibration spectrum. This may be because the interaction coupling of the internal flow excitation and the structure of the pump results in the OAVL of the pump at 1.0Qd being the smallest.
55
At different flow rates, the OAVL at M4 is less than that at M3 but larger than that at M5, and the total VL at M2 is the lowest. In addition, the OAVL error of M2-M5 is the largest under small flow rate, and it is the smallest at 1.0Qd. The maximum OAVL error of M2-M5 is 1.60%, 3.11%, 2.80%, and 2.21%, respectively, which occur at 0.6Qd. The minimum OAVL error of M2-M5 is 1.01%, 1.70%, 1.51, and 1.20%, respectively, which occur at 1.0Qd. Under scheme B, as the flow rate increases, the OAVL of M2-M5 decreases by 0.87%, 4.85%, 3.42, and 1.44%, respectively. The smallest is at 1.2Qd. And, the smallest OAVL of M2-M5 is 96.16 dB, 123.43 dB, 120.10 dB, and 117.58 dB, respectively. Compared with scheme A, the OAVL of M2-M5 have the following discoveries under scheme B. Among 0.6Qd and 1.2Qd, the OAVL of M2 decreases by 11.99%, 11.74%, 11.33%, and 12.08%, respectively; the OAVL of M3 increases by 6.52%, 3.86%, 3.31%, and 2.23%, respectively; the OAVL of M4 increases by 2.27%, 1.16%, 0.49%, and 0.05%, respectively; the OAVL of M5 decreases by 1.79%, 1.52%, 1.51%, and 1.19%, respectively. This Law also shows that shaft combined misalignment of the pump aggravates the vibration strength of the inlet flange and outlet flange, but it weakens the vibration strength of the pump foot and pump casing. In addition, the OAVL error of M2-M5 is the largest under small flow rate, and it is the smallest at 1.2Qd. The maximum OAVL error of M2-M5 is 0.95%, 3.50%, 3.30, and 1.81%, respectively, which occur at 0.6Qd. The minimum OAVL error of M2-M5 is 0.85%, 1.80%, 1.61, and 1.31%, respectively, which occur at 1.2Qd. Comparison diagram of OAVL.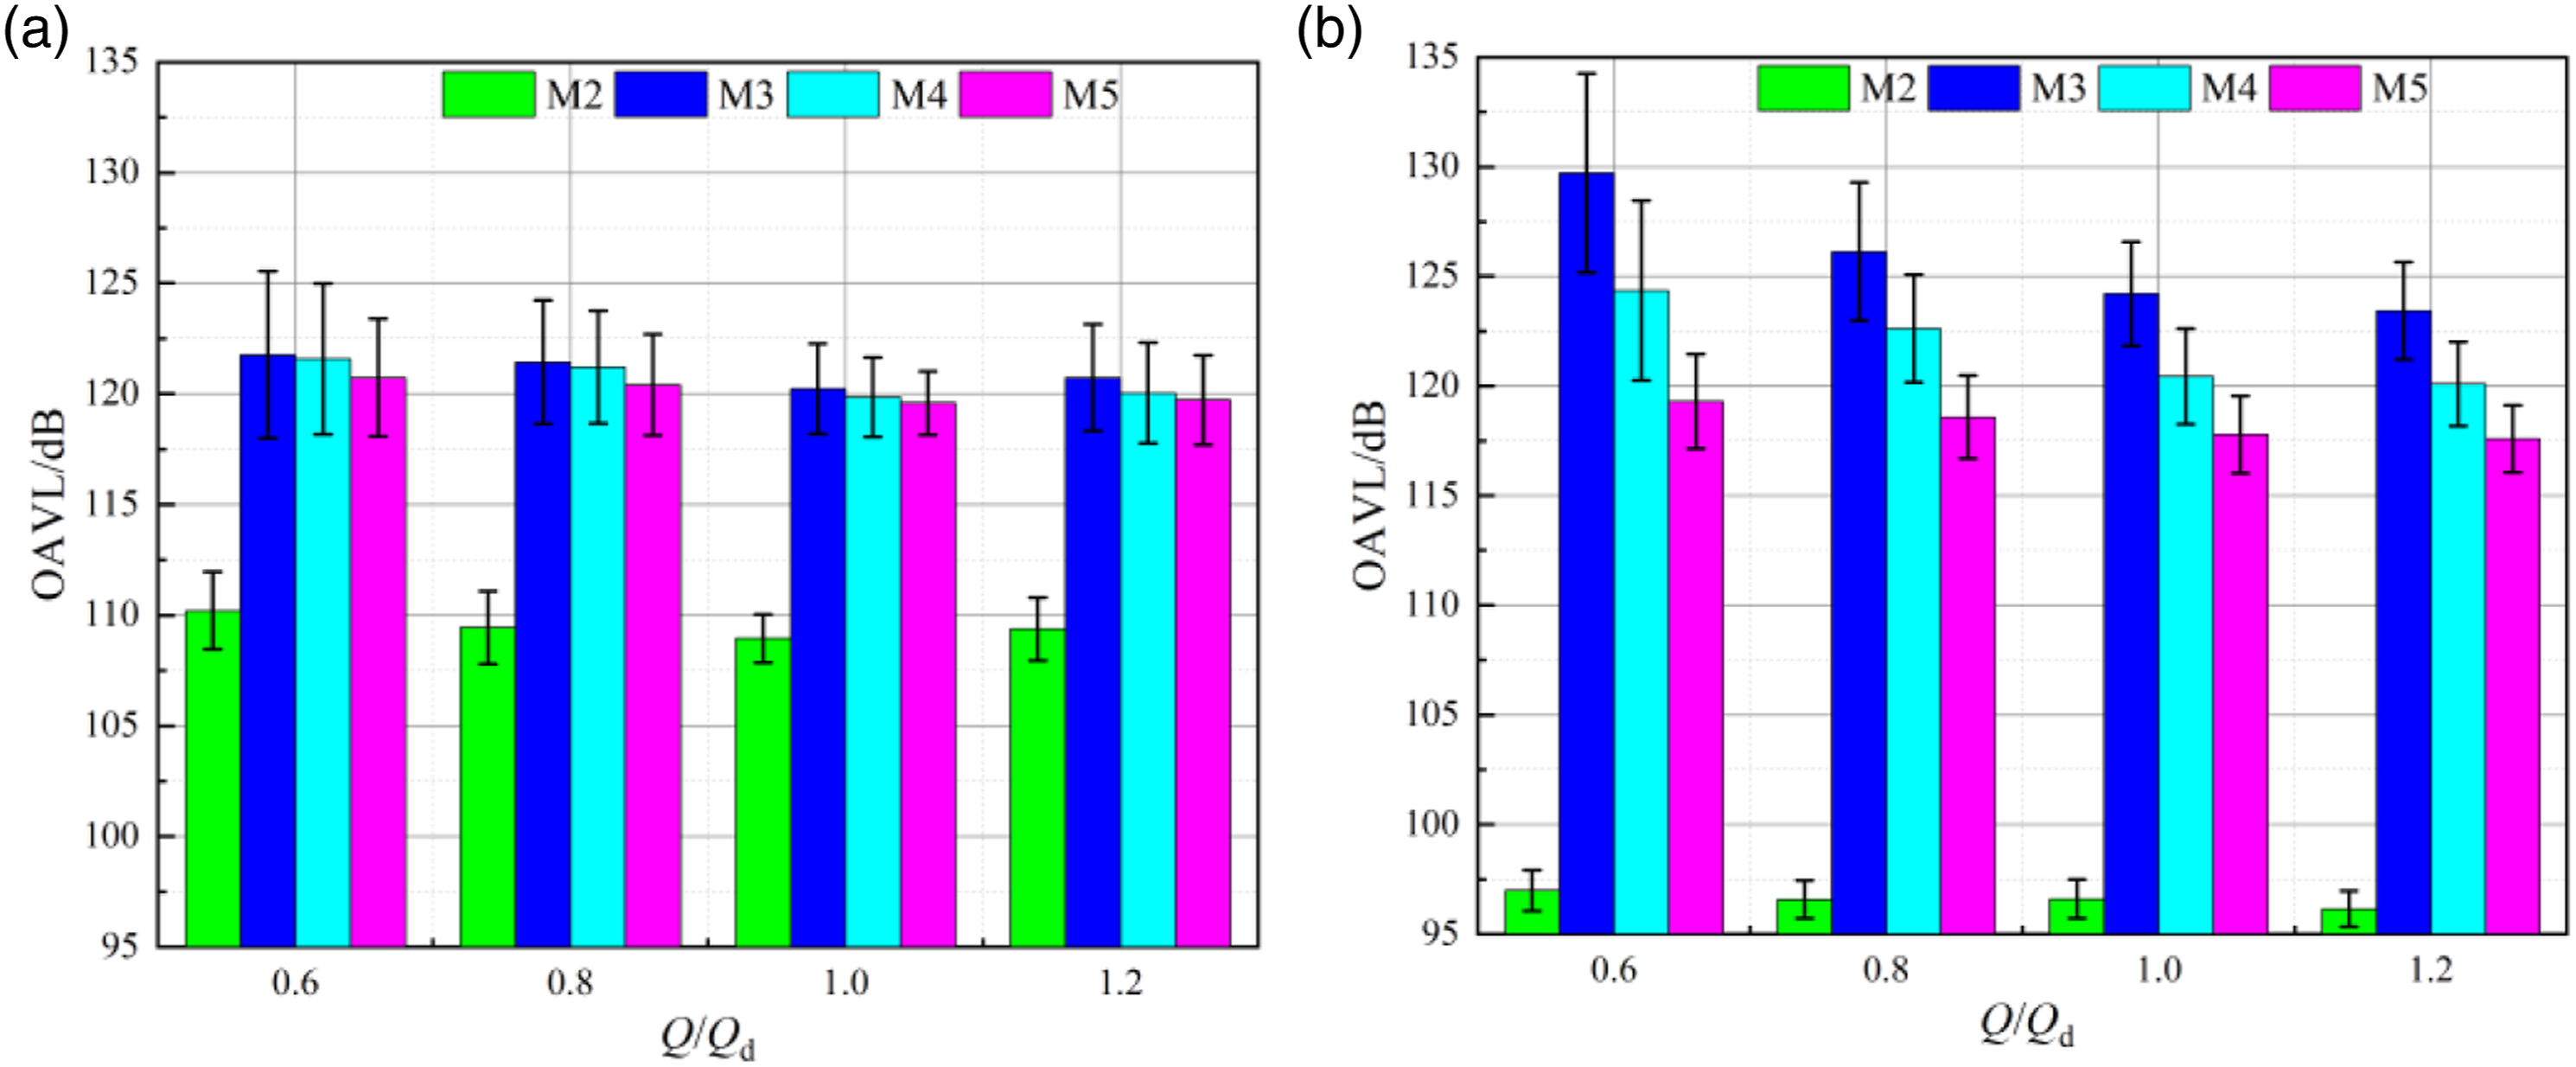
Noise characteristics at M6
Noise amplitude spectrums
Figure 13 compares the noise spectrums of M6 under scheme A and scheme B. Under scheme A, the characteristic frequencies of M6 are 1APF, 2APF, and 1BPF. It is primarily attributed to the unbalance and misalignment of the pump shaft system that inevitably exists under normal conditions,
48
which results in the generation of 1APF and 2APF. As the flow rate increases, the amplitude at 1APF and 2APF gradually increases, and the amplitude at 1BPF gradually decreases. The amplitude of 1APF and 2APF increases by 2.8% and 0.8%, and the amplitude of 1BPF decreases by 3.88%. Under scheme B, the characteristic frequencies of M6 are 1APF, 2APF, 3APF, and 1BPF, where 1APF and 2APF are dominant. Compared with scheme A, the amplitude of 1APF and 2APF under scheme B is significantly higher at different flow rates. Among 0.6Qd to 1.2Qd, the amplitude of 1APF at M6 increases by 12.41%, 13.82%, 13.58%, and 3.23%, respectively, and the amplitude of 2APF at M6 increases by 2.24%, 1.96%, 1.56%, and 1.80%, respectively. It is because that the shaft combined misalignment exacerbates the unstable flow of the inflow, which leads to an increase in noise sound pressure.56,57 In addition, it can be found that the influence of shafting comprehensive misalignment on noise seems to be more obvious on 1APF in this study. This is consistent with the previous vibration law of M3, which shows that vibration and noise have a certain correlation. Comparison diagram of noise spectrums.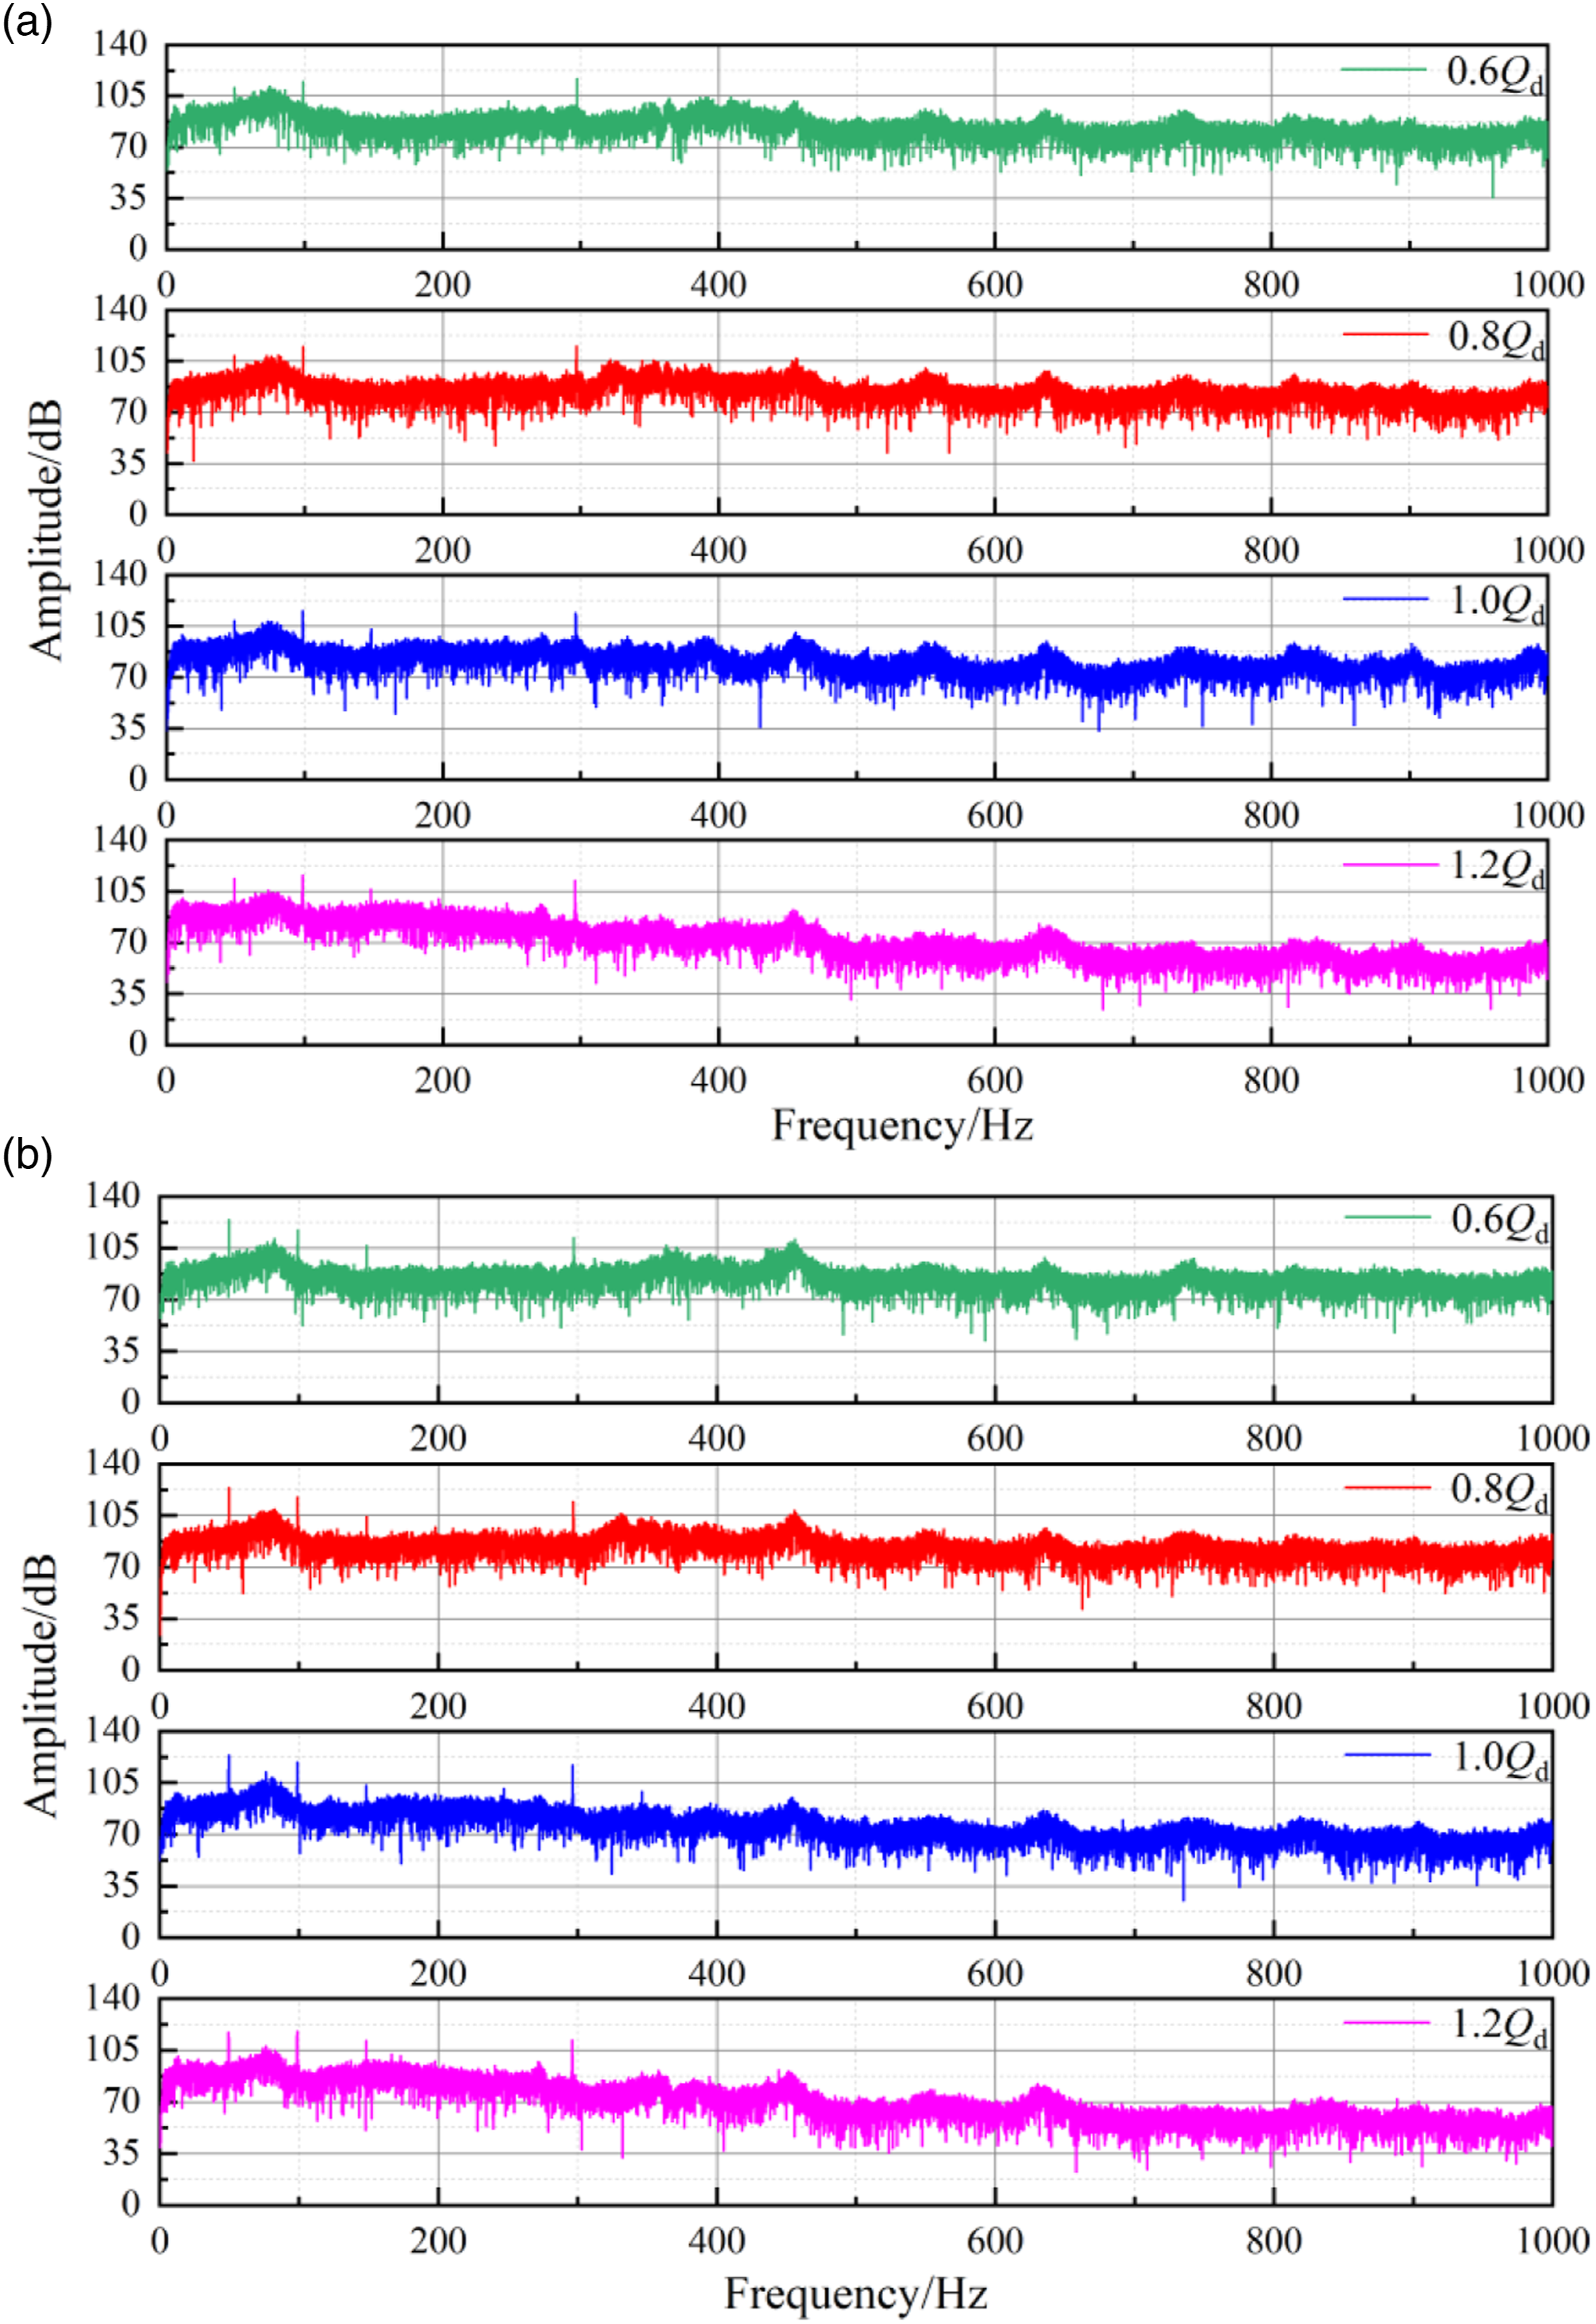
One-Third octave spectrums of noise
Figure 14 compares the One-Third octave spectrums of noise at M6 under scheme A and scheme B. Under scheme A, the noise distribution pattern of One-Third octave spectrums at M6 mainly concentrated in the 50Hz–100 Hz and 250Hz–500 Hz band. The characteristic frequencies of this pump outlet noise spectrum are 1APF, 2APF, and 1BPF in the same pattern, which shows obvious low-frequency characteristics. As the flow rate increases, the SPL of M6 in the 50 Hz and 100 Hz band increases decreases by 2.40% and 2.56% then increases by 0.83% and 1.21%. The SPL of M6 in the 315 Hz band decreases by 4.79% with the flow rate increasing, and the smallest SPL of M6 in the 315 Hz band is at 1.2Qd. Besides, among 0.6Qd, 0.8Qd, 1.0Qd, and 1.2Qd, the largest value is at 0.6Qd. This is consistent with the conclusion of literature 41, indicating that the pump has the lowest noise in small meteors.
48
Under scheme B, the noise distribution pattern of One-Third octave spectrums at M6 mainly also concentrated in the 50Hz–100 Hz and 250Hz–500 Hz band. As the flow rate increases, there is also no obvious pattern in the SPL change of the 50 Hz, 100 Hz, and 160 Hz band at M6. Compared with scheme A, the SPL of M6 increases in the frequency band of 50–100 Hz under scheme B; the SPL of M6 in the 50 Hz band increased 5.01%, 7.40%, 6.89%, and 2.19%, respectively, at different flow rates; the SPL of M6 in the 100 Hz band increased 0.55%, 1.21%, 2.56%, and 0.42%, respectively, at different flow rates. This is consistent with the previous conclusion of One-Third vibration octave spectrum analysis for M3. It also indicates that there is a certain positive correlation between vibration and noise. Comparison diagram of One-Third noise octave spectrums.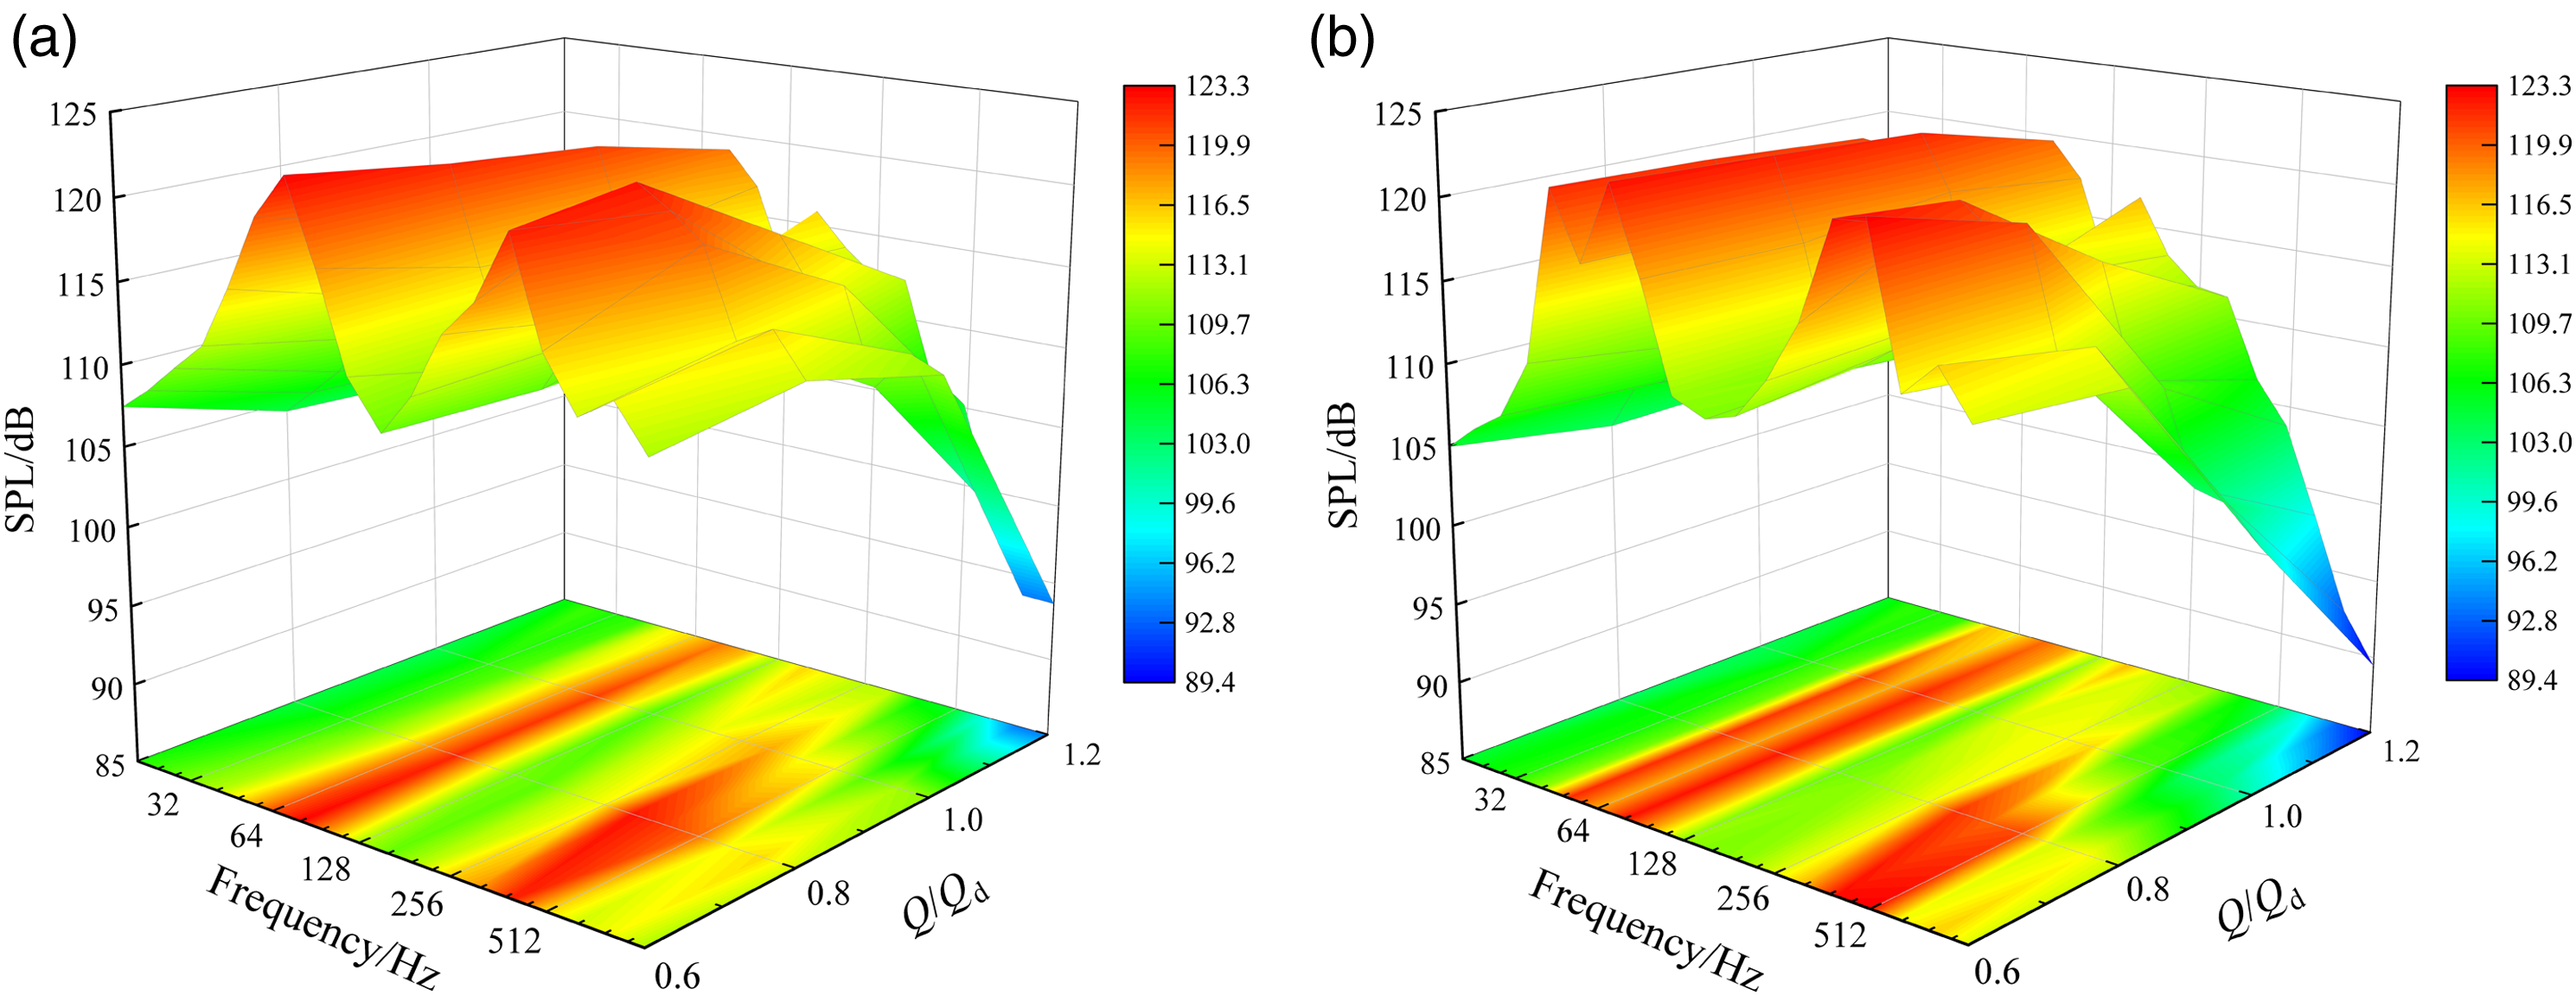
Overall sound pressure level
Figure 15 compares the OASPL of M6 under scheme A and scheme B. As the flow rate increases, the OASPL of M6 gradually reduces under scheme A and scheme B. It indicates that the OASPL of M6 at the small flow rate is the largest, and the OASPL of M6 at the maximum efficiency point is the smallest. It is mainly due to the intensification of the unsteady flow in the pump under the low flow rate will appear backflow, secondary flow, axial vortex, and other complex flow,44,57 which intensifies the generation of pump noise. In addition, the OASPL error of M6 is the largest under small flow rate, and it is the smallest at 1.2Qd. The maximum OASPL error of M6 is 1.90%, which occurs at 0.6Qd. The minimum OASPL error of M6 is 0.90%, which occurs at 1.2Qd. Compared with under scheme A, the OASPL of M6 increases under scheme A. From 0.6Qd to 1.2Qd, the OASPL of M6 increases by 0.42%, 0.29%, 0.44%, and 0.24%, respectively. It indicates that the shaft combined misalignment and internal flow coupling further aggravate the pump outlet noise. In addition, the OASPL error of M6 is the largest under small flow rate, and it is the smallest at 1.2Qd. The maximum OASPL error of M6 is 2.74%, which occurs at 0.6Qd. The minimum OASPL error of M6 is 1.38%, which occurs at 1.2Qd. Comparison diagram of OASPL.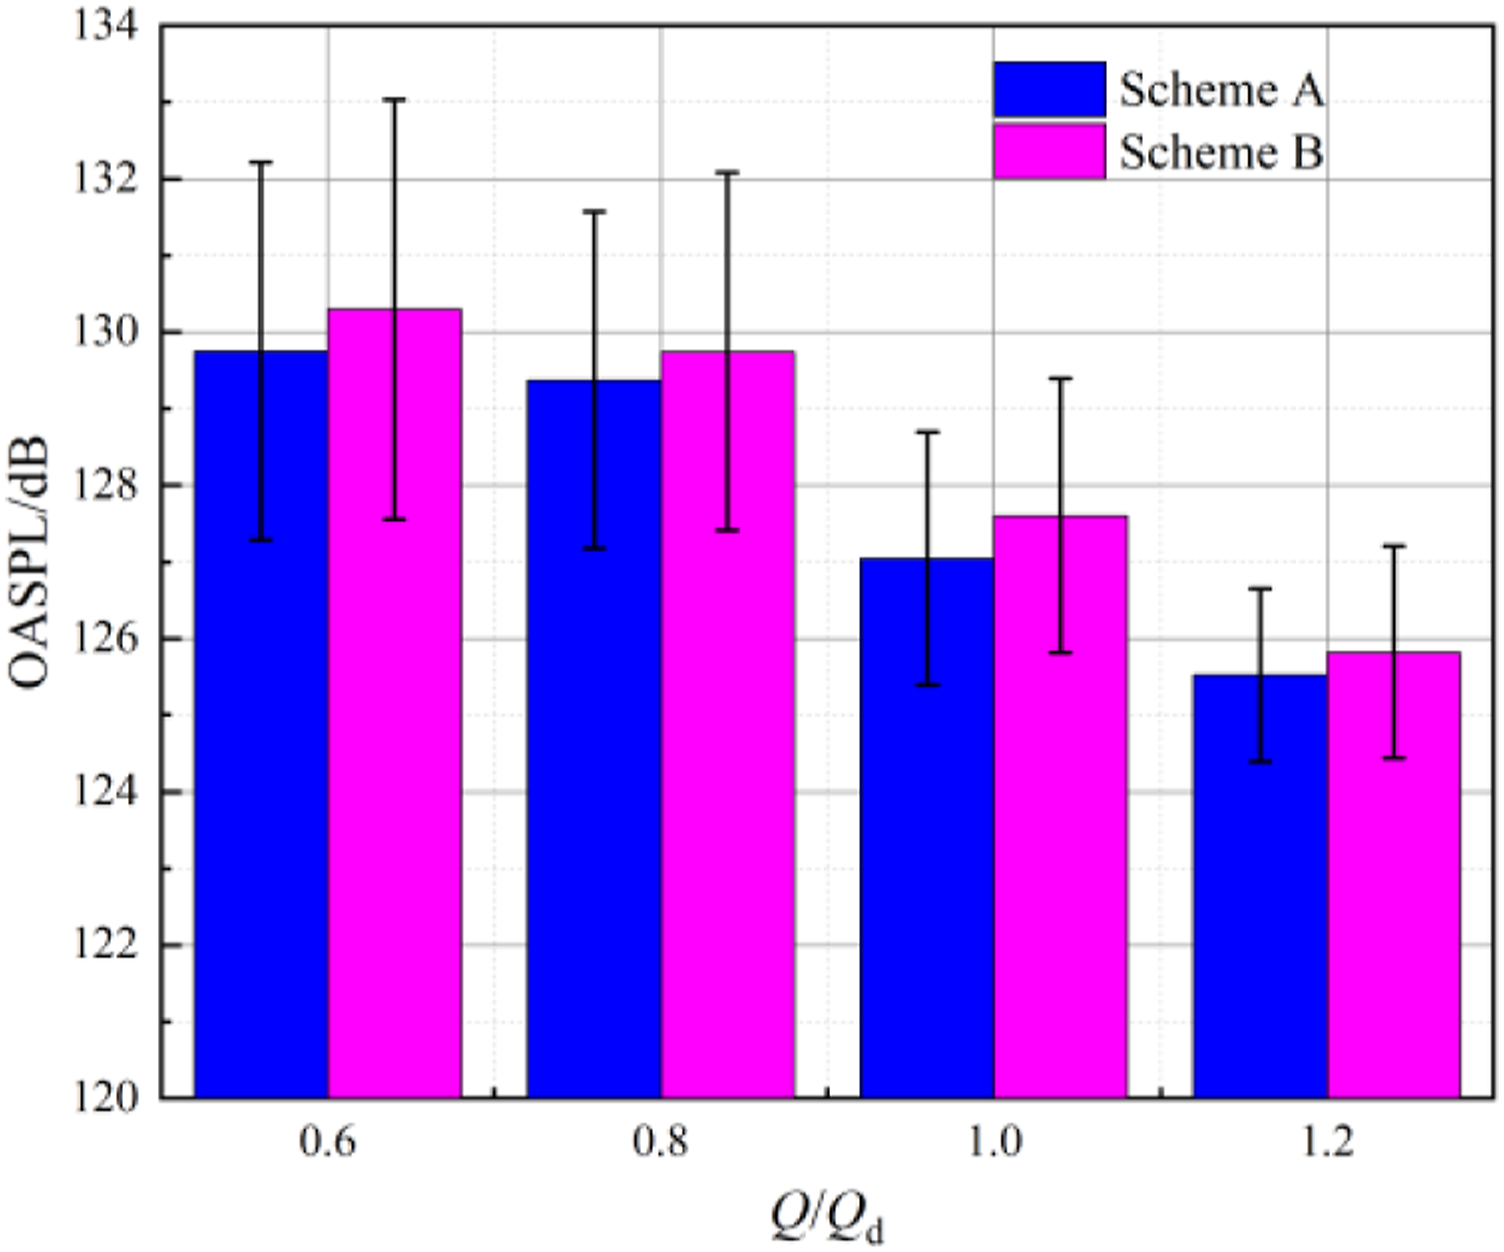
Conclusions
The vibration and noise of a marine centrifugal pump under normal conditions and shaft combined misalignment conditions are experimentally measured and analyzed. Compared with normal conditions, the vibration and noise characteristics under shaft combined misalignment conditions have the following conclusions. (1) The level of M1 vibration at 1APF and 2APF within a marine centrifugal pump significant increases and is directly linked with the pump flow rate. As the flow rate increases, the maximum amplitudes of 1APF in the X and Y directions at M1 increase by 35.06% and 24.04%, the maximum amplitudes of 2APF in the X and Y directions at M1 increase by 2.61 times and 1.77 times. (2) The shape of the rotor axis orbit changes from ellipse to “8,” and the long axis of the rotor axis orbit becomes larger. It indicates that the shaft combined misalignment intensifies the vibration of the pump shaft system. Moreover, the shape of the rotor axis orbit at M1 is related to the running condition. As the flow rate decreases, the shape of an “8” of the rotor axis orbit becomes progressively flatter. (3) The primary frequency of vibration signals is the installation position of the sensor. The primary frequency of M2, M3, and M5 is 1APF, and the primary frequency of M5 is 2APF. Moreover, the vibration energy of M2-M5 is also related to the running condition, and the VL of M2-M5 is higher in the frequency band of 50 Hz, 100 Hz, and 160 Hz. (4) Among 0.6Qd and 1.2Qd, the maximum OAVL of M2 and M5 decreases by 12.03% and 1.79%, and the maximum OAVL of M3 and M4 increases by 6.52% and 2.27%. It indicates that the shaft combined misalignment of the pump aggravates the vibration strength of the inlet flange and outlet flange, but it weakens the vibration strength of the pump foot and pump casing. (5) The frequency domain amplitude of M6 increases significantly in 1APF and 2APF, and the maximum increases are 12.41% and 2.24% at different flow rates. The SPL of M6 increases significantly in the 50 Hz band, and the maximum increases are 7.40% and1.21%. In addition, the OASPL of M6 increases by 0.42%, 0.29%, 0.44%, and 0.24% at different flow rates. It indicates that the shaft combined misalignment and internal flow coupling further aggravate the pump outlet noise. The above discoveries provide some references to the diagnosis of shaft combined misalignment fault that occurred for the marine pump.
Although the misalignment vibration and noise characteristics of marine pump shafting are experimentally studied in this paper, there are still some deficiencies. The FFT and octave analysis methods and conclusions need to be further identified in other pumps. Due to the limitations of the experiment, the vibration and noise characteristics caused by the coupling of hydraulic and structural loads cannot be fully explained under shaft combined misalignment. And, this paper has not been involved in the time-frequency spectrum analysis and fault diagnosis of vibration and noise signals. In the future, it is necessary to combine CFD and ANSYS to further analyze the vibration characteristics of the pump in the case of the shaft combined misalignment, so as to find the specific reason. Time-frequency spectrum analysis methods should be applied to analyze the vibration and noise of the marine pump under shaft combined misalignment conditions, such as wavelet analysis and short-time Fourier transform. In addition, the complex’s vibration and noise signals under shaft combined misalignment conditions can be separated into different spatial and temporal scale modal components at different resolutions by the multi-resolution dynamic mode decomposition (DMD) method. Then, the instantaneous frequency and energy characteristics of each mode are obtained through time-frequency distribution. It is further to find out the vibration and noise characteristics under the condition of shaft combination misalignment. Last, it is also necessary to study the shaft combined misalignment fault diagnosis method for the marine pumps, such as Support Vector Machines (SVMs) and neural networks.
Footnotes
Acknowledgments
The authors gratefully acknowledge the support from the National Natural Science Foundation of China and Postdoctoral Science Foundation of China. In addition, the authors thank Mr Zhu Jiancheng in the National Research Center of Pumps and Pumping System Engineering and Technology of Jiangsu University who help carry out experiments.
Declaration of conflicting interests
The author(s) declared no potential conflicts of interest with respect to the research, authorship, and/or publication of this article.
Funding
The author(s) disclosed receipt of the following financial support for the research, authorship, and/or publication of this article: National Natural Science Foundation of China (Grant No. 52179084), Postdoctoral Science Foundation of China (Grant No. 2021M692709) and Priority Academic Program Development of Jiangsu Higher Education Institutions (PAPD).